Re: [Ovmsdev] OVMS Poller module/singleton

Michael, (taking this back to the list, as other developers may have helpful ideas or suggestions) from a first check, your new patch (PR #1008) won't help for vehicles that don't use the poller, like the generic DBC vehicle or the Fiat 500 (plus possibly non-public third party vehicles). As the poller is normally compiled in, these would need a run time switch to re-enable the vehicle task, or more suitably default into that configuration and switch to the poller task only when the poller gets initialized. How about moving the task back into the vehicle class, but keeping your task message extensions while doing so, and adding a way for the poller to hook into the task? The dedicated vehicle task is an essential part of the vehicle framework, but I do remember some occasions where a general way to pass custom messages to the vehicle task would have been helpful to use the task for more than CAN processing. If the poller shall become avaible as a separate service that can be used without any vehicle instance (currently not a defined use case), the construct of a CAN processor task that can be extended for custom messages (or a message processor task that can subscribe to CAN frames) could be factored out into a dedicated class or template. The poller could then create his own instance of that class, if it cannot hook into an existing one. Btw, in case you're not aware of this, FreeRTOS also provides queue sets (https://www.freertos.org/RTOS-queue-sets.html). We haven't used them in the OVMS yet, but they could be useful, especially if message unions become large or tasks shall be able to dynamically subscribe to different message sources. Regards, Michael Am 30.04.24 um 01:20 schrieb Michael Geddes:
It might be worth reverting, but, I've got a patch suggestion that I'll push up which will let me know if I understand everything and which might provide a solution.
If this isn't going to work then revert. (P/R coming)
While the poller was still a part of the vehicle class it was probably still all ok. The poller had taken over what I assume you are talking about as the vehicle task. A call-back fromthe poller was calling IncomingPollRxFrame which was then coming from the (now) poller task (is that correct?)
While we have OVMS_COMP_POLLER config defined, we could just use the poller task to provide the IncomingPollRxFrame call-back from the poller (was vehicle?) task.
The problem is when OVMS_COMP_POLLER is undefined, we need an alternate (maybe we could use the 'Event' loop then) which is when I hacked that bad solution.
//.ichael
I was thinking though that because everything is being queued we could divert some calls into the car
On Mon, 29 Apr 2024, 18:58 Michael Balzer, <dexter@expeedo.de> wrote:
Michael,
I've found a severe design flaw with your poller change. Sorry, I should have seen that before, and shouldn't have merged this.
You have moved the standard CAN frame processing from the vehicle task into the CAN task by changing the vehicle from a CAN listener to a CAN callback processor. That will break all kind of things, vehicles like the Twizy, Smart and many others rely on frame processing being done in the dedicated vehicle task.
This especially induces issues regarding CAN processing capacity, as the vehicles rely on having a separate context and not needing to decouple complex processing of incoming frames. So this will degrade the CAN processing performance seriously in many cases, where additional steps involving file or network I/O need to be done.
So this needs to be changed back.
I assumed you introduced a new dedicated poller task but kept the vehicle task intact. From your naming (OvmsVehicle::IncomingPollRxFrame), it seems you misinterpreted the vehicle task's purpose as only being used for polling.
I assume this isn't a small change…? If so we should revert the poller merge, to avoid having a defunctional edge build state until the fix.
Secondly: logging is generally expensive regardless of the log level control and log channels enabled. Any log message needs to be queued to the log system, so involves a lock and a potential wait state (for the queue) & resulting context switch (= minimum delay of 10 ms). Therefore, logging must be avoided as far as possible in any time critical context, and is forbidden under some circumstances, e.g. in a timer callback (see FreeRTOS docs on this). The log system load multiplies with connected web clients or enabled file logging and enabled debug / verbose level logging -- that quickly becomes too much, usually triggering the task watchdog.
Your logging of nearly all bus events passing to/from the poller (especially the log entry in Queue_PollerFrame) becomes an issue on any vehicle that has high frequency running process data frames on the bus, like the Twizy or Smart. As a counter measure, I've just added a runtime control for all the poller's verbose logging (by default now off), and changed some debug level logs to verbose. Not sure if I've catched all that may need to be silenced by default. Please check all your log calls and place them under the new "trace" control flag wherever appropriate.
This won't help avoiding issues with process data frame buses though.
Shall I revert the poller merge for now?
Regards, Michael
Am 29.04.24 um 06:18 schrieb Michael Geddes:
Btw I included the log changes in the p/r which is a few small commits for the poller.
//.
On Mon, 29 Apr 2024, 07:20 Michael Geddes, <frog@bunyip.wheelycreek.net> wrote:
Hey Michael, I've got to work now (it's Monday), but I suspect those 'giving up' are from unsolicited messages on the bus. I can re-order things so that the message will likely be 'dropped (no poll entry)' rather than the time-out message. And make it a verbose log.
//.ichael
On Mon, 29 Apr 2024 at 00:25, Michael Balzer <dexter@expeedo.de> wrote:
Michael,
forwarding the Twizy logs to you directly, as they contain the user location.
He has just verified it's the new version, he says the module stops responding as soon as he turns on the Twizy.
His description of his actions is a bit ambiguous, and it seems he didn't enable logging to the file persistently.
According to the server, these were the version boot times:
2024-04-28 15:30:56 0 3.3.004-32-g125e0841/ota_0/edge (build idf v3.3.4-849-g6e214dc335 Apr 26 2024 19:16:50) 2024-04-28 16:21:08 0 3.3.004-32-g125e0841/ota_0/edge (build idf v3.3.4-849-g6e214dc335 Apr 26 2024 19:16:50) 2024-04-28 16:38:33 0 3.3.004-63-gf3595561/ota_1/edge (build idf v3.3.4-849-g6e214dc335 Apr 27 2024 07:44:50) 2024-04-28 16:40:57 0 3.3.004-63-gf3595561/ota_1/edge (build idf v3.3.4-849-g6e214dc335 Apr 27 2024 07:44:50) 2024-04-28 16:43:14 0 3.3.004-63-gf3595561/ota_1/edge (build idf v3.3.4-849-g6e214dc335 Apr 27 2024 07:44:50) 2024-04-28 16:46:39 0 3.3.004-63-gf3595561/ota_1/edge (build idf v3.3.4-849-g6e214dc335 Apr 27 2024 07:44:50) 2024-04-28 16:54:44 0 3.3.004-32-g125e0841/ota_0/edge (build idf v3.3.4-849-g6e214dc335 Apr 26 2024 19:16:50)
Attached is also his crash debug log -- a2ll doesn't tell much about what happened, but maybe you get an idea from this.
After the boot at 16:46, there are immediately lots of these messages:
2024-04-28 16:46:33.792 CEST D (39042) vehicle-poll: Poller: Queue PollerFrame() 2024-04-28 16:46:33.792 CEST D (39042) vehicle-poll: [1]Poller: Incoming - giving up
Regards, Michael
Am 28.04.24 um 16:44 schrieb Michael Geddes:
Ah. OK.
I could try to fix the vin thing using the new way of doing it and get rid of a semaphore? It would at least identify the problem possibly?
Michael
On Sun, 28 Apr 2024, 22:32 Michael Balzer via OvmsDev, <ovmsdev@lists.openvehicles.com> wrote:
Not sure if that's the problem, but I've found a different behaviour with the new PollSetState() implementation.
The old version only did anything if the new state actually was different from the previous one. The Twizy relies on this behaviour, calling PollSetState() from the per second ticker (see OvmsVehicleRenaultTwizy::ObdTicker1).
The new implementation apparently always sends the PollState command to the task, and that in turn always at least locks the poller mutex. Not sure if/how that could cause the observed issues, but it definitely adds quite some (unnecessary?) lock/unlock operations.
Am 28.04.24 um 16:05 schrieb Michael Balzer via OvmsDev:
The Twizy uses the poller to query the VIN (once) and DTCs (every 10 seconds while driving), see rt_obd2.cpp.
It also has its own version of the OBD single request (OvmsVehicleRenaultTwizy::ObdRequest), which was the precursor for the generalized version. This is used by custom/user Twizy plugins and scripts to access ECU internals.
The Twizy doesn't use IncomingPollRxFrame, but the Twizy's IncomingPollReply handler will log any poll responses it doesn't know about, so that could lead to a lot of log output if something goes wrong there.
Am 28.04.24 um 15:49 schrieb Michael Geddes via OvmsDev:
AFAICT the twizzy doesn't use the poller list at all. So is it missing a call-back or something??
I can see a potential problem with IncomingPollRxFrame being called twice as much as it should be but only when there is a poll list. Maybe commenting out this would do it. (I can find another away to get this called on the thread I want). This might be the problem with the smarted
void OvmsVehicle::OvmsVehicleSignal::IncomingPollRxFrame(canbus* bus, CAN_frame_t *frame, bool success) { //if (Ready()) // m_parent->IncomingPollRxFrame(frame, success); }
//.
On Sun, 28 Apr 2024 at 21:10, Michael Balzer via OvmsDev <ovmsdev@lists.openvehicles.com> wrote:
There may also be an issue with the Renault Twizy, I've received a report of a user who is using the edge builds, that the latest build wouldn't work.
He reports all kinds of errors and warnings signaled by the car during driving, and switching back to the previous build fixed the issues.
I've asked him to provide a debug log excerpt if possible.
Regards, Michael
Am 28.04.24 um 14:29 schrieb Michael Geddes via OvmsDev:
OK. That's bad.
Does the reading work in general?
Is it just the writing commands?
Raise a ticket on github and tag me in and we can address it that way.
Michael
On Sun, 28 Apr 2024, 19:49 Thomas Heuer via OvmsDev, <ovmsdev@lists.openvehicles.com> wrote:
Hi,
The new poller code doesn't seem to work properly with the smarted.
D (218831) vehicle-poll: [1]PollerNextTick(PRI): cycle complete for ticker=215
V (218831) vehicle-poll: Standard Poll Series: List reset
D (218831) vehicle-poll: PollSeriesList::NextPollEntry[!v.standard]: ReachedEnd
V (218831) vehicle-poll: [1]PollerSend: Poller Reached End
D (219691) vehicle-poll: Poller: Queue PollerFrame()
D (219691) vehicle-poll: Poller: Queue PollerFrame()
V (219691) vehicle-poll: Pollers: FrameRx(bus=2)
D (219691) vehicle-poll: Poller: Queue PollerFrame()
V (219691) vehicle-poll: Pollers: FrameRx(bus=2)
V (219691) vehicle-poll: Pollers: FrameRx(bus=2)
D (219691) vehicle-poll: Poller: Queue PollerFrame()
*OVMS#*unlock 22 Vehicle unlocked
V (219691) vehicle-poll: Pollers: FrameRx(bus=2)
D (219691) vehicle-poll: Poller: Queue PollerFrame()
V (219691) vehicle-poll: Pollers: FrameRx(bus=2)
D (219701) vehicle-poll: Poller: Queue PollerFrame()
V (219701) vehicle-poll: Pollers: FrameRx(bus=2)
D (219701) vehicle-poll: Poller: Queue PollerFrame()
V (219701) vehicle-poll: Pollers: FrameRx(bus=2)
D (219701) vehicle-poll: Poller: Queue PollerFrame()
V (219701) vehicle-poll: Pollers: FrameRx(bus=2)
D (219701) vehicle-poll: Poller: Queue PollerFrame()
V (219701) vehicle-poll: Pollers: FrameRx(bus=2)
D (219701) vehicle-poll: Poller: Queue PollerFrame()
V (219701) vehicle-poll: Pollers: FrameRx(bus=2)
D (219701) vehicle-poll: Poller: Queue PollerFrame()
V (219701) vehicle-poll: Pollers: FrameRx(bus=2)
D (219701) vehicle-poll: Poller: Queue PollerFrame()
V (219701) vehicle-poll: Pollers: FrameRx(bus=2)
D (219701) vehicle-poll: Poller: Queue PollerFrame()
V (219701) vehicle-poll: Pollers: FrameRx(bus=2)
D (219701) vehicle-poll: Poller: Queue PollerFrame()
V (219701) vehicle-poll: Pollers: FrameRx(bus=2)
D (219701) vehicle-poll: Poller: Queue PollerFrame()
V (219701) vehicle-poll: Pollers: FrameRx(bus=2)
D (219701) vehicle-poll: Poller: Queue PollerFrame()
*Von:*OvmsDev <ovmsdev-bounces@lists.openvehicles.com> *Im Auftrag von *Michael Geddes via OvmsDev *Gesendet:* Sonntag, 28. April 2024 12:27 *An:* OVMS Developers <ovmsdev@lists.openvehicles.com> *Cc:* Michael Geddes <frog@bunyip.wheelycreek.net> *Betreff:* [Ovmsdev] OVMS Poller module/singleton
Hey all,
The poller singleton code that I've been working on for over a year now is merged in. (Thanks Michael for expediting the final step).
This includes separate multi-frame states per bus and multiple poll lists as well as non-blocking one off queries. As well as more 'states'.
I have included some programming documentation in the change but am happy to supply more if needed.
The ioniq 5 code has some examples of how it can be used. Some examples are:
* grabbing the vin as a one shot without blocking
* having a short list of queries that are polled quickly for obd2ecu (this also demonstrates using a shorter frame break value and then a break after successful a response)
Have a play please!
Also interested in hearing what user tools might be worth looking at next for the poller object.
//.ichael G.
_______________________________________________ OvmsDev mailing list OvmsDev@lists.openvehicles.com http://lists.openvehicles.com/mailman/listinfo/ovmsdev
_______________________________________________ OvmsDev mailing list OvmsDev@lists.openvehicles.com http://lists.openvehicles.com/mailman/listinfo/ovmsdev
-- Michael Balzer * Helkenberger Weg 9 * D-58256 Ennepetal Fon 02333 / 833 5735 * Handy 0176 / 206 989 26
_______________________________________________ OvmsDev mailing list OvmsDev@lists.openvehicles.com http://lists.openvehicles.com/mailman/listinfo/ovmsdev
_______________________________________________ OvmsDev mailing list OvmsDev@lists.openvehicles.com http://lists.openvehicles.com/mailman/listinfo/ovmsdev
-- Michael Balzer * Helkenberger Weg 9 * D-58256 Ennepetal Fon 02333 / 833 5735 * Handy 0176 / 206 989 26
_______________________________________________ OvmsDev mailing list OvmsDev@lists.openvehicles.com http://lists.openvehicles.com/mailman/listinfo/ovmsdev
-- Michael Balzer * Helkenberger Weg 9 * D-58256 Ennepetal Fon 02333 / 833 5735 * Handy 0176 / 206 989 26
_______________________________________________ OvmsDev mailing list OvmsDev@lists.openvehicles.com http://lists.openvehicles.com/mailman/listinfo/ovmsdev
-- Michael Balzer * Helkenberger Weg 9 * D-58256 Ennepetal Fon 02333 / 833 5735 * Handy 0176 / 206 989 26
-- Michael Balzer * Helkenberger Weg 9 * D-58256 Ennepetal Fon 02333 / 833 5735 * Handy 0176 / 206 989 26
-- Michael Balzer * Helkenberger Weg 9 * D-58256 Ennepetal Fon 02333 / 833 5735 * Handy 0176 / 206 989 26

No it will start the poll thread of the poller fine for those that don't use it. That's the last commit.... so that should be covered. When the callback is registered the thread is force started. This is not to say that what you are suggesting isn't a better way forward... just that it should work. Michael On Tue, 30 Apr 2024, 14:51 Michael Balzer via OvmsDev, < ovmsdev@lists.openvehicles.com> wrote:
Michael,
(taking this back to the list, as other developers may have helpful ideas or suggestions)
from a first check, your new patch (PR #1008) won't help for vehicles that don't use the poller, like the generic DBC vehicle or the Fiat 500 (plus possibly non-public third party vehicles). As the poller is normally compiled in, these would need a run time switch to re-enable the vehicle task, or more suitably default into that configuration and switch to the poller task only when the poller gets initialized.
How about moving the task back into the vehicle class, but keeping your task message extensions while doing so, and adding a way for the poller to hook into the task? The dedicated vehicle task is an essential part of the vehicle framework, but I do remember some occasions where a general way to pass custom messages to the vehicle task would have been helpful to use the task for more than CAN processing.
If the poller shall become avaible as a separate service that can be used without any vehicle instance (currently not a defined use case), the construct of a CAN processor task that can be extended for custom messages (or a message processor task that can subscribe to CAN frames) could be factored out into a dedicated class or template. The poller could then create his own instance of that class, if it cannot hook into an existing one.
Btw, in case you're not aware of this, FreeRTOS also provides queue sets ( https://www.freertos.org/RTOS-queue-sets.html). We haven't used them in the OVMS yet, but they could be useful, especially if message unions become large or tasks shall be able to dynamically subscribe to different message sources.
Regards, Michael
Am 30.04.24 um 01:20 schrieb Michael Geddes:
It might be worth reverting, but, I've got a patch suggestion that I'll push up which will let me know if I understand everything and which might provide a solution.
If this isn't going to work then revert. (P/R coming)
While the poller was still a part of the vehicle class it was probably still all ok. The poller had taken over what I assume you are talking about as the vehicle task. A call-back fromthe poller was calling IncomingPollRxFrame which was then coming from the (now) poller task (is that correct?)
While we have OVMS_COMP_POLLER config defined, we could just use the poller task to provide the IncomingPollRxFrame call-back from the poller (was vehicle?) task.
The problem is when OVMS_COMP_POLLER is undefined, we need an alternate (maybe we could use the 'Event' loop then) which is when I hacked that bad solution.
//.ichael
I was thinking though that because everything is being queued we could divert some calls into the car
On Mon, 29 Apr 2024, 18:58 Michael Balzer, <dexter@expeedo.de> wrote:
Michael,
I've found a severe design flaw with your poller change. Sorry, I should have seen that before, and shouldn't have merged this.
You have moved the standard CAN frame processing from the vehicle task into the CAN task by changing the vehicle from a CAN listener to a CAN callback processor. That will break all kind of things, vehicles like the Twizy, Smart and many others rely on frame processing being done in the dedicated vehicle task.
This especially induces issues regarding CAN processing capacity, as the vehicles rely on having a separate context and not needing to decouple complex processing of incoming frames. So this will degrade the CAN processing performance seriously in many cases, where additional steps involving file or network I/O need to be done.
So this needs to be changed back.
I assumed you introduced a new dedicated poller task but kept the vehicle task intact. From your naming (OvmsVehicle::IncomingPollRxFrame), it seems you misinterpreted the vehicle task's purpose as only being used for polling.
I assume this isn't a small change…? If so we should revert the poller merge, to avoid having a defunctional edge build state until the fix.
Secondly: logging is generally expensive regardless of the log level control and log channels enabled. Any log message needs to be queued to the log system, so involves a lock and a potential wait state (for the queue) & resulting context switch (= minimum delay of 10 ms). Therefore, logging must be avoided as far as possible in any time critical context, and is forbidden under some circumstances, e.g. in a timer callback (see FreeRTOS docs on this). The log system load multiplies with connected web clients or enabled file logging and enabled debug / verbose level logging -- that quickly becomes too much, usually triggering the task watchdog.
Your logging of nearly all bus events passing to/from the poller (especially the log entry in Queue_PollerFrame) becomes an issue on any vehicle that has high frequency running process data frames on the bus, like the Twizy or Smart. As a counter measure, I've just added a runtime control for all the poller's verbose logging (by default now off), and changed some debug level logs to verbose. Not sure if I've catched all that may need to be silenced by default. Please check all your log calls and place them under the new "trace" control flag wherever appropriate.
This won't help avoiding issues with process data frame buses though.
Shall I revert the poller merge for now?
Regards, Michael
Am 29.04.24 um 06:18 schrieb Michael Geddes:
Btw I included the log changes in the p/r which is a few small commits for the poller.
//.
On Mon, 29 Apr 2024, 07:20 Michael Geddes, <frog@bunyip.wheelycreek.net> wrote:
Hey Michael, I've got to work now (it's Monday), but I suspect those 'giving up' are from unsolicited messages on the bus. I can re-order things so that the message will likely be 'dropped (no poll entry)' rather than the time-out message. And make it a verbose log.
//.ichael
On Mon, 29 Apr 2024 at 00:25, Michael Balzer <dexter@expeedo.de> wrote:
Michael,
forwarding the Twizy logs to you directly, as they contain the user location.
He has just verified it's the new version, he says the module stops responding as soon as he turns on the Twizy.
His description of his actions is a bit ambiguous, and it seems he didn't enable logging to the file persistently.
According to the server, these were the version boot times:
2024-04-28 15:30:56 0 3.3.004-32-g125e0841/ota_0/edge (build idf v3.3.4-849-g6e214dc335 Apr 26 2024 19:16:50) 2024-04-28 16:21:08 0 3.3.004-32-g125e0841/ota_0/edge (build idf v3.3.4-849-g6e214dc335 Apr 26 2024 19:16:50) 2024-04-28 16:38:33 0 3.3.004-63-gf3595561/ota_1/edge (build idf v3.3.4-849-g6e214dc335 Apr 27 2024 07:44:50) 2024-04-28 16:40:57 0 3.3.004-63-gf3595561/ota_1/edge (build idf v3.3.4-849-g6e214dc335 Apr 27 2024 07:44:50) 2024-04-28 16:43:14 0 3.3.004-63-gf3595561/ota_1/edge (build idf v3.3.4-849-g6e214dc335 Apr 27 2024 07:44:50) 2024-04-28 16:46:39 0 3.3.004-63-gf3595561/ota_1/edge (build idf v3.3.4-849-g6e214dc335 Apr 27 2024 07:44:50) 2024-04-28 16:54:44 0 3.3.004-32-g125e0841/ota_0/edge (build idf v3.3.4-849-g6e214dc335 Apr 26 2024 19:16:50)
Attached is also his crash debug log -- a2ll doesn't tell much about what happened, but maybe you get an idea from this.
After the boot at 16:46, there are immediately lots of these messages:
2024-04-28 16:46:33.792 CEST D (39042) vehicle-poll: Poller: Queue PollerFrame() 2024-04-28 16:46:33.792 CEST D (39042) vehicle-poll: [1]Poller: Incoming - giving up
Regards, Michael
Am 28.04.24 um 16:44 schrieb Michael Geddes:
Ah. OK.
I could try to fix the vin thing using the new way of doing it and get rid of a semaphore? It would at least identify the problem possibly?
Michael
On Sun, 28 Apr 2024, 22:32 Michael Balzer via OvmsDev, < ovmsdev@lists.openvehicles.com> wrote:
Not sure if that's the problem, but I've found a different behaviour with the new PollSetState() implementation.
The old version only did anything if the new state actually was different from the previous one. The Twizy relies on this behaviour, calling PollSetState() from the per second ticker (see OvmsVehicleRenaultTwizy::ObdTicker1).
The new implementation apparently always sends the PollState command to the task, and that in turn always at least locks the poller mutex. Not sure if/how that could cause the observed issues, but it definitely adds quite some (unnecessary?) lock/unlock operations.
Am 28.04.24 um 16:05 schrieb Michael Balzer via OvmsDev:
The Twizy uses the poller to query the VIN (once) and DTCs (every 10 seconds while driving), see rt_obd2.cpp.
It also has its own version of the OBD single request (OvmsVehicleRenaultTwizy::ObdRequest), which was the precursor for the generalized version. This is used by custom/user Twizy plugins and scripts to access ECU internals.
The Twizy doesn't use IncomingPollRxFrame, but the Twizy's IncomingPollReply handler will log any poll responses it doesn't know about, so that could lead to a lot of log output if something goes wrong there.
Am 28.04.24 um 15:49 schrieb Michael Geddes via OvmsDev:
AFAICT the twizzy doesn't use the poller list at all. So is it missing a call-back or something??
I can see a potential problem with IncomingPollRxFrame being called twice as much as it should be but only when there is a poll list. Maybe commenting out this would do it. (I can find another away to get this called on the thread I want). This might be the problem with the smarted
void OvmsVehicle::OvmsVehicleSignal::IncomingPollRxFrame(canbus* bus, CAN_frame_t *frame, bool success) { //if (Ready()) // m_parent->IncomingPollRxFrame(frame, success); }
//.
On Sun, 28 Apr 2024 at 21:10, Michael Balzer via OvmsDev < ovmsdev@lists.openvehicles.com> wrote:
There may also be an issue with the Renault Twizy, I've received a report of a user who is using the edge builds, that the latest build wouldn't work.
He reports all kinds of errors and warnings signaled by the car during driving, and switching back to the previous build fixed the issues.
I've asked him to provide a debug log excerpt if possible.
Regards, Michael
Am 28.04.24 um 14:29 schrieb Michael Geddes via OvmsDev:
OK. That's bad.
Does the reading work in general?
Is it just the writing commands?
Raise a ticket on github and tag me in and we can address it that way.
Michael
On Sun, 28 Apr 2024, 19:49 Thomas Heuer via OvmsDev, < ovmsdev@lists.openvehicles.com> wrote:
> Hi, > > > > The new poller code doesn't seem to work properly with the smarted. > > D (218831) vehicle-poll: [1]PollerNextTick(PRI): cycle complete for > ticker=215 > > V (218831) vehicle-poll: Standard Poll Series: List reset > > D (218831) vehicle-poll: PollSeriesList::NextPollEntry[!v.standard]: > ReachedEnd > > V (218831) vehicle-poll: [1]PollerSend: Poller Reached End > > D (219691) vehicle-poll: Poller: Queue PollerFrame() > > D (219691) vehicle-poll: Poller: Queue PollerFrame() > > V (219691) vehicle-poll: Pollers: FrameRx(bus=2) > > D (219691) vehicle-poll: Poller: Queue PollerFrame() > > V (219691) vehicle-poll: Pollers: FrameRx(bus=2) > > V (219691) vehicle-poll: Pollers: FrameRx(bus=2) > > D (219691) vehicle-poll: Poller: Queue PollerFrame() > > *OVMS#* unlock 22 > Vehicle unlocked > > V (219691) vehicle-poll: Pollers: FrameRx(bus=2) > > D (219691) vehicle-poll: Poller: Queue PollerFrame() > > V (219691) vehicle-poll: Pollers: FrameRx(bus=2) > > D (219701) vehicle-poll: Poller: Queue PollerFrame() > > V (219701) vehicle-poll: Pollers: FrameRx(bus=2) > > D (219701) vehicle-poll: Poller: Queue PollerFrame() > > V (219701) vehicle-poll: Pollers: FrameRx(bus=2) > > D (219701) vehicle-poll: Poller: Queue PollerFrame() > > V (219701) vehicle-poll: Pollers: FrameRx(bus=2) > > D (219701) vehicle-poll: Poller: Queue PollerFrame() > > V (219701) vehicle-poll: Pollers: FrameRx(bus=2) > > D (219701) vehicle-poll: Poller: Queue PollerFrame() > > V (219701) vehicle-poll: Pollers: FrameRx(bus=2) > > D (219701) vehicle-poll: Poller: Queue PollerFrame() > > V (219701) vehicle-poll: Pollers: FrameRx(bus=2) > > D (219701) vehicle-poll: Poller: Queue PollerFrame() > > V (219701) vehicle-poll: Pollers: FrameRx(bus=2) > > D (219701) vehicle-poll: Poller: Queue PollerFrame() > > V (219701) vehicle-poll: Pollers: FrameRx(bus=2) > > D (219701) vehicle-poll: Poller: Queue PollerFrame() > > V (219701) vehicle-poll: Pollers: FrameRx(bus=2) > > D (219701) vehicle-poll: Poller: Queue PollerFrame() > > V (219701) vehicle-poll: Pollers: FrameRx(bus=2) > > D (219701) vehicle-poll: Poller: Queue PollerFrame() > > > > > > *Von:* OvmsDev <ovmsdev-bounces@lists.openvehicles.com> *Im Auftrag > von *Michael Geddes via OvmsDev > *Gesendet:* Sonntag, 28. April 2024 12:27 > *An:* OVMS Developers <ovmsdev@lists.openvehicles.com> > *Cc:* Michael Geddes <frog@bunyip.wheelycreek.net> > *Betreff:* [Ovmsdev] OVMS Poller module/singleton > > > > Hey all, > > > > The poller singleton code that I've been working on for over a year > now is merged in. (Thanks Michael for expediting the final step). > > > > This includes separate multi-frame states per bus and multiple poll > lists as well as non-blocking one off queries. As well as more 'states'. > > > > I have included some programming documentation in the change but am > happy to supply more if needed. > > > > The ioniq 5 code has some examples of how it can be used. Some > examples are: > > > > * grabbing the vin as a one shot without blocking > > * having a short list of queries that are polled quickly for obd2ecu > (this also demonstrates using a shorter frame break value and then a break > after successful a response) > > > > Have a play please! > > > > Also interested in hearing what user tools might be worth looking at > next for the poller object. > > > > //.ichael G. > > > > > > > > > _______________________________________________ > OvmsDev mailing list > OvmsDev@lists.openvehicles.com > http://lists.openvehicles.com/mailman/listinfo/ovmsdev >
_______________________________________________ OvmsDev mailing listOvmsDev@lists.openvehicles.comhttp://lists.openvehicles.com/mailman/listinfo/ovmsdev
-- Michael Balzer * Helkenberger Weg 9 * D-58256 Ennepetal Fon 02333 / 833 5735 * Handy 0176 / 206 989 26
_______________________________________________ OvmsDev mailing list OvmsDev@lists.openvehicles.com http://lists.openvehicles.com/mailman/listinfo/ovmsdev
_______________________________________________ OvmsDev mailing listOvmsDev@lists.openvehicles.comhttp://lists.openvehicles.com/mailman/listinfo/ovmsdev
-- Michael Balzer * Helkenberger Weg 9 * D-58256 Ennepetal Fon 02333 / 833 5735 * Handy 0176 / 206 989 26
_______________________________________________ OvmsDev mailing listOvmsDev@lists.openvehicles.comhttp://lists.openvehicles.com/mailman/listinfo/ovmsdev
-- Michael Balzer * Helkenberger Weg 9 * D-58256 Ennepetal Fon 02333 / 833 5735 * Handy 0176 / 206 989 26
_______________________________________________ OvmsDev mailing list OvmsDev@lists.openvehicles.com http://lists.openvehicles.com/mailman/listinfo/ovmsdev
-- Michael Balzer * Helkenberger Weg 9 * D-58256 Ennepetal Fon 02333 / 833 5735 * Handy 0176 / 206 989 26
-- Michael Balzer * Helkenberger Weg 9 * D-58256 Ennepetal Fon 02333 / 833 5735 * Handy 0176 / 206 989 26
-- Michael Balzer * Helkenberger Weg 9 * D-58256 Ennepetal Fon 02333 / 833 5735 * Handy 0176 / 206 989 26
_______________________________________________ OvmsDev mailing list OvmsDev@lists.openvehicles.com http://lists.openvehicles.com/mailman/listinfo/ovmsdev
OK, understood & merged, thanks for the quick fix/workaround. I'll ask the Twizy driver to test this. Regards, Michael PS: side note: there's a shutdown race condition arising from `while (!m_is_shutdown)` in the new `OvmsVehicle::VehicleTask()`: if the task receives a message while m_is_shutdown already has been set, it will exit the loop and return from the task function, which isn't allowed. I think FreeRTOS will abort in that case. Am 30.04.24 um 08:55 schrieb Michael Geddes:
No it will start the poll thread of the poller fine for those that don't use it. That's the last commit.... so that should be covered. When the callback is registered the thread is force started.
This is not to say that what you are suggesting isn't a better way forward... just that it should work.
Michael
On Tue, 30 Apr 2024, 14:51 Michael Balzer via OvmsDev, <ovmsdev@lists.openvehicles.com> wrote:
Michael,
(taking this back to the list, as other developers may have helpful ideas or suggestions)
from a first check, your new patch (PR #1008) won't help for vehicles that don't use the poller, like the generic DBC vehicle or the Fiat 500 (plus possibly non-public third party vehicles). As the poller is normally compiled in, these would need a run time switch to re-enable the vehicle task, or more suitably default into that configuration and switch to the poller task only when the poller gets initialized.
How about moving the task back into the vehicle class, but keeping your task message extensions while doing so, and adding a way for the poller to hook into the task? The dedicated vehicle task is an essential part of the vehicle framework, but I do remember some occasions where a general way to pass custom messages to the vehicle task would have been helpful to use the task for more than CAN processing.
If the poller shall become avaible as a separate service that can be used without any vehicle instance (currently not a defined use case), the construct of a CAN processor task that can be extended for custom messages (or a message processor task that can subscribe to CAN frames) could be factored out into a dedicated class or template. The poller could then create his own instance of that class, if it cannot hook into an existing one.
Btw, in case you're not aware of this, FreeRTOS also provides queue sets (https://www.freertos.org/RTOS-queue-sets.html). We haven't used them in the OVMS yet, but they could be useful, especially if message unions become large or tasks shall be able to dynamically subscribe to different message sources.
Regards, Michael
Am 30.04.24 um 01:20 schrieb Michael Geddes:
It might be worth reverting, but, I've got a patch suggestion that I'll push up which will let me know if I understand everything and which might provide a solution.
If this isn't going to work then revert. (P/R coming)
While the poller was still a part of the vehicle class it was probably still all ok. The poller had taken over what I assume you are talking about as the vehicle task. A call-back fromthe poller was calling IncomingPollRxFrame which was then coming from the (now) poller task (is that correct?)
While we have OVMS_COMP_POLLER config defined, we could just use the poller task to provide the IncomingPollRxFrame call-back from the poller (was vehicle?) task.
The problem is when OVMS_COMP_POLLER is undefined, we need an alternate (maybe we could use the 'Event' loop then) which is when I hacked that bad solution.
//.ichael
I was thinking though that because everything is being queued we could divert some calls into the car
On Mon, 29 Apr 2024, 18:58 Michael Balzer, <dexter@expeedo.de> wrote:
Michael,
I've found a severe design flaw with your poller change. Sorry, I should have seen that before, and shouldn't have merged this.
You have moved the standard CAN frame processing from the vehicle task into the CAN task by changing the vehicle from a CAN listener to a CAN callback processor. That will break all kind of things, vehicles like the Twizy, Smart and many others rely on frame processing being done in the dedicated vehicle task.
This especially induces issues regarding CAN processing capacity, as the vehicles rely on having a separate context and not needing to decouple complex processing of incoming frames. So this will degrade the CAN processing performance seriously in many cases, where additional steps involving file or network I/O need to be done.
So this needs to be changed back.
I assumed you introduced a new dedicated poller task but kept the vehicle task intact. From your naming (OvmsVehicle::IncomingPollRxFrame), it seems you misinterpreted the vehicle task's purpose as only being used for polling.
I assume this isn't a small change…? If so we should revert the poller merge, to avoid having a defunctional edge build state until the fix.
Secondly: logging is generally expensive regardless of the log level control and log channels enabled. Any log message needs to be queued to the log system, so involves a lock and a potential wait state (for the queue) & resulting context switch (= minimum delay of 10 ms). Therefore, logging must be avoided as far as possible in any time critical context, and is forbidden under some circumstances, e.g. in a timer callback (see FreeRTOS docs on this). The log system load multiplies with connected web clients or enabled file logging and enabled debug / verbose level logging -- that quickly becomes too much, usually triggering the task watchdog.
Your logging of nearly all bus events passing to/from the poller (especially the log entry in Queue_PollerFrame) becomes an issue on any vehicle that has high frequency running process data frames on the bus, like the Twizy or Smart. As a counter measure, I've just added a runtime control for all the poller's verbose logging (by default now off), and changed some debug level logs to verbose. Not sure if I've catched all that may need to be silenced by default. Please check all your log calls and place them under the new "trace" control flag wherever appropriate.
This won't help avoiding issues with process data frame buses though.
Shall I revert the poller merge for now?
Regards, Michael
Am 29.04.24 um 06:18 schrieb Michael Geddes:
Btw I included the log changes in the p/r which is a few small commits for the poller.
//.
On Mon, 29 Apr 2024, 07:20 Michael Geddes, <frog@bunyip.wheelycreek.net> wrote:
Hey Michael, I've got to work now (it's Monday), but I suspect those 'giving up' are from unsolicited messages on the bus. I can re-order things so that the message will likely be 'dropped (no poll entry)' rather than the time-out message. And make it a verbose log.
//.ichael
On Mon, 29 Apr 2024 at 00:25, Michael Balzer <dexter@expeedo.de> wrote:
Michael,
forwarding the Twizy logs to you directly, as they contain the user location.
He has just verified it's the new version, he says the module stops responding as soon as he turns on the Twizy.
His description of his actions is a bit ambiguous, and it seems he didn't enable logging to the file persistently.
According to the server, these were the version boot times:
2024-04-28 15:30:56 0 3.3.004-32-g125e0841/ota_0/edge (build idf v3.3.4-849-g6e214dc335 Apr 26 2024 19:16:50) 2024-04-28 16:21:08 0 3.3.004-32-g125e0841/ota_0/edge (build idf v3.3.4-849-g6e214dc335 Apr 26 2024 19:16:50) 2024-04-28 16:38:33 0 3.3.004-63-gf3595561/ota_1/edge (build idf v3.3.4-849-g6e214dc335 Apr 27 2024 07:44:50) 2024-04-28 16:40:57 0 3.3.004-63-gf3595561/ota_1/edge (build idf v3.3.4-849-g6e214dc335 Apr 27 2024 07:44:50) 2024-04-28 16:43:14 0 3.3.004-63-gf3595561/ota_1/edge (build idf v3.3.4-849-g6e214dc335 Apr 27 2024 07:44:50) 2024-04-28 16:46:39 0 3.3.004-63-gf3595561/ota_1/edge (build idf v3.3.4-849-g6e214dc335 Apr 27 2024 07:44:50) 2024-04-28 16:54:44 0 3.3.004-32-g125e0841/ota_0/edge (build idf v3.3.4-849-g6e214dc335 Apr 26 2024 19:16:50)
Attached is also his crash debug log -- a2ll doesn't tell much about what happened, but maybe you get an idea from this.
After the boot at 16:46, there are immediately lots of these messages:
2024-04-28 16:46:33.792 CEST D (39042) vehicle-poll: Poller: Queue PollerFrame() 2024-04-28 16:46:33.792 CEST D (39042) vehicle-poll: [1]Poller: Incoming - giving up
Regards, Michael
Am 28.04.24 um 16:44 schrieb Michael Geddes:
Ah. OK.
I could try to fix the vin thing using the new way of doing it and get rid of a semaphore? It would at least identify the problem possibly?
Michael
On Sun, 28 Apr 2024, 22:32 Michael Balzer via OvmsDev, <ovmsdev@lists.openvehicles.com> wrote:
Not sure if that's the problem, but I've found a different behaviour with the new PollSetState() implementation.
The old version only did anything if the new state actually was different from the previous one. The Twizy relies on this behaviour, calling PollSetState() from the per second ticker (see OvmsVehicleRenaultTwizy::ObdTicker1).
The new implementation apparently always sends the PollState command to the task, and that in turn always at least locks the poller mutex. Not sure if/how that could cause the observed issues, but it definitely adds quite some (unnecessary?) lock/unlock operations.
Am 28.04.24 um 16:05 schrieb Michael Balzer via OvmsDev:
The Twizy uses the poller to query the VIN (once) and DTCs (every 10 seconds while driving), see rt_obd2.cpp.
It also has its own version of the OBD single request (OvmsVehicleRenaultTwizy::ObdRequest), which was the precursor for the generalized version. This is used by custom/user Twizy plugins and scripts to access ECU internals.
The Twizy doesn't use IncomingPollRxFrame, but the Twizy's IncomingPollReply handler will log any poll responses it doesn't know about, so that could lead to a lot of log output if something goes wrong there.
Am 28.04.24 um 15:49 schrieb Michael Geddes via OvmsDev:
AFAICT the twizzy doesn't use the poller list at all. So is it missing a call-back or something??
I can see a potential problem with IncomingPollRxFrame being called twice as much as it should be but only when there is a poll list. Maybe commenting out this would do it. (I can find another away to get this called on the thread I want). This might be the problem with the smarted
void OvmsVehicle::OvmsVehicleSignal::IncomingPollRxFrame(canbus* bus, CAN_frame_t *frame, bool success) { //if (Ready()) // m_parent->IncomingPollRxFrame(frame, success); }
//.
On Sun, 28 Apr 2024 at 21:10, Michael Balzer via OvmsDev <ovmsdev@lists.openvehicles.com> wrote:
There may also be an issue with the Renault Twizy, I've received a report of a user who is using the edge builds, that the latest build wouldn't work.
He reports all kinds of errors and warnings signaled by the car during driving, and switching back to the previous build fixed the issues.
I've asked him to provide a debug log excerpt if possible.
Regards, Michael
Am 28.04.24 um 14:29 schrieb Michael Geddes via OvmsDev: > OK. That's bad. > > Does the reading work in general? > > Is it just the writing commands? > > Raise a ticket on github and tag me in > and we can address it that way. > > Michael > > On Sun, 28 Apr 2024, 19:49 Thomas Heuer > via OvmsDev, > <ovmsdev@lists.openvehicles.com> wrote: > > Hi, > > The new poller code doesn't seem to > work properly with the smarted. > > D (218831) vehicle-poll: > [1]PollerNextTick(PRI): cycle > complete for ticker=215 > > V (218831) vehicle-poll: Standard > Poll Series: List reset > > D (218831) vehicle-poll: > PollSeriesList::NextPollEntry[!v.standard]: > ReachedEnd > > V (218831) vehicle-poll: > [1]PollerSend: Poller Reached End > > D (219691) vehicle-poll: Poller: > Queue PollerFrame() > > D (219691) vehicle-poll: Poller: > Queue PollerFrame() > > V (219691) vehicle-poll: Pollers: > FrameRx(bus=2) > > D (219691) vehicle-poll: Poller: > Queue PollerFrame() > > V (219691) vehicle-poll: Pollers: > FrameRx(bus=2) > > V (219691) vehicle-poll: Pollers: > FrameRx(bus=2) > > D (219691) vehicle-poll: Poller: > Queue PollerFrame() > > *OVMS#*unlock 22 > Vehicle unlocked > > V (219691) vehicle-poll: Pollers: > FrameRx(bus=2) > > D (219691) vehicle-poll: Poller: > Queue PollerFrame() > > V (219691) vehicle-poll: Pollers: > FrameRx(bus=2) > > D (219701) vehicle-poll: Poller: > Queue PollerFrame() > > V (219701) vehicle-poll: Pollers: > FrameRx(bus=2) > > D (219701) vehicle-poll: Poller: > Queue PollerFrame() > > V (219701) vehicle-poll: Pollers: > FrameRx(bus=2) > > D (219701) vehicle-poll: Poller: > Queue PollerFrame() > > V (219701) vehicle-poll: Pollers: > FrameRx(bus=2) > > D (219701) vehicle-poll: Poller: > Queue PollerFrame() > > V (219701) vehicle-poll: Pollers: > FrameRx(bus=2) > > D (219701) vehicle-poll: Poller: > Queue PollerFrame() > > V (219701) vehicle-poll: Pollers: > FrameRx(bus=2) > > D (219701) vehicle-poll: Poller: > Queue PollerFrame() > > V (219701) vehicle-poll: Pollers: > FrameRx(bus=2) > > D (219701) vehicle-poll: Poller: > Queue PollerFrame() > > V (219701) vehicle-poll: Pollers: > FrameRx(bus=2) > > D (219701) vehicle-poll: Poller: > Queue PollerFrame() > > V (219701) vehicle-poll: Pollers: > FrameRx(bus=2) > > D (219701) vehicle-poll: Poller: > Queue PollerFrame() > > V (219701) vehicle-poll: Pollers: > FrameRx(bus=2) > > D (219701) vehicle-poll: Poller: > Queue PollerFrame() > > V (219701) vehicle-poll: Pollers: > FrameRx(bus=2) > > D (219701) vehicle-poll: Poller: > Queue PollerFrame() > > *Von:*OvmsDev > <ovmsdev-bounces@lists.openvehicles.com> > *Im Auftrag von *Michael Geddes via > OvmsDev > *Gesendet:* Sonntag, 28. April 2024 > 12:27 > *An:* OVMS Developers > <ovmsdev@lists.openvehicles.com> > *Cc:* Michael Geddes > <frog@bunyip.wheelycreek.net> > *Betreff:* [Ovmsdev] OVMS Poller > module/singleton > > Hey all, > > The poller singleton code that I've > been working on for over a year now > is merged in. (Thanks Michael for > expediting the final step). > > This includes separate multi-frame > states per bus and multiple poll > lists as well as non-blocking one > off queries. As well as more 'states'. > > I have included some programming > documentation in the change but am > happy to supply more if needed. > > The ioniq 5 code has some examples > of how it can be used. Some examples > are: > > * grabbing the vin as a one shot > without blocking > > * having a short list of queries > that are polled quickly for obd2ecu > (this also demonstrates using a > shorter frame break value and then a > break after successful a response) > > Have a play please! > > Also interested in hearing what user > tools might be worth looking at next > for the poller object. > > //.ichael G. > > _______________________________________________ > OvmsDev mailing list > OvmsDev@lists.openvehicles.com > http://lists.openvehicles.com/mailman/listinfo/ovmsdev > > > _______________________________________________ > OvmsDev mailing list > OvmsDev@lists.openvehicles.com > http://lists.openvehicles.com/mailman/listinfo/ovmsdev
-- Michael Balzer * Helkenberger Weg 9 * D-58256 Ennepetal Fon 02333 / 833 5735 * Handy 0176 / 206 989 26
_______________________________________________ OvmsDev mailing list OvmsDev@lists.openvehicles.com http://lists.openvehicles.com/mailman/listinfo/ovmsdev
_______________________________________________ OvmsDev mailing list OvmsDev@lists.openvehicles.com http://lists.openvehicles.com/mailman/listinfo/ovmsdev
-- Michael Balzer * Helkenberger Weg 9 * D-58256 Ennepetal Fon 02333 / 833 5735 * Handy 0176 / 206 989 26
_______________________________________________ OvmsDev mailing list OvmsDev@lists.openvehicles.com http://lists.openvehicles.com/mailman/listinfo/ovmsdev
-- Michael Balzer * Helkenberger Weg 9 * D-58256 Ennepetal Fon 02333 / 833 5735 * Handy 0176 / 206 989 26
_______________________________________________ OvmsDev mailing list OvmsDev@lists.openvehicles.com http://lists.openvehicles.com/mailman/listinfo/ovmsdev
-- Michael Balzer * Helkenberger Weg 9 * D-58256 Ennepetal Fon 02333 / 833 5735 * Handy 0176 / 206 989 26
-- Michael Balzer * Helkenberger Weg 9 * D-58256 Ennepetal Fon 02333 / 833 5735 * Handy 0176 / 206 989 26
-- Michael Balzer * Helkenberger Weg 9 * D-58256 Ennepetal Fon 02333 / 833 5735 * Handy 0176 / 206 989 26
_______________________________________________ OvmsDev mailing list OvmsDev@lists.openvehicles.com http://lists.openvehicles.com/mailman/listinfo/ovmsdev
-- Michael Balzer * Helkenberger Weg 9 * D-58256 Ennepetal Fon 02333 / 833 5735 * Handy 0176 / 206 989 26
Thanks. On that race condition... do you think we are better to just delete the task or I saw one recommendation that We can delete it outside the while loop in the task itself! //.ichael On Tue, 30 Apr 2024, 17:46 Michael Balzer via OvmsDev, < ovmsdev@lists.openvehicles.com> wrote:
OK, understood & merged, thanks for the quick fix/workaround.
I'll ask the Twizy driver to test this.
Regards, Michael
PS: side note: there's a shutdown race condition arising from `while (!m_is_shutdown)` in the new `OvmsVehicle::VehicleTask()`: if the task receives a message while m_is_shutdown already has been set, it will exit the loop and return from the task function, which isn't allowed. I think FreeRTOS will abort in that case.
Am 30.04.24 um 08:55 schrieb Michael Geddes:
No it will start the poll thread of the poller fine for those that don't use it. That's the last commit.... so that should be covered. When the callback is registered the thread is force started.
This is not to say that what you are suggesting isn't a better way forward... just that it should work.
Michael
On Tue, 30 Apr 2024, 14:51 Michael Balzer via OvmsDev, < ovmsdev@lists.openvehicles.com> wrote:
Michael,
(taking this back to the list, as other developers may have helpful ideas or suggestions)
from a first check, your new patch (PR #1008) won't help for vehicles that don't use the poller, like the generic DBC vehicle or the Fiat 500 (plus possibly non-public third party vehicles). As the poller is normally compiled in, these would need a run time switch to re-enable the vehicle task, or more suitably default into that configuration and switch to the poller task only when the poller gets initialized.
How about moving the task back into the vehicle class, but keeping your task message extensions while doing so, and adding a way for the poller to hook into the task? The dedicated vehicle task is an essential part of the vehicle framework, but I do remember some occasions where a general way to pass custom messages to the vehicle task would have been helpful to use the task for more than CAN processing.
If the poller shall become avaible as a separate service that can be used without any vehicle instance (currently not a defined use case), the construct of a CAN processor task that can be extended for custom messages (or a message processor task that can subscribe to CAN frames) could be factored out into a dedicated class or template. The poller could then create his own instance of that class, if it cannot hook into an existing one.
Btw, in case you're not aware of this, FreeRTOS also provides queue sets ( https://www.freertos.org/RTOS-queue-sets.html). We haven't used them in the OVMS yet, but they could be useful, especially if message unions become large or tasks shall be able to dynamically subscribe to different message sources.
Regards, Michael
Am 30.04.24 um 01:20 schrieb Michael Geddes:
It might be worth reverting, but, I've got a patch suggestion that I'll push up which will let me know if I understand everything and which might provide a solution.
If this isn't going to work then revert. (P/R coming)
While the poller was still a part of the vehicle class it was probably still all ok. The poller had taken over what I assume you are talking about as the vehicle task. A call-back fromthe poller was calling IncomingPollRxFrame which was then coming from the (now) poller task (is that correct?)
While we have OVMS_COMP_POLLER config defined, we could just use the poller task to provide the IncomingPollRxFrame call-back from the poller (was vehicle?) task.
The problem is when OVMS_COMP_POLLER is undefined, we need an alternate (maybe we could use the 'Event' loop then) which is when I hacked that bad solution.
//.ichael
I was thinking though that because everything is being queued we could divert some calls into the car
On Mon, 29 Apr 2024, 18:58 Michael Balzer, <dexter@expeedo.de> wrote:
Michael,
I've found a severe design flaw with your poller change. Sorry, I should have seen that before, and shouldn't have merged this.
You have moved the standard CAN frame processing from the vehicle task into the CAN task by changing the vehicle from a CAN listener to a CAN callback processor. That will break all kind of things, vehicles like the Twizy, Smart and many others rely on frame processing being done in the dedicated vehicle task.
This especially induces issues regarding CAN processing capacity, as the vehicles rely on having a separate context and not needing to decouple complex processing of incoming frames. So this will degrade the CAN processing performance seriously in many cases, where additional steps involving file or network I/O need to be done.
So this needs to be changed back.
I assumed you introduced a new dedicated poller task but kept the vehicle task intact. From your naming (OvmsVehicle::IncomingPollRxFrame), it seems you misinterpreted the vehicle task's purpose as only being used for polling.
I assume this isn't a small change…? If so we should revert the poller merge, to avoid having a defunctional edge build state until the fix.
Secondly: logging is generally expensive regardless of the log level control and log channels enabled. Any log message needs to be queued to the log system, so involves a lock and a potential wait state (for the queue) & resulting context switch (= minimum delay of 10 ms). Therefore, logging must be avoided as far as possible in any time critical context, and is forbidden under some circumstances, e.g. in a timer callback (see FreeRTOS docs on this). The log system load multiplies with connected web clients or enabled file logging and enabled debug / verbose level logging -- that quickly becomes too much, usually triggering the task watchdog.
Your logging of nearly all bus events passing to/from the poller (especially the log entry in Queue_PollerFrame) becomes an issue on any vehicle that has high frequency running process data frames on the bus, like the Twizy or Smart. As a counter measure, I've just added a runtime control for all the poller's verbose logging (by default now off), and changed some debug level logs to verbose. Not sure if I've catched all that may need to be silenced by default. Please check all your log calls and place them under the new "trace" control flag wherever appropriate.
This won't help avoiding issues with process data frame buses though.
Shall I revert the poller merge for now?
Regards, Michael
Am 29.04.24 um 06:18 schrieb Michael Geddes:
Btw I included the log changes in the p/r which is a few small commits for the poller.
//.
On Mon, 29 Apr 2024, 07:20 Michael Geddes, <frog@bunyip.wheelycreek.net> wrote:
Hey Michael, I've got to work now (it's Monday), but I suspect those 'giving up' are from unsolicited messages on the bus. I can re-order things so that the message will likely be 'dropped (no poll entry)' rather than the time-out message. And make it a verbose log.
//.ichael
On Mon, 29 Apr 2024 at 00:25, Michael Balzer <dexter@expeedo.de> wrote:
Michael,
forwarding the Twizy logs to you directly, as they contain the user location.
He has just verified it's the new version, he says the module stops responding as soon as he turns on the Twizy.
His description of his actions is a bit ambiguous, and it seems he didn't enable logging to the file persistently.
According to the server, these were the version boot times:
2024-04-28 15:30:56 0 3.3.004-32-g125e0841/ota_0/edge (build idf v3.3.4-849-g6e214dc335 Apr 26 2024 19:16:50) 2024-04-28 16:21:08 0 3.3.004-32-g125e0841/ota_0/edge (build idf v3.3.4-849-g6e214dc335 Apr 26 2024 19:16:50) 2024-04-28 16:38:33 0 3.3.004-63-gf3595561/ota_1/edge (build idf v3.3.4-849-g6e214dc335 Apr 27 2024 07:44:50) 2024-04-28 16:40:57 0 3.3.004-63-gf3595561/ota_1/edge (build idf v3.3.4-849-g6e214dc335 Apr 27 2024 07:44:50) 2024-04-28 16:43:14 0 3.3.004-63-gf3595561/ota_1/edge (build idf v3.3.4-849-g6e214dc335 Apr 27 2024 07:44:50) 2024-04-28 16:46:39 0 3.3.004-63-gf3595561/ota_1/edge (build idf v3.3.4-849-g6e214dc335 Apr 27 2024 07:44:50) 2024-04-28 16:54:44 0 3.3.004-32-g125e0841/ota_0/edge (build idf v3.3.4-849-g6e214dc335 Apr 26 2024 19:16:50)
Attached is also his crash debug log -- a2ll doesn't tell much about what happened, but maybe you get an idea from this.
After the boot at 16:46, there are immediately lots of these messages:
2024-04-28 16:46:33.792 CEST D (39042) vehicle-poll: Poller: Queue PollerFrame() 2024-04-28 16:46:33.792 CEST D (39042) vehicle-poll: [1]Poller: Incoming - giving up
Regards, Michael
Am 28.04.24 um 16:44 schrieb Michael Geddes:
Ah. OK.
I could try to fix the vin thing using the new way of doing it and get rid of a semaphore? It would at least identify the problem possibly?
Michael
On Sun, 28 Apr 2024, 22:32 Michael Balzer via OvmsDev, < ovmsdev@lists.openvehicles.com> wrote:
Not sure if that's the problem, but I've found a different behaviour with the new PollSetState() implementation.
The old version only did anything if the new state actually was different from the previous one. The Twizy relies on this behaviour, calling PollSetState() from the per second ticker (see OvmsVehicleRenaultTwizy::ObdTicker1).
The new implementation apparently always sends the PollState command to the task, and that in turn always at least locks the poller mutex. Not sure if/how that could cause the observed issues, but it definitely adds quite some (unnecessary?) lock/unlock operations.
Am 28.04.24 um 16:05 schrieb Michael Balzer via OvmsDev:
The Twizy uses the poller to query the VIN (once) and DTCs (every 10 seconds while driving), see rt_obd2.cpp.
It also has its own version of the OBD single request (OvmsVehicleRenaultTwizy::ObdRequest), which was the precursor for the generalized version. This is used by custom/user Twizy plugins and scripts to access ECU internals.
The Twizy doesn't use IncomingPollRxFrame, but the Twizy's IncomingPollReply handler will log any poll responses it doesn't know about, so that could lead to a lot of log output if something goes wrong there.
Am 28.04.24 um 15:49 schrieb Michael Geddes via OvmsDev:
AFAICT the twizzy doesn't use the poller list at all. So is it missing a call-back or something??
I can see a potential problem with IncomingPollRxFrame being called twice as much as it should be but only when there is a poll list. Maybe commenting out this would do it. (I can find another away to get this called on the thread I want). This might be the problem with the smarted
void OvmsVehicle::OvmsVehicleSignal::IncomingPollRxFrame(canbus* bus, CAN_frame_t *frame, bool success) { //if (Ready()) // m_parent->IncomingPollRxFrame(frame, success); }
//.
On Sun, 28 Apr 2024 at 21:10, Michael Balzer via OvmsDev < ovmsdev@lists.openvehicles.com> wrote:
> There may also be an issue with the Renault Twizy, I've received a > report of a user who is using the edge builds, that the latest build > wouldn't work. > > He reports all kinds of errors and warnings signaled by the car > during driving, and switching back to the previous build fixed the issues. > > I've asked him to provide a debug log excerpt if possible. > > Regards, > Michael > > > Am 28.04.24 um 14:29 schrieb Michael Geddes via OvmsDev: > > OK. That's bad. > > Does the reading work in general? > > Is it just the writing commands? > > Raise a ticket on github and tag me in and we can address it that > way. > > Michael > > On Sun, 28 Apr 2024, 19:49 Thomas Heuer via OvmsDev, < > ovmsdev@lists.openvehicles.com> wrote: > >> Hi, >> >> >> >> The new poller code doesn't seem to work properly with the smarted. >> >> D (218831) vehicle-poll: [1]PollerNextTick(PRI): cycle complete for >> ticker=215 >> >> V (218831) vehicle-poll: Standard Poll Series: List reset >> >> D (218831) vehicle-poll: >> PollSeriesList::NextPollEntry[!v.standard]: ReachedEnd >> >> V (218831) vehicle-poll: [1]PollerSend: Poller Reached End >> >> D (219691) vehicle-poll: Poller: Queue PollerFrame() >> >> D (219691) vehicle-poll: Poller: Queue PollerFrame() >> >> V (219691) vehicle-poll: Pollers: FrameRx(bus=2) >> >> D (219691) vehicle-poll: Poller: Queue PollerFrame() >> >> V (219691) vehicle-poll: Pollers: FrameRx(bus=2) >> >> V (219691) vehicle-poll: Pollers: FrameRx(bus=2) >> >> D (219691) vehicle-poll: Poller: Queue PollerFrame() >> >> *OVMS#* unlock 22 >> Vehicle unlocked >> >> V (219691) vehicle-poll: Pollers: FrameRx(bus=2) >> >> D (219691) vehicle-poll: Poller: Queue PollerFrame() >> >> V (219691) vehicle-poll: Pollers: FrameRx(bus=2) >> >> D (219701) vehicle-poll: Poller: Queue PollerFrame() >> >> V (219701) vehicle-poll: Pollers: FrameRx(bus=2) >> >> D (219701) vehicle-poll: Poller: Queue PollerFrame() >> >> V (219701) vehicle-poll: Pollers: FrameRx(bus=2) >> >> D (219701) vehicle-poll: Poller: Queue PollerFrame() >> >> V (219701) vehicle-poll: Pollers: FrameRx(bus=2) >> >> D (219701) vehicle-poll: Poller: Queue PollerFrame() >> >> V (219701) vehicle-poll: Pollers: FrameRx(bus=2) >> >> D (219701) vehicle-poll: Poller: Queue PollerFrame() >> >> V (219701) vehicle-poll: Pollers: FrameRx(bus=2) >> >> D (219701) vehicle-poll: Poller: Queue PollerFrame() >> >> V (219701) vehicle-poll: Pollers: FrameRx(bus=2) >> >> D (219701) vehicle-poll: Poller: Queue PollerFrame() >> >> V (219701) vehicle-poll: Pollers: FrameRx(bus=2) >> >> D (219701) vehicle-poll: Poller: Queue PollerFrame() >> >> V (219701) vehicle-poll: Pollers: FrameRx(bus=2) >> >> D (219701) vehicle-poll: Poller: Queue PollerFrame() >> >> V (219701) vehicle-poll: Pollers: FrameRx(bus=2) >> >> D (219701) vehicle-poll: Poller: Queue PollerFrame() >> >> V (219701) vehicle-poll: Pollers: FrameRx(bus=2) >> >> D (219701) vehicle-poll: Poller: Queue PollerFrame() >> >> >> >> >> >> *Von:* OvmsDev <ovmsdev-bounces@lists.openvehicles.com> *Im >> Auftrag von *Michael Geddes via OvmsDev >> *Gesendet:* Sonntag, 28. April 2024 12:27 >> *An:* OVMS Developers <ovmsdev@lists.openvehicles.com> >> *Cc:* Michael Geddes <frog@bunyip.wheelycreek.net> >> *Betreff:* [Ovmsdev] OVMS Poller module/singleton >> >> >> >> Hey all, >> >> >> >> The poller singleton code that I've been working on for over a year >> now is merged in. (Thanks Michael for expediting the final step). >> >> >> >> This includes separate multi-frame states per bus and multiple poll >> lists as well as non-blocking one off queries. As well as more 'states'. >> >> >> >> I have included some programming documentation in the change but am >> happy to supply more if needed. >> >> >> >> The ioniq 5 code has some examples of how it can be used. Some >> examples are: >> >> >> >> * grabbing the vin as a one shot without blocking >> >> * having a short list of queries that are polled quickly for >> obd2ecu (this also demonstrates using a shorter frame break value and then >> a break after successful a response) >> >> >> >> Have a play please! >> >> >> >> Also interested in hearing what user tools might be worth looking >> at next for the poller object. >> >> >> >> //.ichael G. >> >> >> >> >> >> >> >> >> _______________________________________________ >> OvmsDev mailing list >> OvmsDev@lists.openvehicles.com >> http://lists.openvehicles.com/mailman/listinfo/ovmsdev >> > > _______________________________________________ > OvmsDev mailing listOvmsDev@lists.openvehicles.comhttp://lists.openvehicles.com/mailman/listinfo/ovmsdev > > > -- > Michael Balzer * Helkenberger Weg 9 * D-58256 Ennepetal > Fon 02333 / 833 5735 * Handy 0176 / 206 989 26 > > _______________________________________________ > OvmsDev mailing list > OvmsDev@lists.openvehicles.com > http://lists.openvehicles.com/mailman/listinfo/ovmsdev >
_______________________________________________ OvmsDev mailing listOvmsDev@lists.openvehicles.comhttp://lists.openvehicles.com/mailman/listinfo/ovmsdev
-- Michael Balzer * Helkenberger Weg 9 * D-58256 Ennepetal Fon 02333 / 833 5735 * Handy 0176 / 206 989 26
_______________________________________________ OvmsDev mailing listOvmsDev@lists.openvehicles.comhttp://lists.openvehicles.com/mailman/listinfo/ovmsdev
-- Michael Balzer * Helkenberger Weg 9 * D-58256 Ennepetal Fon 02333 / 833 5735 * Handy 0176 / 206 989 26
_______________________________________________ OvmsDev mailing list OvmsDev@lists.openvehicles.com http://lists.openvehicles.com/mailman/listinfo/ovmsdev
-- Michael Balzer * Helkenberger Weg 9 * D-58256 Ennepetal Fon 02333 / 833 5735 * Handy 0176 / 206 989 26
-- Michael Balzer * Helkenberger Weg 9 * D-58256 Ennepetal Fon 02333 / 833 5735 * Handy 0176 / 206 989 26
-- Michael Balzer * Helkenberger Weg 9 * D-58256 Ennepetal Fon 02333 / 833 5735 * Handy 0176 / 206 989 26
_______________________________________________ OvmsDev mailing list OvmsDev@lists.openvehicles.com http://lists.openvehicles.com/mailman/listinfo/ovmsdev
-- Michael Balzer * Helkenberger Weg 9 * D-58256 Ennepetal Fon 02333 / 833 5735 * Handy 0176 / 206 989 26
_______________________________________________ OvmsDev mailing list OvmsDev@lists.openvehicles.com http://lists.openvehicles.com/mailman/listinfo/ovmsdev
A task may delete itself by calling vTaskDelete(NULL) as the final statement, and that's normally a better way to shutdown a task, if you can signal the task it should terminate. Deleting a task from outside may always result in resources taken by the task not being freed, as the task gets terminated wherever it just is. As the vehicle task also needs to access vehicle data memory, vehicle destruction should not begin until the task has finished, otherwise a task job already running while the vehicle destruction takes place may run into an illegal memory access (access after free). Keep in mind, destructors are executed bottom up, so waiting for the task shutdown within the destructor won't help. Also, I think "MyCan.DeregisterCallback(TAG)" in ShuttingDown() is now obsolete. Regards, Michael Am 02.05.24 um 15:23 schrieb Michael Geddes:
Thanks.
On that race condition... do you think we are better to just delete the task or I saw one recommendation that We can delete it outside the while loop in the task itself!
//.ichael
On Tue, 30 Apr 2024, 17:46 Michael Balzer via OvmsDev, <ovmsdev@lists.openvehicles.com> wrote:
OK, understood & merged, thanks for the quick fix/workaround.
I'll ask the Twizy driver to test this.
Regards, Michael
PS: side note: there's a shutdown race condition arising from `while (!m_is_shutdown)` in the new `OvmsVehicle::VehicleTask()`: if the task receives a message while m_is_shutdown already has been set, it will exit the loop and return from the task function, which isn't allowed. I think FreeRTOS will abort in that case.
Am 30.04.24 um 08:55 schrieb Michael Geddes:
No it will start the poll thread of the poller fine for those that don't use it. That's the last commit.... so that should be covered. When the callback is registered the thread is force started.
This is not to say that what you are suggesting isn't a better way forward... just that it should work.
Michael
On Tue, 30 Apr 2024, 14:51 Michael Balzer via OvmsDev, <ovmsdev@lists.openvehicles.com> wrote:
Michael,
(taking this back to the list, as other developers may have helpful ideas or suggestions)
from a first check, your new patch (PR #1008) won't help for vehicles that don't use the poller, like the generic DBC vehicle or the Fiat 500 (plus possibly non-public third party vehicles). As the poller is normally compiled in, these would need a run time switch to re-enable the vehicle task, or more suitably default into that configuration and switch to the poller task only when the poller gets initialized.
How about moving the task back into the vehicle class, but keeping your task message extensions while doing so, and adding a way for the poller to hook into the task? The dedicated vehicle task is an essential part of the vehicle framework, but I do remember some occasions where a general way to pass custom messages to the vehicle task would have been helpful to use the task for more than CAN processing.
If the poller shall become avaible as a separate service that can be used without any vehicle instance (currently not a defined use case), the construct of a CAN processor task that can be extended for custom messages (or a message processor task that can subscribe to CAN frames) could be factored out into a dedicated class or template. The poller could then create his own instance of that class, if it cannot hook into an existing one.
Btw, in case you're not aware of this, FreeRTOS also provides queue sets (https://www.freertos.org/RTOS-queue-sets.html). We haven't used them in the OVMS yet, but they could be useful, especially if message unions become large or tasks shall be able to dynamically subscribe to different message sources.
Regards, Michael
Am 30.04.24 um 01:20 schrieb Michael Geddes:
It might be worth reverting, but, I've got a patch suggestion that I'll push up which will let me know if I understand everything and which might provide a solution.
If this isn't going to work then revert. (P/R coming)
While the poller was still a part of the vehicle class it was probably still all ok. The poller had taken over what I assume you are talking about as the vehicle task. A call-back fromthe poller was calling IncomingPollRxFrame which was then coming from the (now) poller task (is that correct?)
While we have OVMS_COMP_POLLER config defined, we could just use the poller task to provide the IncomingPollRxFrame call-back from the poller (was vehicle?) task.
The problem is when OVMS_COMP_POLLER is undefined, we need an alternate (maybe we could use the 'Event' loop then) which is when I hacked that bad solution.
//.ichael
I was thinking though that because everything is being queued we could divert some calls into the car
On Mon, 29 Apr 2024, 18:58 Michael Balzer, <dexter@expeedo.de> wrote:
Michael,
I've found a severe design flaw with your poller change. Sorry, I should have seen that before, and shouldn't have merged this.
You have moved the standard CAN frame processing from the vehicle task into the CAN task by changing the vehicle from a CAN listener to a CAN callback processor. That will break all kind of things, vehicles like the Twizy, Smart and many others rely on frame processing being done in the dedicated vehicle task.
This especially induces issues regarding CAN processing capacity, as the vehicles rely on having a separate context and not needing to decouple complex processing of incoming frames. So this will degrade the CAN processing performance seriously in many cases, where additional steps involving file or network I/O need to be done.
So this needs to be changed back.
I assumed you introduced a new dedicated poller task but kept the vehicle task intact. From your naming (OvmsVehicle::IncomingPollRxFrame), it seems you misinterpreted the vehicle task's purpose as only being used for polling.
I assume this isn't a small change…? If so we should revert the poller merge, to avoid having a defunctional edge build state until the fix.
Secondly: logging is generally expensive regardless of the log level control and log channels enabled. Any log message needs to be queued to the log system, so involves a lock and a potential wait state (for the queue) & resulting context switch (= minimum delay of 10 ms). Therefore, logging must be avoided as far as possible in any time critical context, and is forbidden under some circumstances, e.g. in a timer callback (see FreeRTOS docs on this). The log system load multiplies with connected web clients or enabled file logging and enabled debug / verbose level logging -- that quickly becomes too much, usually triggering the task watchdog.
Your logging of nearly all bus events passing to/from the poller (especially the log entry in Queue_PollerFrame) becomes an issue on any vehicle that has high frequency running process data frames on the bus, like the Twizy or Smart. As a counter measure, I've just added a runtime control for all the poller's verbose logging (by default now off), and changed some debug level logs to verbose. Not sure if I've catched all that may need to be silenced by default. Please check all your log calls and place them under the new "trace" control flag wherever appropriate.
This won't help avoiding issues with process data frame buses though.
Shall I revert the poller merge for now?
Regards, Michael
Am 29.04.24 um 06:18 schrieb Michael Geddes:
Btw I included the log changes in the p/r which is a few small commits for the poller.
//.
On Mon, 29 Apr 2024, 07:20 Michael Geddes, <frog@bunyip.wheelycreek.net> wrote:
Hey Michael, I've got to work now (it's Monday), but I suspect those 'giving up' are from unsolicited messages on the bus. I can re-order things so that the message will likely be 'dropped (no poll entry)' rather than the time-out message. And make it a verbose log.
//.ichael
On Mon, 29 Apr 2024 at 00:25, Michael Balzer <dexter@expeedo.de> wrote:
Michael,
forwarding the Twizy logs to you directly, as they contain the user location.
He has just verified it's the new version, he says the module stops responding as soon as he turns on the Twizy.
His description of his actions is a bit ambiguous, and it seems he didn't enable logging to the file persistently.
According to the server, these were the version boot times:
2024-04-28 15:30:56 0 3.3.004-32-g125e0841/ota_0/edge (build idf v3.3.4-849-g6e214dc335 Apr 26 2024 19:16:50) 2024-04-28 16:21:08 0 3.3.004-32-g125e0841/ota_0/edge (build idf v3.3.4-849-g6e214dc335 Apr 26 2024 19:16:50) 2024-04-28 16:38:33 0 3.3.004-63-gf3595561/ota_1/edge (build idf v3.3.4-849-g6e214dc335 Apr 27 2024 07:44:50) 2024-04-28 16:40:57 0 3.3.004-63-gf3595561/ota_1/edge (build idf v3.3.4-849-g6e214dc335 Apr 27 2024 07:44:50) 2024-04-28 16:43:14 0 3.3.004-63-gf3595561/ota_1/edge (build idf v3.3.4-849-g6e214dc335 Apr 27 2024 07:44:50) 2024-04-28 16:46:39 0 3.3.004-63-gf3595561/ota_1/edge (build idf v3.3.4-849-g6e214dc335 Apr 27 2024 07:44:50) 2024-04-28 16:54:44 0 3.3.004-32-g125e0841/ota_0/edge (build idf v3.3.4-849-g6e214dc335 Apr 26 2024 19:16:50)
Attached is also his crash debug log -- a2ll doesn't tell much about what happened, but maybe you get an idea from this.
After the boot at 16:46, there are immediately lots of these messages:
2024-04-28 16:46:33.792 CEST D (39042) vehicle-poll: Poller: Queue PollerFrame() 2024-04-28 16:46:33.792 CEST D (39042) vehicle-poll: [1]Poller: Incoming - giving up
Regards, Michael
Am 28.04.24 um 16:44 schrieb Michael Geddes:
Ah. OK.
I could try to fix the vin thing using the new way of doing it and get rid of a semaphore? It would at least identify the problem possibly?
Michael
On Sun, 28 Apr 2024, 22:32 Michael Balzer via OvmsDev, <ovmsdev@lists.openvehicles.com> wrote:
Not sure if that's the problem, but I've found a different behaviour with the new PollSetState() implementation.
The old version only did anything if the new state actually was different from the previous one. The Twizy relies on this behaviour, calling PollSetState() from the per second ticker (see OvmsVehicleRenaultTwizy::ObdTicker1).
The new implementation apparently always sends the PollState command to the task, and that in turn always at least locks the poller mutex. Not sure if/how that could cause the observed issues, but it definitely adds quite some (unnecessary?) lock/unlock operations.
Am 28.04.24 um 16:05 schrieb Michael Balzer via OvmsDev:
The Twizy uses the poller to query the VIN (once) and DTCs (every 10 seconds while driving), see rt_obd2.cpp.
It also has its own version of the OBD single request (OvmsVehicleRenaultTwizy::ObdRequest), which was the precursor for the generalized version. This is used by custom/user Twizy plugins and scripts to access ECU internals.
The Twizy doesn't use IncomingPollRxFrame, but the Twizy's IncomingPollReply handler will log any poll responses it doesn't know about, so that could lead to a lot of log output if something goes wrong there.
Am 28.04.24 um 15:49 schrieb Michael Geddes via OvmsDev: > AFAICT the twizzy doesn't use the poller > list at all. So is it missing a > call-back or something?? > > I can see a potential problem with > IncomingPollRxFrame being called twice > as much as it should be but only when > there is a poll list. Maybe commenting > out this would do it. (I can find > another away to get this called on the > thread I want). This might be the > problem with the smarted > > void > OvmsVehicle::OvmsVehicleSignal::IncomingPollRxFrame(canbus* > bus, CAN_frame_t *frame, bool success) > { > //if (Ready()) > // > m_parent->IncomingPollRxFrame(frame, > success); > } > > //. > > > On Sun, 28 Apr 2024 at 21:10, Michael > Balzer via OvmsDev > <ovmsdev@lists.openvehicles.com> wrote: > > There may also be an issue with the > Renault Twizy, I've received a > report of a user who is using the > edge builds, that the latest build > wouldn't work. > > He reports all kinds of errors and > warnings signaled by the car during > driving, and switching back to the > previous build fixed the issues. > > I've asked him to provide a debug > log excerpt if possible. > > Regards, > Michael > > > Am 28.04.24 um 14:29 schrieb Michael > Geddes via OvmsDev: >> OK. That's bad. >> >> Does the reading work in general? >> >> Is it just the writing commands? >> >> Raise a ticket on github and tag me >> in and we can address it that way. >> >> Michael >> >> On Sun, 28 Apr 2024, 19:49 Thomas >> Heuer via OvmsDev, >> <ovmsdev@lists.openvehicles.com> wrote: >> >> Hi, >> >> The new poller code doesn't >> seem to work properly with the >> smarted. >> >> D (218831) vehicle-poll: >> [1]PollerNextTick(PRI): cycle >> complete for ticker=215 >> >> V (218831) vehicle-poll: >> Standard Poll Series: List reset >> >> D (218831) vehicle-poll: >> PollSeriesList::NextPollEntry[!v.standard]: >> ReachedEnd >> >> V (218831) vehicle-poll: >> [1]PollerSend: Poller Reached End >> >> D (219691) vehicle-poll: >> Poller: Queue PollerFrame() >> >> D (219691) vehicle-poll: >> Poller: Queue PollerFrame() >> >> V (219691) vehicle-poll: >> Pollers: FrameRx(bus=2) >> >> D (219691) vehicle-poll: >> Poller: Queue PollerFrame() >> >> V (219691) vehicle-poll: >> Pollers: FrameRx(bus=2) >> >> V (219691) vehicle-poll: >> Pollers: FrameRx(bus=2) >> >> D (219691) vehicle-poll: >> Poller: Queue PollerFrame() >> >> *OVMS#*unlock 22 >> Vehicle unlocked >> >> V (219691) vehicle-poll: >> Pollers: FrameRx(bus=2) >> >> D (219691) vehicle-poll: >> Poller: Queue PollerFrame() >> >> V (219691) vehicle-poll: >> Pollers: FrameRx(bus=2) >> >> D (219701) vehicle-poll: >> Poller: Queue PollerFrame() >> >> V (219701) vehicle-poll: >> Pollers: FrameRx(bus=2) >> >> D (219701) vehicle-poll: >> Poller: Queue PollerFrame() >> >> V (219701) vehicle-poll: >> Pollers: FrameRx(bus=2) >> >> D (219701) vehicle-poll: >> Poller: Queue PollerFrame() >> >> V (219701) vehicle-poll: >> Pollers: FrameRx(bus=2) >> >> D (219701) vehicle-poll: >> Poller: Queue PollerFrame() >> >> V (219701) vehicle-poll: >> Pollers: FrameRx(bus=2) >> >> D (219701) vehicle-poll: >> Poller: Queue PollerFrame() >> >> V (219701) vehicle-poll: >> Pollers: FrameRx(bus=2) >> >> D (219701) vehicle-poll: >> Poller: Queue PollerFrame() >> >> V (219701) vehicle-poll: >> Pollers: FrameRx(bus=2) >> >> D (219701) vehicle-poll: >> Poller: Queue PollerFrame() >> >> V (219701) vehicle-poll: >> Pollers: FrameRx(bus=2) >> >> D (219701) vehicle-poll: >> Poller: Queue PollerFrame() >> >> V (219701) vehicle-poll: >> Pollers: FrameRx(bus=2) >> >> D (219701) vehicle-poll: >> Poller: Queue PollerFrame() >> >> V (219701) vehicle-poll: >> Pollers: FrameRx(bus=2) >> >> D (219701) vehicle-poll: >> Poller: Queue PollerFrame() >> >> V (219701) vehicle-poll: >> Pollers: FrameRx(bus=2) >> >> D (219701) vehicle-poll: >> Poller: Queue PollerFrame() >> >> *Von:*OvmsDev >> <ovmsdev-bounces@lists.openvehicles.com> >> *Im Auftrag von *Michael Geddes >> via OvmsDev >> *Gesendet:* Sonntag, 28. April >> 2024 12:27 >> *An:* OVMS Developers >> <ovmsdev@lists.openvehicles.com> >> *Cc:* Michael Geddes >> <frog@bunyip.wheelycreek.net> >> *Betreff:* [Ovmsdev] OVMS >> Poller module/singleton >> >> Hey all, >> >> The poller singleton code that >> I've been working on for over a >> year now is merged in. (Thanks >> Michael for expediting the >> final step). >> >> This includes separate >> multi-frame states per bus and >> multiple poll lists as well as >> non-blocking one off queries. >> As well as more 'states'. >> >> I have included some >> programming documentation in >> the change but am happy to >> supply more if needed. >> >> The ioniq 5 code has some >> examples of how it can be used. >> Some examples are: >> >> * grabbing the vin as a one >> shot without blocking >> >> * having a short list of >> queries that are polled quickly >> for obd2ecu (this also >> demonstrates using a shorter >> frame break value and then a >> break after successful a response) >> >> Have a play please! >> >> Also interested in hearing what >> user tools might be worth >> looking at next for the poller >> object. >> >> //.ichael G. >> >> _______________________________________________ >> OvmsDev mailing list >> OvmsDev@lists.openvehicles.com >> http://lists.openvehicles.com/mailman/listinfo/ovmsdev >> >> >> _______________________________________________ >> OvmsDev mailing list >> OvmsDev@lists.openvehicles.com >> http://lists.openvehicles.com/mailman/listinfo/ovmsdev > > -- > Michael Balzer * Helkenberger Weg 9 * D-58256 Ennepetal > Fon 02333 / 833 5735 * Handy 0176 / 206 989 26 > > _______________________________________________ > OvmsDev mailing list > OvmsDev@lists.openvehicles.com > http://lists.openvehicles.com/mailman/listinfo/ovmsdev > > > _______________________________________________ > OvmsDev mailing list > OvmsDev@lists.openvehicles.com > http://lists.openvehicles.com/mailman/listinfo/ovmsdev
-- Michael Balzer * Helkenberger Weg 9 * D-58256 Ennepetal Fon 02333 / 833 5735 * Handy 0176 / 206 989 26
_______________________________________________ OvmsDev mailing list OvmsDev@lists.openvehicles.com http://lists.openvehicles.com/mailman/listinfo/ovmsdev
-- Michael Balzer * Helkenberger Weg 9 * D-58256 Ennepetal Fon 02333 / 833 5735 * Handy 0176 / 206 989 26
_______________________________________________ OvmsDev mailing list OvmsDev@lists.openvehicles.com http://lists.openvehicles.com/mailman/listinfo/ovmsdev
-- Michael Balzer * Helkenberger Weg 9 * D-58256 Ennepetal Fon 02333 / 833 5735 * Handy 0176 / 206 989 26
-- Michael Balzer * Helkenberger Weg 9 * D-58256 Ennepetal Fon 02333 / 833 5735 * Handy 0176 / 206 989 26
-- Michael Balzer * Helkenberger Weg 9 * D-58256 Ennepetal Fon 02333 / 833 5735 * Handy 0176 / 206 989 26
_______________________________________________ OvmsDev mailing list OvmsDev@lists.openvehicles.com http://lists.openvehicles.com/mailman/listinfo/ovmsdev
-- Michael Balzer * Helkenberger Weg 9 * D-58256 Ennepetal Fon 02333 / 833 5735 * Handy 0176 / 206 989 26
_______________________________________________ OvmsDev mailing list OvmsDev@lists.openvehicles.com http://lists.openvehicles.com/mailman/listinfo/ovmsdev
-- Michael Balzer * Helkenberger Weg 9 * D-58256 Ennepetal Fon 02333 / 833 5735 * Handy 0176 / 206 989 26

Hi Michael, When running firmware 3.3.004-74-gbd4e7196 on my Nissan Leaf I suspect (but can't be 100% sure as it's only been 24h without fault) the new poller caused the car to throw the attached faults from overloading the can bus whilst driving. The fault was sufficient to send the car into limp mode and could not be driven until cleared with LeafSpy. Ovms should not be polling in the driving state, so I'm not sure why the poller is overflowing. The ovms log repeats this overflow in rapid succession right before the failure occurred. I have since reverted to an earlier version and it might be advisable for other Leaf owners to do so until the new poller is fully operational. 2024-05-02 12:22:28.316 NZST I (36847486) vehicle-poll: Poller[Frame]: Task Queue Overflow 2024-05-02 12:22:28.316 NZST I (36847486) vehicle-poll: Poller[Frame]: Task Queue Overflow 2024-05-02 12:22:28.316 NZST I (36847486) vehicle-poll: Poller[Frame]: Task Queue Overflow 2024-05-02 12:22:28.326 NZST I (36847496) vehicle-poll: Poller[Frame]: Task Queue Overflow 2024-05-02 12:22:28.326 NZST I (36847496) vehicle-poll: Poller[Frame]: Task Queue Overflow 2024-05-02 12:22:28.326 NZST I (36847496) vehicle-poll: Poller[Frame]: Task Queue Overflow 2024-05-02 12:22:28.326 NZST I (36847496) vehicle-poll: Poller[Frame]: Task Queue Overflow 2024-05-02 12:22:28.326 NZST I (36847496) vehicle-poll: Poller[Frame]: Task Queue Overflow 2024-05-02 12:22:28.326 NZST I (36847496) vehicle-poll: Poller[Frame]: Task Queue Overflow 2024-05-02 12:22:28.326 NZST I (36847496) vehicle-poll: Poller[Frame]: Task Queue Overflow 2024-05-02 12:22:28.326 NZST I (36847496) vehicle-poll: Poller[Frame]: Task Queue Overflow 2024-05-02 12:22:28.336 NZST I (36847506) vehicle-poll: Poller[Frame]: Task Queue Overflow 2024-05-02 12:22:28.336 NZST I (36847506) vehicle-poll: Poller[Frame]: Task Queue Overflow 2024-05-02 12:22:28.336 NZST I (36847506) vehicle-poll: Poller[Frame]: Task Queue Overflow 2024-05-02 12:22:28.336 NZST I (36847506) vehicle-poll: Poller[Frame]: Task Queue Overflow 2024-05-02 12:22:28.346 NZST I (36847516) vehicle-poll: Poller[Frame]: Task Queue Overflow 2024-05-02 12:22:28.346 NZST I (36847516) vehicle-poll: Poller[Frame]: Task Queue Overflow 2024-05-02 12:22:28.346 NZST I (36847516) vehicle-poll: Poller[Frame]: Task Queue Overflow 2024-05-02 12:22:28.346 NZST I (36847516) vehicle-poll: Poller[Frame]: Task Queue Overflow 2024-05-02 12:22:28.356 NZST I (36847526) vehicle-poll: Poller[Frame]: Task Queue Overflow 2024-05-02 12:22:28.356 NZST I (36847526) vehicle-poll: Poller[Frame]: Task Queue Overflow 2024-05-02 12:22:28.356 NZST I (36847526) vehicle-poll: Poller[Frame]: Task Queue Overflow 2024-05-02 12:22:28.356 NZST I (36847526) vehicle-poll: Poller[Frame]: Task Queue Overflow On Fri, 3 May 2024 at 05:40, Michael Balzer via OvmsDev < ovmsdev@lists.openvehicles.com> wrote:
A task may delete itself by calling vTaskDelete(NULL) as the final statement, and that's normally a better way to shutdown a task, if you can signal the task it should terminate. Deleting a task from outside may always result in resources taken by the task not being freed, as the task gets terminated wherever it just is.
As the vehicle task also needs to access vehicle data memory, vehicle destruction should not begin until the task has finished, otherwise a task job already running while the vehicle destruction takes place may run into an illegal memory access (access after free). Keep in mind, destructors are executed bottom up, so waiting for the task shutdown within the destructor won't help.
Also, I think "MyCan.DeregisterCallback(TAG)" in ShuttingDown() is now obsolete.
Regards, Michael
Am 02.05.24 um 15:23 schrieb Michael Geddes:
Thanks.
On that race condition... do you think we are better to just delete the task or I saw one recommendation that We can delete it outside the while loop in the task itself!
//.ichael
On Tue, 30 Apr 2024, 17:46 Michael Balzer via OvmsDev, < ovmsdev@lists.openvehicles.com> wrote:
OK, understood & merged, thanks for the quick fix/workaround.
I'll ask the Twizy driver to test this.
Regards, Michael
PS: side note: there's a shutdown race condition arising from `while (!m_is_shutdown)` in the new `OvmsVehicle::VehicleTask()`: if the task receives a message while m_is_shutdown already has been set, it will exit the loop and return from the task function, which isn't allowed. I think FreeRTOS will abort in that case.
Am 30.04.24 um 08:55 schrieb Michael Geddes:
No it will start the poll thread of the poller fine for those that don't use it. That's the last commit.... so that should be covered. When the callback is registered the thread is force started.
This is not to say that what you are suggesting isn't a better way forward... just that it should work.
Michael
On Tue, 30 Apr 2024, 14:51 Michael Balzer via OvmsDev, < ovmsdev@lists.openvehicles.com> wrote:
Michael,
(taking this back to the list, as other developers may have helpful ideas or suggestions)
from a first check, your new patch (PR #1008) won't help for vehicles that don't use the poller, like the generic DBC vehicle or the Fiat 500 (plus possibly non-public third party vehicles). As the poller is normally compiled in, these would need a run time switch to re-enable the vehicle task, or more suitably default into that configuration and switch to the poller task only when the poller gets initialized.
How about moving the task back into the vehicle class, but keeping your task message extensions while doing so, and adding a way for the poller to hook into the task? The dedicated vehicle task is an essential part of the vehicle framework, but I do remember some occasions where a general way to pass custom messages to the vehicle task would have been helpful to use the task for more than CAN processing.
If the poller shall become avaible as a separate service that can be used without any vehicle instance (currently not a defined use case), the construct of a CAN processor task that can be extended for custom messages (or a message processor task that can subscribe to CAN frames) could be factored out into a dedicated class or template. The poller could then create his own instance of that class, if it cannot hook into an existing one.
Btw, in case you're not aware of this, FreeRTOS also provides queue sets (https://www.freertos.org/RTOS-queue-sets.html). We haven't used them in the OVMS yet, but they could be useful, especially if message unions become large or tasks shall be able to dynamically subscribe to different message sources.
Regards, Michael
Am 30.04.24 um 01:20 schrieb Michael Geddes:
It might be worth reverting, but, I've got a patch suggestion that I'll push up which will let me know if I understand everything and which might provide a solution.
If this isn't going to work then revert. (P/R coming)
While the poller was still a part of the vehicle class it was probably still all ok. The poller had taken over what I assume you are talking about as the vehicle task. A call-back fromthe poller was calling IncomingPollRxFrame which was then coming from the (now) poller task (is that correct?)
While we have OVMS_COMP_POLLER config defined, we could just use the poller task to provide the IncomingPollRxFrame call-back from the poller (was vehicle?) task.
The problem is when OVMS_COMP_POLLER is undefined, we need an alternate (maybe we could use the 'Event' loop then) which is when I hacked that bad solution.
//.ichael
I was thinking though that because everything is being queued we could divert some calls into the car
On Mon, 29 Apr 2024, 18:58 Michael Balzer, <dexter@expeedo.de> wrote:
Michael,
I've found a severe design flaw with your poller change. Sorry, I should have seen that before, and shouldn't have merged this.
You have moved the standard CAN frame processing from the vehicle task into the CAN task by changing the vehicle from a CAN listener to a CAN callback processor. That will break all kind of things, vehicles like the Twizy, Smart and many others rely on frame processing being done in the dedicated vehicle task.
This especially induces issues regarding CAN processing capacity, as the vehicles rely on having a separate context and not needing to decouple complex processing of incoming frames. So this will degrade the CAN processing performance seriously in many cases, where additional steps involving file or network I/O need to be done.
So this needs to be changed back.
I assumed you introduced a new dedicated poller task but kept the vehicle task intact. From your naming (OvmsVehicle::IncomingPollRxFrame), it seems you misinterpreted the vehicle task's purpose as only being used for polling.
I assume this isn't a small change…? If so we should revert the poller merge, to avoid having a defunctional edge build state until the fix.
Secondly: logging is generally expensive regardless of the log level control and log channels enabled. Any log message needs to be queued to the log system, so involves a lock and a potential wait state (for the queue) & resulting context switch (= minimum delay of 10 ms). Therefore, logging must be avoided as far as possible in any time critical context, and is forbidden under some circumstances, e.g. in a timer callback (see FreeRTOS docs on this). The log system load multiplies with connected web clients or enabled file logging and enabled debug / verbose level logging -- that quickly becomes too much, usually triggering the task watchdog.
Your logging of nearly all bus events passing to/from the poller (especially the log entry in Queue_PollerFrame) becomes an issue on any vehicle that has high frequency running process data frames on the bus, like the Twizy or Smart. As a counter measure, I've just added a runtime control for all the poller's verbose logging (by default now off), and changed some debug level logs to verbose. Not sure if I've catched all that may need to be silenced by default. Please check all your log calls and place them under the new "trace" control flag wherever appropriate.
This won't help avoiding issues with process data frame buses though.
Shall I revert the poller merge for now?
Regards, Michael
Am 29.04.24 um 06:18 schrieb Michael Geddes:
Btw I included the log changes in the p/r which is a few small commits for the poller.
//.
On Mon, 29 Apr 2024, 07:20 Michael Geddes, <frog@bunyip.wheelycreek.net> wrote:
Hey Michael, I've got to work now (it's Monday), but I suspect those 'giving up' are from unsolicited messages on the bus. I can re-order things so that the message will likely be 'dropped (no poll entry)' rather than the time-out message. And make it a verbose log.
//.ichael
On Mon, 29 Apr 2024 at 00:25, Michael Balzer <dexter@expeedo.de> wrote:
Michael,
forwarding the Twizy logs to you directly, as they contain the user location.
He has just verified it's the new version, he says the module stops responding as soon as he turns on the Twizy.
His description of his actions is a bit ambiguous, and it seems he didn't enable logging to the file persistently.
According to the server, these were the version boot times:
2024-04-28 15:30:56 0 3.3.004-32-g125e0841/ota_0/edge (build idf v3.3.4-849-g6e214dc335 Apr 26 2024 19:16:50) 2024-04-28 16:21:08 0 3.3.004-32-g125e0841/ota_0/edge (build idf v3.3.4-849-g6e214dc335 Apr 26 2024 19:16:50) 2024-04-28 16:38:33 0 3.3.004-63-gf3595561/ota_1/edge (build idf v3.3.4-849-g6e214dc335 Apr 27 2024 07:44:50) 2024-04-28 16:40:57 0 3.3.004-63-gf3595561/ota_1/edge (build idf v3.3.4-849-g6e214dc335 Apr 27 2024 07:44:50) 2024-04-28 16:43:14 0 3.3.004-63-gf3595561/ota_1/edge (build idf v3.3.4-849-g6e214dc335 Apr 27 2024 07:44:50) 2024-04-28 16:46:39 0 3.3.004-63-gf3595561/ota_1/edge (build idf v3.3.4-849-g6e214dc335 Apr 27 2024 07:44:50) 2024-04-28 16:54:44 0 3.3.004-32-g125e0841/ota_0/edge (build idf v3.3.4-849-g6e214dc335 Apr 26 2024 19:16:50)
Attached is also his crash debug log -- a2ll doesn't tell much about what happened, but maybe you get an idea from this.
After the boot at 16:46, there are immediately lots of these messages:
2024-04-28 16:46:33.792 CEST D (39042) vehicle-poll: Poller: Queue PollerFrame() 2024-04-28 16:46:33.792 CEST D (39042) vehicle-poll: [1]Poller: Incoming - giving up
Regards, Michael
Am 28.04.24 um 16:44 schrieb Michael Geddes:
Ah. OK.
I could try to fix the vin thing using the new way of doing it and get rid of a semaphore? It would at least identify the problem possibly?
Michael
On Sun, 28 Apr 2024, 22:32 Michael Balzer via OvmsDev, < ovmsdev@lists.openvehicles.com> wrote:
> Not sure if that's the problem, but I've found a different behaviour > with the new PollSetState() implementation. > > The old version only did anything if the new state actually was > different from the previous one. The Twizy relies on this behaviour, > calling PollSetState() from the per second ticker (see > OvmsVehicleRenaultTwizy::ObdTicker1). > > The new implementation apparently always sends the PollState command > to the task, and that in turn always at least locks the poller mutex. Not > sure if/how that could cause the observed issues, but it definitely adds > quite some (unnecessary?) lock/unlock operations. > > > > Am 28.04.24 um 16:05 schrieb Michael Balzer via OvmsDev: > > The Twizy uses the poller to query the VIN (once) and DTCs (every 10 > seconds while driving), see rt_obd2.cpp. > > It also has its own version of the OBD single request > (OvmsVehicleRenaultTwizy::ObdRequest), which was the precursor for the > generalized version. This is used by custom/user Twizy plugins and scripts > to access ECU internals. > > The Twizy doesn't use IncomingPollRxFrame, but the Twizy's > IncomingPollReply handler will log any poll responses it doesn't know > about, so that could lead to a lot of log output if something goes wrong > there. > > > Am 28.04.24 um 15:49 schrieb Michael Geddes via OvmsDev: > > AFAICT the twizzy doesn't use the poller list at all. So is it > missing a call-back or something?? > > I can see a potential problem with IncomingPollRxFrame being called > twice as much as it should be but only when there is a poll list. Maybe > commenting out this would do it. (I can find another away to get this > called on the thread I want). This might be the problem with the smarted > > void OvmsVehicle::OvmsVehicleSignal::IncomingPollRxFrame(canbus* > bus, CAN_frame_t *frame, bool success) > { > //if (Ready()) > // m_parent->IncomingPollRxFrame(frame, success); > } > > //. > > > On Sun, 28 Apr 2024 at 21:10, Michael Balzer via OvmsDev < > ovmsdev@lists.openvehicles.com> wrote: > >> There may also be an issue with the Renault Twizy, I've received a >> report of a user who is using the edge builds, that the latest build >> wouldn't work. >> >> He reports all kinds of errors and warnings signaled by the car >> during driving, and switching back to the previous build fixed the issues. >> >> I've asked him to provide a debug log excerpt if possible. >> >> Regards, >> Michael >> >> >> Am 28.04.24 um 14:29 schrieb Michael Geddes via OvmsDev: >> >> OK. That's bad. >> >> Does the reading work in general? >> >> Is it just the writing commands? >> >> Raise a ticket on github and tag me in and we can address it that >> way. >> >> Michael >> >> On Sun, 28 Apr 2024, 19:49 Thomas Heuer via OvmsDev, < >> ovmsdev@lists.openvehicles.com> wrote: >> >>> Hi, >>> >>> >>> >>> The new poller code doesn't seem to work properly with the smarted. >>> >>> D (218831) vehicle-poll: [1]PollerNextTick(PRI): cycle complete >>> for ticker=215 >>> >>> V (218831) vehicle-poll: Standard Poll Series: List reset >>> >>> D (218831) vehicle-poll: >>> PollSeriesList::NextPollEntry[!v.standard]: ReachedEnd >>> >>> V (218831) vehicle-poll: [1]PollerSend: Poller Reached End >>> >>> D (219691) vehicle-poll: Poller: Queue PollerFrame() >>> >>> D (219691) vehicle-poll: Poller: Queue PollerFrame() >>> >>> V (219691) vehicle-poll: Pollers: FrameRx(bus=2) >>> >>> D (219691) vehicle-poll: Poller: Queue PollerFrame() >>> >>> V (219691) vehicle-poll: Pollers: FrameRx(bus=2) >>> >>> V (219691) vehicle-poll: Pollers: FrameRx(bus=2) >>> >>> D (219691) vehicle-poll: Poller: Queue PollerFrame() >>> >>> *OVMS#* unlock 22 >>> Vehicle unlocked >>> >>> V (219691) vehicle-poll: Pollers: FrameRx(bus=2) >>> >>> D (219691) vehicle-poll: Poller: Queue PollerFrame() >>> >>> V (219691) vehicle-poll: Pollers: FrameRx(bus=2) >>> >>> D (219701) vehicle-poll: Poller: Queue PollerFrame() >>> >>> V (219701) vehicle-poll: Pollers: FrameRx(bus=2) >>> >>> D (219701) vehicle-poll: Poller: Queue PollerFrame() >>> >>> V (219701) vehicle-poll: Pollers: FrameRx(bus=2) >>> >>> D (219701) vehicle-poll: Poller: Queue PollerFrame() >>> >>> V (219701) vehicle-poll: Pollers: FrameRx(bus=2) >>> >>> D (219701) vehicle-poll: Poller: Queue PollerFrame() >>> >>> V (219701) vehicle-poll: Pollers: FrameRx(bus=2) >>> >>> D (219701) vehicle-poll: Poller: Queue PollerFrame() >>> >>> V (219701) vehicle-poll: Pollers: FrameRx(bus=2) >>> >>> D (219701) vehicle-poll: Poller: Queue PollerFrame() >>> >>> V (219701) vehicle-poll: Pollers: FrameRx(bus=2) >>> >>> D (219701) vehicle-poll: Poller: Queue PollerFrame() >>> >>> V (219701) vehicle-poll: Pollers: FrameRx(bus=2) >>> >>> D (219701) vehicle-poll: Poller: Queue PollerFrame() >>> >>> V (219701) vehicle-poll: Pollers: FrameRx(bus=2) >>> >>> D (219701) vehicle-poll: Poller: Queue PollerFrame() >>> >>> V (219701) vehicle-poll: Pollers: FrameRx(bus=2) >>> >>> D (219701) vehicle-poll: Poller: Queue PollerFrame() >>> >>> V (219701) vehicle-poll: Pollers: FrameRx(bus=2) >>> >>> D (219701) vehicle-poll: Poller: Queue PollerFrame() >>> >>> >>> >>> >>> >>> *Von:* OvmsDev <ovmsdev-bounces@lists.openvehicles.com> *Im >>> Auftrag von *Michael Geddes via OvmsDev >>> *Gesendet:* Sonntag, 28. April 2024 12:27 >>> *An:* OVMS Developers <ovmsdev@lists.openvehicles.com> >>> *Cc:* Michael Geddes <frog@bunyip.wheelycreek.net> >>> *Betreff:* [Ovmsdev] OVMS Poller module/singleton >>> >>> >>> >>> Hey all, >>> >>> >>> >>> The poller singleton code that I've been working on for over a >>> year now is merged in. (Thanks Michael for expediting the final step). >>> >>> >>> >>> This includes separate multi-frame states per bus and multiple >>> poll lists as well as non-blocking one off queries. As well as more >>> 'states'. >>> >>> >>> >>> I have included some programming documentation in the change but >>> am happy to supply more if needed. >>> >>> >>> >>> The ioniq 5 code has some examples of how it can be used. Some >>> examples are: >>> >>> >>> >>> * grabbing the vin as a one shot without blocking >>> >>> * having a short list of queries that are polled quickly for >>> obd2ecu (this also demonstrates using a shorter frame break value and then >>> a break after successful a response) >>> >>> >>> >>> Have a play please! >>> >>> >>> >>> Also interested in hearing what user tools might be worth looking >>> at next for the poller object. >>> >>> >>> >>> //.ichael G. >>> >>> >>> >>> >>> >>> >>> >>> >>> _______________________________________________ >>> OvmsDev mailing list >>> OvmsDev@lists.openvehicles.com >>> http://lists.openvehicles.com/mailman/listinfo/ovmsdev >>> >> >> _______________________________________________ >> OvmsDev mailing listOvmsDev@lists.openvehicles.comhttp://lists.openvehicles.com/mailman/listinfo/ovmsdev >> >> >> -- >> Michael Balzer * Helkenberger Weg 9 * D-58256 Ennepetal >> Fon 02333 / 833 5735 * Handy 0176 / 206 989 26 >> >> _______________________________________________ >> OvmsDev mailing list >> OvmsDev@lists.openvehicles.com >> http://lists.openvehicles.com/mailman/listinfo/ovmsdev >> > > _______________________________________________ > OvmsDev mailing listOvmsDev@lists.openvehicles.comhttp://lists.openvehicles.com/mailman/listinfo/ovmsdev > > > -- > Michael Balzer * Helkenberger Weg 9 * D-58256 Ennepetal > Fon 02333 / 833 5735 * Handy 0176 / 206 989 26 > > > _______________________________________________ > OvmsDev mailing listOvmsDev@lists.openvehicles.comhttp://lists.openvehicles.com/mailman/listinfo/ovmsdev > > > -- > Michael Balzer * Helkenberger Weg 9 * D-58256 Ennepetal > Fon 02333 / 833 5735 * Handy 0176 / 206 989 26 > > _______________________________________________ > OvmsDev mailing list > OvmsDev@lists.openvehicles.com > http://lists.openvehicles.com/mailman/listinfo/ovmsdev >
-- Michael Balzer * Helkenberger Weg 9 * D-58256 Ennepetal Fon 02333 / 833 5735 * Handy 0176 / 206 989 26
-- Michael Balzer * Helkenberger Weg 9 * D-58256 Ennepetal Fon 02333 / 833 5735 * Handy 0176 / 206 989 26
-- Michael Balzer * Helkenberger Weg 9 * D-58256 Ennepetal Fon 02333 / 833 5735 * Handy 0176 / 206 989 26
_______________________________________________ OvmsDev mailing list OvmsDev@lists.openvehicles.com http://lists.openvehicles.com/mailman/listinfo/ovmsdev
-- Michael Balzer * Helkenberger Weg 9 * D-58256 Ennepetal Fon 02333 / 833 5735 * Handy 0176 / 206 989 26
_______________________________________________ OvmsDev mailing list OvmsDev@lists.openvehicles.com http://lists.openvehicles.com/mailman/listinfo/ovmsdev
-- Michael Balzer * Helkenberger Weg 9 * D-58256 Ennepetal Fon 02333 / 833 5735 * Handy 0176 / 206 989 26
_______________________________________________ OvmsDev mailing list OvmsDev@lists.openvehicles.com http://lists.openvehicles.com/mailman/listinfo/ovmsdev
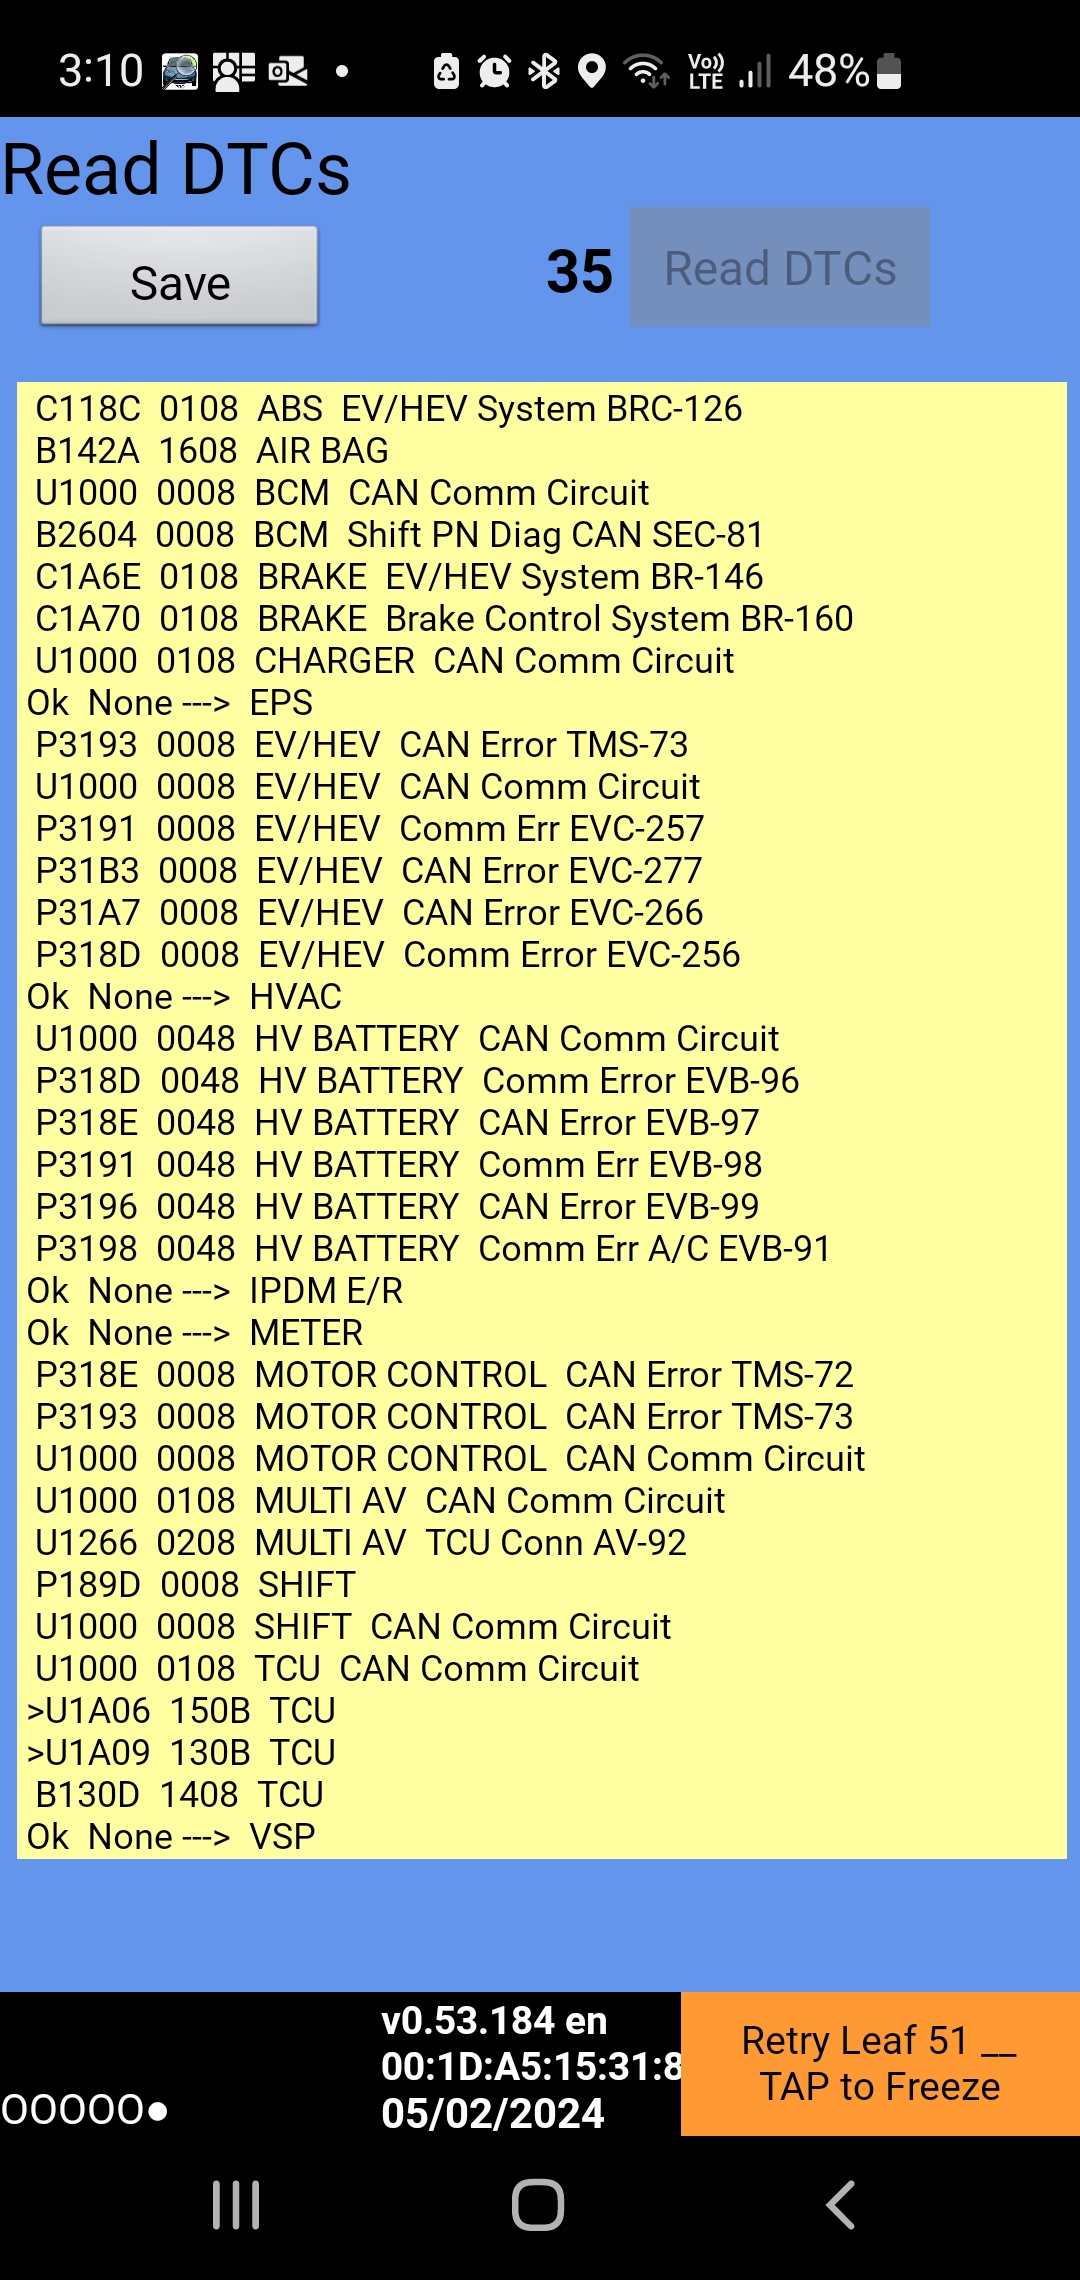
Thanks that is definitely weird. Will check it out in detail tomorrow. Michael On Fri, 3 May 2024, 19:10 Derek Caudwell via OvmsDev, < ovmsdev@lists.openvehicles.com> wrote:
Hi Michael,
When running firmware 3.3.004-74-gbd4e7196 on my Nissan Leaf I suspect (but can't be 100% sure as it's only been 24h without fault) the new poller caused the car to throw the attached faults from overloading the can bus whilst driving. The fault was sufficient to send the car into limp mode and could not be driven until cleared with LeafSpy. Ovms should not be polling in the driving state, so I'm not sure why the poller is overflowing.
The ovms log repeats this overflow in rapid succession right before the failure occurred. I have since reverted to an earlier version and it might be advisable for other Leaf owners to do so until the new poller is fully operational.
2024-05-02 12:22:28.316 NZST I (36847486) vehicle-poll: Poller[Frame]: Task Queue Overflow
2024-05-02 12:22:28.316 NZST I (36847486) vehicle-poll: Poller[Frame]: Task Queue Overflow
2024-05-02 12:22:28.316 NZST I (36847486) vehicle-poll: Poller[Frame]: Task Queue Overflow
2024-05-02 12:22:28.326 NZST I (36847496) vehicle-poll: Poller[Frame]: Task Queue Overflow
2024-05-02 12:22:28.326 NZST I (36847496) vehicle-poll: Poller[Frame]: Task Queue Overflow
2024-05-02 12:22:28.326 NZST I (36847496) vehicle-poll: Poller[Frame]: Task Queue Overflow
2024-05-02 12:22:28.326 NZST I (36847496) vehicle-poll: Poller[Frame]: Task Queue Overflow
2024-05-02 12:22:28.326 NZST I (36847496) vehicle-poll: Poller[Frame]: Task Queue Overflow
2024-05-02 12:22:28.326 NZST I (36847496) vehicle-poll: Poller[Frame]: Task Queue Overflow
2024-05-02 12:22:28.326 NZST I (36847496) vehicle-poll: Poller[Frame]: Task Queue Overflow
2024-05-02 12:22:28.326 NZST I (36847496) vehicle-poll: Poller[Frame]: Task Queue Overflow
2024-05-02 12:22:28.336 NZST I (36847506) vehicle-poll: Poller[Frame]: Task Queue Overflow
2024-05-02 12:22:28.336 NZST I (36847506) vehicle-poll: Poller[Frame]: Task Queue Overflow
2024-05-02 12:22:28.336 NZST I (36847506) vehicle-poll: Poller[Frame]: Task Queue Overflow
2024-05-02 12:22:28.336 NZST I (36847506) vehicle-poll: Poller[Frame]: Task Queue Overflow
2024-05-02 12:22:28.346 NZST I (36847516) vehicle-poll: Poller[Frame]: Task Queue Overflow
2024-05-02 12:22:28.346 NZST I (36847516) vehicle-poll: Poller[Frame]: Task Queue Overflow
2024-05-02 12:22:28.346 NZST I (36847516) vehicle-poll: Poller[Frame]: Task Queue Overflow
2024-05-02 12:22:28.346 NZST I (36847516) vehicle-poll: Poller[Frame]: Task Queue Overflow
2024-05-02 12:22:28.356 NZST I (36847526) vehicle-poll: Poller[Frame]: Task Queue Overflow
2024-05-02 12:22:28.356 NZST I (36847526) vehicle-poll: Poller[Frame]: Task Queue Overflow
2024-05-02 12:22:28.356 NZST I (36847526) vehicle-poll: Poller[Frame]: Task Queue Overflow
2024-05-02 12:22:28.356 NZST I (36847526) vehicle-poll: Poller[Frame]: Task Queue Overflow
On Fri, 3 May 2024 at 05:40, Michael Balzer via OvmsDev < ovmsdev@lists.openvehicles.com> wrote:
A task may delete itself by calling vTaskDelete(NULL) as the final statement, and that's normally a better way to shutdown a task, if you can signal the task it should terminate. Deleting a task from outside may always result in resources taken by the task not being freed, as the task gets terminated wherever it just is.
As the vehicle task also needs to access vehicle data memory, vehicle destruction should not begin until the task has finished, otherwise a task job already running while the vehicle destruction takes place may run into an illegal memory access (access after free). Keep in mind, destructors are executed bottom up, so waiting for the task shutdown within the destructor won't help.
Also, I think "MyCan.DeregisterCallback(TAG)" in ShuttingDown() is now obsolete.
Regards, Michael
Am 02.05.24 um 15:23 schrieb Michael Geddes:
Thanks.
On that race condition... do you think we are better to just delete the task or I saw one recommendation that We can delete it outside the while loop in the task itself!
//.ichael
On Tue, 30 Apr 2024, 17:46 Michael Balzer via OvmsDev, < ovmsdev@lists.openvehicles.com> wrote:
OK, understood & merged, thanks for the quick fix/workaround.
I'll ask the Twizy driver to test this.
Regards, Michael
PS: side note: there's a shutdown race condition arising from `while (!m_is_shutdown)` in the new `OvmsVehicle::VehicleTask()`: if the task receives a message while m_is_shutdown already has been set, it will exit the loop and return from the task function, which isn't allowed. I think FreeRTOS will abort in that case.
Am 30.04.24 um 08:55 schrieb Michael Geddes:
No it will start the poll thread of the poller fine for those that don't use it. That's the last commit.... so that should be covered. When the callback is registered the thread is force started.
This is not to say that what you are suggesting isn't a better way forward... just that it should work.
Michael
On Tue, 30 Apr 2024, 14:51 Michael Balzer via OvmsDev, < ovmsdev@lists.openvehicles.com> wrote:
Michael,
(taking this back to the list, as other developers may have helpful ideas or suggestions)
from a first check, your new patch (PR #1008) won't help for vehicles that don't use the poller, like the generic DBC vehicle or the Fiat 500 (plus possibly non-public third party vehicles). As the poller is normally compiled in, these would need a run time switch to re-enable the vehicle task, or more suitably default into that configuration and switch to the poller task only when the poller gets initialized.
How about moving the task back into the vehicle class, but keeping your task message extensions while doing so, and adding a way for the poller to hook into the task? The dedicated vehicle task is an essential part of the vehicle framework, but I do remember some occasions where a general way to pass custom messages to the vehicle task would have been helpful to use the task for more than CAN processing.
If the poller shall become avaible as a separate service that can be used without any vehicle instance (currently not a defined use case), the construct of a CAN processor task that can be extended for custom messages (or a message processor task that can subscribe to CAN frames) could be factored out into a dedicated class or template. The poller could then create his own instance of that class, if it cannot hook into an existing one.
Btw, in case you're not aware of this, FreeRTOS also provides queue sets (https://www.freertos.org/RTOS-queue-sets.html). We haven't used them in the OVMS yet, but they could be useful, especially if message unions become large or tasks shall be able to dynamically subscribe to different message sources.
Regards, Michael
Am 30.04.24 um 01:20 schrieb Michael Geddes:
It might be worth reverting, but, I've got a patch suggestion that I'll push up which will let me know if I understand everything and which might provide a solution.
If this isn't going to work then revert. (P/R coming)
While the poller was still a part of the vehicle class it was probably still all ok. The poller had taken over what I assume you are talking about as the vehicle task. A call-back fromthe poller was calling IncomingPollRxFrame which was then coming from the (now) poller task (is that correct?)
While we have OVMS_COMP_POLLER config defined, we could just use the poller task to provide the IncomingPollRxFrame call-back from the poller (was vehicle?) task.
The problem is when OVMS_COMP_POLLER is undefined, we need an alternate (maybe we could use the 'Event' loop then) which is when I hacked that bad solution.
//.ichael
I was thinking though that because everything is being queued we could divert some calls into the car
On Mon, 29 Apr 2024, 18:58 Michael Balzer, <dexter@expeedo.de> wrote:
Michael,
I've found a severe design flaw with your poller change. Sorry, I should have seen that before, and shouldn't have merged this.
You have moved the standard CAN frame processing from the vehicle task into the CAN task by changing the vehicle from a CAN listener to a CAN callback processor. That will break all kind of things, vehicles like the Twizy, Smart and many others rely on frame processing being done in the dedicated vehicle task.
This especially induces issues regarding CAN processing capacity, as the vehicles rely on having a separate context and not needing to decouple complex processing of incoming frames. So this will degrade the CAN processing performance seriously in many cases, where additional steps involving file or network I/O need to be done.
So this needs to be changed back.
I assumed you introduced a new dedicated poller task but kept the vehicle task intact. From your naming (OvmsVehicle::IncomingPollRxFrame), it seems you misinterpreted the vehicle task's purpose as only being used for polling.
I assume this isn't a small change…? If so we should revert the poller merge, to avoid having a defunctional edge build state until the fix.
Secondly: logging is generally expensive regardless of the log level control and log channels enabled. Any log message needs to be queued to the log system, so involves a lock and a potential wait state (for the queue) & resulting context switch (= minimum delay of 10 ms). Therefore, logging must be avoided as far as possible in any time critical context, and is forbidden under some circumstances, e.g. in a timer callback (see FreeRTOS docs on this). The log system load multiplies with connected web clients or enabled file logging and enabled debug / verbose level logging -- that quickly becomes too much, usually triggering the task watchdog.
Your logging of nearly all bus events passing to/from the poller (especially the log entry in Queue_PollerFrame) becomes an issue on any vehicle that has high frequency running process data frames on the bus, like the Twizy or Smart. As a counter measure, I've just added a runtime control for all the poller's verbose logging (by default now off), and changed some debug level logs to verbose. Not sure if I've catched all that may need to be silenced by default. Please check all your log calls and place them under the new "trace" control flag wherever appropriate.
This won't help avoiding issues with process data frame buses though.
Shall I revert the poller merge for now?
Regards, Michael
Am 29.04.24 um 06:18 schrieb Michael Geddes:
Btw I included the log changes in the p/r which is a few small commits for the poller.
//.
On Mon, 29 Apr 2024, 07:20 Michael Geddes, < frog@bunyip.wheelycreek.net> wrote:
Hey Michael, I've got to work now (it's Monday), but I suspect those 'giving up' are from unsolicited messages on the bus. I can re-order things so that the message will likely be 'dropped (no poll entry)' rather than the time-out message. And make it a verbose log.
//.ichael
On Mon, 29 Apr 2024 at 00:25, Michael Balzer <dexter@expeedo.de> wrote:
> Michael, > > forwarding the Twizy logs to you directly, as they contain the user > location. > > He has just verified it's the new version, he says the module stops > responding as soon as he turns on the Twizy. > > His description of his actions is a bit ambiguous, and it seems he > didn't enable logging to the file persistently. > > According to the server, these were the version boot times: > > 2024-04-28 15:30:56 0 3.3.004-32-g125e0841/ota_0/edge (build > idf v3.3.4-849-g6e214dc335 Apr 26 2024 19:16:50) > 2024-04-28 16:21:08 0 3.3.004-32-g125e0841/ota_0/edge (build > idf v3.3.4-849-g6e214dc335 Apr 26 2024 19:16:50) > 2024-04-28 16:38:33 0 3.3.004-63-gf3595561/ota_1/edge (build > idf v3.3.4-849-g6e214dc335 Apr 27 2024 07:44:50) > 2024-04-28 16:40:57 0 3.3.004-63-gf3595561/ota_1/edge (build > idf v3.3.4-849-g6e214dc335 Apr 27 2024 07:44:50) > 2024-04-28 16:43:14 0 3.3.004-63-gf3595561/ota_1/edge (build > idf v3.3.4-849-g6e214dc335 Apr 27 2024 07:44:50) > 2024-04-28 16:46:39 0 3.3.004-63-gf3595561/ota_1/edge (build > idf v3.3.4-849-g6e214dc335 Apr 27 2024 07:44:50) > 2024-04-28 16:54:44 0 3.3.004-32-g125e0841/ota_0/edge (build > idf v3.3.4-849-g6e214dc335 Apr 26 2024 19:16:50) > > Attached is also his crash debug log -- a2ll doesn't tell much about > what happened, but maybe you get an idea from this. > > After the boot at 16:46, there are immediately lots of these > messages: > > 2024-04-28 16:46:33.792 CEST D (39042) vehicle-poll: Poller: Queue > PollerFrame() > 2024-04-28 16:46:33.792 CEST D (39042) vehicle-poll: [1]Poller: > Incoming - giving up > > Regards, > Michael > > > Am 28.04.24 um 16:44 schrieb Michael Geddes: > > Ah. OK. > > I could try to fix the vin thing using the new way of doing it and > get rid of a semaphore? > It would at least identify the problem possibly? > > Michael > > > On Sun, 28 Apr 2024, 22:32 Michael Balzer via OvmsDev, < > ovmsdev@lists.openvehicles.com> wrote: > >> Not sure if that's the problem, but I've found a different >> behaviour with the new PollSetState() implementation. >> >> The old version only did anything if the new state actually was >> different from the previous one. The Twizy relies on this behaviour, >> calling PollSetState() from the per second ticker (see >> OvmsVehicleRenaultTwizy::ObdTicker1). >> >> The new implementation apparently always sends the PollState >> command to the task, and that in turn always at least locks the poller >> mutex. Not sure if/how that could cause the observed issues, but it >> definitely adds quite some (unnecessary?) lock/unlock operations. >> >> >> >> Am 28.04.24 um 16:05 schrieb Michael Balzer via OvmsDev: >> >> The Twizy uses the poller to query the VIN (once) and DTCs (every >> 10 seconds while driving), see rt_obd2.cpp. >> >> It also has its own version of the OBD single request >> (OvmsVehicleRenaultTwizy::ObdRequest), which was the precursor for the >> generalized version. This is used by custom/user Twizy plugins and scripts >> to access ECU internals. >> >> The Twizy doesn't use IncomingPollRxFrame, but the Twizy's >> IncomingPollReply handler will log any poll responses it doesn't know >> about, so that could lead to a lot of log output if something goes wrong >> there. >> >> >> Am 28.04.24 um 15:49 schrieb Michael Geddes via OvmsDev: >> >> AFAICT the twizzy doesn't use the poller list at all. So is it >> missing a call-back or something?? >> >> I can see a potential problem with IncomingPollRxFrame being called >> twice as much as it should be but only when there is a poll list. Maybe >> commenting out this would do it. (I can find another away to get this >> called on the thread I want). This might be the problem with the smarted >> >> void OvmsVehicle::OvmsVehicleSignal::IncomingPollRxFrame(canbus* >> bus, CAN_frame_t *frame, bool success) >> { >> //if (Ready()) >> // m_parent->IncomingPollRxFrame(frame, success); >> } >> >> //. >> >> >> On Sun, 28 Apr 2024 at 21:10, Michael Balzer via OvmsDev < >> ovmsdev@lists.openvehicles.com> wrote: >> >>> There may also be an issue with the Renault Twizy, I've received a >>> report of a user who is using the edge builds, that the latest build >>> wouldn't work. >>> >>> He reports all kinds of errors and warnings signaled by the car >>> during driving, and switching back to the previous build fixed the issues. >>> >>> I've asked him to provide a debug log excerpt if possible. >>> >>> Regards, >>> Michael >>> >>> >>> Am 28.04.24 um 14:29 schrieb Michael Geddes via OvmsDev: >>> >>> OK. That's bad. >>> >>> Does the reading work in general? >>> >>> Is it just the writing commands? >>> >>> Raise a ticket on github and tag me in and we can address it that >>> way. >>> >>> Michael >>> >>> On Sun, 28 Apr 2024, 19:49 Thomas Heuer via OvmsDev, < >>> ovmsdev@lists.openvehicles.com> wrote: >>> >>>> Hi, >>>> >>>> >>>> >>>> The new poller code doesn't seem to work properly with the >>>> smarted. >>>> >>>> D (218831) vehicle-poll: [1]PollerNextTick(PRI): cycle complete >>>> for ticker=215 >>>> >>>> V (218831) vehicle-poll: Standard Poll Series: List reset >>>> >>>> D (218831) vehicle-poll: >>>> PollSeriesList::NextPollEntry[!v.standard]: ReachedEnd >>>> >>>> V (218831) vehicle-poll: [1]PollerSend: Poller Reached End >>>> >>>> D (219691) vehicle-poll: Poller: Queue PollerFrame() >>>> >>>> D (219691) vehicle-poll: Poller: Queue PollerFrame() >>>> >>>> V (219691) vehicle-poll: Pollers: FrameRx(bus=2) >>>> >>>> D (219691) vehicle-poll: Poller: Queue PollerFrame() >>>> >>>> V (219691) vehicle-poll: Pollers: FrameRx(bus=2) >>>> >>>> V (219691) vehicle-poll: Pollers: FrameRx(bus=2) >>>> >>>> D (219691) vehicle-poll: Poller: Queue PollerFrame() >>>> >>>> *OVMS#* unlock 22 >>>> Vehicle unlocked >>>> >>>> V (219691) vehicle-poll: Pollers: FrameRx(bus=2) >>>> >>>> D (219691) vehicle-poll: Poller: Queue PollerFrame() >>>> >>>> V (219691) vehicle-poll: Pollers: FrameRx(bus=2) >>>> >>>> D (219701) vehicle-poll: Poller: Queue PollerFrame() >>>> >>>> V (219701) vehicle-poll: Pollers: FrameRx(bus=2) >>>> >>>> D (219701) vehicle-poll: Poller: Queue PollerFrame() >>>> >>>> V (219701) vehicle-poll: Pollers: FrameRx(bus=2) >>>> >>>> D (219701) vehicle-poll: Poller: Queue PollerFrame() >>>> >>>> V (219701) vehicle-poll: Pollers: FrameRx(bus=2) >>>> >>>> D (219701) vehicle-poll: Poller: Queue PollerFrame() >>>> >>>> V (219701) vehicle-poll: Pollers: FrameRx(bus=2) >>>> >>>> D (219701) vehicle-poll: Poller: Queue PollerFrame() >>>> >>>> V (219701) vehicle-poll: Pollers: FrameRx(bus=2) >>>> >>>> D (219701) vehicle-poll: Poller: Queue PollerFrame() >>>> >>>> V (219701) vehicle-poll: Pollers: FrameRx(bus=2) >>>> >>>> D (219701) vehicle-poll: Poller: Queue PollerFrame() >>>> >>>> V (219701) vehicle-poll: Pollers: FrameRx(bus=2) >>>> >>>> D (219701) vehicle-poll: Poller: Queue PollerFrame() >>>> >>>> V (219701) vehicle-poll: Pollers: FrameRx(bus=2) >>>> >>>> D (219701) vehicle-poll: Poller: Queue PollerFrame() >>>> >>>> V (219701) vehicle-poll: Pollers: FrameRx(bus=2) >>>> >>>> D (219701) vehicle-poll: Poller: Queue PollerFrame() >>>> >>>> V (219701) vehicle-poll: Pollers: FrameRx(bus=2) >>>> >>>> D (219701) vehicle-poll: Poller: Queue PollerFrame() >>>> >>>> >>>> >>>> >>>> >>>> *Von:* OvmsDev <ovmsdev-bounces@lists.openvehicles.com> *Im >>>> Auftrag von *Michael Geddes via OvmsDev >>>> *Gesendet:* Sonntag, 28. April 2024 12:27 >>>> *An:* OVMS Developers <ovmsdev@lists.openvehicles.com> >>>> *Cc:* Michael Geddes <frog@bunyip.wheelycreek.net> >>>> *Betreff:* [Ovmsdev] OVMS Poller module/singleton >>>> >>>> >>>> >>>> Hey all, >>>> >>>> >>>> >>>> The poller singleton code that I've been working on for over a >>>> year now is merged in. (Thanks Michael for expediting the final step). >>>> >>>> >>>> >>>> This includes separate multi-frame states per bus and multiple >>>> poll lists as well as non-blocking one off queries. As well as more >>>> 'states'. >>>> >>>> >>>> >>>> I have included some programming documentation in the change but >>>> am happy to supply more if needed. >>>> >>>> >>>> >>>> The ioniq 5 code has some examples of how it can be used. Some >>>> examples are: >>>> >>>> >>>> >>>> * grabbing the vin as a one shot without blocking >>>> >>>> * having a short list of queries that are polled quickly for >>>> obd2ecu (this also demonstrates using a shorter frame break value and then >>>> a break after successful a response) >>>> >>>> >>>> >>>> Have a play please! >>>> >>>> >>>> >>>> Also interested in hearing what user tools might be worth looking >>>> at next for the poller object. >>>> >>>> >>>> >>>> //.ichael G. >>>> >>>> >>>> >>>> >>>> >>>> >>>> >>>> >>>> _______________________________________________ >>>> OvmsDev mailing list >>>> OvmsDev@lists.openvehicles.com >>>> http://lists.openvehicles.com/mailman/listinfo/ovmsdev >>>> >>> >>> _______________________________________________ >>> OvmsDev mailing listOvmsDev@lists.openvehicles.comhttp://lists.openvehicles.com/mailman/listinfo/ovmsdev >>> >>> >>> -- >>> Michael Balzer * Helkenberger Weg 9 * D-58256 Ennepetal >>> Fon 02333 / 833 5735 * Handy 0176 / 206 989 26 >>> >>> _______________________________________________ >>> OvmsDev mailing list >>> OvmsDev@lists.openvehicles.com >>> http://lists.openvehicles.com/mailman/listinfo/ovmsdev >>> >> >> _______________________________________________ >> OvmsDev mailing listOvmsDev@lists.openvehicles.comhttp://lists.openvehicles.com/mailman/listinfo/ovmsdev >> >> >> -- >> Michael Balzer * Helkenberger Weg 9 * D-58256 Ennepetal >> Fon 02333 / 833 5735 * Handy 0176 / 206 989 26 >> >> >> _______________________________________________ >> OvmsDev mailing listOvmsDev@lists.openvehicles.comhttp://lists.openvehicles.com/mailman/listinfo/ovmsdev >> >> >> -- >> Michael Balzer * Helkenberger Weg 9 * D-58256 Ennepetal >> Fon 02333 / 833 5735 * Handy 0176 / 206 989 26 >> >> _______________________________________________ >> OvmsDev mailing list >> OvmsDev@lists.openvehicles.com >> http://lists.openvehicles.com/mailman/listinfo/ovmsdev >> > > -- > Michael Balzer * Helkenberger Weg 9 * D-58256 Ennepetal > Fon 02333 / 833 5735 * Handy 0176 / 206 989 26 > > -- Michael Balzer * Helkenberger Weg 9 * D-58256 Ennepetal Fon 02333 / 833 5735 * Handy 0176 / 206 989 26
-- Michael Balzer * Helkenberger Weg 9 * D-58256 Ennepetal Fon 02333 / 833 5735 * Handy 0176 / 206 989 26
_______________________________________________ OvmsDev mailing list OvmsDev@lists.openvehicles.com http://lists.openvehicles.com/mailman/listinfo/ovmsdev
-- Michael Balzer * Helkenberger Weg 9 * D-58256 Ennepetal Fon 02333 / 833 5735 * Handy 0176 / 206 989 26
_______________________________________________ OvmsDev mailing list OvmsDev@lists.openvehicles.com http://lists.openvehicles.com/mailman/listinfo/ovmsdev
-- Michael Balzer * Helkenberger Weg 9 * D-58256 Ennepetal Fon 02333 / 833 5735 * Handy 0176 / 206 989 26
_______________________________________________ OvmsDev mailing list OvmsDev@lists.openvehicles.com http://lists.openvehicles.com/mailman/listinfo/ovmsdev
_______________________________________________ OvmsDev mailing list OvmsDev@lists.openvehicles.com http://lists.openvehicles.com/mailman/listinfo/ovmsdev
The Twizy feedback looks better, 3.3.004-74-gbd4e7196 seems to be fully functional again. Regards, Michael Am 03.05.24 um 13:35 schrieb Michael Geddes via OvmsDev:
Thanks that is definitely weird. Will check it out in detail tomorrow.
Michael
On Fri, 3 May 2024, 19:10 Derek Caudwell via OvmsDev, <ovmsdev@lists.openvehicles.com> wrote:
Hi Michael,
When running firmware 3.3.004-74-gbd4e7196 on my Nissan Leaf I suspect (but can't be 100% sure as it's only been 24h without fault) the new poller caused the car to throw the attached faults from overloading the can bus whilst driving. The fault was sufficient to send the car into limp mode and could not be driven until cleared with LeafSpy. Ovms should not be polling in the driving state, so I'm not sure why the poller is overflowing.
The ovms log repeats this overflow in rapid succession right before the failure occurred. I have since reverted to an earlier version and it might be advisable for other Leaf owners to do so until the new poller is fully operational.
2024-05-02 12:22:28.316 NZST I (36847486) vehicle-poll: Poller[Frame]: Task Queue Overflow
2024-05-02 12:22:28.316 NZST I (36847486) vehicle-poll: Poller[Frame]: Task Queue Overflow
2024-05-02 12:22:28.316 NZST I (36847486) vehicle-poll: Poller[Frame]: Task Queue Overflow
2024-05-02 12:22:28.326 NZST I (36847496) vehicle-poll: Poller[Frame]: Task Queue Overflow
2024-05-02 12:22:28.326 NZST I (36847496) vehicle-poll: Poller[Frame]: Task Queue Overflow
2024-05-02 12:22:28.326 NZST I (36847496) vehicle-poll: Poller[Frame]: Task Queue Overflow
2024-05-02 12:22:28.326 NZST I (36847496) vehicle-poll: Poller[Frame]: Task Queue Overflow
2024-05-02 12:22:28.326 NZST I (36847496) vehicle-poll: Poller[Frame]: Task Queue Overflow
2024-05-02 12:22:28.326 NZST I (36847496) vehicle-poll: Poller[Frame]: Task Queue Overflow
2024-05-02 12:22:28.326 NZST I (36847496) vehicle-poll: Poller[Frame]: Task Queue Overflow
2024-05-02 12:22:28.326 NZST I (36847496) vehicle-poll: Poller[Frame]: Task Queue Overflow
2024-05-02 12:22:28.336 NZST I (36847506) vehicle-poll: Poller[Frame]: Task Queue Overflow
2024-05-02 12:22:28.336 NZST I (36847506) vehicle-poll: Poller[Frame]: Task Queue Overflow
2024-05-02 12:22:28.336 NZST I (36847506) vehicle-poll: Poller[Frame]: Task Queue Overflow
2024-05-02 12:22:28.336 NZST I (36847506) vehicle-poll: Poller[Frame]: Task Queue Overflow
2024-05-02 12:22:28.346 NZST I (36847516) vehicle-poll: Poller[Frame]: Task Queue Overflow
2024-05-02 12:22:28.346 NZST I (36847516) vehicle-poll: Poller[Frame]: Task Queue Overflow
2024-05-02 12:22:28.346 NZST I (36847516) vehicle-poll: Poller[Frame]: Task Queue Overflow
2024-05-02 12:22:28.346 NZST I (36847516) vehicle-poll: Poller[Frame]: Task Queue Overflow
2024-05-02 12:22:28.356 NZST I (36847526) vehicle-poll: Poller[Frame]: Task Queue Overflow
2024-05-02 12:22:28.356 NZST I (36847526) vehicle-poll: Poller[Frame]: Task Queue Overflow
2024-05-02 12:22:28.356 NZST I (36847526) vehicle-poll: Poller[Frame]: Task Queue Overflow
2024-05-02 12:22:28.356 NZST I (36847526) vehicle-poll: Poller[Frame]: Task Queue Overflow
On Fri, 3 May 2024 at 05:40, Michael Balzer via OvmsDev <ovmsdev@lists.openvehicles.com> wrote:
A task may delete itself by calling vTaskDelete(NULL) as the final statement, and that's normally a better way to shutdown a task, if you can signal the task it should terminate. Deleting a task from outside may always result in resources taken by the task not being freed, as the task gets terminated wherever it just is.
As the vehicle task also needs to access vehicle data memory, vehicle destruction should not begin until the task has finished, otherwise a task job already running while the vehicle destruction takes place may run into an illegal memory access (access after free). Keep in mind, destructors are executed bottom up, so waiting for the task shutdown within the destructor won't help.
Also, I think "MyCan.DeregisterCallback(TAG)" in ShuttingDown() is now obsolete.
Regards, Michael
Am 02.05.24 um 15:23 schrieb Michael Geddes:
Thanks.
On that race condition... do you think we are better to just delete the task or I saw one recommendation that We can delete it outside the while loop in the task itself!
//.ichael
On Tue, 30 Apr 2024, 17:46 Michael Balzer via OvmsDev, <ovmsdev@lists.openvehicles.com> wrote:
OK, understood & merged, thanks for the quick fix/workaround.
I'll ask the Twizy driver to test this.
Regards, Michael
PS: side note: there's a shutdown race condition arising from `while (!m_is_shutdown)` in the new `OvmsVehicle::VehicleTask()`: if the task receives a message while m_is_shutdown already has been set, it will exit the loop and return from the task function, which isn't allowed. I think FreeRTOS will abort in that case.
Am 30.04.24 um 08:55 schrieb Michael Geddes:
No it will start the poll thread of the poller fine for those that don't use it. That's the last commit.... so that should be covered. When the callback is registered the thread is force started.
This is not to say that what you are suggesting isn't a better way forward... just that it should work.
Michael
On Tue, 30 Apr 2024, 14:51 Michael Balzer via OvmsDev, <ovmsdev@lists.openvehicles.com> wrote:
Michael,
(taking this back to the list, as other developers may have helpful ideas or suggestions)
from a first check, your new patch (PR #1008) won't help for vehicles that don't use the poller, like the generic DBC vehicle or the Fiat 500 (plus possibly non-public third party vehicles). As the poller is normally compiled in, these would need a run time switch to re-enable the vehicle task, or more suitably default into that configuration and switch to the poller task only when the poller gets initialized.
How about moving the task back into the vehicle class, but keeping your task message extensions while doing so, and adding a way for the poller to hook into the task? The dedicated vehicle task is an essential part of the vehicle framework, but I do remember some occasions where a general way to pass custom messages to the vehicle task would have been helpful to use the task for more than CAN processing.
If the poller shall become avaible as a separate service that can be used without any vehicle instance (currently not a defined use case), the construct of a CAN processor task that can be extended for custom messages (or a message processor task that can subscribe to CAN frames) could be factored out into a dedicated class or template. The poller could then create his own instance of that class, if it cannot hook into an existing one.
Btw, in case you're not aware of this, FreeRTOS also provides queue sets (https://www.freertos.org/RTOS-queue-sets.html). We haven't used them in the OVMS yet, but they could be useful, especially if message unions become large or tasks shall be able to dynamically subscribe to different message sources.
Regards, Michael
Am 30.04.24 um 01:20 schrieb Michael Geddes:
It might be worth reverting, but, I've got a patch suggestion that I'll push up which will let me know if I understand everything and which might provide a solution.
If this isn't going to work then revert. (P/R coming)
While the poller was still a part of the vehicle class it was probably still all ok. The poller had taken over what I assume you are talking about as the vehicle task. A call-back fromthe poller was calling IncomingPollRxFrame which was then coming from the (now) poller task (is that correct?)
While we have OVMS_COMP_POLLER config defined, we could just use the poller task to provide the IncomingPollRxFrame call-back from the poller (was vehicle?) task.
The problem is when OVMS_COMP_POLLER is undefined, we need an alternate (maybe we could use the 'Event' loop then) which is when I hacked that bad solution.
//.ichael
I was thinking though that because everything is being queued we could divert some calls into the car
On Mon, 29 Apr 2024, 18:58 Michael Balzer, <dexter@expeedo.de> wrote:
Michael,
I've found a severe design flaw with your poller change. Sorry, I should have seen that before, and shouldn't have merged this.
You have moved the standard CAN frame processing from the vehicle task into the CAN task by changing the vehicle from a CAN listener to a CAN callback processor. That will break all kind of things, vehicles like the Twizy, Smart and many others rely on frame processing being done in the dedicated vehicle task.
This especially induces issues regarding CAN processing capacity, as the vehicles rely on having a separate context and not needing to decouple complex processing of incoming frames. So this will degrade the CAN processing performance seriously in many cases, where additional steps involving file or network I/O need to be done.
So this needs to be changed back.
I assumed you introduced a new dedicated poller task but kept the vehicle task intact. From your naming (OvmsVehicle::IncomingPollRxFrame), it seems you misinterpreted the vehicle task's purpose as only being used for polling.
I assume this isn't a small change…? If so we should revert the poller merge, to avoid having a defunctional edge build state until the fix.
Secondly: logging is generally expensive regardless of the log level control and log channels enabled. Any log message needs to be queued to the log system, so involves a lock and a potential wait state (for the queue) & resulting context switch (= minimum delay of 10 ms). Therefore, logging must be avoided as far as possible in any time critical context, and is forbidden under some circumstances, e.g. in a timer callback (see FreeRTOS docs on this). The log system load multiplies with connected web clients or enabled file logging and enabled debug / verbose level logging -- that quickly becomes too much, usually triggering the task watchdog.
Your logging of nearly all bus events passing to/from the poller (especially the log entry in Queue_PollerFrame) becomes an issue on any vehicle that has high frequency running process data frames on the bus, like the Twizy or Smart. As a counter measure, I've just added a runtime control for all the poller's verbose logging (by default now off), and changed some debug level logs to verbose. Not sure if I've catched all that may need to be silenced by default. Please check all your log calls and place them under the new "trace" control flag wherever appropriate.
This won't help avoiding issues with process data frame buses though.
Shall I revert the poller merge for now?
Regards, Michael
Am 29.04.24 um 06:18 schrieb Michael Geddes:
Btw I included the log changes in the p/r which is a few small commits for the poller.
//.
On Mon, 29 Apr 2024, 07:20 Michael Geddes, <frog@bunyip.wheelycreek.net> wrote:
Hey Michael, I've got to work now (it's Monday), but I suspect those 'giving up' are from unsolicited messages on the bus. I can re-order things so that the message will likely be 'dropped (no poll entry)' rather than the time-out message. And make it a verbose log.
//.ichael
On Mon, 29 Apr 2024 at 00:25, Michael Balzer <dexter@expeedo.de> wrote:
Michael,
forwarding the Twizy logs to you directly, as they contain the user location.
He has just verified it's the new version, he says the module stops responding as soon as he turns on the Twizy.
His description of his actions is a bit ambiguous, and it seems he didn't enable logging to the file persistently.
According to the server, these were the version boot times:
2024-04-28 15:30:56 0 3.3.004-32-g125e0841/ota_0/edge (build idf v3.3.4-849-g6e214dc335 Apr 26 2024 19:16:50) 2024-04-28 16:21:08 0 3.3.004-32-g125e0841/ota_0/edge (build idf v3.3.4-849-g6e214dc335 Apr 26 2024 19:16:50) 2024-04-28 16:38:33 0 3.3.004-63-gf3595561/ota_1/edge (build idf v3.3.4-849-g6e214dc335 Apr 27 2024 07:44:50) 2024-04-28 16:40:57 0 3.3.004-63-gf3595561/ota_1/edge (build idf v3.3.4-849-g6e214dc335 Apr 27 2024 07:44:50) 2024-04-28 16:43:14 0 3.3.004-63-gf3595561/ota_1/edge (build idf v3.3.4-849-g6e214dc335 Apr 27 2024 07:44:50) 2024-04-28 16:46:39 0 3.3.004-63-gf3595561/ota_1/edge (build idf v3.3.4-849-g6e214dc335 Apr 27 2024 07:44:50) 2024-04-28 16:54:44 0 3.3.004-32-g125e0841/ota_0/edge (build idf v3.3.4-849-g6e214dc335 Apr 26 2024 19:16:50)
Attached is also his crash debug log -- a2ll doesn't tell much about what happened, but maybe you get an idea from this.
After the boot at 16:46, there are immediately lots of these messages:
2024-04-28 16:46:33.792 CEST D (39042) vehicle-poll: Poller: Queue PollerFrame() 2024-04-28 16:46:33.792 CEST D (39042) vehicle-poll: [1]Poller: Incoming - giving up
Regards, Michael
Am 28.04.24 um 16:44 schrieb Michael Geddes:
Ah. OK.
I could try to fix the vin thing using the new way of doing it and get rid of a semaphore? It would at least identify the problem possibly?
Michael
On Sun, 28 Apr 2024, 22:32 Michael Balzer via OvmsDev, <ovmsdev@lists.openvehicles.com> wrote:
Not sure if that's the problem, but I've found a different behaviour with the new PollSetState() implementation.
The old version only did anything if the new state actually was different from the previous one. The Twizy relies on this behaviour, calling PollSetState() from the per second ticker (see OvmsVehicleRenaultTwizy::ObdTicker1).
The new implementation apparently always sends the PollState command to the task, and that in turn always at least locks the poller mutex. Not sure if/how that could cause the observed issues, but it definitely adds quite some (unnecessary?) lock/unlock operations.
Am 28.04.24 um 16:05 schrieb Michael Balzer via OvmsDev: > The Twizy uses the poller to > query the VIN (once) and DTCs > (every 10 seconds while > driving), see rt_obd2.cpp. > > It also has its own version of > the OBD single request > (OvmsVehicleRenaultTwizy::ObdRequest), > which was the precursor for the > generalized version. This is > used by custom/user Twizy > plugins and scripts to access > ECU internals. > > The Twizy doesn't use > IncomingPollRxFrame, but the > Twizy's IncomingPollReply > handler will log any poll > responses it doesn't know about, > so that could lead to a lot of > log output if something goes > wrong there. > > > Am 28.04.24 um 15:49 schrieb > Michael Geddes via OvmsDev: >> AFAICT the twizzy doesn't use >> the poller list at all. So is >> it missing a call-back or >> something?? >> >> I can see a potential problem >> with IncomingPollRxFrame being >> called twice as much as it >> should be but only when there >> is a poll list. Maybe >> commenting out this would do >> it. (I can find another away >> to get this called on the >> thread I want). This might be >> the problem with the smarted >> >> void >> OvmsVehicle::OvmsVehicleSignal::IncomingPollRxFrame(canbus* >> bus, CAN_frame_t *frame, bool >> success) >> { >> //if (Ready()) >> // >> m_parent->IncomingPollRxFrame(frame, >> success); >> } >> >> //. >> >> >> On Sun, 28 Apr 2024 at 21:10, >> Michael Balzer via OvmsDev >> <ovmsdev@lists.openvehicles.com> >> wrote: >> >> There may also be an issue >> with the Renault Twizy, >> I've received a report of a >> user who is using the edge >> builds, that the latest >> build wouldn't work. >> >> He reports all kinds of >> errors and warnings >> signaled by the car during >> driving, and switching back >> to the previous build fixed >> the issues. >> >> I've asked him to provide a >> debug log excerpt if possible. >> >> Regards, >> Michael >> >> >> Am 28.04.24 um 14:29 >> schrieb Michael Geddes via >> OvmsDev: >>> OK. That's bad. >>> >>> Does the reading work in >>> general? >>> >>> Is it just the writing >>> commands? >>> >>> Raise a ticket on github >>> and tag me in and we can >>> address it that way. >>> >>> Michael >>> >>> On Sun, 28 Apr 2024, 19:49 >>> Thomas Heuer via OvmsDev, >>> <ovmsdev@lists.openvehicles.com> >>> wrote: >>> >>> Hi, >>> >>> The new poller code >>> doesn't seem to work >>> properly with the smarted. >>> >>> D (218831) >>> vehicle-poll: >>> [1]PollerNextTick(PRI): >>> cycle complete for >>> ticker=215 >>> >>> V (218831) >>> vehicle-poll: Standard >>> Poll Series: List reset >>> >>> D (218831) >>> vehicle-poll: >>> PollSeriesList::NextPollEntry[!v.standard]: >>> ReachedEnd >>> >>> V (218831) >>> vehicle-poll: >>> [1]PollerSend: Poller >>> Reached End >>> >>> D (219691) >>> vehicle-poll: Poller: >>> Queue PollerFrame() >>> >>> D (219691) >>> vehicle-poll: Poller: >>> Queue PollerFrame() >>> >>> V (219691) >>> vehicle-poll: Pollers: >>> FrameRx(bus=2) >>> >>> D (219691) >>> vehicle-poll: Poller: >>> Queue PollerFrame() >>> >>> V (219691) >>> vehicle-poll: Pollers: >>> FrameRx(bus=2) >>> >>> V (219691) >>> vehicle-poll: Pollers: >>> FrameRx(bus=2) >>> >>> D (219691) >>> vehicle-poll: Poller: >>> Queue PollerFrame() >>> >>> *OVMS#*unlock 22 >>> Vehicle unlocked >>> >>> V (219691) >>> vehicle-poll: Pollers: >>> FrameRx(bus=2) >>> >>> D (219691) >>> vehicle-poll: Poller: >>> Queue PollerFrame() >>> >>> V (219691) >>> vehicle-poll: Pollers: >>> FrameRx(bus=2) >>> >>> D (219701) >>> vehicle-poll: Poller: >>> Queue PollerFrame() >>> >>> V (219701) >>> vehicle-poll: Pollers: >>> FrameRx(bus=2) >>> >>> D (219701) >>> vehicle-poll: Poller: >>> Queue PollerFrame() >>> >>> V (219701) >>> vehicle-poll: Pollers: >>> FrameRx(bus=2) >>> >>> D (219701) >>> vehicle-poll: Poller: >>> Queue PollerFrame() >>> >>> V (219701) >>> vehicle-poll: Pollers: >>> FrameRx(bus=2) >>> >>> D (219701) >>> vehicle-poll: Poller: >>> Queue PollerFrame() >>> >>> V (219701) >>> vehicle-poll: Pollers: >>> FrameRx(bus=2) >>> >>> D (219701) >>> vehicle-poll: Poller: >>> Queue PollerFrame() >>> >>> V (219701) >>> vehicle-poll: Pollers: >>> FrameRx(bus=2) >>> >>> D (219701) >>> vehicle-poll: Poller: >>> Queue PollerFrame() >>> >>> V (219701) >>> vehicle-poll: Pollers: >>> FrameRx(bus=2) >>> >>> D (219701) >>> vehicle-poll: Poller: >>> Queue PollerFrame() >>> >>> V (219701) >>> vehicle-poll: Pollers: >>> FrameRx(bus=2) >>> >>> D (219701) >>> vehicle-poll: Poller: >>> Queue PollerFrame() >>> >>> V (219701) >>> vehicle-poll: Pollers: >>> FrameRx(bus=2) >>> >>> D (219701) >>> vehicle-poll: Poller: >>> Queue PollerFrame() >>> >>> V (219701) >>> vehicle-poll: Pollers: >>> FrameRx(bus=2) >>> >>> D (219701) >>> vehicle-poll: Poller: >>> Queue PollerFrame() >>> >>> V (219701) >>> vehicle-poll: Pollers: >>> FrameRx(bus=2) >>> >>> D (219701) >>> vehicle-poll: Poller: >>> Queue PollerFrame() >>> >>> *Von:*OvmsDev >>> <ovmsdev-bounces@lists.openvehicles.com> >>> *Im Auftrag von >>> *Michael Geddes via >>> OvmsDev >>> *Gesendet:* Sonntag, >>> 28. April 2024 12:27 >>> *An:* OVMS Developers >>> <ovmsdev@lists.openvehicles.com> >>> *Cc:* Michael Geddes >>> <frog@bunyip.wheelycreek.net> >>> *Betreff:* [Ovmsdev] >>> OVMS Poller >>> module/singleton >>> >>> Hey all, >>> >>> The poller singleton >>> code that I've been >>> working on for over a >>> year now is merged in. >>> (Thanks Michael for >>> expediting the final >>> step). >>> >>> This includes separate >>> multi-frame states per >>> bus and multiple poll >>> lists as well as >>> non-blocking one off >>> queries. As well as >>> more 'states'. >>> >>> I have included some >>> programming >>> documentation in the >>> change but am happy to >>> supply more if needed. >>> >>> The ioniq 5 code has >>> some examples of how >>> it can be used. Some >>> examples are: >>> >>> * grabbing the vin as >>> a one shot without >>> blocking >>> >>> * having a short list >>> of queries that are >>> polled quickly for >>> obd2ecu (this also >>> demonstrates using a >>> shorter frame break >>> value and then a break >>> after successful a >>> response) >>> >>> Have a play please! >>> >>> Also interested in >>> hearing what user >>> tools might be worth >>> looking at next for >>> the poller object. >>> >>> //.ichael G. >>> >>> _______________________________________________ >>> OvmsDev mailing list >>> OvmsDev@lists.openvehicles.com >>> http://lists.openvehicles.com/mailman/listinfo/ovmsdev >>> >>> >>> _______________________________________________ >>> OvmsDev mailing list >>> OvmsDev@lists.openvehicles.com >>> http://lists.openvehicles.com/mailman/listinfo/ovmsdev >> >> -- >> Michael Balzer * Helkenberger Weg 9 * D-58256 Ennepetal >> Fon 02333 / 833 5735 * Handy 0176 / 206 989 26 >> >> _______________________________________________ >> OvmsDev mailing list >> OvmsDev@lists.openvehicles.com >> http://lists.openvehicles.com/mailman/listinfo/ovmsdev >> >> >> _______________________________________________ >> OvmsDev mailing list >> OvmsDev@lists.openvehicles.com >> http://lists.openvehicles.com/mailman/listinfo/ovmsdev > > -- > Michael Balzer * Helkenberger Weg 9 * D-58256 Ennepetal > Fon 02333 / 833 5735 * Handy 0176 / 206 989 26 > > _______________________________________________ > OvmsDev mailing list > OvmsDev@lists.openvehicles.com > http://lists.openvehicles.com/mailman/listinfo/ovmsdev
-- Michael Balzer * Helkenberger Weg 9 * D-58256 Ennepetal Fon 02333 / 833 5735 * Handy 0176 / 206 989 26
_______________________________________________ OvmsDev mailing list OvmsDev@lists.openvehicles.com http://lists.openvehicles.com/mailman/listinfo/ovmsdev
-- Michael Balzer * Helkenberger Weg 9 * D-58256 Ennepetal Fon 02333 / 833 5735 * Handy 0176 / 206 989 26
-- Michael Balzer * Helkenberger Weg 9 * D-58256 Ennepetal Fon 02333 / 833 5735 * Handy 0176 / 206 989 26
-- Michael Balzer * Helkenberger Weg 9 * D-58256 Ennepetal Fon 02333 / 833 5735 * Handy 0176 / 206 989 26
_______________________________________________ OvmsDev mailing list OvmsDev@lists.openvehicles.com http://lists.openvehicles.com/mailman/listinfo/ovmsdev
-- Michael Balzer * Helkenberger Weg 9 * D-58256 Ennepetal Fon 02333 / 833 5735 * Handy 0176 / 206 989 26
_______________________________________________ OvmsDev mailing list OvmsDev@lists.openvehicles.com http://lists.openvehicles.com/mailman/listinfo/ovmsdev
-- Michael Balzer * Helkenberger Weg 9 * D-58256 Ennepetal Fon 02333 / 833 5735 * Handy 0176 / 206 989 26
_______________________________________________ OvmsDev mailing list OvmsDev@lists.openvehicles.com http://lists.openvehicles.com/mailman/listinfo/ovmsdev
_______________________________________________ OvmsDev mailing list OvmsDev@lists.openvehicles.com http://lists.openvehicles.com/mailman/listinfo/ovmsdev
_______________________________________________ OvmsDev mailing list OvmsDev@lists.openvehicles.com http://lists.openvehicles.com/mailman/listinfo/ovmsdev
-- Michael Balzer * Helkenberger Weg 9 * D-58256 Ennepetal Fon 02333 / 833 5735 * Handy 0176 / 206 989 26
HI Derek, For a start, I’m very sorry that the ovms put your car in limp mode. That’s quite bad. Just FYI those overflows that you have copied are about receiving and not sending information, so maybe the poller thread is being overwhelmed or stalled somehow. I’ve been looking at the code and wondered if you have the ‘can write’ flag set to true or not? (Though it shouldn’t make that much difference) Even if it were somehow mistakenly polling (ie in the wrong pollstate), it should not be doing it that frequently – (at most once a minute). And the poll throttle would still be on 1 per second.. so that should put a limit on sends.. and so it is really worrying that somehow that is not happening :/ If you have more logs that you send me that don’t just include that particular overflow message that would be good. Did it crash/reboot? Maybe it crashed repeatedly? //.ichael From: OvmsDev <ovmsdev-bounces@lists.openvehicles.com> On Behalf Of Derek Caudwell via OvmsDev Sent: Friday, May 3, 2024 6:54 PM To: OVMS Developers <ovmsdev@lists.openvehicles.com> Cc: Derek Caudwell <d.caudwell@gmail.com> Subject: Re: [Ovmsdev] OVMS Poller module/singleton Hi Michael, When running firmware 3.3.004-74-gbd4e7196 on my Nissan Leaf I suspect (but can't be 100% sure as it's only been 24h without fault) the new poller caused the car to throw the attached faults from overloading the can bus whilst driving. The fault was sufficient to send the car into limp mode and could not be driven until cleared with LeafSpy. Ovms should not be polling in the driving state, so I'm not sure why the poller is overflowing. The ovms log repeats this overflow in rapid succession right before the failure occurred. I have since reverted to an earlier version and it might be advisable for other Leaf owners to do so until the new poller is fully operational. 2024-05-02 12:22:28.316 NZST I (36847486) vehicle-poll: Poller[Frame]: Task Queue Overflow 2024-05-02 12:22:28.316 NZST I (36847486) vehicle-poll: Poller[Frame]: Task Queue Overflow 2024-05-02 12:22:28.316 NZST I (36847486) vehicle-poll: Poller[Frame]: Task Queue Overflow 2024-05-02 12:22:28.326 NZST I (36847496) vehicle-poll: Poller[Frame]: Task Queue Overflow 2024-05-02 12:22:28.326 NZST I (36847496) vehicle-poll: Poller[Frame]: Task Queue Overflow 2024-05-02 12:22:28.326 NZST I (36847496) vehicle-poll: Poller[Frame]: Task Queue Overflow 2024-05-02 12:22:28.326 NZST I (36847496) vehicle-poll: Poller[Frame]: Task Queue Overflow 2024-05-02 12:22:28.326 NZST I (36847496) vehicle-poll: Poller[Frame]: Task Queue Overflow 2024-05-02 12:22:28.326 NZST I (36847496) vehicle-poll: Poller[Frame]: Task Queue Overflow 2024-05-02 12:22:28.326 NZST I (36847496) vehicle-poll: Poller[Frame]: Task Queue Overflow 2024-05-02 12:22:28.326 NZST I (36847496) vehicle-poll: Poller[Frame]: Task Queue Overflow 2024-05-02 12:22:28.336 NZST I (36847506) vehicle-poll: Poller[Frame]: Task Queue Overflow 2024-05-02 12:22:28.336 NZST I (36847506) vehicle-poll: Poller[Frame]: Task Queue Overflow 2024-05-02 12:22:28.336 NZST I (36847506) vehicle-poll: Poller[Frame]: Task Queue Overflow 2024-05-02 12:22:28.336 NZST I (36847506) vehicle-poll: Poller[Frame]: Task Queue Overflow 2024-05-02 12:22:28.346 NZST I (36847516) vehicle-poll: Poller[Frame]: Task Queue Overflow 2024-05-02 12:22:28.346 NZST I (36847516) vehicle-poll: Poller[Frame]: Task Queue Overflow 2024-05-02 12:22:28.346 NZST I (36847516) vehicle-poll: Poller[Frame]: Task Queue Overflow 2024-05-02 12:22:28.346 NZST I (36847516) vehicle-poll: Poller[Frame]: Task Queue Overflow 2024-05-02 12:22:28.356 NZST I (36847526) vehicle-poll: Poller[Frame]: Task Queue Overflow 2024-05-02 12:22:28.356 NZST I (36847526) vehicle-poll: Poller[Frame]: Task Queue Overflow 2024-05-02 12:22:28.356 NZST I (36847526) vehicle-poll: Poller[Frame]: Task Queue Overflow 2024-05-02 12:22:28.356 NZST I (36847526) vehicle-poll: Poller[Frame]: Task Queue Overflow On Fri, 3 May 2024 at 05:40, Michael Balzer via OvmsDev <ovmsdev@lists.openvehicles.com <mailto:ovmsdev@lists.openvehicles.com> > wrote: A task may delete itself by calling vTaskDelete(NULL) as the final statement, and that's normally a better way to shutdown a task, if you can signal the task it should terminate. Deleting a task from outside may always result in resources taken by the task not being freed, as the task gets terminated wherever it just is. As the vehicle task also needs to access vehicle data memory, vehicle destruction should not begin until the task has finished, otherwise a task job already running while the vehicle destruction takes place may run into an illegal memory access (access after free). Keep in mind, destructors are executed bottom up, so waiting for the task shutdown within the destructor won't help. Also, I think "MyCan.DeregisterCallback(TAG)" in ShuttingDown() is now obsolete. Regards, Michael Am 02.05.24 um 15:23 schrieb Michael Geddes: Thanks. On that race condition... do you think we are better to just delete the task or I saw one recommendation that We can delete it outside the while loop in the task itself! //.ichael On Tue, 30 Apr 2024, 17:46 Michael Balzer via OvmsDev, <ovmsdev@lists.openvehicles.com <mailto:ovmsdev@lists.openvehicles.com> > wrote: OK, understood & merged, thanks for the quick fix/workaround. I'll ask the Twizy driver to test this. Regards, Michael PS: side note: there's a shutdown race condition arising from `while (!m_is_shutdown)` in the new `OvmsVehicle::VehicleTask()`: if the task receives a message while m_is_shutdown already has been set, it will exit the loop and return from the task function, which isn't allowed. I think FreeRTOS will abort in that case. Am 30.04.24 um 08:55 schrieb Michael Geddes: No it will start the poll thread of the poller fine for those that don't use it. That's the last commit.... so that should be covered. When the callback is registered the thread is force started. This is not to say that what you are suggesting isn't a better way forward... just that it should work. Michael On Tue, 30 Apr 2024, 14:51 Michael Balzer via OvmsDev, <ovmsdev@lists.openvehicles.com <mailto:ovmsdev@lists.openvehicles.com> > wrote: Michael, (taking this back to the list, as other developers may have helpful ideas or suggestions) from a first check, your new patch (PR #1008) won't help for vehicles that don't use the poller, like the generic DBC vehicle or the Fiat 500 (plus possibly non-public third party vehicles). As the poller is normally compiled in, these would need a run time switch to re-enable the vehicle task, or more suitably default into that configuration and switch to the poller task only when the poller gets initialized. How about moving the task back into the vehicle class, but keeping your task message extensions while doing so, and adding a way for the poller to hook into the task? The dedicated vehicle task is an essential part of the vehicle framework, but I do remember some occasions where a general way to pass custom messages to the vehicle task would have been helpful to use the task for more than CAN processing. If the poller shall become avaible as a separate service that can be used without any vehicle instance (currently not a defined use case), the construct of a CAN processor task that can be extended for custom messages (or a message processor task that can subscribe to CAN frames) could be factored out into a dedicated class or template. The poller could then create his own instance of that class, if it cannot hook into an existing one. Btw, in case you're not aware of this, FreeRTOS also provides queue sets (https://www.freertos.org/RTOS-queue-sets.html). We haven't used them in the OVMS yet, but they could be useful, especially if message unions become large or tasks shall be able to dynamically subscribe to different message sources. Regards, Michael Am 30.04.24 um 01:20 schrieb Michael Geddes: It might be worth reverting, but, I've got a patch suggestion that I'll push up which will let me know if I understand everything and which might provide a solution. If this isn't going to work then revert. (P/R coming) While the poller was still a part of the vehicle class it was probably still all ok. The poller had taken over what I assume you are talking about as the vehicle task. A call-back fromthe poller was calling IncomingPollRxFrame which was then coming from the (now) poller task (is that correct?) While we have OVMS_COMP_POLLER config defined, we could just use the poller task to provide the IncomingPollRxFrame call-back from the poller (was vehicle?) task. The problem is when OVMS_COMP_POLLER is undefined, we need an alternate (maybe we could use the 'Event' loop then) which is when I hacked that bad solution. //.ichael I was thinking though that because everything is being queued we could divert some calls into the car On Mon, 29 Apr 2024, 18:58 Michael Balzer, <dexter@expeedo.de <mailto:dexter@expeedo.de> > wrote: Michael, I've found a severe design flaw with your poller change. Sorry, I should have seen that before, and shouldn't have merged this. You have moved the standard CAN frame processing from the vehicle task into the CAN task by changing the vehicle from a CAN listener to a CAN callback processor. That will break all kind of things, vehicles like the Twizy, Smart and many others rely on frame processing being done in the dedicated vehicle task. This especially induces issues regarding CAN processing capacity, as the vehicles rely on having a separate context and not needing to decouple complex processing of incoming frames. So this will degrade the CAN processing performance seriously in many cases, where additional steps involving file or network I/O need to be done. So this needs to be changed back. I assumed you introduced a new dedicated poller task but kept the vehicle task intact. From your naming (OvmsVehicle::IncomingPollRxFrame), it seems you misinterpreted the vehicle task's purpose as only being used for polling. I assume this isn't a small change…? If so we should revert the poller merge, to avoid having a defunctional edge build state until the fix. Secondly: logging is generally expensive regardless of the log level control and log channels enabled. Any log message needs to be queued to the log system, so involves a lock and a potential wait state (for the queue) & resulting context switch (= minimum delay of 10 ms). Therefore, logging must be avoided as far as possible in any time critical context, and is forbidden under some circumstances, e.g. in a timer callback (see FreeRTOS docs on this). The log system load multiplies with connected web clients or enabled file logging and enabled debug / verbose level logging -- that quickly becomes too much, usually triggering the task watchdog. Your logging of nearly all bus events passing to/from the poller (especially the log entry in Queue_PollerFrame) becomes an issue on any vehicle that has high frequency running process data frames on the bus, like the Twizy or Smart. As a counter measure, I've just added a runtime control for all the poller's verbose logging (by default now off), and changed some debug level logs to verbose. Not sure if I've catched all that may need to be silenced by default. Please check all your log calls and place them under the new "trace" control flag wherever appropriate. This won't help avoiding issues with process data frame buses though. Shall I revert the poller merge for now? Regards, Michael Am 29.04.24 um 06:18 schrieb Michael Geddes: Btw I included the log changes in the p/r which is a few small commits for the poller. //. On Mon, 29 Apr 2024, 07:20 Michael Geddes, <frog@bunyip.wheelycreek.net <mailto:frog@bunyip.wheelycreek.net> > wrote: Hey Michael, I've got to work now (it's Monday), but I suspect those 'giving up' are from unsolicited messages on the bus. I can re-order things so that the message will likely be 'dropped (no poll entry)' rather than the time-out message. And make it a verbose log. //.ichael On Mon, 29 Apr 2024 at 00:25, Michael Balzer <dexter@expeedo.de <mailto:dexter@expeedo.de> > wrote: Michael, forwarding the Twizy logs to you directly, as they contain the user location. He has just verified it's the new version, he says the module stops responding as soon as he turns on the Twizy. His description of his actions is a bit ambiguous, and it seems he didn't enable logging to the file persistently. According to the server, these were the version boot times: 2024-04-28 15:30:56 0 3.3.004-32-g125e0841/ota_0/edge (build idf v3.3.4-849-g6e214dc335 Apr 26 2024 19:16:50) 2024-04-28 16:21:08 0 3.3.004-32-g125e0841/ota_0/edge (build idf v3.3.4-849-g6e214dc335 Apr 26 2024 19:16:50) 2024-04-28 16:38:33 0 3.3.004-63-gf3595561/ota_1/edge (build idf v3.3.4-849-g6e214dc335 Apr 27 2024 07:44:50) 2024-04-28 16:40:57 0 3.3.004-63-gf3595561/ota_1/edge (build idf v3.3.4-849-g6e214dc335 Apr 27 2024 07:44:50) 2024-04-28 16:43:14 0 3.3.004-63-gf3595561/ota_1/edge (build idf v3.3.4-849-g6e214dc335 Apr 27 2024 07:44:50) 2024-04-28 16:46:39 0 3.3.004-63-gf3595561/ota_1/edge (build idf v3.3.4-849-g6e214dc335 Apr 27 2024 07:44:50) 2024-04-28 16:54:44 0 3.3.004-32-g125e0841/ota_0/edge (build idf v3.3.4-849-g6e214dc335 Apr 26 2024 19:16:50) Attached is also his crash debug log -- a2ll doesn't tell much about what happened, but maybe you get an idea from this. After the boot at 16:46, there are immediately lots of these messages: 2024-04-28 16:46:33.792 CEST D (39042) vehicle-poll: Poller: Queue PollerFrame() 2024-04-28 16:46:33.792 CEST D (39042) vehicle-poll: [1]Poller: Incoming - giving up Regards, Michael Am 28.04.24 um 16:44 schrieb Michael Geddes: Ah. OK. I could try to fix the vin thing using the new way of doing it and get rid of a semaphore? It would at least identify the problem possibly? Michael On Sun, 28 Apr 2024, 22:32 Michael Balzer via OvmsDev, <ovmsdev@lists.openvehicles.com <mailto:ovmsdev@lists.openvehicles.com> > wrote: Not sure if that's the problem, but I've found a different behaviour with the new PollSetState() implementation. The old version only did anything if the new state actually was different from the previous one. The Twizy relies on this behaviour, calling PollSetState() from the per second ticker (see OvmsVehicleRenaultTwizy::ObdTicker1). The new implementation apparently always sends the PollState command to the task, and that in turn always at least locks the poller mutex. Not sure if/how that could cause the observed issues, but it definitely adds quite some (unnecessary?) lock/unlock operations. Am 28.04.24 um 16:05 schrieb Michael Balzer via OvmsDev: The Twizy uses the poller to query the VIN (once) and DTCs (every 10 seconds while driving), see rt_obd2.cpp. It also has its own version of the OBD single request (OvmsVehicleRenaultTwizy::ObdRequest), which was the precursor for the generalized version. This is used by custom/user Twizy plugins and scripts to access ECU internals. The Twizy doesn't use IncomingPollRxFrame, but the Twizy's IncomingPollReply handler will log any poll responses it doesn't know about, so that could lead to a lot of log output if something goes wrong there. Am 28.04.24 um 15:49 schrieb Michael Geddes via OvmsDev: AFAICT the twizzy doesn't use the poller list at all. So is it missing a call-back or something?? I can see a potential problem with IncomingPollRxFrame being called twice as much as it should be but only when there is a poll list. Maybe commenting out this would do it. (I can find another away to get this called on the thread I want). This might be the problem with the smarted void OvmsVehicle::OvmsVehicleSignal::IncomingPollRxFrame(canbus* bus, CAN_frame_t *frame, bool success) { //if (Ready()) // m_parent->IncomingPollRxFrame(frame, success); } //. On Sun, 28 Apr 2024 at 21:10, Michael Balzer via OvmsDev <ovmsdev@lists.openvehicles.com <mailto:ovmsdev@lists.openvehicles.com> > wrote: There may also be an issue with the Renault Twizy, I've received a report of a user who is using the edge builds, that the latest build wouldn't work. He reports all kinds of errors and warnings signaled by the car during driving, and switching back to the previous build fixed the issues. I've asked him to provide a debug log excerpt if possible. Regards, Michael Am 28.04.24 um 14:29 schrieb Michael Geddes via OvmsDev: OK. That's bad. Does the reading work in general? Is it just the writing commands? Raise a ticket on github and tag me in and we can address it that way. Michael On Sun, 28 Apr 2024, 19:49 Thomas Heuer via OvmsDev, <ovmsdev@lists.openvehicles.com <mailto:ovmsdev@lists.openvehicles.com> > wrote: Hi, The new poller code doesn't seem to work properly with the smarted. D (218831) vehicle-poll: [1]PollerNextTick(PRI): cycle complete for ticker=215 V (218831) vehicle-poll: Standard Poll Series: List reset D (218831) vehicle-poll: PollSeriesList::NextPollEntry[!v.standard]: ReachedEnd V (218831) vehicle-poll: [1]PollerSend: Poller Reached End D (219691) vehicle-poll: Poller: Queue PollerFrame() D (219691) vehicle-poll: Poller: Queue PollerFrame() V (219691) vehicle-poll: Pollers: FrameRx(bus=2) D (219691) vehicle-poll: Poller: Queue PollerFrame() V (219691) vehicle-poll: Pollers: FrameRx(bus=2) V (219691) vehicle-poll: Pollers: FrameRx(bus=2) D (219691) vehicle-poll: Poller: Queue PollerFrame() OVMS# unlock 22 Vehicle unlocked V (219691) vehicle-poll: Pollers: FrameRx(bus=2) D (219691) vehicle-poll: Poller: Queue PollerFrame() V (219691) vehicle-poll: Pollers: FrameRx(bus=2) D (219701) vehicle-poll: Poller: Queue PollerFrame() V (219701) vehicle-poll: Pollers: FrameRx(bus=2) D (219701) vehicle-poll: Poller: Queue PollerFrame() V (219701) vehicle-poll: Pollers: FrameRx(bus=2) D (219701) vehicle-poll: Poller: Queue PollerFrame() V (219701) vehicle-poll: Pollers: FrameRx(bus=2) D (219701) vehicle-poll: Poller: Queue PollerFrame() V (219701) vehicle-poll: Pollers: FrameRx(bus=2) D (219701) vehicle-poll: Poller: Queue PollerFrame() V (219701) vehicle-poll: Pollers: FrameRx(bus=2) D (219701) vehicle-poll: Poller: Queue PollerFrame() V (219701) vehicle-poll: Pollers: FrameRx(bus=2) D (219701) vehicle-poll: Poller: Queue PollerFrame() V (219701) vehicle-poll: Pollers: FrameRx(bus=2) D (219701) vehicle-poll: Poller: Queue PollerFrame() V (219701) vehicle-poll: Pollers: FrameRx(bus=2) D (219701) vehicle-poll: Poller: Queue PollerFrame() V (219701) vehicle-poll: Pollers: FrameRx(bus=2) D (219701) vehicle-poll: Poller: Queue PollerFrame() V (219701) vehicle-poll: Pollers: FrameRx(bus=2) D (219701) vehicle-poll: Poller: Queue PollerFrame() Von: OvmsDev <ovmsdev-bounces@lists.openvehicles.com <mailto:ovmsdev-bounces@lists.openvehicles.com> > Im Auftrag von Michael Geddes via OvmsDev Gesendet: Sonntag, 28. April 2024 12:27 An: OVMS Developers <ovmsdev@lists.openvehicles.com <mailto:ovmsdev@lists.openvehicles.com> > Cc: Michael Geddes <frog@bunyip.wheelycreek.net <mailto:frog@bunyip.wheelycreek.net> > Betreff: [Ovmsdev] OVMS Poller module/singleton Hey all, The poller singleton code that I've been working on for over a year now is merged in. (Thanks Michael for expediting the final step). This includes separate multi-frame states per bus and multiple poll lists as well as non-blocking one off queries. As well as more 'states'. I have included some programming documentation in the change but am happy to supply more if needed. The ioniq 5 code has some examples of how it can be used. Some examples are: * grabbing the vin as a one shot without blocking * having a short list of queries that are polled quickly for obd2ecu (this also demonstrates using a shorter frame break value and then a break after successful a response) Have a play please! Also interested in hearing what user tools might be worth looking at next for the poller object. //.ichael G. _______________________________________________ OvmsDev mailing list OvmsDev@lists.openvehicles.com <mailto:OvmsDev@lists.openvehicles.com> http://lists.openvehicles.com/mailman/listinfo/ovmsdev _______________________________________________ OvmsDev mailing list OvmsDev@lists.openvehicles.com <mailto:OvmsDev@lists.openvehicles.com> http://lists.openvehicles.com/mailman/listinfo/ovmsdev -- Michael Balzer * Helkenberger Weg 9 * D-58256 Ennepetal Fon 02333 / 833 5735 * Handy 0176 / 206 989 26 _______________________________________________ OvmsDev mailing list OvmsDev@lists.openvehicles.com <mailto:OvmsDev@lists.openvehicles.com> http://lists.openvehicles.com/mailman/listinfo/ovmsdev _______________________________________________ OvmsDev mailing list OvmsDev@lists.openvehicles.com <mailto:OvmsDev@lists.openvehicles.com> http://lists.openvehicles.com/mailman/listinfo/ovmsdev -- Michael Balzer * Helkenberger Weg 9 * D-58256 Ennepetal Fon 02333 / 833 5735 * Handy 0176 / 206 989 26 _______________________________________________ OvmsDev mailing list OvmsDev@lists.openvehicles.com <mailto:OvmsDev@lists.openvehicles.com> http://lists.openvehicles.com/mailman/listinfo/ovmsdev -- Michael Balzer * Helkenberger Weg 9 * D-58256 Ennepetal Fon 02333 / 833 5735 * Handy 0176 / 206 989 26 _______________________________________________ OvmsDev mailing list OvmsDev@lists.openvehicles.com <mailto:OvmsDev@lists.openvehicles.com> http://lists.openvehicles.com/mailman/listinfo/ovmsdev -- Michael Balzer * Helkenberger Weg 9 * D-58256 Ennepetal Fon 02333 / 833 5735 * Handy 0176 / 206 989 26 -- Michael Balzer * Helkenberger Weg 9 * D-58256 Ennepetal Fon 02333 / 833 5735 * Handy 0176 / 206 989 26 -- Michael Balzer * Helkenberger Weg 9 * D-58256 Ennepetal Fon 02333 / 833 5735 * Handy 0176 / 206 989 26 _______________________________________________ OvmsDev mailing list OvmsDev@lists.openvehicles.com <mailto:OvmsDev@lists.openvehicles.com> http://lists.openvehicles.com/mailman/listinfo/ovmsdev -- Michael Balzer * Helkenberger Weg 9 * D-58256 Ennepetal Fon 02333 / 833 5735 * Handy 0176 / 206 989 26 _______________________________________________ OvmsDev mailing list OvmsDev@lists.openvehicles.com <mailto:OvmsDev@lists.openvehicles.com> http://lists.openvehicles.com/mailman/listinfo/ovmsdev -- Michael Balzer * Helkenberger Weg 9 * D-58256 Ennepetal Fon 02333 / 833 5735 * Handy 0176 / 206 989 26 _______________________________________________ OvmsDev mailing list OvmsDev@lists.openvehicles.com <mailto:OvmsDev@lists.openvehicles.com> http://lists.openvehicles.com/mailman/listinfo/ovmsdev
Hey Derek, I do have a friend with a Leaf in his EV collection, so I can try grab some more info from his car and work out exactly what (tf) is going on. //. On Sat, 4 May 2024 at 08:13, <frog@bunyip.wheelycreek.net> wrote:
HI Derek,
For a start, I’m very sorry that the ovms put your car in limp mode. That’s quite bad.
Just FYI those overflows that you have copied are about receiving and not sending information, so maybe the poller thread is being overwhelmed or stalled somehow.
I’ve been looking at the code and wondered if you have the ‘can write’ flag set to true or not? (Though it shouldn’t make that much difference)
Even if it were somehow mistakenly polling (ie in the wrong pollstate), it should not be doing it that frequently – (at most once a minute). And the poll throttle would still be on 1 per second.. so that should put a limit on sends.. and so it is really worrying that somehow that is not happening :/
If you have more logs that you send me that don’t just include that particular overflow message that would be good. Did it crash/reboot? Maybe it crashed repeatedly?
//.ichael
*From:* OvmsDev <ovmsdev-bounces@lists.openvehicles.com> *On Behalf Of *Derek Caudwell via OvmsDev *Sent:* Friday, May 3, 2024 6:54 PM *To:* OVMS Developers <ovmsdev@lists.openvehicles.com> *Cc:* Derek Caudwell <d.caudwell@gmail.com> *Subject:* Re: [Ovmsdev] OVMS Poller module/singleton
Hi Michael,
When running firmware 3.3.004-74-gbd4e7196 on my Nissan Leaf I suspect (but can't be 100% sure as it's only been 24h without fault) the new poller caused the car to throw the attached faults from overloading the can bus whilst driving. The fault was sufficient to send the car into limp mode and could not be driven until cleared with LeafSpy. Ovms should not be polling in the driving state, so I'm not sure why the poller is overflowing.
The ovms log repeats this overflow in rapid succession right before the failure occurred. I have since reverted to an earlier version and it might be advisable for other Leaf owners to do so until the new poller is fully operational.
2024-05-02 12:22:28.316 NZST I (36847486) vehicle-poll: Poller[Frame]: Task Queue Overflow
2024-05-02 12:22:28.316 NZST I (36847486) vehicle-poll: Poller[Frame]: Task Queue Overflow
2024-05-02 12:22:28.316 NZST I (36847486) vehicle-poll: Poller[Frame]: Task Queue Overflow
2024-05-02 12:22:28.326 NZST I (36847496) vehicle-poll: Poller[Frame]: Task Queue Overflow
2024-05-02 12:22:28.326 NZST I (36847496) vehicle-poll: Poller[Frame]: Task Queue Overflow
2024-05-02 12:22:28.326 NZST I (36847496) vehicle-poll: Poller[Frame]: Task Queue Overflow
2024-05-02 12:22:28.326 NZST I (36847496) vehicle-poll: Poller[Frame]: Task Queue Overflow
2024-05-02 12:22:28.326 NZST I (36847496) vehicle-poll: Poller[Frame]: Task Queue Overflow
2024-05-02 12:22:28.326 NZST I (36847496) vehicle-poll: Poller[Frame]: Task Queue Overflow
2024-05-02 12:22:28.326 NZST I (36847496) vehicle-poll: Poller[Frame]: Task Queue Overflow
2024-05-02 12:22:28.326 NZST I (36847496) vehicle-poll: Poller[Frame]: Task Queue Overflow
2024-05-02 12:22:28.336 NZST I (36847506) vehicle-poll: Poller[Frame]: Task Queue Overflow
2024-05-02 12:22:28.336 NZST I (36847506) vehicle-poll: Poller[Frame]: Task Queue Overflow
2024-05-02 12:22:28.336 NZST I (36847506) vehicle-poll: Poller[Frame]: Task Queue Overflow
2024-05-02 12:22:28.336 NZST I (36847506) vehicle-poll: Poller[Frame]: Task Queue Overflow
2024-05-02 12:22:28.346 NZST I (36847516) vehicle-poll: Poller[Frame]: Task Queue Overflow
2024-05-02 12:22:28.346 NZST I (36847516) vehicle-poll: Poller[Frame]: Task Queue Overflow
2024-05-02 12:22:28.346 NZST I (36847516) vehicle-poll: Poller[Frame]: Task Queue Overflow
2024-05-02 12:22:28.346 NZST I (36847516) vehicle-poll: Poller[Frame]: Task Queue Overflow
2024-05-02 12:22:28.356 NZST I (36847526) vehicle-poll: Poller[Frame]: Task Queue Overflow
2024-05-02 12:22:28.356 NZST I (36847526) vehicle-poll: Poller[Frame]: Task Queue Overflow
2024-05-02 12:22:28.356 NZST I (36847526) vehicle-poll: Poller[Frame]: Task Queue Overflow
2024-05-02 12:22:28.356 NZST I (36847526) vehicle-poll: Poller[Frame]: Task Queue Overflow
On Fri, 3 May 2024 at 05:40, Michael Balzer via OvmsDev < ovmsdev@lists.openvehicles.com> wrote:
A task may delete itself by calling vTaskDelete(NULL) as the final statement, and that's normally a better way to shutdown a task, if you can signal the task it should terminate. Deleting a task from outside may always result in resources taken by the task not being freed, as the task gets terminated wherever it just is.
As the vehicle task also needs to access vehicle data memory, vehicle destruction should not begin until the task has finished, otherwise a task job already running while the vehicle destruction takes place may run into an illegal memory access (access after free). Keep in mind, destructors are executed bottom up, so waiting for the task shutdown within the destructor won't help.
Also, I think "MyCan.DeregisterCallback(TAG)" in ShuttingDown() is now obsolete.
Regards, Michael
Am 02.05.24 um 15:23 schrieb Michael Geddes:
Thanks.
On that race condition... do you think we are better to just delete the task or I saw one recommendation that
We can delete it outside the while loop in the task itself!
//.ichael
On Tue, 30 Apr 2024, 17:46 Michael Balzer via OvmsDev, < ovmsdev@lists.openvehicles.com> wrote:
OK, understood & merged, thanks for the quick fix/workaround.
I'll ask the Twizy driver to test this.
Regards, Michael
PS: side note: there's a shutdown race condition arising from `while (!m_is_shutdown)` in the new `OvmsVehicle::VehicleTask()`: if the task receives a message while m_is_shutdown already has been set, it will exit the loop and return from the task function, which isn't allowed. I think FreeRTOS will abort in that case.
Am 30.04.24 um 08:55 schrieb Michael Geddes:
No it will start the poll thread of the poller fine for those that don't use it. That's the last commit.... so that should be covered. When the callback is registered the thread is force started.
This is not to say that what you are suggesting isn't a better way forward... just that it should work.
Michael
On Tue, 30 Apr 2024, 14:51 Michael Balzer via OvmsDev, < ovmsdev@lists.openvehicles.com> wrote:
Michael,
(taking this back to the list, as other developers may have helpful ideas or suggestions)
from a first check, your new patch (PR #1008) won't help for vehicles that don't use the poller, like the generic DBC vehicle or the Fiat 500 (plus possibly non-public third party vehicles). As the poller is normally compiled in, these would need a run time switch to re-enable the vehicle task, or more suitably default into that configuration and switch to the poller task only when the poller gets initialized.
How about moving the task back into the vehicle class, but keeping your task message extensions while doing so, and adding a way for the poller to hook into the task? The dedicated vehicle task is an essential part of the vehicle framework, but I do remember some occasions where a general way to pass custom messages to the vehicle task would have been helpful to use the task for more than CAN processing.
If the poller shall become avaible as a separate service that can be used without any vehicle instance (currently not a defined use case), the construct of a CAN processor task that can be extended for custom messages (or a message processor task that can subscribe to CAN frames) could be factored out into a dedicated class or template. The poller could then create his own instance of that class, if it cannot hook into an existing one.
Btw, in case you're not aware of this, FreeRTOS also provides queue sets ( https://www.freertos.org/RTOS-queue-sets.html). We haven't used them in the OVMS yet, but they could be useful, especially if message unions become large or tasks shall be able to dynamically subscribe to different message sources.
Regards, Michael
Am 30.04.24 um 01:20 schrieb Michael Geddes:
It might be worth reverting, but, I've got a patch suggestion that I'll push up which will let me know if I understand everything and which might provide a solution.
If this isn't going to work then revert. (P/R coming)
While the poller was still a part of the vehicle class it was probably still all ok. The poller had taken over what I assume you are talking about as the vehicle task. A call-back fromthe poller was calling IncomingPollRxFrame which was then coming from the (now) poller task (is that correct?)
While we have OVMS_COMP_POLLER config defined, we could just use the poller task to provide the IncomingPollRxFrame call-back from the poller (was vehicle?) task.
The problem is when OVMS_COMP_POLLER is undefined, we need an alternate (maybe we could use the 'Event' loop then) which is when I hacked that bad solution.
//.ichael
I was thinking though that because everything is being queued we could divert some calls into the car
On Mon, 29 Apr 2024, 18:58 Michael Balzer, <dexter@expeedo.de> wrote:
Michael,
I've found a severe design flaw with your poller change. Sorry, I should have seen that before, and shouldn't have merged this.
You have moved the standard CAN frame processing from the vehicle task into the CAN task by changing the vehicle from a CAN listener to a CAN callback processor. That will break all kind of things, vehicles like the Twizy, Smart and many others rely on frame processing being done in the dedicated vehicle task.
This especially induces issues regarding CAN processing capacity, as the vehicles rely on having a separate context and not needing to decouple complex processing of incoming frames. So this will degrade the CAN processing performance seriously in many cases, where additional steps involving file or network I/O need to be done.
So this needs to be changed back.
I assumed you introduced a new dedicated poller task but kept the vehicle task intact. From your naming (OvmsVehicle::IncomingPollRxFrame), it seems you misinterpreted the vehicle task's purpose as only being used for polling.
I assume this isn't a small change…? If so we should revert the poller merge, to avoid having a defunctional edge build state until the fix.
Secondly: logging is generally expensive regardless of the log level control and log channels enabled. Any log message needs to be queued to the log system, so involves a lock and a potential wait state (for the queue) & resulting context switch (= minimum delay of 10 ms). Therefore, logging must be avoided as far as possible in any time critical context, and is forbidden under some circumstances, e.g. in a timer callback (see FreeRTOS docs on this). The log system load multiplies with connected web clients or enabled file logging and enabled debug / verbose level logging -- that quickly becomes too much, usually triggering the task watchdog.
Your logging of nearly all bus events passing to/from the poller (especially the log entry in Queue_PollerFrame) becomes an issue on any vehicle that has high frequency running process data frames on the bus, like the Twizy or Smart. As a counter measure, I've just added a runtime control for all the poller's verbose logging (by default now off), and changed some debug level logs to verbose. Not sure if I've catched all that may need to be silenced by default. Please check all your log calls and place them under the new "trace" control flag wherever appropriate.
This won't help avoiding issues with process data frame buses though.
Shall I revert the poller merge for now?
Regards, Michael
Am 29.04.24 um 06:18 schrieb Michael Geddes:
Btw I included the log changes in the p/r which is a few small commits for the poller.
//.
On Mon, 29 Apr 2024, 07:20 Michael Geddes, <frog@bunyip.wheelycreek.net> wrote:
Hey Michael,
I've got to work now (it's Monday), but I suspect those 'giving up' are from unsolicited messages on the bus.
I can re-order things so that the message will likely be 'dropped (no poll entry)' rather than the time-out message.
And make it a verbose log.
//.ichael
On Mon, 29 Apr 2024 at 00:25, Michael Balzer <dexter@expeedo.de> wrote:
Michael,
forwarding the Twizy logs to you directly, as they contain the user location.
He has just verified it's the new version, he says the module stops responding as soon as he turns on the Twizy.
His description of his actions is a bit ambiguous, and it seems he didn't enable logging to the file persistently.
According to the server, these were the version boot times:
2024-04-28 15:30:56 0 3.3.004-32-g125e0841/ota_0/edge (build idf v3.3.4-849-g6e214dc335 Apr 26 2024 19:16:50) 2024-04-28 16:21:08 0 3.3.004-32-g125e0841/ota_0/edge (build idf v3.3.4-849-g6e214dc335 Apr 26 2024 19:16:50) 2024-04-28 16:38:33 0 3.3.004-63-gf3595561/ota_1/edge (build idf v3.3.4-849-g6e214dc335 Apr 27 2024 07:44:50) 2024-04-28 16:40:57 0 3.3.004-63-gf3595561/ota_1/edge (build idf v3.3.4-849-g6e214dc335 Apr 27 2024 07:44:50) 2024-04-28 16:43:14 0 3.3.004-63-gf3595561/ota_1/edge (build idf v3.3.4-849-g6e214dc335 Apr 27 2024 07:44:50) 2024-04-28 16:46:39 0 3.3.004-63-gf3595561/ota_1/edge (build idf v3.3.4-849-g6e214dc335 Apr 27 2024 07:44:50) 2024-04-28 16:54:44 0 3.3.004-32-g125e0841/ota_0/edge (build idf v3.3.4-849-g6e214dc335 Apr 26 2024 19:16:50)
Attached is also his crash debug log -- a2ll doesn't tell much about what happened, but maybe you get an idea from this.
After the boot at 16:46, there are immediately lots of these messages:
2024-04-28 16:46:33.792 CEST D (39042) vehicle-poll: Poller: Queue PollerFrame() 2024-04-28 16:46:33.792 CEST D (39042) vehicle-poll: [1]Poller: Incoming - giving up
Regards, Michael
Am 28.04.24 um 16:44 schrieb Michael Geddes:
Ah. OK.
I could try to fix the vin thing using the new way of doing it and get rid of a semaphore?
It would at least identify the problem possibly?
Michael
On Sun, 28 Apr 2024, 22:32 Michael Balzer via OvmsDev, < ovmsdev@lists.openvehicles.com> wrote:
Not sure if that's the problem, but I've found a different behaviour with the new PollSetState() implementation.
The old version only did anything if the new state actually was different from the previous one. The Twizy relies on this behaviour, calling PollSetState() from the per second ticker (see OvmsVehicleRenaultTwizy::ObdTicker1).
The new implementation apparently always sends the PollState command to the task, and that in turn always at least locks the poller mutex. Not sure if/how that could cause the observed issues, but it definitely adds quite some (unnecessary?) lock/unlock operations.
Am 28.04.24 um 16:05 schrieb Michael Balzer via OvmsDev:
The Twizy uses the poller to query the VIN (once) and DTCs (every 10 seconds while driving), see rt_obd2.cpp.
It also has its own version of the OBD single request (OvmsVehicleRenaultTwizy::ObdRequest), which was the precursor for the generalized version. This is used by custom/user Twizy plugins and scripts to access ECU internals.
The Twizy doesn't use IncomingPollRxFrame, but the Twizy's IncomingPollReply handler will log any poll responses it doesn't know about, so that could lead to a lot of log output if something goes wrong there.
Am 28.04.24 um 15:49 schrieb Michael Geddes via OvmsDev:
AFAICT the twizzy doesn't use the poller list at all. So is it missing a call-back or something??
I can see a potential problem with IncomingPollRxFrame being called twice as much as it should be but only when there is a poll list. Maybe commenting out this would do it. (I can find another away to get this called on the thread I want). This might be the problem with the smarted
void OvmsVehicle::OvmsVehicleSignal::IncomingPollRxFrame(canbus* bus, CAN_frame_t *frame, bool success) { //if (Ready()) // m_parent->IncomingPollRxFrame(frame, success); }
//.
On Sun, 28 Apr 2024 at 21:10, Michael Balzer via OvmsDev < ovmsdev@lists.openvehicles.com> wrote:
There may also be an issue with the Renault Twizy, I've received a report of a user who is using the edge builds, that the latest build wouldn't work.
He reports all kinds of errors and warnings signaled by the car during driving, and switching back to the previous build fixed the issues.
I've asked him to provide a debug log excerpt if possible.
Regards, Michael
Am 28.04.24 um 14:29 schrieb Michael Geddes via OvmsDev:
OK. That's bad.
Does the reading work in general?
Is it just the writing commands?
Raise a ticket on github and tag me in and we can address it that way.
Michael
On Sun, 28 Apr 2024, 19:49 Thomas Heuer via OvmsDev, < ovmsdev@lists.openvehicles.com> wrote:
Hi,
The new poller code doesn't seem to work properly with the smarted.
D (218831) vehicle-poll: [1]PollerNextTick(PRI): cycle complete for ticker=215
V (218831) vehicle-poll: Standard Poll Series: List reset
D (218831) vehicle-poll: PollSeriesList::NextPollEntry[!v.standard]: ReachedEnd
V (218831) vehicle-poll: [1]PollerSend: Poller Reached End
D (219691) vehicle-poll: Poller: Queue PollerFrame()
D (219691) vehicle-poll: Poller: Queue PollerFrame()
V (219691) vehicle-poll: Pollers: FrameRx(bus=2)
D (219691) vehicle-poll: Poller: Queue PollerFrame()
V (219691) vehicle-poll: Pollers: FrameRx(bus=2)
V (219691) vehicle-poll: Pollers: FrameRx(bus=2)
D (219691) vehicle-poll: Poller: Queue PollerFrame()
*OVMS#* unlock 22 Vehicle unlocked
V (219691) vehicle-poll: Pollers: FrameRx(bus=2)
D (219691) vehicle-poll: Poller: Queue PollerFrame()
V (219691) vehicle-poll: Pollers: FrameRx(bus=2)
D (219701) vehicle-poll: Poller: Queue PollerFrame()
V (219701) vehicle-poll: Pollers: FrameRx(bus=2)
D (219701) vehicle-poll: Poller: Queue PollerFrame()
V (219701) vehicle-poll: Pollers: FrameRx(bus=2)
D (219701) vehicle-poll: Poller: Queue PollerFrame()
V (219701) vehicle-poll: Pollers: FrameRx(bus=2)
D (219701) vehicle-poll: Poller: Queue PollerFrame()
V (219701) vehicle-poll: Pollers: FrameRx(bus=2)
D (219701) vehicle-poll: Poller: Queue PollerFrame()
V (219701) vehicle-poll: Pollers: FrameRx(bus=2)
D (219701) vehicle-poll: Poller: Queue PollerFrame()
V (219701) vehicle-poll: Pollers: FrameRx(bus=2)
D (219701) vehicle-poll: Poller: Queue PollerFrame()
V (219701) vehicle-poll: Pollers: FrameRx(bus=2)
D (219701) vehicle-poll: Poller: Queue PollerFrame()
V (219701) vehicle-poll: Pollers: FrameRx(bus=2)
D (219701) vehicle-poll: Poller: Queue PollerFrame()
V (219701) vehicle-poll: Pollers: FrameRx(bus=2)
D (219701) vehicle-poll: Poller: Queue PollerFrame()
V (219701) vehicle-poll: Pollers: FrameRx(bus=2)
D (219701) vehicle-poll: Poller: Queue PollerFrame()
*Von:* OvmsDev <ovmsdev-bounces@lists.openvehicles.com> *Im Auftrag von *Michael Geddes via OvmsDev *Gesendet:* Sonntag, 28. April 2024 12:27 *An:* OVMS Developers <ovmsdev@lists.openvehicles.com> *Cc:* Michael Geddes <frog@bunyip.wheelycreek.net> *Betreff:* [Ovmsdev] OVMS Poller module/singleton
Hey all,
The poller singleton code that I've been working on for over a year now is merged in. (Thanks Michael for expediting the final step).
This includes separate multi-frame states per bus and multiple poll lists as well as non-blocking one off queries. As well as more 'states'.
I have included some programming documentation in the change but am happy to supply more if needed.
The ioniq 5 code has some examples of how it can be used. Some examples are:
* grabbing the vin as a one shot without blocking
* having a short list of queries that are polled quickly for obd2ecu (this also demonstrates using a shorter frame break value and then a break after successful a response)
Have a play please!
Also interested in hearing what user tools might be worth looking at next for the poller object.
//.ichael G.
_______________________________________________ OvmsDev mailing list OvmsDev@lists.openvehicles.com http://lists.openvehicles.com/mailman/listinfo/ovmsdev
_______________________________________________
OvmsDev mailing list
OvmsDev@lists.openvehicles.com
http://lists.openvehicles.com/mailman/listinfo/ovmsdev
--
Michael Balzer * Helkenberger Weg 9 * D-58256 Ennepetal
Fon 02333 / 833 5735 * Handy 0176 / 206 989 26
_______________________________________________
OvmsDev mailing list
OvmsDev@lists.openvehicles.com
http://lists.openvehicles.com/mailman/listinfo/ovmsdev
--
Michael Balzer * Helkenberger Weg 9 * D-58256 Ennepetal
Fon 02333 / 833 5735 * Handy 0176 / 206 989 26
_______________________________________________ OvmsDev mailing list OvmsDev@lists.openvehicles.com http://lists.openvehicles.com/mailman/listinfo/ovmsdev
--
Michael Balzer * Helkenberger Weg 9 * D-58256 Ennepetal
Fon 02333 / 833 5735 * Handy 0176 / 206 989 26
--
Michael Balzer * Helkenberger Weg 9 * D-58256 Ennepetal
Fon 02333 / 833 5735 * Handy 0176 / 206 989 26
--
Michael Balzer * Helkenberger Weg 9 * D-58256 Ennepetal
Fon 02333 / 833 5735 * Handy 0176 / 206 989 26
_______________________________________________ OvmsDev mailing list OvmsDev@lists.openvehicles.com http://lists.openvehicles.com/mailman/listinfo/ovmsdev
--
Michael Balzer * Helkenberger Weg 9 * D-58256 Ennepetal
Fon 02333 / 833 5735 * Handy 0176 / 206 989 26
_______________________________________________ OvmsDev mailing list OvmsDev@lists.openvehicles.com http://lists.openvehicles.com/mailman/listinfo/ovmsdev
--
Michael Balzer * Helkenberger Weg 9 * D-58256 Ennepetal
Fon 02333 / 833 5735 * Handy 0176 / 206 989 26
_______________________________________________ OvmsDev mailing list OvmsDev@lists.openvehicles.com http://lists.openvehicles.com/mailman/listinfo/ovmsdev
OK. I did some logging changes to confirm that it's only _just_ getting overwhelmed..ie dropping 1 (or occasionally 2) RX frames in a row but then picking the next ones up... So increasing the queue size (I doubled it but maybe that was excessive) seems to do the trick. I think the queue size is in bytes and the queue packet size has increased at least a little bit. Michael On Sat, 4 May 2024, 09:24 Michael Geddes, <frog@bunyip.wheelycreek.net> wrote:
Hey Derek,
I do have a friend with a Leaf in his EV collection, so I can try grab some more info from his car and work out exactly what (tf) is going on.
//.
On Sat, 4 May 2024 at 08:13, <frog@bunyip.wheelycreek.net> wrote:
HI Derek,
For a start, I’m very sorry that the ovms put your car in limp mode. That’s quite bad.
Just FYI those overflows that you have copied are about receiving and not sending information, so maybe the poller thread is being overwhelmed or stalled somehow.
I’ve been looking at the code and wondered if you have the ‘can write’ flag set to true or not? (Though it shouldn’t make that much difference)
Even if it were somehow mistakenly polling (ie in the wrong pollstate), it should not be doing it that frequently – (at most once a minute). And the poll throttle would still be on 1 per second.. so that should put a limit on sends.. and so it is really worrying that somehow that is not happening :/
If you have more logs that you send me that don’t just include that particular overflow message that would be good. Did it crash/reboot? Maybe it crashed repeatedly?
//.ichael
*From:* OvmsDev <ovmsdev-bounces@lists.openvehicles.com> *On Behalf Of *Derek Caudwell via OvmsDev *Sent:* Friday, May 3, 2024 6:54 PM *To:* OVMS Developers <ovmsdev@lists.openvehicles.com> *Cc:* Derek Caudwell <d.caudwell@gmail.com> *Subject:* Re: [Ovmsdev] OVMS Poller module/singleton
Hi Michael,
When running firmware 3.3.004-74-gbd4e7196 on my Nissan Leaf I suspect (but can't be 100% sure as it's only been 24h without fault) the new poller caused the car to throw the attached faults from overloading the can bus whilst driving. The fault was sufficient to send the car into limp mode and could not be driven until cleared with LeafSpy. Ovms should not be polling in the driving state, so I'm not sure why the poller is overflowing.
The ovms log repeats this overflow in rapid succession right before the failure occurred. I have since reverted to an earlier version and it might be advisable for other Leaf owners to do so until the new poller is fully operational.
2024-05-02 12:22:28.316 NZST I (36847486) vehicle-poll: Poller[Frame]: Task Queue Overflow
2024-05-02 12:22:28.316 NZST I (36847486) vehicle-poll: Poller[Frame]: Task Queue Overflow
2024-05-02 12:22:28.316 NZST I (36847486) vehicle-poll: Poller[Frame]: Task Queue Overflow
2024-05-02 12:22:28.326 NZST I (36847496) vehicle-poll: Poller[Frame]: Task Queue Overflow
2024-05-02 12:22:28.326 NZST I (36847496) vehicle-poll: Poller[Frame]: Task Queue Overflow
2024-05-02 12:22:28.326 NZST I (36847496) vehicle-poll: Poller[Frame]: Task Queue Overflow
2024-05-02 12:22:28.326 NZST I (36847496) vehicle-poll: Poller[Frame]: Task Queue Overflow
2024-05-02 12:22:28.326 NZST I (36847496) vehicle-poll: Poller[Frame]: Task Queue Overflow
2024-05-02 12:22:28.326 NZST I (36847496) vehicle-poll: Poller[Frame]: Task Queue Overflow
2024-05-02 12:22:28.326 NZST I (36847496) vehicle-poll: Poller[Frame]: Task Queue Overflow
2024-05-02 12:22:28.326 NZST I (36847496) vehicle-poll: Poller[Frame]: Task Queue Overflow
2024-05-02 12:22:28.336 NZST I (36847506) vehicle-poll: Poller[Frame]: Task Queue Overflow
2024-05-02 12:22:28.336 NZST I (36847506) vehicle-poll: Poller[Frame]: Task Queue Overflow
2024-05-02 12:22:28.336 NZST I (36847506) vehicle-poll: Poller[Frame]: Task Queue Overflow
2024-05-02 12:22:28.336 NZST I (36847506) vehicle-poll: Poller[Frame]: Task Queue Overflow
2024-05-02 12:22:28.346 NZST I (36847516) vehicle-poll: Poller[Frame]: Task Queue Overflow
2024-05-02 12:22:28.346 NZST I (36847516) vehicle-poll: Poller[Frame]: Task Queue Overflow
2024-05-02 12:22:28.346 NZST I (36847516) vehicle-poll: Poller[Frame]: Task Queue Overflow
2024-05-02 12:22:28.346 NZST I (36847516) vehicle-poll: Poller[Frame]: Task Queue Overflow
2024-05-02 12:22:28.356 NZST I (36847526) vehicle-poll: Poller[Frame]: Task Queue Overflow
2024-05-02 12:22:28.356 NZST I (36847526) vehicle-poll: Poller[Frame]: Task Queue Overflow
2024-05-02 12:22:28.356 NZST I (36847526) vehicle-poll: Poller[Frame]: Task Queue Overflow
2024-05-02 12:22:28.356 NZST I (36847526) vehicle-poll: Poller[Frame]: Task Queue Overflow
On Fri, 3 May 2024 at 05:40, Michael Balzer via OvmsDev < ovmsdev@lists.openvehicles.com> wrote:
A task may delete itself by calling vTaskDelete(NULL) as the final statement, and that's normally a better way to shutdown a task, if you can signal the task it should terminate. Deleting a task from outside may always result in resources taken by the task not being freed, as the task gets terminated wherever it just is.
As the vehicle task also needs to access vehicle data memory, vehicle destruction should not begin until the task has finished, otherwise a task job already running while the vehicle destruction takes place may run into an illegal memory access (access after free). Keep in mind, destructors are executed bottom up, so waiting for the task shutdown within the destructor won't help.
Also, I think "MyCan.DeregisterCallback(TAG)" in ShuttingDown() is now obsolete.
Regards, Michael
Am 02.05.24 um 15:23 schrieb Michael Geddes:
Thanks.
On that race condition... do you think we are better to just delete the task or I saw one recommendation that
We can delete it outside the while loop in the task itself!
//.ichael
On Tue, 30 Apr 2024, 17:46 Michael Balzer via OvmsDev, < ovmsdev@lists.openvehicles.com> wrote:
OK, understood & merged, thanks for the quick fix/workaround.
I'll ask the Twizy driver to test this.
Regards, Michael
PS: side note: there's a shutdown race condition arising from `while (!m_is_shutdown)` in the new `OvmsVehicle::VehicleTask()`: if the task receives a message while m_is_shutdown already has been set, it will exit the loop and return from the task function, which isn't allowed. I think FreeRTOS will abort in that case.
Am 30.04.24 um 08:55 schrieb Michael Geddes:
No it will start the poll thread of the poller fine for those that don't use it. That's the last commit.... so that should be covered. When the callback is registered the thread is force started.
This is not to say that what you are suggesting isn't a better way forward... just that it should work.
Michael
On Tue, 30 Apr 2024, 14:51 Michael Balzer via OvmsDev, < ovmsdev@lists.openvehicles.com> wrote:
Michael,
(taking this back to the list, as other developers may have helpful ideas or suggestions)
from a first check, your new patch (PR #1008) won't help for vehicles that don't use the poller, like the generic DBC vehicle or the Fiat 500 (plus possibly non-public third party vehicles). As the poller is normally compiled in, these would need a run time switch to re-enable the vehicle task, or more suitably default into that configuration and switch to the poller task only when the poller gets initialized.
How about moving the task back into the vehicle class, but keeping your task message extensions while doing so, and adding a way for the poller to hook into the task? The dedicated vehicle task is an essential part of the vehicle framework, but I do remember some occasions where a general way to pass custom messages to the vehicle task would have been helpful to use the task for more than CAN processing.
If the poller shall become avaible as a separate service that can be used without any vehicle instance (currently not a defined use case), the construct of a CAN processor task that can be extended for custom messages (or a message processor task that can subscribe to CAN frames) could be factored out into a dedicated class or template. The poller could then create his own instance of that class, if it cannot hook into an existing one.
Btw, in case you're not aware of this, FreeRTOS also provides queue sets ( https://www.freertos.org/RTOS-queue-sets.html). We haven't used them in the OVMS yet, but they could be useful, especially if message unions become large or tasks shall be able to dynamically subscribe to different message sources.
Regards, Michael
Am 30.04.24 um 01:20 schrieb Michael Geddes:
It might be worth reverting, but, I've got a patch suggestion that I'll push up which will let me know if I understand everything and which might provide a solution.
If this isn't going to work then revert. (P/R coming)
While the poller was still a part of the vehicle class it was probably still all ok. The poller had taken over what I assume you are talking about as the vehicle task. A call-back fromthe poller was calling IncomingPollRxFrame which was then coming from the (now) poller task (is that correct?)
While we have OVMS_COMP_POLLER config defined, we could just use the poller task to provide the IncomingPollRxFrame call-back from the poller (was vehicle?) task.
The problem is when OVMS_COMP_POLLER is undefined, we need an alternate (maybe we could use the 'Event' loop then) which is when I hacked that bad solution.
//.ichael
I was thinking though that because everything is being queued we could divert some calls into the car
On Mon, 29 Apr 2024, 18:58 Michael Balzer, <dexter@expeedo.de> wrote:
Michael,
I've found a severe design flaw with your poller change. Sorry, I should have seen that before, and shouldn't have merged this.
You have moved the standard CAN frame processing from the vehicle task into the CAN task by changing the vehicle from a CAN listener to a CAN callback processor. That will break all kind of things, vehicles like the Twizy, Smart and many others rely on frame processing being done in the dedicated vehicle task.
This especially induces issues regarding CAN processing capacity, as the vehicles rely on having a separate context and not needing to decouple complex processing of incoming frames. So this will degrade the CAN processing performance seriously in many cases, where additional steps involving file or network I/O need to be done.
So this needs to be changed back.
I assumed you introduced a new dedicated poller task but kept the vehicle task intact. From your naming (OvmsVehicle::IncomingPollRxFrame), it seems you misinterpreted the vehicle task's purpose as only being used for polling.
I assume this isn't a small change…? If so we should revert the poller merge, to avoid having a defunctional edge build state until the fix.
Secondly: logging is generally expensive regardless of the log level control and log channels enabled. Any log message needs to be queued to the log system, so involves a lock and a potential wait state (for the queue) & resulting context switch (= minimum delay of 10 ms). Therefore, logging must be avoided as far as possible in any time critical context, and is forbidden under some circumstances, e.g. in a timer callback (see FreeRTOS docs on this). The log system load multiplies with connected web clients or enabled file logging and enabled debug / verbose level logging -- that quickly becomes too much, usually triggering the task watchdog.
Your logging of nearly all bus events passing to/from the poller (especially the log entry in Queue_PollerFrame) becomes an issue on any vehicle that has high frequency running process data frames on the bus, like the Twizy or Smart. As a counter measure, I've just added a runtime control for all the poller's verbose logging (by default now off), and changed some debug level logs to verbose. Not sure if I've catched all that may need to be silenced by default. Please check all your log calls and place them under the new "trace" control flag wherever appropriate.
This won't help avoiding issues with process data frame buses though.
Shall I revert the poller merge for now?
Regards, Michael
Am 29.04.24 um 06:18 schrieb Michael Geddes:
Btw I included the log changes in the p/r which is a few small commits for the poller.
//.
On Mon, 29 Apr 2024, 07:20 Michael Geddes, <frog@bunyip.wheelycreek.net> wrote:
Hey Michael,
I've got to work now (it's Monday), but I suspect those 'giving up' are from unsolicited messages on the bus.
I can re-order things so that the message will likely be 'dropped (no poll entry)' rather than the time-out message.
And make it a verbose log.
//.ichael
On Mon, 29 Apr 2024 at 00:25, Michael Balzer <dexter@expeedo.de> wrote:
Michael,
forwarding the Twizy logs to you directly, as they contain the user location.
He has just verified it's the new version, he says the module stops responding as soon as he turns on the Twizy.
His description of his actions is a bit ambiguous, and it seems he didn't enable logging to the file persistently.
According to the server, these were the version boot times:
2024-04-28 15:30:56 0 3.3.004-32-g125e0841/ota_0/edge (build idf v3.3.4-849-g6e214dc335 Apr 26 2024 19:16:50) 2024-04-28 16:21:08 0 3.3.004-32-g125e0841/ota_0/edge (build idf v3.3.4-849-g6e214dc335 Apr 26 2024 19:16:50) 2024-04-28 16:38:33 0 3.3.004-63-gf3595561/ota_1/edge (build idf v3.3.4-849-g6e214dc335 Apr 27 2024 07:44:50) 2024-04-28 16:40:57 0 3.3.004-63-gf3595561/ota_1/edge (build idf v3.3.4-849-g6e214dc335 Apr 27 2024 07:44:50) 2024-04-28 16:43:14 0 3.3.004-63-gf3595561/ota_1/edge (build idf v3.3.4-849-g6e214dc335 Apr 27 2024 07:44:50) 2024-04-28 16:46:39 0 3.3.004-63-gf3595561/ota_1/edge (build idf v3.3.4-849-g6e214dc335 Apr 27 2024 07:44:50) 2024-04-28 16:54:44 0 3.3.004-32-g125e0841/ota_0/edge (build idf v3.3.4-849-g6e214dc335 Apr 26 2024 19:16:50)
Attached is also his crash debug log -- a2ll doesn't tell much about what happened, but maybe you get an idea from this.
After the boot at 16:46, there are immediately lots of these messages:
2024-04-28 16:46:33.792 CEST D (39042) vehicle-poll: Poller: Queue PollerFrame() 2024-04-28 16:46:33.792 CEST D (39042) vehicle-poll: [1]Poller: Incoming - giving up
Regards, Michael
Am 28.04.24 um 16:44 schrieb Michael Geddes:
Ah. OK.
I could try to fix the vin thing using the new way of doing it and get rid of a semaphore?
It would at least identify the problem possibly?
Michael
On Sun, 28 Apr 2024, 22:32 Michael Balzer via OvmsDev, < ovmsdev@lists.openvehicles.com> wrote:
Not sure if that's the problem, but I've found a different behaviour with the new PollSetState() implementation.
The old version only did anything if the new state actually was different from the previous one. The Twizy relies on this behaviour, calling PollSetState() from the per second ticker (see OvmsVehicleRenaultTwizy::ObdTicker1).
The new implementation apparently always sends the PollState command to the task, and that in turn always at least locks the poller mutex. Not sure if/how that could cause the observed issues, but it definitely adds quite some (unnecessary?) lock/unlock operations.
Am 28.04.24 um 16:05 schrieb Michael Balzer via OvmsDev:
The Twizy uses the poller to query the VIN (once) and DTCs (every 10 seconds while driving), see rt_obd2.cpp.
It also has its own version of the OBD single request (OvmsVehicleRenaultTwizy::ObdRequest), which was the precursor for the generalized version. This is used by custom/user Twizy plugins and scripts to access ECU internals.
The Twizy doesn't use IncomingPollRxFrame, but the Twizy's IncomingPollReply handler will log any poll responses it doesn't know about, so that could lead to a lot of log output if something goes wrong there.
Am 28.04.24 um 15:49 schrieb Michael Geddes via OvmsDev:
AFAICT the twizzy doesn't use the poller list at all. So is it missing a call-back or something??
I can see a potential problem with IncomingPollRxFrame being called twice as much as it should be but only when there is a poll list. Maybe commenting out this would do it. (I can find another away to get this called on the thread I want). This might be the problem with the smarted
void OvmsVehicle::OvmsVehicleSignal::IncomingPollRxFrame(canbus* bus, CAN_frame_t *frame, bool success) { //if (Ready()) // m_parent->IncomingPollRxFrame(frame, success); }
//.
On Sun, 28 Apr 2024 at 21:10, Michael Balzer via OvmsDev < ovmsdev@lists.openvehicles.com> wrote:
There may also be an issue with the Renault Twizy, I've received a report of a user who is using the edge builds, that the latest build wouldn't work.
He reports all kinds of errors and warnings signaled by the car during driving, and switching back to the previous build fixed the issues.
I've asked him to provide a debug log excerpt if possible.
Regards, Michael
Am 28.04.24 um 14:29 schrieb Michael Geddes via OvmsDev:
OK. That's bad.
Does the reading work in general?
Is it just the writing commands?
Raise a ticket on github and tag me in and we can address it that way.
Michael
On Sun, 28 Apr 2024, 19:49 Thomas Heuer via OvmsDev, < ovmsdev@lists.openvehicles.com> wrote:
Hi,
The new poller code doesn't seem to work properly with the smarted.
D (218831) vehicle-poll: [1]PollerNextTick(PRI): cycle complete for ticker=215
V (218831) vehicle-poll: Standard Poll Series: List reset
D (218831) vehicle-poll: PollSeriesList::NextPollEntry[!v.standard]: ReachedEnd
V (218831) vehicle-poll: [1]PollerSend: Poller Reached End
D (219691) vehicle-poll: Poller: Queue PollerFrame()
D (219691) vehicle-poll: Poller: Queue PollerFrame()
V (219691) vehicle-poll: Pollers: FrameRx(bus=2)
D (219691) vehicle-poll: Poller: Queue PollerFrame()
V (219691) vehicle-poll: Pollers: FrameRx(bus=2)
V (219691) vehicle-poll: Pollers: FrameRx(bus=2)
D (219691) vehicle-poll: Poller: Queue PollerFrame()
*OVMS#* unlock 22 Vehicle unlocked
V (219691) vehicle-poll: Pollers: FrameRx(bus=2)
D (219691) vehicle-poll: Poller: Queue PollerFrame()
V (219691) vehicle-poll: Pollers: FrameRx(bus=2)
D (219701) vehicle-poll: Poller: Queue PollerFrame()
V (219701) vehicle-poll: Pollers: FrameRx(bus=2)
D (219701) vehicle-poll: Poller: Queue PollerFrame()
V (219701) vehicle-poll: Pollers: FrameRx(bus=2)
D (219701) vehicle-poll: Poller: Queue PollerFrame()
V (219701) vehicle-poll: Pollers: FrameRx(bus=2)
D (219701) vehicle-poll: Poller: Queue PollerFrame()
V (219701) vehicle-poll: Pollers: FrameRx(bus=2)
D (219701) vehicle-poll: Poller: Queue PollerFrame()
V (219701) vehicle-poll: Pollers: FrameRx(bus=2)
D (219701) vehicle-poll: Poller: Queue PollerFrame()
V (219701) vehicle-poll: Pollers: FrameRx(bus=2)
D (219701) vehicle-poll: Poller: Queue PollerFrame()
V (219701) vehicle-poll: Pollers: FrameRx(bus=2)
D (219701) vehicle-poll: Poller: Queue PollerFrame()
V (219701) vehicle-poll: Pollers: FrameRx(bus=2)
D (219701) vehicle-poll: Poller: Queue PollerFrame()
V (219701) vehicle-poll: Pollers: FrameRx(bus=2)
D (219701) vehicle-poll: Poller: Queue PollerFrame()
V (219701) vehicle-poll: Pollers: FrameRx(bus=2)
D (219701) vehicle-poll: Poller: Queue PollerFrame()
*Von:* OvmsDev <ovmsdev-bounces@lists.openvehicles.com> *Im Auftrag von *Michael Geddes via OvmsDev *Gesendet:* Sonntag, 28. April 2024 12:27 *An:* OVMS Developers <ovmsdev@lists.openvehicles.com> *Cc:* Michael Geddes <frog@bunyip.wheelycreek.net> *Betreff:* [Ovmsdev] OVMS Poller module/singleton
Hey all,
The poller singleton code that I've been working on for over a year now is merged in. (Thanks Michael for expediting the final step).
This includes separate multi-frame states per bus and multiple poll lists as well as non-blocking one off queries. As well as more 'states'.
I have included some programming documentation in the change but am happy to supply more if needed.
The ioniq 5 code has some examples of how it can be used. Some examples are:
* grabbing the vin as a one shot without blocking
* having a short list of queries that are polled quickly for obd2ecu (this also demonstrates using a shorter frame break value and then a break after successful a response)
Have a play please!
Also interested in hearing what user tools might be worth looking at next for the poller object.
//.ichael G.
_______________________________________________ OvmsDev mailing list OvmsDev@lists.openvehicles.com http://lists.openvehicles.com/mailman/listinfo/ovmsdev
_______________________________________________
OvmsDev mailing list
OvmsDev@lists.openvehicles.com
http://lists.openvehicles.com/mailman/listinfo/ovmsdev
--
Michael Balzer * Helkenberger Weg 9 * D-58256 Ennepetal
Fon 02333 / 833 5735 * Handy 0176 / 206 989 26
_______________________________________________ OvmsDev mailing list OvmsDev@lists.openvehicles.com http://lists.openvehicles.com/mailman/listinfo/ovmsdev
_______________________________________________
OvmsDev mailing list
OvmsDev@lists.openvehicles.com
http://lists.openvehicles.com/mailman/listinfo/ovmsdev
--
Michael Balzer * Helkenberger Weg 9 * D-58256 Ennepetal
Fon 02333 / 833 5735 * Handy 0176 / 206 989 26
_______________________________________________
OvmsDev mailing list
OvmsDev@lists.openvehicles.com
http://lists.openvehicles.com/mailman/listinfo/ovmsdev
--
Michael Balzer * Helkenberger Weg 9 * D-58256 Ennepetal
Fon 02333 / 833 5735 * Handy 0176 / 206 989 26
_______________________________________________ OvmsDev mailing list OvmsDev@lists.openvehicles.com http://lists.openvehicles.com/mailman/listinfo/ovmsdev
--
Michael Balzer * Helkenberger Weg 9 * D-58256 Ennepetal
Fon 02333 / 833 5735 * Handy 0176 / 206 989 26
--
Michael Balzer * Helkenberger Weg 9 * D-58256 Ennepetal
Fon 02333 / 833 5735 * Handy 0176 / 206 989 26
--
Michael Balzer * Helkenberger Weg 9 * D-58256 Ennepetal
Fon 02333 / 833 5735 * Handy 0176 / 206 989 26
_______________________________________________ OvmsDev mailing list OvmsDev@lists.openvehicles.com http://lists.openvehicles.com/mailman/listinfo/ovmsdev
--
Michael Balzer * Helkenberger Weg 9 * D-58256 Ennepetal
Fon 02333 / 833 5735 * Handy 0176 / 206 989 26
_______________________________________________ OvmsDev mailing list OvmsDev@lists.openvehicles.com http://lists.openvehicles.com/mailman/listinfo/ovmsdev
--
Michael Balzer * Helkenberger Weg 9 * D-58256 Ennepetal
Fon 02333 / 833 5735 * Handy 0176 / 206 989 26
_______________________________________________ OvmsDev mailing list OvmsDev@lists.openvehicles.com http://lists.openvehicles.com/mailman/listinfo/ovmsdev
Michael, the queue size isn't in bytes, it's in messages:
* @param uxQueueLength The maximum number of items that the queue can contain. * * @param uxItemSize The number of bytes each item in the queue will require.
Also, from the time stamps in Dereks log excerpt, there were quite some dropped frames in that time window -- at least 23 frames in 40 ms, that's bad. Queue sizes are currently: CONFIG_OVMS_HW_CAN_RX_QUEUE_SIZE=60 CONFIG_OVMS_VEHICLE_CAN_RX_QUEUE_SIZE=60 The new poller now channels all TX callbacks through the task queue additionally to RX and commands. So setting the queue size to be larger than the CAN RX queue size seems appropriate. Nevertheless, an overflow with more than 60 waiting messages still indicates some too long processing time in the vehicle task. TX callbacks previously were done directly in the CAN context, and no current vehicle overrides the empty default handler, so this imposed almost no additional overhead. By requiring a queue entry for each TX callback, this feature now has a potentially high impact for all vehicles. If passing these to the task is actually necessary, it needs to become an opt-in feature, so only vehicles subscribing to the callback actually need to cope with that additional load & potential processing delays involved. Regards, Michael Am 05.05.24 um 11:59 schrieb Michael Geddes via OvmsDev:
OK.
I did some logging changes to confirm that it's only _just_ getting overwhelmed..ie dropping 1 (or occasionally 2) RX frames in a row but then picking the next ones up...
So increasing the queue size (I doubled it but maybe that was excessive) seems to do the trick. I think the queue size is in bytes and the queue packet size has increased at least a little bit.
Michael
On Sat, 4 May 2024, 09:24 Michael Geddes, <frog@bunyip.wheelycreek.net> wrote:
Hey Derek,
I do have a friend with a Leaf in his EV collection, so I can try grab some more info from his car and work out exactly what (tf) is going on.
//.
On Sat, 4 May 2024 at 08:13, <frog@bunyip.wheelycreek.net> wrote:
HI Derek,
For a start, I’m very sorry that the ovms put your car in limp mode. That’s quite bad.
Just FYI those overflows that you have copied are about receiving and not sending information, so maybe the poller thread is being overwhelmed or stalled somehow.
I’ve been looking at the code and wondered if you have the ‘can write’ flag set to true or not? (Though it shouldn’t make that much difference)
Even if it were somehow mistakenly polling (ie in the wrong pollstate), it should not be doing it that frequently – (at most once a minute). And the poll throttle would still be on 1 per second.. so that should put a limit on sends.. and so it is really worrying that somehow that is not happening :/
If you have more logs that you send me that don’t just include that particular overflow message that would be good. Did it crash/reboot? Maybe it crashed repeatedly?
//.ichael
*From:*OvmsDev <ovmsdev-bounces@lists.openvehicles.com> *On Behalf Of *Derek Caudwell via OvmsDev *Sent:* Friday, May 3, 2024 6:54 PM *To:* OVMS Developers <ovmsdev@lists.openvehicles.com> *Cc:* Derek Caudwell <d.caudwell@gmail.com> *Subject:* Re: [Ovmsdev] OVMS Poller module/singleton
Hi Michael,
When running firmware 3.3.004-74-gbd4e7196 on my Nissan Leaf I suspect (but can't be 100% sure as it's only been 24h without fault) the new poller caused the car to throw the attached faults from overloading the can bus whilst driving. The fault was sufficient to send the car into limp mode and could not be driven until cleared with LeafSpy. Ovms should not be polling in the driving state, so I'm not sure why the poller is overflowing.
The ovms log repeats this overflow in rapid succession right before the failure occurred. I have since reverted to an earlier version and it might be advisable for other Leaf owners to do so until the new poller is fully operational.
2024-05-02 12:22:28.316 NZST I (36847486) vehicle-poll: Poller[Frame]: Task Queue Overflow
2024-05-02 12:22:28.316 NZST I (36847486) vehicle-poll: Poller[Frame]: Task Queue Overflow
2024-05-02 12:22:28.316 NZST I (36847486) vehicle-poll: Poller[Frame]: Task Queue Overflow
2024-05-02 12:22:28.326 NZST I (36847496) vehicle-poll: Poller[Frame]: Task Queue Overflow
2024-05-02 12:22:28.326 NZST I (36847496) vehicle-poll: Poller[Frame]: Task Queue Overflow
2024-05-02 12:22:28.326 NZST I (36847496) vehicle-poll: Poller[Frame]: Task Queue Overflow
2024-05-02 12:22:28.326 NZST I (36847496) vehicle-poll: Poller[Frame]: Task Queue Overflow
2024-05-02 12:22:28.326 NZST I (36847496) vehicle-poll: Poller[Frame]: Task Queue Overflow
2024-05-02 12:22:28.326 NZST I (36847496) vehicle-poll: Poller[Frame]: Task Queue Overflow
2024-05-02 12:22:28.326 NZST I (36847496) vehicle-poll: Poller[Frame]: Task Queue Overflow
2024-05-02 12:22:28.326 NZST I (36847496) vehicle-poll: Poller[Frame]: Task Queue Overflow
2024-05-02 12:22:28.336 NZST I (36847506) vehicle-poll: Poller[Frame]: Task Queue Overflow
2024-05-02 12:22:28.336 NZST I (36847506) vehicle-poll: Poller[Frame]: Task Queue Overflow
2024-05-02 12:22:28.336 NZST I (36847506) vehicle-poll: Poller[Frame]: Task Queue Overflow
2024-05-02 12:22:28.336 NZST I (36847506) vehicle-poll: Poller[Frame]: Task Queue Overflow
2024-05-02 12:22:28.346 NZST I (36847516) vehicle-poll: Poller[Frame]: Task Queue Overflow
2024-05-02 12:22:28.346 NZST I (36847516) vehicle-poll: Poller[Frame]: Task Queue Overflow
2024-05-02 12:22:28.346 NZST I (36847516) vehicle-poll: Poller[Frame]: Task Queue Overflow
2024-05-02 12:22:28.346 NZST I (36847516) vehicle-poll: Poller[Frame]: Task Queue Overflow
2024-05-02 12:22:28.356 NZST I (36847526) vehicle-poll: Poller[Frame]: Task Queue Overflow
2024-05-02 12:22:28.356 NZST I (36847526) vehicle-poll: Poller[Frame]: Task Queue Overflow
2024-05-02 12:22:28.356 NZST I (36847526) vehicle-poll: Poller[Frame]: Task Queue Overflow
2024-05-02 12:22:28.356 NZST I (36847526) vehicle-poll: Poller[Frame]: Task Queue Overflow
On Fri, 3 May 2024 at 05:40, Michael Balzer via OvmsDev <ovmsdev@lists.openvehicles.com> wrote:
A task may delete itself by calling vTaskDelete(NULL) as the final statement, and that's normally a better way to shutdown a task, if you can signal the task it should terminate. Deleting a task from outside may always result in resources taken by the task not being freed, as the task gets terminated wherever it just is.
As the vehicle task also needs to access vehicle data memory, vehicle destruction should not begin until the task has finished, otherwise a task job already running while the vehicle destruction takes place may run into an illegal memory access (access after free). Keep in mind, destructors are executed bottom up, so waiting for the task shutdown within the destructor won't help.
Also, I think "MyCan.DeregisterCallback(TAG)" in ShuttingDown() is now obsolete.
Regards, Michael
Am 02.05.24 um 15:23 schrieb Michael Geddes:
Thanks.
On that race condition... do you think we are better to just delete the task or I saw one recommendation that
We can delete it outside the while loop in the task itself!
//.ichael
On Tue, 30 Apr 2024, 17:46 Michael Balzer via OvmsDev, <ovmsdev@lists.openvehicles.com> wrote:
OK, understood & merged, thanks for the quick fix/workaround.
I'll ask the Twizy driver to test this.
Regards, Michael
PS: side note: there's a shutdown race condition arising from `while (!m_is_shutdown)` in the new `OvmsVehicle::VehicleTask()`: if the task receives a message while m_is_shutdown already has been set, it will exit the loop and return from the task function, which isn't allowed. I think FreeRTOS will abort in that case.
Am 30.04.24 um 08:55 schrieb Michael Geddes:
No it will start the poll thread of the poller fine for those that don't use it. That's the last commit.... so that should be covered. When the callback is registered the thread is force started.
This is not to say that what you are suggesting isn't a better way forward... just that it should work.
Michael
On Tue, 30 Apr 2024, 14:51 Michael Balzer via OvmsDev, <ovmsdev@lists.openvehicles.com> wrote:
Michael,
(taking this back to the list, as other developers may have helpful ideas or suggestions)
from a first check, your new patch (PR #1008) won't help for vehicles that don't use the poller, like the generic DBC vehicle or the Fiat 500 (plus possibly non-public third party vehicles). As the poller is normally compiled in, these would need a run time switch to re-enable the vehicle task, or more suitably default into that configuration and switch to the poller task only when the poller gets initialized.
How about moving the task back into the vehicle class, but keeping your task message extensions while doing so, and adding a way for the poller to hook into the task? The dedicated vehicle task is an essential part of the vehicle framework, but I do remember some occasions where a general way to pass custom messages to the vehicle task would have been helpful to use the task for more than CAN processing.
If the poller shall become avaible as a separate service that can be used without any vehicle instance (currently not a defined use case), the construct of a CAN processor task that can be extended for custom messages (or a message processor task that can subscribe to CAN frames) could be factored out into a dedicated class or template. The poller could then create his own instance of that class, if it cannot hook into an existing one.
Btw, in case you're not aware of this, FreeRTOS also provides queue sets (https://www.freertos.org/RTOS-queue-sets.html). We haven't used them in the OVMS yet, but they could be useful, especially if message unions become large or tasks shall be able to dynamically subscribe to different message sources.
Regards, Michael
Am 30.04.24 um 01:20 schrieb Michael Geddes:
It might be worth reverting, but, I've got a patch suggestion that I'll push up which will let me know if I understand everything and which might provide a solution.
If this isn't going to work then revert. (P/R coming)
While the poller was still a part of the vehicle class it was probably still all ok. The poller had taken over what I assume you are talking about as the vehicle task. A call-back fromthe poller was calling IncomingPollRxFrame which was then coming from the (now) poller task (is that correct?)
While we have OVMS_COMP_POLLER config defined, we could just use the poller task to provide the IncomingPollRxFrame call-back from the poller (was vehicle?) task.
The problem is when OVMS_COMP_POLLER is undefined, we need an alternate (maybe we could use the 'Event' loop then) which is when I hacked that bad solution.
//.ichael
I was thinking though that because everything is being queued we could divert some calls into the car
On Mon, 29 Apr 2024, 18:58 Michael Balzer, <dexter@expeedo.de> wrote:
Michael,
I've found a severe design flaw with your poller change. Sorry, I should have seen that before, and shouldn't have merged this.
You have moved the standard CAN frame processing from the vehicle task into the CAN task by changing the vehicle from a CAN listener to a CAN callback processor. That will break all kind of things, vehicles like the Twizy, Smart and many others rely on frame processing being done in the dedicated vehicle task.
This especially induces issues regarding CAN processing capacity, as the vehicles rely on having a separate context and not needing to decouple complex processing of incoming frames. So this will degrade the CAN processing performance seriously in many cases, where additional steps involving file or network I/O need to be done.
So this needs to be changed back.
I assumed you introduced a new dedicated poller task but kept the vehicle task intact. From your naming (OvmsVehicle::IncomingPollRxFrame), it seems you misinterpreted the vehicle task's purpose as only being used for polling.
I assume this isn't a small change…? If so we should revert the poller merge, to avoid having a defunctional edge build state until the fix.
Secondly: logging is generally expensive regardless of the log level control and log channels enabled. Any log message needs to be queued to the log system, so involves a lock and a potential wait state (for the queue) & resulting context switch (= minimum delay of 10 ms). Therefore, logging must be avoided as far as possible in any time critical context, and is forbidden under some circumstances, e.g. in a timer callback (see FreeRTOS docs on this). The log system load multiplies with connected web clients or enabled file logging and enabled debug / verbose level logging -- that quickly becomes too much, usually triggering the task watchdog.
Your logging of nearly all bus events passing to/from the poller (especially the log entry in Queue_PollerFrame) becomes an issue on any vehicle that has high frequency running process data frames on the bus, like the Twizy or Smart. As a counter measure, I've just added a runtime control for all the poller's verbose logging (by default now off), and changed some debug level logs to verbose. Not sure if I've catched all that may need to be silenced by default. Please check all your log calls and place them under the new "trace" control flag wherever appropriate.
This won't help avoiding issues with process data frame buses though.
Shall I revert the poller merge for now?
Regards, Michael
Am 29.04.24 um 06:18 schrieb Michael Geddes:
Btw I included the log changes in the p/r which is a few small commits for the poller.
//.
On Mon, 29 Apr 2024, 07:20 Michael Geddes, <frog@bunyip.wheelycreek.net> wrote:
Hey Michael,
I've got to work now (it's Monday), but I suspect those 'giving up' are from unsolicited messages on the bus.
I can re-order things so that the message will likely be 'dropped (no poll entry)' rather than the time-out message.
And make it a verbose log.
//.ichael
On Mon, 29 Apr 2024 at 00:25, Michael Balzer <dexter@expeedo.de> wrote:
Michael,
forwarding the Twizy logs to you directly, as they contain the user location.
He has just verified it's the new version, he says the module stops responding as soon as he turns on the Twizy.
His description of his actions is a bit ambiguous, and it seems he didn't enable logging to the file persistently.
According to the server, these were the version boot times:
2024-04-28 15:30:56 0 3.3.004-32-g125e0841/ota_0/edge (build idf v3.3.4-849-g6e214dc335 Apr 26 2024 19:16:50) 2024-04-28 16:21:08 0 3.3.004-32-g125e0841/ota_0/edge (build idf v3.3.4-849-g6e214dc335 Apr 26 2024 19:16:50) 2024-04-28 16:38:33 0 3.3.004-63-gf3595561/ota_1/edge (build idf v3.3.4-849-g6e214dc335 Apr 27 2024 07:44:50) 2024-04-28 16:40:57 0 3.3.004-63-gf3595561/ota_1/edge (build idf v3.3.4-849-g6e214dc335 Apr 27 2024 07:44:50) 2024-04-28 16:43:14 0 3.3.004-63-gf3595561/ota_1/edge (build idf v3.3.4-849-g6e214dc335 Apr 27 2024 07:44:50) 2024-04-28 16:46:39 0 3.3.004-63-gf3595561/ota_1/edge (build idf v3.3.4-849-g6e214dc335 Apr 27 2024 07:44:50) 2024-04-28 16:54:44 0 3.3.004-32-g125e0841/ota_0/edge (build idf v3.3.4-849-g6e214dc335 Apr 26 2024 19:16:50)
Attached is also his crash debug log -- a2ll doesn't tell much about what happened, but maybe you get an idea from this.
After the boot at 16:46, there are immediately lots of these messages:
2024-04-28 16:46:33.792 CEST D (39042) vehicle-poll: Poller: Queue PollerFrame() 2024-04-28 16:46:33.792 CEST D (39042) vehicle-poll: [1]Poller: Incoming - giving up
Regards, Michael
Am 28.04.24 um 16:44 schrieb Michael Geddes:
Ah. OK.
I could try to fix the vin thing using the new way of doing it and get rid of a semaphore?
It would at least identify the problem possibly?
Michael
On Sun, 28 Apr 2024, 22:32 Michael Balzer via OvmsDev, <ovmsdev@lists.openvehicles.com> wrote:
Not sure if that's the problem, but I've found a different behaviour with the new PollSetState() implementation.
The old version only did anything if the new state actually was different from the previous one. The Twizy relies on this behaviour, calling PollSetState() from the per second ticker (see OvmsVehicleRenaultTwizy::ObdTicker1).
The new implementation apparently always sends the PollState command to the task, and that in turn always at least locks the poller mutex. Not sure if/how that could cause the observed issues, but it definitely adds quite some (unnecessary?) lock/unlock operations.
Am 28.04.24 um 16:05 schrieb Michael Balzer via OvmsDev:
The Twizy uses the poller to query the VIN (once) and DTCs (every 10 seconds while driving), see rt_obd2.cpp.
It also has its own version of the OBD single request (OvmsVehicleRenaultTwizy::ObdRequest), which was the precursor for the generalized version. This is used by custom/user Twizy plugins and scripts to access ECU internals.
The Twizy doesn't use IncomingPollRxFrame, but the Twizy's IncomingPollReply handler will log any poll responses it doesn't know about, so that could lead to a lot of log output if something goes wrong there.
Am 28.04.24 um 15:49 schrieb Michael Geddes via OvmsDev:
AFAICT the twizzy doesn't use the poller list at all. So is it missing a call-back or something??
I can see a potential problem with IncomingPollRxFrame being called twice as much as it should be but only when there is a poll list. Maybe commenting out this would do it. (I can find another away to get this called on the thread I want). This might be the problem with the smarted
void OvmsVehicle::OvmsVehicleSignal::IncomingPollRxFrame(canbus* bus, CAN_frame_t *frame, bool success) { //if (Ready()) // m_parent->IncomingPollRxFrame(frame, success); }
//.
On Sun, 28 Apr 2024 at 21:10, Michael Balzer via OvmsDev <ovmsdev@lists.openvehicles.com> wrote:
There may also be an issue with the Renault Twizy, I've received a report of a user who is using the edge builds, that the latest build wouldn't work.
He reports all kinds of errors and warnings signaled by the car during driving, and switching back to the previous build fixed the issues.
I've asked him to provide a debug log excerpt if possible.
Regards, Michael
Am 28.04.24 um 14:29 schrieb Michael Geddes via OvmsDev:
OK. That's bad.
Does the reading work in general?
Is it just the writing commands?
Raise a ticket on github and tag me in and we can address it that way.
Michael
On Sun, 28 Apr 2024, 19:49 Thomas Heuer via OvmsDev, <ovmsdev@lists.openvehicles.com> wrote:
Hi,
The new poller code doesn't seem to work properly with the smarted.
D (218831) vehicle-poll: [1]PollerNextTick(PRI): cycle complete for ticker=215
V (218831) vehicle-poll: Standard Poll Series: List reset
D (218831) vehicle-poll: PollSeriesList::NextPollEntry[!v.standard]: ReachedEnd
V (218831) vehicle-poll: [1]PollerSend: Poller Reached End
D (219691) vehicle-poll: Poller: Queue PollerFrame()
D (219691) vehicle-poll: Poller: Queue PollerFrame()
V (219691) vehicle-poll: Pollers: FrameRx(bus=2)
D (219691) vehicle-poll: Poller: Queue PollerFrame()
V (219691) vehicle-poll: Pollers: FrameRx(bus=2)
V (219691) vehicle-poll: Pollers: FrameRx(bus=2)
D (219691) vehicle-poll: Poller: Queue PollerFrame()
*OVMS#*unlock 22 Vehicle unlocked
V (219691) vehicle-poll: Pollers: FrameRx(bus=2)
D (219691) vehicle-poll: Poller: Queue PollerFrame()
V (219691) vehicle-poll: Pollers: FrameRx(bus=2)
D (219701) vehicle-poll: Poller: Queue PollerFrame()
V (219701) vehicle-poll: Pollers: FrameRx(bus=2)
D (219701) vehicle-poll: Poller: Queue PollerFrame()
V (219701) vehicle-poll: Pollers: FrameRx(bus=2)
D (219701) vehicle-poll: Poller: Queue PollerFrame()
V (219701) vehicle-poll: Pollers: FrameRx(bus=2)
D (219701) vehicle-poll: Poller: Queue PollerFrame()
V (219701) vehicle-poll: Pollers: FrameRx(bus=2)
D (219701) vehicle-poll: Poller: Queue PollerFrame()
V (219701) vehicle-poll: Pollers: FrameRx(bus=2)
D (219701) vehicle-poll: Poller: Queue PollerFrame()
V (219701) vehicle-poll: Pollers: FrameRx(bus=2)
D (219701) vehicle-poll: Poller: Queue PollerFrame()
V (219701) vehicle-poll: Pollers: FrameRx(bus=2)
D (219701) vehicle-poll: Poller: Queue PollerFrame()
V (219701) vehicle-poll: Pollers: FrameRx(bus=2)
D (219701) vehicle-poll: Poller: Queue PollerFrame()
V (219701) vehicle-poll: Pollers: FrameRx(bus=2)
D (219701) vehicle-poll: Poller: Queue PollerFrame()
V (219701) vehicle-poll: Pollers: FrameRx(bus=2)
D (219701) vehicle-poll: Poller: Queue PollerFrame()
*Von:*OvmsDev <ovmsdev-bounces@lists.openvehicles.com> *Im Auftrag von *Michael Geddes via OvmsDev *Gesendet:* Sonntag, 28. April 2024 12:27 *An:* OVMS Developers <ovmsdev@lists.openvehicles.com> *Cc:* Michael Geddes <frog@bunyip.wheelycreek.net> *Betreff:* [Ovmsdev] OVMS Poller module/singleton
Hey all,
The poller singleton code that I've been working on for over a year now is merged in. (Thanks Michael for expediting the final step).
This includes separate multi-frame states per bus and multiple poll lists as well as non-blocking one off queries. As well as more 'states'.
I have included some programming documentation in the change but am happy to supply more if needed.
The ioniq 5 code has some examples of how it can be used. Some examples are:
* grabbing the vin as a one shot without blocking
* having a short list of queries that are polled quickly for obd2ecu (this also demonstrates using a shorter frame break value and then a break after successful a response)
Have a play please!
Also interested in hearing what user tools might be worth looking at next for the poller object.
//.ichael G.
_______________________________________________ OvmsDev mailing list OvmsDev@lists.openvehicles.com http://lists.openvehicles.com/mailman/listinfo/ovmsdev
_______________________________________________
OvmsDev mailing list
OvmsDev@lists.openvehicles.com
http://lists.openvehicles.com/mailman/listinfo/ovmsdev
--
Michael Balzer * Helkenberger Weg 9 * D-58256 Ennepetal
Fon 02333 / 833 5735 * Handy 0176 / 206 989 26
_______________________________________________ OvmsDev mailing list OvmsDev@lists.openvehicles.com http://lists.openvehicles.com/mailman/listinfo/ovmsdev
_______________________________________________
OvmsDev mailing list
OvmsDev@lists.openvehicles.com
http://lists.openvehicles.com/mailman/listinfo/ovmsdev
--
Michael Balzer * Helkenberger Weg 9 * D-58256 Ennepetal
Fon 02333 / 833 5735 * Handy 0176 / 206 989 26
_______________________________________________
OvmsDev mailing list
OvmsDev@lists.openvehicles.com
http://lists.openvehicles.com/mailman/listinfo/ovmsdev
--
Michael Balzer * Helkenberger Weg 9 * D-58256 Ennepetal
Fon 02333 / 833 5735 * Handy 0176 / 206 989 26
_______________________________________________ OvmsDev mailing list OvmsDev@lists.openvehicles.com http://lists.openvehicles.com/mailman/listinfo/ovmsdev
--
Michael Balzer * Helkenberger Weg 9 * D-58256 Ennepetal
Fon 02333 / 833 5735 * Handy 0176 / 206 989 26
--
Michael Balzer * Helkenberger Weg 9 * D-58256 Ennepetal
Fon 02333 / 833 5735 * Handy 0176 / 206 989 26
--
Michael Balzer * Helkenberger Weg 9 * D-58256 Ennepetal
Fon 02333 / 833 5735 * Handy 0176 / 206 989 26
_______________________________________________ OvmsDev mailing list OvmsDev@lists.openvehicles.com http://lists.openvehicles.com/mailman/listinfo/ovmsdev
--
Michael Balzer * Helkenberger Weg 9 * D-58256 Ennepetal
Fon 02333 / 833 5735 * Handy 0176 / 206 989 26
_______________________________________________ OvmsDev mailing list OvmsDev@lists.openvehicles.com http://lists.openvehicles.com/mailman/listinfo/ovmsdev
--
Michael Balzer * Helkenberger Weg 9 * D-58256 Ennepetal
Fon 02333 / 833 5735 * Handy 0176 / 206 989 26
_______________________________________________ OvmsDev mailing list OvmsDev@lists.openvehicles.com http://lists.openvehicles.com/mailman/listinfo/ovmsdev
_______________________________________________ OvmsDev mailing list OvmsDev@lists.openvehicles.com http://lists.openvehicles.com/mailman/listinfo/ovmsdev
-- Michael Balzer * Helkenberger Weg 9 * D-58256 Ennepetal Fon 02333 / 833 5735 * Handy 0176 / 206 989 26
I realise that I was only using the standard cable to test - which probably is not sufficient - I haven't looked closely at how the Leaf OBD to Db9 cable is different from standard. Ah, my bad out the queue length. We are definitely queueing more messages though. From my log of when the overflow happened, the poller was in state 0 which means OFF - ie nothing was being sent!! I'll look at the TX message thing - opt in sounds good - though it shouldn't be playing that much of a part here as the TXs are infrequent in this case (or zero when the leaf is off or driving) - On the ioniq 5 when I'm using the HUD - I'm polling quite frequently - multiple times per second and that seems to be fine!. I did find an issue with the throttling .. but it would still mostly apply the throttling where it matters, so again, it shouldn't be the problem (also, we aren't transmitting in the leaf case). The change I made to the logging of RX messages showed how many in a row were dropped... and it was mostly 1 only in a run - which means even if it is a short time between - that means that the drops are being interleaved by at least one success! Sooo.. I'm still wondering what is going on. Some things I'm going to try: * If the number of messages on the Can bus (coming in through RX) means that the queue is slowly getting longer and not quite catching up, then making the queue longer will help it last longer... but only pushes the problem down the road. - Add 'current queue length' to the poller status information to see if this is indeed the case? - Add some kind of alert when the queue reaches a % full? * Once you start overflowing and getting overflow log messages, I wonder if this is then contributing to the problem. - Push the overflow logging into Poller Task which can look at how many drops occurred since last received item. * Split up the flags for the poller messages into 2: - Messages that are/could be happening in the TX/RX tasks - Other noisy messages that always happen in the poller task. Thoughts on what else we might measure to figure out what is going on? //.ichael On Sun, 5 May 2024, 19:29 Michael Balzer via OvmsDev, < ovmsdev@lists.openvehicles.com> wrote:
Michael,
the queue size isn't in bytes, it's in messages:
* @param uxQueueLength The maximum number of items that the queue can contain. * * @param uxItemSize The number of bytes each item in the queue will require.
Also, from the time stamps in Dereks log excerpt, there were quite some dropped frames in that time window -- at least 23 frames in 40 ms, that's bad.
Queue sizes are currently:
CONFIG_OVMS_HW_CAN_RX_QUEUE_SIZE=60 CONFIG_OVMS_VEHICLE_CAN_RX_QUEUE_SIZE=60
The new poller now channels all TX callbacks through the task queue additionally to RX and commands. So setting the queue size to be larger than the CAN RX queue size seems appropriate.
Nevertheless, an overflow with more than 60 waiting messages still indicates some too long processing time in the vehicle task.
TX callbacks previously were done directly in the CAN context, and no current vehicle overrides the empty default handler, so this imposed almost no additional overhead. By requiring a queue entry for each TX callback, this feature now has a potentially high impact for all vehicles. If passing these to the task is actually necessary, it needs to become an opt-in feature, so only vehicles subscribing to the callback actually need to cope with that additional load & potential processing delays involved.
Regards, Michael
Am 05.05.24 um 11:59 schrieb Michael Geddes via OvmsDev:
OK.
I did some logging changes to confirm that it's only _just_ getting overwhelmed..ie dropping 1 (or occasionally 2) RX frames in a row but then picking the next ones up...
So increasing the queue size (I doubled it but maybe that was excessive) seems to do the trick. I think the queue size is in bytes and the queue packet size has increased at least a little bit.
Michael
On Sat, 4 May 2024, 09:24 Michael Geddes, <frog@bunyip.wheelycreek.net> wrote:
Hey Derek,
I do have a friend with a Leaf in his EV collection, so I can try grab some more info from his car and work out exactly what (tf) is going on.
//.
On Sat, 4 May 2024 at 08:13, <frog@bunyip.wheelycreek.net> wrote:
HI Derek,
For a start, I’m very sorry that the ovms put your car in limp mode. That’s quite bad.
Just FYI those overflows that you have copied are about receiving and not sending information, so maybe the poller thread is being overwhelmed or stalled somehow.
I’ve been looking at the code and wondered if you have the ‘can write’ flag set to true or not? (Though it shouldn’t make that much difference)
Even if it were somehow mistakenly polling (ie in the wrong pollstate), it should not be doing it that frequently – (at most once a minute). And the poll throttle would still be on 1 per second.. so that should put a limit on sends.. and so it is really worrying that somehow that is not happening :/
If you have more logs that you send me that don’t just include that particular overflow message that would be good. Did it crash/reboot? Maybe it crashed repeatedly?
//.ichael
*From:* OvmsDev <ovmsdev-bounces@lists.openvehicles.com> *On Behalf Of *Derek Caudwell via OvmsDev *Sent:* Friday, May 3, 2024 6:54 PM *To:* OVMS Developers <ovmsdev@lists.openvehicles.com> *Cc:* Derek Caudwell <d.caudwell@gmail.com> *Subject:* Re: [Ovmsdev] OVMS Poller module/singleton
Hi Michael,
When running firmware 3.3.004-74-gbd4e7196 on my Nissan Leaf I suspect (but can't be 100% sure as it's only been 24h without fault) the new poller caused the car to throw the attached faults from overloading the can bus whilst driving. The fault was sufficient to send the car into limp mode and could not be driven until cleared with LeafSpy. Ovms should not be polling in the driving state, so I'm not sure why the poller is overflowing.
The ovms log repeats this overflow in rapid succession right before the failure occurred. I have since reverted to an earlier version and it might be advisable for other Leaf owners to do so until the new poller is fully operational.
2024-05-02 12:22:28.316 NZST I (36847486) vehicle-poll: Poller[Frame]: Task Queue Overflow
2024-05-02 12:22:28.316 NZST I (36847486) vehicle-poll: Poller[Frame]: Task Queue Overflow
2024-05-02 12:22:28.316 NZST I (36847486) vehicle-poll: Poller[Frame]: Task Queue Overflow
2024-05-02 12:22:28.326 NZST I (36847496) vehicle-poll: Poller[Frame]: Task Queue Overflow
2024-05-02 12:22:28.326 NZST I (36847496) vehicle-poll: Poller[Frame]: Task Queue Overflow
2024-05-02 12:22:28.326 NZST I (36847496) vehicle-poll: Poller[Frame]: Task Queue Overflow
2024-05-02 12:22:28.326 NZST I (36847496) vehicle-poll: Poller[Frame]: Task Queue Overflow
2024-05-02 12:22:28.326 NZST I (36847496) vehicle-poll: Poller[Frame]: Task Queue Overflow
2024-05-02 12:22:28.326 NZST I (36847496) vehicle-poll: Poller[Frame]: Task Queue Overflow
2024-05-02 12:22:28.326 NZST I (36847496) vehicle-poll: Poller[Frame]: Task Queue Overflow
2024-05-02 12:22:28.326 NZST I (36847496) vehicle-poll: Poller[Frame]: Task Queue Overflow
2024-05-02 12:22:28.336 NZST I (36847506) vehicle-poll: Poller[Frame]: Task Queue Overflow
2024-05-02 12:22:28.336 NZST I (36847506) vehicle-poll: Poller[Frame]: Task Queue Overflow
2024-05-02 12:22:28.336 NZST I (36847506) vehicle-poll: Poller[Frame]: Task Queue Overflow
2024-05-02 12:22:28.336 NZST I (36847506) vehicle-poll: Poller[Frame]: Task Queue Overflow
2024-05-02 12:22:28.346 NZST I (36847516) vehicle-poll: Poller[Frame]: Task Queue Overflow
2024-05-02 12:22:28.346 NZST I (36847516) vehicle-poll: Poller[Frame]: Task Queue Overflow
2024-05-02 12:22:28.346 NZST I (36847516) vehicle-poll: Poller[Frame]: Task Queue Overflow
2024-05-02 12:22:28.346 NZST I (36847516) vehicle-poll: Poller[Frame]: Task Queue Overflow
2024-05-02 12:22:28.356 NZST I (36847526) vehicle-poll: Poller[Frame]: Task Queue Overflow
2024-05-02 12:22:28.356 NZST I (36847526) vehicle-poll: Poller[Frame]: Task Queue Overflow
2024-05-02 12:22:28.356 NZST I (36847526) vehicle-poll: Poller[Frame]: Task Queue Overflow
2024-05-02 12:22:28.356 NZST I (36847526) vehicle-poll: Poller[Frame]: Task Queue Overflow
On Fri, 3 May 2024 at 05:40, Michael Balzer via OvmsDev < ovmsdev@lists.openvehicles.com> wrote:
A task may delete itself by calling vTaskDelete(NULL) as the final statement, and that's normally a better way to shutdown a task, if you can signal the task it should terminate. Deleting a task from outside may always result in resources taken by the task not being freed, as the task gets terminated wherever it just is.
As the vehicle task also needs to access vehicle data memory, vehicle destruction should not begin until the task has finished, otherwise a task job already running while the vehicle destruction takes place may run into an illegal memory access (access after free). Keep in mind, destructors are executed bottom up, so waiting for the task shutdown within the destructor won't help.
Also, I think "MyCan.DeregisterCallback(TAG)" in ShuttingDown() is now obsolete.
Regards, Michael
Am 02.05.24 um 15:23 schrieb Michael Geddes:
Thanks.
On that race condition... do you think we are better to just delete the task or I saw one recommendation that
We can delete it outside the while loop in the task itself!
//.ichael
On Tue, 30 Apr 2024, 17:46 Michael Balzer via OvmsDev, < ovmsdev@lists.openvehicles.com> wrote:
OK, understood & merged, thanks for the quick fix/workaround.
I'll ask the Twizy driver to test this.
Regards, Michael
PS: side note: there's a shutdown race condition arising from `while (!m_is_shutdown)` in the new `OvmsVehicle::VehicleTask()`: if the task receives a message while m_is_shutdown already has been set, it will exit the loop and return from the task function, which isn't allowed. I think FreeRTOS will abort in that case.
Am 30.04.24 um 08:55 schrieb Michael Geddes:
No it will start the poll thread of the poller fine for those that don't use it. That's the last commit.... so that should be covered. When the callback is registered the thread is force started.
This is not to say that what you are suggesting isn't a better way forward... just that it should work.
Michael
On Tue, 30 Apr 2024, 14:51 Michael Balzer via OvmsDev, < ovmsdev@lists.openvehicles.com> wrote:
Michael,
(taking this back to the list, as other developers may have helpful ideas or suggestions)
from a first check, your new patch (PR #1008) won't help for vehicles that don't use the poller, like the generic DBC vehicle or the Fiat 500 (plus possibly non-public third party vehicles). As the poller is normally compiled in, these would need a run time switch to re-enable the vehicle task, or more suitably default into that configuration and switch to the poller task only when the poller gets initialized.
How about moving the task back into the vehicle class, but keeping your task message extensions while doing so, and adding a way for the poller to hook into the task? The dedicated vehicle task is an essential part of the vehicle framework, but I do remember some occasions where a general way to pass custom messages to the vehicle task would have been helpful to use the task for more than CAN processing.
If the poller shall become avaible as a separate service that can be used without any vehicle instance (currently not a defined use case), the construct of a CAN processor task that can be extended for custom messages (or a message processor task that can subscribe to CAN frames) could be factored out into a dedicated class or template. The poller could then create his own instance of that class, if it cannot hook into an existing one.
Btw, in case you're not aware of this, FreeRTOS also provides queue sets (https://www.freertos.org/RTOS-queue-sets.html). We haven't used them in the OVMS yet, but they could be useful, especially if message unions become large or tasks shall be able to dynamically subscribe to different message sources.
Regards, Michael
Am 30.04.24 um 01:20 schrieb Michael Geddes:
It might be worth reverting, but, I've got a patch suggestion that I'll push up which will let me know if I understand everything and which might provide a solution.
If this isn't going to work then revert. (P/R coming)
While the poller was still a part of the vehicle class it was probably still all ok. The poller had taken over what I assume you are talking about as the vehicle task. A call-back fromthe poller was calling IncomingPollRxFrame which was then coming from the (now) poller task (is that correct?)
While we have OVMS_COMP_POLLER config defined, we could just use the poller task to provide the IncomingPollRxFrame call-back from the poller (was vehicle?) task.
The problem is when OVMS_COMP_POLLER is undefined, we need an alternate (maybe we could use the 'Event' loop then) which is when I hacked that bad solution.
//.ichael
I was thinking though that because everything is being queued we could divert some calls into the car
On Mon, 29 Apr 2024, 18:58 Michael Balzer, <dexter@expeedo.de> wrote:
Michael,
I've found a severe design flaw with your poller change. Sorry, I should have seen that before, and shouldn't have merged this.
You have moved the standard CAN frame processing from the vehicle task into the CAN task by changing the vehicle from a CAN listener to a CAN callback processor. That will break all kind of things, vehicles like the Twizy, Smart and many others rely on frame processing being done in the dedicated vehicle task.
This especially induces issues regarding CAN processing capacity, as the vehicles rely on having a separate context and not needing to decouple complex processing of incoming frames. So this will degrade the CAN processing performance seriously in many cases, where additional steps involving file or network I/O need to be done.
So this needs to be changed back.
I assumed you introduced a new dedicated poller task but kept the vehicle task intact. From your naming (OvmsVehicle::IncomingPollRxFrame), it seems you misinterpreted the vehicle task's purpose as only being used for polling.
I assume this isn't a small change…? If so we should revert the poller merge, to avoid having a defunctional edge build state until the fix.
Secondly: logging is generally expensive regardless of the log level control and log channels enabled. Any log message needs to be queued to the log system, so involves a lock and a potential wait state (for the queue) & resulting context switch (= minimum delay of 10 ms). Therefore, logging must be avoided as far as possible in any time critical context, and is forbidden under some circumstances, e.g. in a timer callback (see FreeRTOS docs on this). The log system load multiplies with connected web clients or enabled file logging and enabled debug / verbose level logging -- that quickly becomes too much, usually triggering the task watchdog.
Your logging of nearly all bus events passing to/from the poller (especially the log entry in Queue_PollerFrame) becomes an issue on any vehicle that has high frequency running process data frames on the bus, like the Twizy or Smart. As a counter measure, I've just added a runtime control for all the poller's verbose logging (by default now off), and changed some debug level logs to verbose. Not sure if I've catched all that may need to be silenced by default. Please check all your log calls and place them under the new "trace" control flag wherever appropriate.
This won't help avoiding issues with process data frame buses though.
Shall I revert the poller merge for now?
Regards, Michael
Am 29.04.24 um 06:18 schrieb Michael Geddes:
Btw I included the log changes in the p/r which is a few small commits for the poller.
//.
On Mon, 29 Apr 2024, 07:20 Michael Geddes, <frog@bunyip.wheelycreek.net> wrote:
Hey Michael,
I've got to work now (it's Monday), but I suspect those 'giving up' are from unsolicited messages on the bus.
I can re-order things so that the message will likely be 'dropped (no poll entry)' rather than the time-out message.
And make it a verbose log.
//.ichael
On Mon, 29 Apr 2024 at 00:25, Michael Balzer <dexter@expeedo.de> wrote:
Michael,
forwarding the Twizy logs to you directly, as they contain the user location.
He has just verified it's the new version, he says the module stops responding as soon as he turns on the Twizy.
His description of his actions is a bit ambiguous, and it seems he didn't enable logging to the file persistently.
According to the server, these were the version boot times:
2024-04-28 15:30:56 0 3.3.004-32-g125e0841/ota_0/edge (build idf v3.3.4-849-g6e214dc335 Apr 26 2024 19:16:50) 2024-04-28 16:21:08 0 3.3.004-32-g125e0841/ota_0/edge (build idf v3.3.4-849-g6e214dc335 Apr 26 2024 19:16:50) 2024-04-28 16:38:33 0 3.3.004-63-gf3595561/ota_1/edge (build idf v3.3.4-849-g6e214dc335 Apr 27 2024 07:44:50) 2024-04-28 16:40:57 0 3.3.004-63-gf3595561/ota_1/edge (build idf v3.3.4-849-g6e214dc335 Apr 27 2024 07:44:50) 2024-04-28 16:43:14 0 3.3.004-63-gf3595561/ota_1/edge (build idf v3.3.4-849-g6e214dc335 Apr 27 2024 07:44:50) 2024-04-28 16:46:39 0 3.3.004-63-gf3595561/ota_1/edge (build idf v3.3.4-849-g6e214dc335 Apr 27 2024 07:44:50) 2024-04-28 16:54:44 0 3.3.004-32-g125e0841/ota_0/edge (build idf v3.3.4-849-g6e214dc335 Apr 26 2024 19:16:50)
Attached is also his crash debug log -- a2ll doesn't tell much about what happened, but maybe you get an idea from this.
After the boot at 16:46, there are immediately lots of these messages:
2024-04-28 16:46:33.792 CEST D (39042) vehicle-poll: Poller: Queue PollerFrame() 2024-04-28 16:46:33.792 CEST D (39042) vehicle-poll: [1]Poller: Incoming - giving up
Regards, Michael
Am 28.04.24 um 16:44 schrieb Michael Geddes:
Ah. OK.
I could try to fix the vin thing using the new way of doing it and get rid of a semaphore?
It would at least identify the problem possibly?
Michael
On Sun, 28 Apr 2024, 22:32 Michael Balzer via OvmsDev, < ovmsdev@lists.openvehicles.com> wrote:
Not sure if that's the problem, but I've found a different behaviour with the new PollSetState() implementation.
The old version only did anything if the new state actually was different from the previous one. The Twizy relies on this behaviour, calling PollSetState() from the per second ticker (see OvmsVehicleRenaultTwizy::ObdTicker1).
The new implementation apparently always sends the PollState command to the task, and that in turn always at least locks the poller mutex. Not sure if/how that could cause the observed issues, but it definitely adds quite some (unnecessary?) lock/unlock operations.
Am 28.04.24 um 16:05 schrieb Michael Balzer via OvmsDev:
The Twizy uses the poller to query the VIN (once) and DTCs (every 10 seconds while driving), see rt_obd2.cpp.
It also has its own version of the OBD single request (OvmsVehicleRenaultTwizy::ObdRequest), which was the precursor for the generalized version. This is used by custom/user Twizy plugins and scripts to access ECU internals.
The Twizy doesn't use IncomingPollRxFrame, but the Twizy's IncomingPollReply handler will log any poll responses it doesn't know about, so that could lead to a lot of log output if something goes wrong there.
Am 28.04.24 um 15:49 schrieb Michael Geddes via OvmsDev:
AFAICT the twizzy doesn't use the poller list at all. So is it missing a call-back or something??
I can see a potential problem with IncomingPollRxFrame being called twice as much as it should be but only when there is a poll list. Maybe commenting out this would do it. (I can find another away to get this called on the thread I want). This might be the problem with the smarted
void OvmsVehicle::OvmsVehicleSignal::IncomingPollRxFrame(canbus* bus, CAN_frame_t *frame, bool success) { //if (Ready()) // m_parent->IncomingPollRxFrame(frame, success); }
//.
On Sun, 28 Apr 2024 at 21:10, Michael Balzer via OvmsDev < ovmsdev@lists.openvehicles.com> wrote:
There may also be an issue with the Renault Twizy, I've received a report of a user who is using the edge builds, that the latest build wouldn't work.
He reports all kinds of errors and warnings signaled by the car during driving, and switching back to the previous build fixed the issues.
I've asked him to provide a debug log excerpt if possible.
Regards, Michael
Am 28.04.24 um 14:29 schrieb Michael Geddes via OvmsDev:
OK. That's bad.
Does the reading work in general?
Is it just the writing commands?
Raise a ticket on github and tag me in and we can address it that way.
Michael
On Sun, 28 Apr 2024, 19:49 Thomas Heuer via OvmsDev, < ovmsdev@lists.openvehicles.com> wrote:
Hi,
The new poller code doesn't seem to work properly with the smarted.
D (218831) vehicle-poll: [1]PollerNextTick(PRI): cycle complete for ticker=215
V (218831) vehicle-poll: Standard Poll Series: List reset
D (218831) vehicle-poll: PollSeriesList::NextPollEntry[!v.standard]: ReachedEnd
V (218831) vehicle-poll: [1]PollerSend: Poller Reached End
D (219691) vehicle-poll: Poller: Queue PollerFrame()
D (219691) vehicle-poll: Poller: Queue PollerFrame()
V (219691) vehicle-poll: Pollers: FrameRx(bus=2)
D (219691) vehicle-poll: Poller: Queue PollerFrame()
V (219691) vehicle-poll: Pollers: FrameRx(bus=2)
V (219691) vehicle-poll: Pollers: FrameRx(bus=2)
D (219691) vehicle-poll: Poller: Queue PollerFrame()
*OVMS#* unlock 22 Vehicle unlocked
V (219691) vehicle-poll: Pollers: FrameRx(bus=2)
Michael, did you notice the Leaf is special in polling two buses (1 & 2) by default? No other vehicle does that. Possibly some sort of deadlock situation with interleaved bus responses? Any frame dropped is an indicator for something bad happening, as that means there's already a rather long backlog = response processing is too slow. On alerting when the queue grows, see `OvmsDuktape::EventScript()` -- I added an alert there for this situation, when the Duktape queue grows larger than 10 entries. But you probably should restrict the actual log message creation e.g. using a modulo 10 check. Maybe Derek can provide a CAN log catching the specific overflow case along with the system log? That should show which frames lead to the processing delay. Regards, Michael Am 06.05.24 um 01:45 schrieb Michael Geddes:
I realise that I was only using the standard cable to test - which probably is not sufficient - I haven't looked closely at how the Leaf OBD to Db9 cable is different from standard.
Ah, my bad out the queue length. We are definitely queueing more messages though. From my log of when the overflow happened, the poller was in state 0 which means OFF - ie nothing was being sent!!
I'll look at the TX message thing - opt in sounds good - though it shouldn't be playing that much of a part here as the TXs are infrequent in this case (or zero when the leaf is off or driving) - On the ioniq 5 when I'm using the HUD - I'm polling quite frequently - multiple times per second and that seems to be fine!.
I did find an issue with the throttling .. but it would still mostly apply the throttling where it matters, so again, it shouldn't be the problem (also, we aren't transmitting in the leaf case).
The change I made to the logging of RX messages showed how many in a row were dropped... and it was mostly 1 only in a run - which means even if it is a short time between - that means that the drops are being interleaved by at least one success!
Sooo.. I'm still wondering what is going on. Some things I'm going to try:
* If the number of messages on the Can bus (coming in through RX) means that the queue is slowly getting longer and not quite catching up, then making the queue longer will help it last longer... but only pushes the problem down the road. - Add 'current queue length' to the poller status information to see if this is indeed the case? - Add some kind of alert when the queue reaches a % full? * Once you start overflowing and getting overflow log messages, I wonder if this is then contributing to the problem. - Push the overflow logging into Poller Task which can look at how many drops occurred since last received item. * Split up the flags for the poller messages into 2: - Messages that are/could be happening in the TX/RX tasks - Other noisy messages that always happen in the poller task.
Thoughts on what else we might measure to figure out what is going on?
//.ichael
On Sun, 5 May 2024, 19:29 Michael Balzer via OvmsDev, <ovmsdev@lists.openvehicles.com> wrote:
Michael,
the queue size isn't in bytes, it's in messages:
* @param uxQueueLength The maximum number of items that the queue can contain. * * @param uxItemSize The number of bytes each item in the queue will require.
Also, from the time stamps in Dereks log excerpt, there were quite some dropped frames in that time window -- at least 23 frames in 40 ms, that's bad.
Queue sizes are currently:
CONFIG_OVMS_HW_CAN_RX_QUEUE_SIZE=60 CONFIG_OVMS_VEHICLE_CAN_RX_QUEUE_SIZE=60
The new poller now channels all TX callbacks through the task queue additionally to RX and commands. So setting the queue size to be larger than the CAN RX queue size seems appropriate.
Nevertheless, an overflow with more than 60 waiting messages still indicates some too long processing time in the vehicle task.
TX callbacks previously were done directly in the CAN context, and no current vehicle overrides the empty default handler, so this imposed almost no additional overhead. By requiring a queue entry for each TX callback, this feature now has a potentially high impact for all vehicles. If passing these to the task is actually necessary, it needs to become an opt-in feature, so only vehicles subscribing to the callback actually need to cope with that additional load & potential processing delays involved.
Regards, Michael
Am 05.05.24 um 11:59 schrieb Michael Geddes via OvmsDev:
OK.
I did some logging changes to confirm that it's only _just_ getting overwhelmed..ie dropping 1 (or occasionally 2) RX frames in a row but then picking the next ones up...
So increasing the queue size (I doubled it but maybe that was excessive) seems to do the trick. I think the queue size is in bytes and the queue packet size has increased at least a little bit.
Michael
On Sat, 4 May 2024, 09:24 Michael Geddes, <frog@bunyip.wheelycreek.net> wrote:
Hey Derek,
I do have a friend with a Leaf in his EV collection, so I can try grab some more info from his car and work out exactly what (tf) is going on.
//.
On Sat, 4 May 2024 at 08:13, <frog@bunyip.wheelycreek.net> wrote:
HI Derek,
For a start, I’m very sorry that the ovms put your car in limp mode. That’s quite bad.
Just FYI those overflows that you have copied are about receiving and not sending information, so maybe the poller thread is being overwhelmed or stalled somehow.
I’ve been looking at the code and wondered if you have the ‘can write’ flag set to true or not? (Though it shouldn’t make that much difference)
Even if it were somehow mistakenly polling (ie in the wrong pollstate), it should not be doing it that frequently – (at most once a minute). And the poll throttle would still be on 1 per second.. so that should put a limit on sends.. and so it is really worrying that somehow that is not happening :/
If you have more logs that you send me that don’t just include that particular overflow message that would be good. Did it crash/reboot? Maybe it crashed repeatedly?
//.ichael
*From:*OvmsDev <ovmsdev-bounces@lists.openvehicles.com> *On Behalf Of *Derek Caudwell via OvmsDev *Sent:* Friday, May 3, 2024 6:54 PM *To:* OVMS Developers <ovmsdev@lists.openvehicles.com> *Cc:* Derek Caudwell <d.caudwell@gmail.com> *Subject:* Re: [Ovmsdev] OVMS Poller module/singleton
Hi Michael,
When running firmware 3.3.004-74-gbd4e7196 on my Nissan Leaf I suspect (but can't be 100% sure as it's only been 24h without fault) the new poller caused the car to throw the attached faults from overloading the can bus whilst driving. The fault was sufficient to send the car into limp mode and could not be driven until cleared with LeafSpy. Ovms should not be polling in the driving state, so I'm not sure why the poller is overflowing.
The ovms log repeats this overflow in rapid succession right before the failure occurred. I have since reverted to an earlier version and it might be advisable for other Leaf owners to do so until the new poller is fully operational.
2024-05-02 12:22:28.316 NZST I (36847486) vehicle-poll: Poller[Frame]: Task Queue Overflow
2024-05-02 12:22:28.316 NZST I (36847486) vehicle-poll: Poller[Frame]: Task Queue Overflow
2024-05-02 12:22:28.316 NZST I (36847486) vehicle-poll: Poller[Frame]: Task Queue Overflow
2024-05-02 12:22:28.326 NZST I (36847496) vehicle-poll: Poller[Frame]: Task Queue Overflow
2024-05-02 12:22:28.326 NZST I (36847496) vehicle-poll: Poller[Frame]: Task Queue Overflow
2024-05-02 12:22:28.326 NZST I (36847496) vehicle-poll: Poller[Frame]: Task Queue Overflow
2024-05-02 12:22:28.326 NZST I (36847496) vehicle-poll: Poller[Frame]: Task Queue Overflow
2024-05-02 12:22:28.326 NZST I (36847496) vehicle-poll: Poller[Frame]: Task Queue Overflow
2024-05-02 12:22:28.326 NZST I (36847496) vehicle-poll: Poller[Frame]: Task Queue Overflow
2024-05-02 12:22:28.326 NZST I (36847496) vehicle-poll: Poller[Frame]: Task Queue Overflow
2024-05-02 12:22:28.326 NZST I (36847496) vehicle-poll: Poller[Frame]: Task Queue Overflow
2024-05-02 12:22:28.336 NZST I (36847506) vehicle-poll: Poller[Frame]: Task Queue Overflow
2024-05-02 12:22:28.336 NZST I (36847506) vehicle-poll: Poller[Frame]: Task Queue Overflow
2024-05-02 12:22:28.336 NZST I (36847506) vehicle-poll: Poller[Frame]: Task Queue Overflow
2024-05-02 12:22:28.336 NZST I (36847506) vehicle-poll: Poller[Frame]: Task Queue Overflow
2024-05-02 12:22:28.346 NZST I (36847516) vehicle-poll: Poller[Frame]: Task Queue Overflow
2024-05-02 12:22:28.346 NZST I (36847516) vehicle-poll: Poller[Frame]: Task Queue Overflow
2024-05-02 12:22:28.346 NZST I (36847516) vehicle-poll: Poller[Frame]: Task Queue Overflow
2024-05-02 12:22:28.346 NZST I (36847516) vehicle-poll: Poller[Frame]: Task Queue Overflow
2024-05-02 12:22:28.356 NZST I (36847526) vehicle-poll: Poller[Frame]: Task Queue Overflow
2024-05-02 12:22:28.356 NZST I (36847526) vehicle-poll: Poller[Frame]: Task Queue Overflow
2024-05-02 12:22:28.356 NZST I (36847526) vehicle-poll: Poller[Frame]: Task Queue Overflow
2024-05-02 12:22:28.356 NZST I (36847526) vehicle-poll: Poller[Frame]: Task Queue Overflow
On Fri, 3 May 2024 at 05:40, Michael Balzer via OvmsDev <ovmsdev@lists.openvehicles.com> wrote:
A task may delete itself by calling vTaskDelete(NULL) as the final statement, and that's normally a better way to shutdown a task, if you can signal the task it should terminate. Deleting a task from outside may always result in resources taken by the task not being freed, as the task gets terminated wherever it just is.
As the vehicle task also needs to access vehicle data memory, vehicle destruction should not begin until the task has finished, otherwise a task job already running while the vehicle destruction takes place may run into an illegal memory access (access after free). Keep in mind, destructors are executed bottom up, so waiting for the task shutdown within the destructor won't help.
Also, I think "MyCan.DeregisterCallback(TAG)" in ShuttingDown() is now obsolete.
Regards, Michael
Am 02.05.24 um 15:23 schrieb Michael Geddes:
Thanks.
On that race condition... do you think we are better to just delete the task or I saw one recommendation that
We can delete it outside the while loop in the task itself!
//.ichael
On Tue, 30 Apr 2024, 17:46 Michael Balzer via OvmsDev, <ovmsdev@lists.openvehicles.com> wrote:
OK, understood & merged, thanks for the quick fix/workaround.
I'll ask the Twizy driver to test this.
Regards, Michael
PS: side note: there's a shutdown race condition arising from `while (!m_is_shutdown)` in the new `OvmsVehicle::VehicleTask()`: if the task receives a message while m_is_shutdown already has been set, it will exit the loop and return from the task function, which isn't allowed. I think FreeRTOS will abort in that case.
Am 30.04.24 um 08:55 schrieb Michael Geddes:
No it will start the poll thread of the poller fine for those that don't use it. That's the last commit.... so that should be covered. When the callback is registered the thread is force started.
This is not to say that what you are suggesting isn't a better way forward... just that it should work.
Michael
On Tue, 30 Apr 2024, 14:51 Michael Balzer via OvmsDev, <ovmsdev@lists.openvehicles.com> wrote:
Michael,
(taking this back to the list, as other developers may have helpful ideas or suggestions)
from a first check, your new patch (PR #1008) won't help for vehicles that don't use the poller, like the generic DBC vehicle or the Fiat 500 (plus possibly non-public third party vehicles). As the poller is normally compiled in, these would need a run time switch to re-enable the vehicle task, or more suitably default into that configuration and switch to the poller task only when the poller gets initialized.
How about moving the task back into the vehicle class, but keeping your task message extensions while doing so, and adding a way for the poller to hook into the task? The dedicated vehicle task is an essential part of the vehicle framework, but I do remember some occasions where a general way to pass custom messages to the vehicle task would have been helpful to use the task for more than CAN processing.
If the poller shall become avaible as a separate service that can be used without any vehicle instance (currently not a defined use case), the construct of a CAN processor task that can be extended for custom messages (or a message processor task that can subscribe to CAN frames) could be factored out into a dedicated class or template. The poller could then create his own instance of that class, if it cannot hook into an existing one.
Btw, in case you're not aware of this, FreeRTOS also provides queue sets (https://www.freertos.org/RTOS-queue-sets.html). We haven't used them in the OVMS yet, but they could be useful, especially if message unions become large or tasks shall be able to dynamically subscribe to different message sources.
Regards, Michael
Am 30.04.24 um 01:20 schrieb Michael Geddes:
It might be worth reverting, but, I've got a patch suggestion that I'll push up which will let me know if I understand everything and which might provide a solution.
If this isn't going to work then revert. (P/R coming)
While the poller was still a part of the vehicle class it was probably still all ok. The poller had taken over what I assume you are talking about as the vehicle task. A call-back fromthe poller was calling IncomingPollRxFrame which was then coming from the (now) poller task (is that correct?)
While we have OVMS_COMP_POLLER config defined, we could just use the poller task to provide the IncomingPollRxFrame call-back from the poller (was vehicle?) task.
The problem is when OVMS_COMP_POLLER is undefined, we need an alternate (maybe we could use the 'Event' loop then) which is when I hacked that bad solution.
//.ichael
I was thinking though that because everything is being queued we could divert some calls into the car
On Mon, 29 Apr 2024, 18:58 Michael Balzer, <dexter@expeedo.de> wrote:
Michael,
I've found a severe design flaw with your poller change. Sorry, I should have seen that before, and shouldn't have merged this.
You have moved the standard CAN frame processing from the vehicle task into the CAN task by changing the vehicle from a CAN listener to a CAN callback processor. That will break all kind of things, vehicles like the Twizy, Smart and many others rely on frame processing being done in the dedicated vehicle task.
This especially induces issues regarding CAN processing capacity, as the vehicles rely on having a separate context and not needing to decouple complex processing of incoming frames. So this will degrade the CAN processing performance seriously in many cases, where additional steps involving file or network I/O need to be done.
So this needs to be changed back.
I assumed you introduced a new dedicated poller task but kept the vehicle task intact. From your naming (OvmsVehicle::IncomingPollRxFrame), it seems you misinterpreted the vehicle task's purpose as only being used for polling.
I assume this isn't a small change…? If so we should revert the poller merge, to avoid having a defunctional edge build state until the fix.
Secondly: logging is generally expensive regardless of the log level control and log channels enabled. Any log message needs to be queued to the log system, so involves a lock and a potential wait state (for the queue) & resulting context switch (= minimum delay of 10 ms). Therefore, logging must be avoided as far as possible in any time critical context, and is forbidden under some circumstances, e.g. in a timer callback (see FreeRTOS docs on this). The log system load multiplies with connected web clients or enabled file logging and enabled debug / verbose level logging -- that quickly becomes too much, usually triggering the task watchdog.
Your logging of nearly all bus events passing to/from the poller (especially the log entry in Queue_PollerFrame) becomes an issue on any vehicle that has high frequency running process data frames on the bus, like the Twizy or Smart. As a counter measure, I've just added a runtime control for all the poller's verbose logging (by default now off), and changed some debug level logs to verbose. Not sure if I've catched all that may need to be silenced by default. Please check all your log calls and place them under the new "trace" control flag wherever appropriate.
This won't help avoiding issues with process data frame buses though.
Shall I revert the poller merge for now?
Regards, Michael
Am 29.04.24 um 06:18 schrieb Michael Geddes:
Btw I included the log changes in the p/r which is a few small commits for the poller.
//.
On Mon, 29 Apr 2024, 07:20 Michael Geddes, <frog@bunyip.wheelycreek.net> wrote:
Hey Michael,
I've got to work now (it's Monday), but I suspect those 'giving up' are from unsolicited messages on the bus.
I can re-order things so that the message will likely be 'dropped (no poll entry)' rather than the time-out message.
And make it a verbose log.
//.ichael
On Mon, 29 Apr 2024 at 00:25, Michael Balzer <dexter@expeedo.de> wrote:
Michael,
forwarding the Twizy logs to you directly, as they contain the user location.
He has just verified it's the new version, he says the module stops responding as soon as he turns on the Twizy.
His description of his actions is a bit ambiguous, and it seems he didn't enable logging to the file persistently.
According to the server, these were the version boot times:
2024-04-28 15:30:56 0 3.3.004-32-g125e0841/ota_0/edge (build idf v3.3.4-849-g6e214dc335 Apr 26 2024 19:16:50) 2024-04-28 16:21:08 0 3.3.004-32-g125e0841/ota_0/edge (build idf v3.3.4-849-g6e214dc335 Apr 26 2024 19:16:50) 2024-04-28 16:38:33 0 3.3.004-63-gf3595561/ota_1/edge (build idf v3.3.4-849-g6e214dc335 Apr 27 2024 07:44:50) 2024-04-28 16:40:57 0 3.3.004-63-gf3595561/ota_1/edge (build idf v3.3.4-849-g6e214dc335 Apr 27 2024 07:44:50) 2024-04-28 16:43:14 0 3.3.004-63-gf3595561/ota_1/edge (build idf v3.3.4-849-g6e214dc335 Apr 27 2024 07:44:50) 2024-04-28 16:46:39 0 3.3.004-63-gf3595561/ota_1/edge (build idf v3.3.4-849-g6e214dc335 Apr 27 2024 07:44:50) 2024-04-28 16:54:44 0 3.3.004-32-g125e0841/ota_0/edge (build idf v3.3.4-849-g6e214dc335 Apr 26 2024 19:16:50)
Attached is also his crash debug log -- a2ll doesn't tell much about what happened, but maybe you get an idea from this.
After the boot at 16:46, there are immediately lots of these messages:
2024-04-28 16:46:33.792 CEST D (39042) vehicle-poll: Poller: Queue PollerFrame() 2024-04-28 16:46:33.792 CEST D (39042) vehicle-poll: [1]Poller: Incoming - giving up
Regards, Michael
Am 28.04.24 um 16:44 schrieb Michael Geddes:
Ah. OK.
I could try to fix the vin thing using the new way of doing it and get rid of a semaphore?
It would at least identify the problem possibly?
Michael
On Sun, 28 Apr 2024, 22:32 Michael Balzer via OvmsDev, <ovmsdev@lists.openvehicles.com> wrote:
Not sure if that's the problem, but I've found a different behaviour with the new PollSetState() implementation.
The old version only did anything if the new state actually was different from the previous one. The Twizy relies on this behaviour, calling PollSetState() from the per second ticker (see OvmsVehicleRenaultTwizy::ObdTicker1).
The new implementation apparently always sends the PollState command to the task, and that in turn always at least locks the poller mutex. Not sure if/how that could cause the observed issues, but it definitely adds quite some (unnecessary?) lock/unlock operations.
Am 28.04.24 um 16:05 schrieb Michael Balzer via OvmsDev:
The Twizy uses the poller to query the VIN (once) and DTCs (every 10 seconds while driving), see rt_obd2.cpp.
It also has its own version of the OBD single request (OvmsVehicleRenaultTwizy::ObdRequest), which was the precursor for the generalized version. This is used by custom/user Twizy plugins and scripts to access ECU internals.
The Twizy doesn't use IncomingPollRxFrame, but the Twizy's IncomingPollReply handler will log any poll responses it doesn't know about, so that could lead to a lot of log output if something goes wrong there.
Am 28.04.24 um 15:49 schrieb Michael Geddes via OvmsDev:
AFAICT the twizzy doesn't use the poller list at all. So is it missing a call-back or something??
I can see a potential problem with IncomingPollRxFrame being called twice as much as it should be but only when there is a poll list. Maybe commenting out this would do it. (I can find another away to get this called on the thread I want). This might be the problem with the smarted
void OvmsVehicle::OvmsVehicleSignal::IncomingPollRxFrame(canbus* bus, CAN_frame_t *frame, bool success) { //if (Ready()) // m_parent->IncomingPollRxFrame(frame, success); }
//.
On Sun, 28 Apr 2024 at 21:10, Michael Balzer via OvmsDev <ovmsdev@lists.openvehicles.com> wrote:
There may also be an issue with the Renault Twizy, I've received a report of a user who is using the edge builds, that the latest build wouldn't work.
He reports all kinds of errors and warnings signaled by the car during driving, and switching back to the previous build fixed the issues.
I've asked him to provide a debug log excerpt if possible.
Regards, Michael
Am 28.04.24 um 14:29 schrieb Michael Geddes via OvmsDev:
OK. That's bad.
Does the reading work in general?
Is it just the writing commands?
Raise a ticket on github and tag me in and we can address it that way.
Michael
On Sun, 28 Apr 2024, 19:49 Thomas Heuer via OvmsDev, <ovmsdev@lists.openvehicles.com> wrote:
Hi,
The new poller code doesn't seem to work properly with the smarted.
D (218831) vehicle-poll: [1]PollerNextTick(PRI): cycle complete for ticker=215
V (218831) vehicle-poll: Standard Poll Series: List reset
D (218831) vehicle-poll: PollSeriesList::NextPollEntry[!v.standard]: ReachedEnd
V (218831) vehicle-poll: [1]PollerSend: Poller Reached End
D (219691) vehicle-poll: Poller: Queue PollerFrame()
D (219691) vehicle-poll: Poller: Queue PollerFrame()
V (219691) vehicle-poll: Pollers: FrameRx(bus=2)
D (219691) vehicle-poll: Poller: Queue PollerFrame()
V (219691) vehicle-poll: Pollers: FrameRx(bus=2)
V (219691) vehicle-poll: Pollers: FrameRx(bus=2)
D (219691) vehicle-poll: Poller: Queue PollerFrame()
*OVMS#*unlock 22 Vehicle unlocked
V (219691) vehicle-poll: Pollers: FrameRx(bus=2)
-- Michael Balzer * Helkenberger Weg 9 * D-58256 Ennepetal Fon 02333 / 833 5735 * Handy 0176 / 206 989 26
I have a question for Michael B (or whoever) - I have a commit lined up that would add a bit of a time check to the poller loop. What do we expect the maximum time to execute a poller loop command should be? This is a rough idea (in ms) I have.. based on nothing much really, so any ideas would be appreciated: int TardyMaxTime_ms(OvmsPoller::OvmsPollEntryType entry_type) { switch (entry_type) { case OvmsPoller::OvmsPollEntryType::Poll: return 80; case OvmsPoller::OvmsPollEntryType::FrameRx: return 30; case OvmsPoller::OvmsPollEntryType::FrameTx: return 20; case OvmsPoller::OvmsPollEntryType::Command: return 10; case OvmsPoller::OvmsPollEntryType::PollState: return 15; default: return 80; } } //.ichael On Mon, 6 May 2024 at 07:45, Michael Geddes <frog@bunyip.wheelycreek.net> wrote:
I realise that I was only using the standard cable to test - which probably is not sufficient - I haven't looked closely at how the Leaf OBD to Db9 cable is different from standard.
Ah, my bad out the queue length. We are definitely queueing more messages though. From my log of when the overflow happened, the poller was in state 0 which means OFF - ie nothing was being sent!!
I'll look at the TX message thing - opt in sounds good - though it shouldn't be playing that much of a part here as the TXs are infrequent in this case (or zero when the leaf is off or driving) - On the ioniq 5 when I'm using the HUD - I'm polling quite frequently - multiple times per second and that seems to be fine!.
I did find an issue with the throttling .. but it would still mostly apply the throttling where it matters, so again, it shouldn't be the problem (also, we aren't transmitting in the leaf case).
The change I made to the logging of RX messages showed how many in a row were dropped... and it was mostly 1 only in a run - which means even if it is a short time between - that means that the drops are being interleaved by at least one success!
Sooo.. I'm still wondering what is going on. Some things I'm going to try:
* If the number of messages on the Can bus (coming in through RX) means that the queue is slowly getting longer and not quite catching up, then making the queue longer will help it last longer... but only pushes the problem down the road. - Add 'current queue length' to the poller status information to see if this is indeed the case? - Add some kind of alert when the queue reaches a % full? * Once you start overflowing and getting overflow log messages, I wonder if this is then contributing to the problem. - Push the overflow logging into Poller Task which can look at how many drops occurred since last received item. * Split up the flags for the poller messages into 2: - Messages that are/could be happening in the TX/RX tasks - Other noisy messages that always happen in the poller task.
Thoughts on what else we might measure to figure out what is going on?
//.ichael
On Sun, 5 May 2024, 19:29 Michael Balzer via OvmsDev, < ovmsdev@lists.openvehicles.com> wrote:
Michael,
the queue size isn't in bytes, it's in messages:
* @param uxQueueLength The maximum number of items that the queue can contain. * * @param uxItemSize The number of bytes each item in the queue will require.
Also, from the time stamps in Dereks log excerpt, there were quite some dropped frames in that time window -- at least 23 frames in 40 ms, that's bad.
Queue sizes are currently:
CONFIG_OVMS_HW_CAN_RX_QUEUE_SIZE=60 CONFIG_OVMS_VEHICLE_CAN_RX_QUEUE_SIZE=60
The new poller now channels all TX callbacks through the task queue additionally to RX and commands. So setting the queue size to be larger than the CAN RX queue size seems appropriate.
Nevertheless, an overflow with more than 60 waiting messages still indicates some too long processing time in the vehicle task.
TX callbacks previously were done directly in the CAN context, and no current vehicle overrides the empty default handler, so this imposed almost no additional overhead. By requiring a queue entry for each TX callback, this feature now has a potentially high impact for all vehicles. If passing these to the task is actually necessary, it needs to become an opt-in feature, so only vehicles subscribing to the callback actually need to cope with that additional load & potential processing delays involved.
Regards, Michael
Warning / gathering debug statistics about slow processing can be helpful, but there must not be a hard limit. Frame/poll response processing may need disk or network I/O, and the vehicle task may be starving from punctual high loads on higher priority tasks (e.g. networking) or by needing to wait for some semaphore -- that's outside the application's control, and must not lead to termination/recreation of the task (in case you're heading towards that direction). I have no idea how much processing time the current vehicles actually need in their respective worst cases. Your draft is probably too lax, poll responses and frames normally need to be processed much faster. I'd say 10 ms is already too slow, but any wait for a queue/semaphore will already mean at least 10 ms (FreeRTOS tick). Probably best to begin with just collecting stats. Btw, to help in narrowing down the actual problem case, the profiler could collect max times per RX message ID. Regards, Michael Am 12.05.24 um 10:41 schrieb Michael Geddes:
I have a question for Michael B (or whoever) - I have a commit lined up that would add a bit of a time check to the poller loop. What do we expect the maximum time to execute a poller loop command should be? This is a rough idea (in ms) I have.. based on nothing much really, so any ideas would be appreciated: int TardyMaxTime_ms(OvmsPoller::OvmsPollEntryType entry_type) { switch (entry_type) { case OvmsPoller::OvmsPollEntryType::Poll: return 80; case OvmsPoller::OvmsPollEntryType::FrameRx: return 30; case OvmsPoller::OvmsPollEntryType::FrameTx: return 20; case OvmsPoller::OvmsPollEntryType::Command: return 10; case OvmsPoller::OvmsPollEntryType::PollState: return 15; default: return 80; } }
//.ichael
On Mon, 6 May 2024 at 07:45, Michael Geddes <frog@bunyip.wheelycreek.net> wrote:
I realise that I was only using the standard cable to test - which probably is not sufficient - I haven't looked closely at how the Leaf OBD to Db9 cable is different from standard.
Ah, my bad out the queue length. We are definitely queueing more messages though. From my log of when the overflow happened, the poller was in state 0 which means OFF - ie nothing was being sent!!
I'll look at the TX message thing - opt in sounds good - though it shouldn't be playing that much of a part here as the TXs are infrequent in this case (or zero when the leaf is off or driving) - On the ioniq 5 when I'm using the HUD - I'm polling quite frequently - multiple times per second and that seems to be fine!.
I did find an issue with the throttling .. but it would still mostly apply the throttling where it matters, so again, it shouldn't be the problem (also, we aren't transmitting in the leaf case).
The change I made to the logging of RX messages showed how many in a row were dropped... and it was mostly 1 only in a run - which means even if it is a short time between - that means that the drops are being interleaved by at least one success!
Sooo.. I'm still wondering what is going on. Some things I'm going to try:
* If the number of messages on the Can bus (coming in through RX) means that the queue is slowly getting longer and not quite catching up, then making the queue longer will help it last longer... but only pushes the problem down the road. - Add 'current queue length' to the poller status information to see if this is indeed the case? - Add some kind of alert when the queue reaches a % full? * Once you start overflowing and getting overflow log messages, I wonder if this is then contributing to the problem. - Push the overflow logging into Poller Task which can look at how many drops occurred since last received item. * Split up the flags for the poller messages into 2: - Messages that are/could be happening in the TX/RX tasks - Other noisy messages that always happen in the poller task.
Thoughts on what else we might measure to figure out what is going on?
//.ichael
On Sun, 5 May 2024, 19:29 Michael Balzer via OvmsDev, <ovmsdev@lists.openvehicles.com> wrote:
Michael,
the queue size isn't in bytes, it's in messages:
* @param uxQueueLength The maximum number of items that the queue can contain. * * @param uxItemSize The number of bytes each item in the queue will require.
Also, from the time stamps in Dereks log excerpt, there were quite some dropped frames in that time window -- at least 23 frames in 40 ms, that's bad.
Queue sizes are currently:
CONFIG_OVMS_HW_CAN_RX_QUEUE_SIZE=60 CONFIG_OVMS_VEHICLE_CAN_RX_QUEUE_SIZE=60
The new poller now channels all TX callbacks through the task queue additionally to RX and commands. So setting the queue size to be larger than the CAN RX queue size seems appropriate.
Nevertheless, an overflow with more than 60 waiting messages still indicates some too long processing time in the vehicle task.
TX callbacks previously were done directly in the CAN context, and no current vehicle overrides the empty default handler, so this imposed almost no additional overhead. By requiring a queue entry for each TX callback, this feature now has a potentially high impact for all vehicles. If passing these to the task is actually necessary, it needs to become an opt-in feature, so only vehicles subscribing to the callback actually need to cope with that additional load & potential processing delays involved.
Regards, Michael
-- Michael Balzer * Helkenberger Weg 9 * D-58256 Ennepetal Fon 02333 / 833 5735 * Handy 0176 / 206 989 26
Yeah - I certainly wasn't going to put a hard limit. Just a log above a certain time, that being said, the idea of just collecting stats (being able to turn it on via a "poller timer" set of commands) would be much more useful. I'll look into that. Average time is probably a good stat - and certainly what we care about. I actually am hopeful that those couple of things I did might help reduce that average time quite a bit (that short-cutting the isotp protocol handling especially). That p/r with logging changes might help reduce the unproductive log time further, but also makes it possible to turn on the poller logging without the RX task logs kicking in. //.ichael On Sun, 12 May 2024 at 22:29, Michael Balzer via OvmsDev < ovmsdev@lists.openvehicles.com> wrote:
Warning / gathering debug statistics about slow processing can be helpful, but there must not be a hard limit. Frame/poll response processing may need disk or network I/O, and the vehicle task may be starving from punctual high loads on higher priority tasks (e.g. networking) or by needing to wait for some semaphore -- that's outside the application's control, and must not lead to termination/recreation of the task (in case you're heading towards that direction).
I have no idea how much processing time the current vehicles actually need in their respective worst cases. Your draft is probably too lax, poll responses and frames normally need to be processed much faster. I'd say 10 ms is already too slow, but any wait for a queue/semaphore will already mean at least 10 ms (FreeRTOS tick). Probably best to begin with just collecting stats.
Btw, to help in narrowing down the actual problem case, the profiler could collect max times per RX message ID.
Regards, Michael
Am 12.05.24 um 10:41 schrieb Michael Geddes:
I have a question for Michael B (or whoever) - I have a commit lined up that would add a bit of a time check to the poller loop. What do we expect the maximum time to execute a poller loop command should be? This is a rough idea (in ms) I have.. based on nothing much really, so any ideas would be appreciated: int TardyMaxTime_ms(OvmsPoller::OvmsPollEntryType entry_type) { switch (entry_type) { case OvmsPoller::OvmsPollEntryType::Poll: return 80; case OvmsPoller::OvmsPollEntryType::FrameRx: return 30; case OvmsPoller::OvmsPollEntryType::FrameTx: return 20; case OvmsPoller::OvmsPollEntryType::Command: return 10; case OvmsPoller::OvmsPollEntryType::PollState: return 15; default: return 80; } }
//.ichael
On Mon, 6 May 2024 at 07:45, Michael Geddes <frog@bunyip.wheelycreek.net> wrote:
I realise that I was only using the standard cable to test - which probably is not sufficient - I haven't looked closely at how the Leaf OBD to Db9 cable is different from standard.
Ah, my bad out the queue length. We are definitely queueing more messages though. From my log of when the overflow happened, the poller was in state 0 which means OFF - ie nothing was being sent!!
I'll look at the TX message thing - opt in sounds good - though it shouldn't be playing that much of a part here as the TXs are infrequent in this case (or zero when the leaf is off or driving) - On the ioniq 5 when I'm using the HUD - I'm polling quite frequently - multiple times per second and that seems to be fine!.
I did find an issue with the throttling .. but it would still mostly apply the throttling where it matters, so again, it shouldn't be the problem (also, we aren't transmitting in the leaf case).
The change I made to the logging of RX messages showed how many in a row were dropped... and it was mostly 1 only in a run - which means even if it is a short time between - that means that the drops are being interleaved by at least one success!
Sooo.. I'm still wondering what is going on. Some things I'm going to try:
* If the number of messages on the Can bus (coming in through RX) means that the queue is slowly getting longer and not quite catching up, then making the queue longer will help it last longer... but only pushes the problem down the road. - Add 'current queue length' to the poller status information to see if this is indeed the case? - Add some kind of alert when the queue reaches a % full? * Once you start overflowing and getting overflow log messages, I wonder if this is then contributing to the problem. - Push the overflow logging into Poller Task which can look at how many drops occurred since last received item. * Split up the flags for the poller messages into 2: - Messages that are/could be happening in the TX/RX tasks - Other noisy messages that always happen in the poller task.
Thoughts on what else we might measure to figure out what is going on?
//.ichael
On Sun, 5 May 2024, 19:29 Michael Balzer via OvmsDev, < ovmsdev@lists.openvehicles.com> wrote:
Michael,
the queue size isn't in bytes, it's in messages:
* @param uxQueueLength The maximum number of items that the queue can contain. * * @param uxItemSize The number of bytes each item in the queue will require.
Also, from the time stamps in Dereks log excerpt, there were quite some dropped frames in that time window -- at least 23 frames in 40 ms, that's bad.
Queue sizes are currently:
CONFIG_OVMS_HW_CAN_RX_QUEUE_SIZE=60 CONFIG_OVMS_VEHICLE_CAN_RX_QUEUE_SIZE=60
The new poller now channels all TX callbacks through the task queue additionally to RX and commands. So setting the queue size to be larger than the CAN RX queue size seems appropriate.
Nevertheless, an overflow with more than 60 waiting messages still indicates some too long processing time in the vehicle task.
TX callbacks previously were done directly in the CAN context, and no current vehicle overrides the empty default handler, so this imposed almost no additional overhead. By requiring a queue entry for each TX callback, this feature now has a potentially high impact for all vehicles. If passing these to the task is actually necessary, it needs to become an opt-in feature, so only vehicles subscribing to the callback actually need to cope with that additional load & potential processing delays involved.
Regards, Michael
-- Michael Balzer * Helkenberger Weg 9 * D-58256 Ennepetal Fon 02333 / 833 5735 * Handy 0176 / 206 989 26
_______________________________________________ OvmsDev mailing list OvmsDev@lists.openvehicles.com http://lists.openvehicles.com/mailman/listinfo/ovmsdev
Formatting aside, I have implemented what I think Michael B was suggesting. This is a sample run on the Ioniq 5 (which doesn't have unsolicited RX events). This uses the call esp_timer_get_time() got get a 64bit *microseconds* since started value - and works out the time to execute that way. It's looking at absolute time and not time in the Task - so other things going on at the same time in other tasks will have an effect. (The normal tick count doesn't have nearly enough resolution to be useful - any other ideas on measurement?) I've got total accumulated time displaying in seconds and the average in milliseconds currently - but I can change that easy enough. The cumulative time is stored as uint64_t which will be plenty, as 32bit wouldn't be nearly enough. OVMS# *poller time on* Poller timing is now on OVMS# *poller time status* Poller timing is: on Poll [PRI] : n=390 tot=0.2s ave=0.586ms Poll [SRX] : n=316 tot=0.1s ave=0.196ms CAN1 RX[0778] : n=382 tot=0.2s ave=0.615ms CAN1 RX[07a8] : n=48 tot=0.0s ave=0.510ms CAN1 RX[07bb] : n=162 tot=0.1s ave=0.519ms CAN1 RX[07ce] : n=33 tot=0.0s ave=0.469ms CAN1 RX[07ea] : n=408 tot=0.2s ave=0.467ms CAN1 RX[07ec] : n=486 tot=0.2s ave=0.477ms CAN3 RX[07df] : n=769 tot=0.2s ave=0.261ms CAN1 TX[0770] : n=191 tot=0.0s ave=0.054ms CAN1 TX[07a0] : n=16 tot=0.0s ave=0.047ms CAN1 TX[07b3] : n=31 tot=0.0s ave=0.069ms CAN1 TX[07c6] : n=11 tot=0.0s ave=0.044ms CAN1 TX[07e2] : n=82 tot=0.0s ave=0.067ms CAN1 TX[07e4] : n=54 tot=0.0s ave=0.044ms Set State : n=7 tot=0.0s ave=0.104ms This is probably going to be quite useful in general! The TX call-backs don't seem to be significant here. (oh, I should probably implement a reset of the values too). //.ichael On Sun, 12 May 2024 at 22:58, Michael Geddes <frog@bunyip.wheelycreek.net> wrote:
Yeah - I certainly wasn't going to put a hard limit. Just a log above a certain time, that being said, the idea of just collecting stats (being able to turn it on via a "poller timer" set of commands) would be much more useful. I'll look into that.
Average time is probably a good stat - and certainly what we care about.
I actually am hopeful that those couple of things I did might help reduce that average time quite a bit (that short-cutting the isotp protocol handling especially).
That p/r with logging changes might help reduce the unproductive log time further, but also makes it possible to turn on the poller logging without the RX task logs kicking in.
//.ichael
On Sun, 12 May 2024 at 22:29, Michael Balzer via OvmsDev < ovmsdev@lists.openvehicles.com> wrote:
Warning / gathering debug statistics about slow processing can be helpful, but there must not be a hard limit. Frame/poll response processing may need disk or network I/O, and the vehicle task may be starving from punctual high loads on higher priority tasks (e.g. networking) or by needing to wait for some semaphore -- that's outside the application's control, and must not lead to termination/recreation of the task (in case you're heading towards that direction).
I have no idea how much processing time the current vehicles actually need in their respective worst cases. Your draft is probably too lax, poll responses and frames normally need to be processed much faster. I'd say 10 ms is already too slow, but any wait for a queue/semaphore will already mean at least 10 ms (FreeRTOS tick). Probably best to begin with just collecting stats.
Btw, to help in narrowing down the actual problem case, the profiler could collect max times per RX message ID.
Regards, Michael
Am 12.05.24 um 10:41 schrieb Michael Geddes:
I have a question for Michael B (or whoever) - I have a commit lined up that would add a bit of a time check to the poller loop. What do we expect the maximum time to execute a poller loop command should be? This is a rough idea (in ms) I have.. based on nothing much really, so any ideas would be appreciated: int TardyMaxTime_ms(OvmsPoller::OvmsPollEntryType entry_type) { switch (entry_type) { case OvmsPoller::OvmsPollEntryType::Poll: return 80; case OvmsPoller::OvmsPollEntryType::FrameRx: return 30; case OvmsPoller::OvmsPollEntryType::FrameTx: return 20; case OvmsPoller::OvmsPollEntryType::Command: return 10; case OvmsPoller::OvmsPollEntryType::PollState: return 15; default: return 80; } }
//.ichael
On Mon, 6 May 2024 at 07:45, Michael Geddes <frog@bunyip.wheelycreek.net> wrote:
I realise that I was only using the standard cable to test - which probably is not sufficient - I haven't looked closely at how the Leaf OBD to Db9 cable is different from standard.
Ah, my bad out the queue length. We are definitely queueing more messages though. From my log of when the overflow happened, the poller was in state 0 which means OFF - ie nothing was being sent!!
I'll look at the TX message thing - opt in sounds good - though it shouldn't be playing that much of a part here as the TXs are infrequent in this case (or zero when the leaf is off or driving) - On the ioniq 5 when I'm using the HUD - I'm polling quite frequently - multiple times per second and that seems to be fine!.
I did find an issue with the throttling .. but it would still mostly apply the throttling where it matters, so again, it shouldn't be the problem (also, we aren't transmitting in the leaf case).
The change I made to the logging of RX messages showed how many in a row were dropped... and it was mostly 1 only in a run - which means even if it is a short time between - that means that the drops are being interleaved by at least one success!
Sooo.. I'm still wondering what is going on. Some things I'm going to try:
* If the number of messages on the Can bus (coming in through RX) means that the queue is slowly getting longer and not quite catching up, then making the queue longer will help it last longer... but only pushes the problem down the road. - Add 'current queue length' to the poller status information to see if this is indeed the case? - Add some kind of alert when the queue reaches a % full? * Once you start overflowing and getting overflow log messages, I wonder if this is then contributing to the problem. - Push the overflow logging into Poller Task which can look at how many drops occurred since last received item. * Split up the flags for the poller messages into 2: - Messages that are/could be happening in the TX/RX tasks - Other noisy messages that always happen in the poller task.
Thoughts on what else we might measure to figure out what is going on?
//.ichael
On Sun, 5 May 2024, 19:29 Michael Balzer via OvmsDev, < ovmsdev@lists.openvehicles.com> wrote:
Michael,
the queue size isn't in bytes, it's in messages:
* @param uxQueueLength The maximum number of items that the queue can contain. * * @param uxItemSize The number of bytes each item in the queue will require.
Also, from the time stamps in Dereks log excerpt, there were quite some dropped frames in that time window -- at least 23 frames in 40 ms, that's bad.
Queue sizes are currently:
CONFIG_OVMS_HW_CAN_RX_QUEUE_SIZE=60 CONFIG_OVMS_VEHICLE_CAN_RX_QUEUE_SIZE=60
The new poller now channels all TX callbacks through the task queue additionally to RX and commands. So setting the queue size to be larger than the CAN RX queue size seems appropriate.
Nevertheless, an overflow with more than 60 waiting messages still indicates some too long processing time in the vehicle task.
TX callbacks previously were done directly in the CAN context, and no current vehicle overrides the empty default handler, so this imposed almost no additional overhead. By requiring a queue entry for each TX callback, this feature now has a potentially high impact for all vehicles. If passing these to the task is actually necessary, it needs to become an opt-in feature, so only vehicles subscribing to the callback actually need to cope with that additional load & potential processing delays involved.
Regards, Michael
-- Michael Balzer * Helkenberger Weg 9 * D-58256 Ennepetal Fon 02333 / 833 5735 * Handy 0176 / 206 989 26
_______________________________________________ OvmsDev mailing list OvmsDev@lists.openvehicles.com http://lists.openvehicles.com/mailman/listinfo/ovmsdev
esp_timer_get_time() is the right choice for precision timing. I'd say uint32 is enough though, even if counting microseconds that can hold a total of more than 71 hours of actual processing time. uint64 has a significant performance penalty, although I don't recall the overhead for simple additions. Also & more important, the average wouldn't be my main focus, but the maximum processing time seen per ID, which seems to be missing in your draft. Second thought on the average… the exact overall average really has a minor meaning, I'd rather see the current average, adapting to the current mode of operation (drive/charge/…). I suggest feeding the measurements to a low pass filter to get the smoothed average of the last n measurements. Pattern: runavg = ((N-1) * runavg + newval) / N By using a low power of 2 for N (e.g. 8 or 16), you can replace the division by a simple bit shift, and have enough headroom to use 32 bit integers. Regards, Michael Am 15.05.24 um 06:51 schrieb Michael Geddes via OvmsDev:
Formatting aside, I have implemented what I think Michael B was suggesting. This is a sample run on the Ioniq 5 (which doesn't have unsolicited RX events).
This uses the call esp_timer_get_time() got get a 64bit *microseconds* since started value - and works out the time to execute that way. It's looking at absolute time and not time in the Task - so other things going on at the same time in other tasks will have an effect. (The normal tick count doesn't have nearly enough resolution to be useful - any other ideas on measurement?) I've got total accumulated time displaying in seconds and the average in milliseconds currently - but I can change that easy enough. The cumulative time is stored as uint64_t which will be plenty, as 32bit wouldn't be nearly enough.
OVMS# *poller time on* Poller timing is now on
OVMS# *poller time status* Poller timing is: on Poll [PRI] : n=390 tot=0.2s ave=0.586ms Poll [SRX] : n=316 tot=0.1s ave=0.196ms CAN1 RX[0778] : n=382 tot=0.2s ave=0.615ms CAN1 RX[07a8] : n=48 tot=0.0s ave=0.510ms CAN1 RX[07bb] : n=162 tot=0.1s ave=0.519ms CAN1 RX[07ce] : n=33 tot=0.0s ave=0.469ms CAN1 RX[07ea] : n=408 tot=0.2s ave=0.467ms CAN1 RX[07ec] : n=486 tot=0.2s ave=0.477ms CAN3 RX[07df] : n=769 tot=0.2s ave=0.261ms CAN1 TX[0770] : n=191 tot=0.0s ave=0.054ms CAN1 TX[07a0] : n=16 tot=0.0s ave=0.047ms CAN1 TX[07b3] : n=31 tot=0.0s ave=0.069ms CAN1 TX[07c6] : n=11 tot=0.0s ave=0.044ms CAN1 TX[07e2] : n=82 tot=0.0s ave=0.067ms CAN1 TX[07e4] : n=54 tot=0.0s ave=0.044ms Set State : n=7 tot=0.0s ave=0.104ms
This is probably going to be quite useful in general! The TX call-backs don't seem to be significant here. (oh, I should probably implement a reset of the values too).
//.ichael
On Sun, 12 May 2024 at 22:58, Michael Geddes <frog@bunyip.wheelycreek.net> wrote:
Yeah - I certainly wasn't going to put a hard limit. Just a log above a certain time, that being said, the idea of just collecting stats (being able to turn it on via a "poller timer" set of commands) would be much more useful. I'll look into that.
Average time is probably a good stat - and certainly what we care about.
I actually am hopeful that those couple of things I did might help reduce that average time quite a bit (that short-cutting the isotp protocol handling especially).
That p/r with logging changes might help reduce the unproductive log time further, but also makes it possible to turn on the poller logging without the RX task logs kicking in.
//.ichael
On Sun, 12 May 2024 at 22:29, Michael Balzer via OvmsDev <ovmsdev@lists.openvehicles.com> wrote:
Warning / gathering debug statistics about slow processing can be helpful, but there must not be a hard limit. Frame/poll response processing may need disk or network I/O, and the vehicle task may be starving from punctual high loads on higher priority tasks (e.g. networking) or by needing to wait for some semaphore -- that's outside the application's control, and must not lead to termination/recreation of the task (in case you're heading towards that direction).
I have no idea how much processing time the current vehicles actually need in their respective worst cases. Your draft is probably too lax, poll responses and frames normally need to be processed much faster. I'd say 10 ms is already too slow, but any wait for a queue/semaphore will already mean at least 10 ms (FreeRTOS tick). Probably best to begin with just collecting stats.
Btw, to help in narrowing down the actual problem case, the profiler could collect max times per RX message ID.
Regards, Michael
Am 12.05.24 um 10:41 schrieb Michael Geddes:
I have a question for Michael B (or whoever) - I have a commit lined up that would add a bit of a time check to the poller loop. What do we expect the maximum time to execute a poller loop command should be? This is a rough idea (in ms) I have.. based on nothing much really, so any ideas would be appreciated: int TardyMaxTime_ms(OvmsPoller::OvmsPollEntryType entry_type) { switch (entry_type) { case OvmsPoller::OvmsPollEntryType::Poll: return 80; case OvmsPoller::OvmsPollEntryType::FrameRx: return 30; case OvmsPoller::OvmsPollEntryType::FrameTx: return 20; case OvmsPoller::OvmsPollEntryType::Command: return 10; case OvmsPoller::OvmsPollEntryType::PollState: return 15; default: return 80; } }
//.ichael
On Mon, 6 May 2024 at 07:45, Michael Geddes <frog@bunyip.wheelycreek.net> wrote:
I realise that I was only using the standard cable to test - which probably is not sufficient - I haven't looked closely at how the Leaf OBD to Db9 cable is different from standard.
Ah, my bad out the queue length. We are definitely queueing more messages though. From my log of when the overflow happened, the poller was in state 0 which means OFF - ie nothing was being sent!!
I'll look at the TX message thing - opt in sounds good - though it shouldn't be playing that much of a part here as the TXs are infrequent in this case (or zero when the leaf is off or driving) - On the ioniq 5 when I'm using the HUD - I'm polling quite frequently - multiple times per second and that seems to be fine!.
I did find an issue with the throttling .. but it would still mostly apply the throttling where it matters, so again, it shouldn't be the problem (also, we aren't transmitting in the leaf case).
The change I made to the logging of RX messages showed how many in a row were dropped... and it was mostly 1 only in a run - which means even if it is a short time between - that means that the drops are being interleaved by at least one success!
Sooo.. I'm still wondering what is going on. Some things I'm going to try:
* If the number of messages on the Can bus (coming in through RX) means that the queue is slowly getting longer and not quite catching up, then making the queue longer will help it last longer... but only pushes the problem down the road. - Add 'current queue length' to the poller status information to see if this is indeed the case? - Add some kind of alert when the queue reaches a % full? * Once you start overflowing and getting overflow log messages, I wonder if this is then contributing to the problem. - Push the overflow logging into Poller Task which can look at how many drops occurred since last received item. * Split up the flags for the poller messages into 2: - Messages that are/could be happening in the TX/RX tasks - Other noisy messages that always happen in the poller task.
Thoughts on what else we might measure to figure out what is going on?
//.ichael
On Sun, 5 May 2024, 19:29 Michael Balzer via OvmsDev, <ovmsdev@lists.openvehicles.com> wrote:
Michael,
the queue size isn't in bytes, it's in messages:
* @param uxQueueLength The maximum number of items that the queue can contain. * * @param uxItemSize The number of bytes each item in the queue will require.
Also, from the time stamps in Dereks log excerpt, there were quite some dropped frames in that time window -- at least 23 frames in 40 ms, that's bad.
Queue sizes are currently:
CONFIG_OVMS_HW_CAN_RX_QUEUE_SIZE=60 CONFIG_OVMS_VEHICLE_CAN_RX_QUEUE_SIZE=60
The new poller now channels all TX callbacks through the task queue additionally to RX and commands. So setting the queue size to be larger than the CAN RX queue size seems appropriate.
Nevertheless, an overflow with more than 60 waiting messages still indicates some too long processing time in the vehicle task.
TX callbacks previously were done directly in the CAN context, and no current vehicle overrides the empty default handler, so this imposed almost no additional overhead. By requiring a queue entry for each TX callback, this feature now has a potentially high impact for all vehicles. If passing these to the task is actually necessary, it needs to become an opt-in feature, so only vehicles subscribing to the callback actually need to cope with that additional load & potential processing delays involved.
Regards, Michael
-- Michael Balzer * Helkenberger Weg 9 * D-58256 Ennepetal Fon 02333 / 833 5735 * Handy 0176 / 206 989 26
_______________________________________________ OvmsDev mailing list OvmsDev@lists.openvehicles.com http://lists.openvehicles.com/mailman/listinfo/ovmsdev
_______________________________________________ OvmsDev mailing list OvmsDev@lists.openvehicles.com http://lists.openvehicles.com/mailman/listinfo/ovmsdev
-- Michael Balzer * Helkenberger Weg 9 * D-58256 Ennepetal Fon 02333 / 833 5735 * Handy 0176 / 206 989 26
Thanks Michael, My calculations give me ((2^32)-1) / (1000*1000*3600) = only 1.2 hours of processing time in 32bit. The initial subtraction is 64bit anyway and I can't see a further 64bit addition being a problem. I have the calculations being performed in doubles at print-out where performance is not really an issue anyway. (Though apparently doing 64 bit division is worse than floating point). In addition * I currently have this being able to be turned on and off and reset manually (only do it when required). * For the lower volume commands, the smoothed average is not going to be useful - the count is more interesting for different reasons. * The total time is quite useful. Ie a high average time doesn't matter if the count is low. The things that are affecting performance are stuff with high total time. Stuff which is happening 100 times a second needs to be a much lower average than once a second. * A measure like 'time per minute/second' and possibly count per minute/seconds as a smoothed average would potentially be more useful. (or in addition?) I think we could do _that_ in a reasonably efficient manner using a 64 bit 'last measured time', a 32 bit accumulated value and the stored 32 bit rolling average. It would boils down to some iterative (integer) sums and multiplications plus a divide by n ^ (time periods passed) - which is a shift - and which can be optimised to '0' if 'time-periods-passed' is more than 32/(bits-per-n) - effectively limiting the number of iterations. The one issue I can see is that we need to calculate 'number of time-periods passed' which is a 64 bit subtraction followed by a 32 bit division (not optimisable to a simple shift). * I'm also happy to keep a rolling (32bit) average time. Even if you assume averages in the 100ms, 32bit is going to happily support an N of 64 or even 128. Am I right in thinking that the choice of N is highly dependent on frequency. For things happening 100 times per second, you might want an N like 128.. where things happening once per second, you might want an N of 4 or 8. The other things we keep track of in this manner we have a better idea of the frequency of the thing. How about we have (per record type): * total count (since last reset?) (32 bit) * smoothed average of time per instance (32 bit) * ?xx? total accumulated time since last reset (64bit) ?? <-- with the below stats this is much less useful * last-measured-time (64 bit) * accumulated count since last time-period (16bit - but maybe 32bit anyway for byte alignment?) * smoothed average of count per time-period (32bit) * accumulated time since last time-period (32bit) * smoothed average of time per time-period (32bit) It's possible to keep the Is this going to be too much per record type? The number of 'records' we are keeping is quite low (so 10 to 20 maybe) - so it's not a huge memory burden. Thoughts? //.ichael On Thu, 16 May 2024 at 03:09, Michael Balzer via OvmsDev < ovmsdev@lists.openvehicles.com> wrote:
esp_timer_get_time() is the right choice for precision timing.
I'd say uint32 is enough though, even if counting microseconds that can hold a total of more than 71 hours of actual processing time. uint64 has a significant performance penalty, although I don't recall the overhead for simple additions.
Also & more important, the average wouldn't be my main focus, but the maximum processing time seen per ID, which seems to be missing in your draft.
Second thought on the average… the exact overall average really has a minor meaning, I'd rather see the current average, adapting to the current mode of operation (drive/charge/…). I suggest feeding the measurements to a low pass filter to get the smoothed average of the last n measurements. Pattern:
runavg = ((N-1) * runavg + newval) / N
By using a low power of 2 for N (e.g. 8 or 16), you can replace the division by a simple bit shift, and have enough headroom to use 32 bit integers.
Regards, Michael
Am 15.05.24 um 06:51 schrieb Michael Geddes via OvmsDev:
Formatting aside, I have implemented what I think Michael B was suggesting. This is a sample run on the Ioniq 5 (which doesn't have unsolicited RX events).
This uses the call esp_timer_get_time() got get a 64bit *microseconds* since started value - and works out the time to execute that way. It's looking at absolute time and not time in the Task - so other things going on at the same time in other tasks will have an effect. (The normal tick count doesn't have nearly enough resolution to be useful - any other ideas on measurement?) I've got total accumulated time displaying in seconds and the average in milliseconds currently - but I can change that easy enough. The cumulative time is stored as uint64_t which will be plenty, as 32bit wouldn't be nearly enough.
OVMS# *poller time on* Poller timing is now on
OVMS# *poller time status* Poller timing is: on Poll [PRI] : n=390 tot=0.2s ave=0.586ms Poll [SRX] : n=316 tot=0.1s ave=0.196ms CAN1 RX[0778] : n=382 tot=0.2s ave=0.615ms CAN1 RX[07a8] : n=48 tot=0.0s ave=0.510ms CAN1 RX[07bb] : n=162 tot=0.1s ave=0.519ms CAN1 RX[07ce] : n=33 tot=0.0s ave=0.469ms CAN1 RX[07ea] : n=408 tot=0.2s ave=0.467ms CAN1 RX[07ec] : n=486 tot=0.2s ave=0.477ms CAN3 RX[07df] : n=769 tot=0.2s ave=0.261ms CAN1 TX[0770] : n=191 tot=0.0s ave=0.054ms CAN1 TX[07a0] : n=16 tot=0.0s ave=0.047ms CAN1 TX[07b3] : n=31 tot=0.0s ave=0.069ms CAN1 TX[07c6] : n=11 tot=0.0s ave=0.044ms CAN1 TX[07e2] : n=82 tot=0.0s ave=0.067ms CAN1 TX[07e4] : n=54 tot=0.0s ave=0.044ms Set State : n=7 tot=0.0s ave=0.104ms
This is probably going to be quite useful in general! The TX call-backs don't seem to be significant here. (oh, I should probably implement a reset of the values too).
//.ichael
On Sun, 12 May 2024 at 22:58, Michael Geddes <frog@bunyip.wheelycreek.net> wrote:
Yeah - I certainly wasn't going to put a hard limit. Just a log above a certain time, that being said, the idea of just collecting stats (being able to turn it on via a "poller timer" set of commands) would be much more useful. I'll look into that.
Average time is probably a good stat - and certainly what we care about.
I actually am hopeful that those couple of things I did might help reduce that average time quite a bit (that short-cutting the isotp protocol handling especially).
That p/r with logging changes might help reduce the unproductive log time further, but also makes it possible to turn on the poller logging without the RX task logs kicking in.
//.ichael
On Sun, 12 May 2024 at 22:29, Michael Balzer via OvmsDev < ovmsdev@lists.openvehicles.com> wrote:
Warning / gathering debug statistics about slow processing can be helpful, but there must not be a hard limit. Frame/poll response processing may need disk or network I/O, and the vehicle task may be starving from punctual high loads on higher priority tasks (e.g. networking) or by needing to wait for some semaphore -- that's outside the application's control, and must not lead to termination/recreation of the task (in case you're heading towards that direction).
I have no idea how much processing time the current vehicles actually need in their respective worst cases. Your draft is probably too lax, poll responses and frames normally need to be processed much faster. I'd say 10 ms is already too slow, but any wait for a queue/semaphore will already mean at least 10 ms (FreeRTOS tick). Probably best to begin with just collecting stats.
Btw, to help in narrowing down the actual problem case, the profiler could collect max times per RX message ID.
Regards, Michael
Am 12.05.24 um 10:41 schrieb Michael Geddes:
I have a question for Michael B (or whoever) - I have a commit lined up that would add a bit of a time check to the poller loop. What do we expect the maximum time to execute a poller loop command should be? This is a rough idea (in ms) I have.. based on nothing much really, so any ideas would be appreciated: int TardyMaxTime_ms(OvmsPoller::OvmsPollEntryType entry_type) { switch (entry_type) { case OvmsPoller::OvmsPollEntryType::Poll: return 80; case OvmsPoller::OvmsPollEntryType::FrameRx: return 30; case OvmsPoller::OvmsPollEntryType::FrameTx: return 20; case OvmsPoller::OvmsPollEntryType::Command: return 10; case OvmsPoller::OvmsPollEntryType::PollState: return 15; default: return 80; } }
//.ichael
On Mon, 6 May 2024 at 07:45, Michael Geddes <frog@bunyip.wheelycreek.net> wrote:
I realise that I was only using the standard cable to test - which probably is not sufficient - I haven't looked closely at how the Leaf OBD to Db9 cable is different from standard.
Ah, my bad out the queue length. We are definitely queueing more messages though. From my log of when the overflow happened, the poller was in state 0 which means OFF - ie nothing was being sent!!
I'll look at the TX message thing - opt in sounds good - though it shouldn't be playing that much of a part here as the TXs are infrequent in this case (or zero when the leaf is off or driving) - On the ioniq 5 when I'm using the HUD - I'm polling quite frequently - multiple times per second and that seems to be fine!.
I did find an issue with the throttling .. but it would still mostly apply the throttling where it matters, so again, it shouldn't be the problem (also, we aren't transmitting in the leaf case).
The change I made to the logging of RX messages showed how many in a row were dropped... and it was mostly 1 only in a run - which means even if it is a short time between - that means that the drops are being interleaved by at least one success!
Sooo.. I'm still wondering what is going on. Some things I'm going to try:
* If the number of messages on the Can bus (coming in through RX) means that the queue is slowly getting longer and not quite catching up, then making the queue longer will help it last longer... but only pushes the problem down the road. - Add 'current queue length' to the poller status information to see if this is indeed the case? - Add some kind of alert when the queue reaches a % full? * Once you start overflowing and getting overflow log messages, I wonder if this is then contributing to the problem. - Push the overflow logging into Poller Task which can look at how many drops occurred since last received item. * Split up the flags for the poller messages into 2: - Messages that are/could be happening in the TX/RX tasks - Other noisy messages that always happen in the poller task.
Thoughts on what else we might measure to figure out what is going on?
//.ichael
On Sun, 5 May 2024, 19:29 Michael Balzer via OvmsDev, < ovmsdev@lists.openvehicles.com> wrote:
Michael,
the queue size isn't in bytes, it's in messages:
* @param uxQueueLength The maximum number of items that the queue can contain. * * @param uxItemSize The number of bytes each item in the queue will require.
Also, from the time stamps in Dereks log excerpt, there were quite some dropped frames in that time window -- at least 23 frames in 40 ms, that's bad.
Queue sizes are currently:
CONFIG_OVMS_HW_CAN_RX_QUEUE_SIZE=60 CONFIG_OVMS_VEHICLE_CAN_RX_QUEUE_SIZE=60
The new poller now channels all TX callbacks through the task queue additionally to RX and commands. So setting the queue size to be larger than the CAN RX queue size seems appropriate.
Nevertheless, an overflow with more than 60 waiting messages still indicates some too long processing time in the vehicle task.
TX callbacks previously were done directly in the CAN context, and no current vehicle overrides the empty default handler, so this imposed almost no additional overhead. By requiring a queue entry for each TX callback, this feature now has a potentially high impact for all vehicles. If passing these to the task is actually necessary, it needs to become an opt-in feature, so only vehicles subscribing to the callback actually need to cope with that additional load & potential processing delays involved.
Regards, Michael
-- Michael Balzer * Helkenberger Weg 9 * D-58256 Ennepetal Fon 02333 / 833 5735 * Handy 0176 / 206 989 26
_______________________________________________ OvmsDev mailing list OvmsDev@lists.openvehicles.com http://lists.openvehicles.com/mailman/listinfo/ovmsdev
_______________________________________________ OvmsDev mailing listOvmsDev@lists.openvehicles.comhttp://lists.openvehicles.com/mailman/listinfo/ovmsdev
-- Michael Balzer * Helkenberger Weg 9 * D-58256 Ennepetal Fon 02333 / 833 5735 * Handy 0176 / 206 989 26
_______________________________________________ OvmsDev mailing list OvmsDev@lists.openvehicles.com http://lists.openvehicles.com/mailman/listinfo/ovmsdev
This is what I have now. The one on the end is the one MIchael B was after using an N of 32. (up for discussion). The middle is the time spent in that even t per second. It accumulates times (in microseconds), and then every 10s it stores it as smoothed (N=16) value. The Count is similar (except that we store a value of '100' as 1 event so it can be still integers and has 2 decimal places). Every received poll does a 64bit difference to 32bit (for the elapsed time) and 64bit comparison (for end-of-period). It also does 1x 32bit smoothing and 2x 32bit adds. Then at the end of a 10s period, it will do a 64bit add to get the next end-of-period value, as well as the 2x 32bit smoothing calcs. This is from the Ioniq 5 so not any big values yet. You can certainly see how insignificant the TX callbacks are. I'll leave it on for when the car is moving and gets some faster polling. OVMS# poll time status Poller timing is: on Type | Count | Ave time | Ave Length | per s | ms per s | ms -------------+----------+-----------+----------- Poll:PRI | 1.00| 0.540| 0.539 Poll:SRX | 0.03| 0.004| 0.017 CAN1 RX[778] | 0.06| 0.042| 0.175 CAN1 TX[770] | 0.04| 0.002| 0.008 Cmd:State | 0.01| 0.001| 0.005 ----------------------8<-------------------------------- Nice smoothing class (forces N as a power of 2): constexpr unsigned floorlog2(unsigned x) { return x == 1 ? 0 : 1+floorlog2(x >> 1); } /* Maintain a smoothed average using shifts for division. * T should be an integer type * N needs to be a power of 2 */ template <typename T, unsigned N> class average_util_t { private: T m_ave; public: average_util_t() : m_ave(0) {} static const uint8_t _BITS = floorlog2(N); void add( T val) { static_assert(N == (1 << _BITS), "N must be a power of 2"); m_ave = (((N-1) * m_ave) + val) >> _BITS; } T get() { return m_ave; } operator T() { return m_ave; } }; On Thu, 16 May 2024 at 10:29, Michael Geddes <frog@bunyip.wheelycreek.net> wrote:
Thanks Michael,
My calculations give me ((2^32)-1) / (1000*1000*3600) = only 1.2 hours of processing time in 32bit. The initial subtraction is 64bit anyway and I can't see a further 64bit addition being a problem. I have the calculations being performed in doubles at print-out where performance is not really an issue anyway. (Though apparently doing 64 bit division is worse than floating point).
In addition * I currently have this being able to be turned on and off and reset manually (only do it when required).
* For the lower volume commands, the smoothed average is not going to be useful - the count is more interesting for different reasons.
* The total time is quite useful. Ie a high average time doesn't matter if the count is low. The things that are affecting performance are stuff with high total time. Stuff which is happening 100 times a second needs to be a much lower average than once a second.
* A measure like 'time per minute/second' and possibly count per minute/seconds as a smoothed average would potentially be more useful. (or in addition?) I think we could do _that_ in a reasonably efficient manner using a 64 bit 'last measured time', a 32 bit accumulated value and the stored 32 bit rolling average. It would boils down to some iterative (integer) sums and multiplications plus a divide by n ^ (time periods passed) - which is a shift - and which can be optimised to '0' if 'time-periods-passed' is more than 32/(bits-per-n) - effectively limiting the number of iterations. The one issue I can see is that we need to calculate 'number of time-periods passed' which is a 64 bit subtraction followed by a 32 bit division (not optimisable to a simple shift).
* I'm also happy to keep a rolling (32bit) average time. Even if you assume averages in the 100ms, 32bit is going to happily support an N of 64 or even 128. Am I right in thinking that the choice of N is highly dependent on frequency. For things happening 100 times per second, you might want an N like 128.. where things happening once per second, you might want an N of 4 or 8. The other things we keep track of in this manner we have a better idea of the frequency of the thing.
How about we have (per record type): * total count (since last reset?) (32 bit) * smoothed average of time per instance (32 bit)
* ?xx? total accumulated time since last reset (64bit) ?? <-- with the below stats this is much less useful
* last-measured-time (64 bit) * accumulated count since last time-period (16bit - but maybe 32bit anyway for byte alignment?) * smoothed average of count per time-period (32bit) * accumulated time since last time-period (32bit) * smoothed average of time per time-period (32bit)
It's possible to keep the
Is this going to be too much per record type? The number of 'records' we are keeping is quite low (so 10 to 20 maybe) - so it's not a huge memory burden.
Thoughts?
//.ichael On Thu, 16 May 2024 at 03:09, Michael Balzer via OvmsDev < ovmsdev@lists.openvehicles.com> wrote:
esp_timer_get_time() is the right choice for precision timing.
I'd say uint32 is enough though, even if counting microseconds that can hold a total of more than 71 hours of actual processing time. uint64 has a significant performance penalty, although I don't recall the overhead for simple additions.
Also & more important, the average wouldn't be my main focus, but the maximum processing time seen per ID, which seems to be missing in your draft.
Second thought on the average… the exact overall average really has a minor meaning, I'd rather see the current average, adapting to the current mode of operation (drive/charge/…). I suggest feeding the measurements to a low pass filter to get the smoothed average of the last n measurements. Pattern:
runavg = ((N-1) * runavg + newval) / N
By using a low power of 2 for N (e.g. 8 or 16), you can replace the division by a simple bit shift, and have enough headroom to use 32 bit integers.
Regards, Michael
Am 15.05.24 um 06:51 schrieb Michael Geddes via OvmsDev:
Formatting aside, I have implemented what I think Michael B was suggesting. This is a sample run on the Ioniq 5 (which doesn't have unsolicited RX events).
This uses the call esp_timer_get_time() got get a 64bit *microseconds* since started value - and works out the time to execute that way. It's looking at absolute time and not time in the Task - so other things going on at the same time in other tasks will have an effect. (The normal tick count doesn't have nearly enough resolution to be useful - any other ideas on measurement?) I've got total accumulated time displaying in seconds and the average in milliseconds currently - but I can change that easy enough. The cumulative time is stored as uint64_t which will be plenty, as 32bit wouldn't be nearly enough.
OVMS# *poller time on* Poller timing is now on
OVMS# *poller time status* Poller timing is: on Poll [PRI] : n=390 tot=0.2s ave=0.586ms Poll [SRX] : n=316 tot=0.1s ave=0.196ms CAN1 RX[0778] : n=382 tot=0.2s ave=0.615ms CAN1 RX[07a8] : n=48 tot=0.0s ave=0.510ms CAN1 RX[07bb] : n=162 tot=0.1s ave=0.519ms CAN1 RX[07ce] : n=33 tot=0.0s ave=0.469ms CAN1 RX[07ea] : n=408 tot=0.2s ave=0.467ms CAN1 RX[07ec] : n=486 tot=0.2s ave=0.477ms CAN3 RX[07df] : n=769 tot=0.2s ave=0.261ms CAN1 TX[0770] : n=191 tot=0.0s ave=0.054ms CAN1 TX[07a0] : n=16 tot=0.0s ave=0.047ms CAN1 TX[07b3] : n=31 tot=0.0s ave=0.069ms CAN1 TX[07c6] : n=11 tot=0.0s ave=0.044ms CAN1 TX[07e2] : n=82 tot=0.0s ave=0.067ms CAN1 TX[07e4] : n=54 tot=0.0s ave=0.044ms Set State : n=7 tot=0.0s ave=0.104ms
This is probably going to be quite useful in general! The TX call-backs don't seem to be significant here. (oh, I should probably implement a reset of the values too).
//.ichael
On Sun, 12 May 2024 at 22:58, Michael Geddes <frog@bunyip.wheelycreek.net> wrote:
Yeah - I certainly wasn't going to put a hard limit. Just a log above a certain time, that being said, the idea of just collecting stats (being able to turn it on via a "poller timer" set of commands) would be much more useful. I'll look into that.
Average time is probably a good stat - and certainly what we care about.
I actually am hopeful that those couple of things I did might help reduce that average time quite a bit (that short-cutting the isotp protocol handling especially).
That p/r with logging changes might help reduce the unproductive log time further, but also makes it possible to turn on the poller logging without the RX task logs kicking in.
//.ichael
On Sun, 12 May 2024 at 22:29, Michael Balzer via OvmsDev < ovmsdev@lists.openvehicles.com> wrote:
Warning / gathering debug statistics about slow processing can be helpful, but there must not be a hard limit. Frame/poll response processing may need disk or network I/O, and the vehicle task may be starving from punctual high loads on higher priority tasks (e.g. networking) or by needing to wait for some semaphore -- that's outside the application's control, and must not lead to termination/recreation of the task (in case you're heading towards that direction).
I have no idea how much processing time the current vehicles actually need in their respective worst cases. Your draft is probably too lax, poll responses and frames normally need to be processed much faster. I'd say 10 ms is already too slow, but any wait for a queue/semaphore will already mean at least 10 ms (FreeRTOS tick). Probably best to begin with just collecting stats.
Btw, to help in narrowing down the actual problem case, the profiler could collect max times per RX message ID.
Regards, Michael
Am 12.05.24 um 10:41 schrieb Michael Geddes:
I have a question for Michael B (or whoever) - I have a commit lined up that would add a bit of a time check to the poller loop. What do we expect the maximum time to execute a poller loop command should be? This is a rough idea (in ms) I have.. based on nothing much really, so any ideas would be appreciated: int TardyMaxTime_ms(OvmsPoller::OvmsPollEntryType entry_type) { switch (entry_type) { case OvmsPoller::OvmsPollEntryType::Poll: return 80; case OvmsPoller::OvmsPollEntryType::FrameRx: return 30; case OvmsPoller::OvmsPollEntryType::FrameTx: return 20; case OvmsPoller::OvmsPollEntryType::Command: return 10; case OvmsPoller::OvmsPollEntryType::PollState: return 15; default: return 80; } }
//.ichael
On Mon, 6 May 2024 at 07:45, Michael Geddes < frog@bunyip.wheelycreek.net> wrote:
I realise that I was only using the standard cable to test - which probably is not sufficient - I haven't looked closely at how the Leaf OBD to Db9 cable is different from standard.
Ah, my bad out the queue length. We are definitely queueing more messages though. From my log of when the overflow happened, the poller was in state 0 which means OFF - ie nothing was being sent!!
I'll look at the TX message thing - opt in sounds good - though it shouldn't be playing that much of a part here as the TXs are infrequent in this case (or zero when the leaf is off or driving) - On the ioniq 5 when I'm using the HUD - I'm polling quite frequently - multiple times per second and that seems to be fine!.
I did find an issue with the throttling .. but it would still mostly apply the throttling where it matters, so again, it shouldn't be the problem (also, we aren't transmitting in the leaf case).
The change I made to the logging of RX messages showed how many in a row were dropped... and it was mostly 1 only in a run - which means even if it is a short time between - that means that the drops are being interleaved by at least one success!
Sooo.. I'm still wondering what is going on. Some things I'm going to try:
* If the number of messages on the Can bus (coming in through RX) means that the queue is slowly getting longer and not quite catching up, then making the queue longer will help it last longer... but only pushes the problem down the road. - Add 'current queue length' to the poller status information to see if this is indeed the case? - Add some kind of alert when the queue reaches a % full? * Once you start overflowing and getting overflow log messages, I wonder if this is then contributing to the problem. - Push the overflow logging into Poller Task which can look at how many drops occurred since last received item. * Split up the flags for the poller messages into 2: - Messages that are/could be happening in the TX/RX tasks - Other noisy messages that always happen in the poller task.
Thoughts on what else we might measure to figure out what is going on?
//.ichael
On Sun, 5 May 2024, 19:29 Michael Balzer via OvmsDev, < ovmsdev@lists.openvehicles.com> wrote:
Michael,
the queue size isn't in bytes, it's in messages:
* @param uxQueueLength The maximum number of items that the queue can contain. * * @param uxItemSize The number of bytes each item in the queue will require.
Also, from the time stamps in Dereks log excerpt, there were quite some dropped frames in that time window -- at least 23 frames in 40 ms, that's bad.
Queue sizes are currently:
CONFIG_OVMS_HW_CAN_RX_QUEUE_SIZE=60 CONFIG_OVMS_VEHICLE_CAN_RX_QUEUE_SIZE=60
The new poller now channels all TX callbacks through the task queue additionally to RX and commands. So setting the queue size to be larger than the CAN RX queue size seems appropriate.
Nevertheless, an overflow with more than 60 waiting messages still indicates some too long processing time in the vehicle task.
TX callbacks previously were done directly in the CAN context, and no current vehicle overrides the empty default handler, so this imposed almost no additional overhead. By requiring a queue entry for each TX callback, this feature now has a potentially high impact for all vehicles. If passing these to the task is actually necessary, it needs to become an opt-in feature, so only vehicles subscribing to the callback actually need to cope with that additional load & potential processing delays involved.
Regards, Michael
-- Michael Balzer * Helkenberger Weg 9 * D-58256 Ennepetal Fon 02333 / 833 5735 * Handy 0176 / 206 989 26
_______________________________________________ OvmsDev mailing list OvmsDev@lists.openvehicles.com http://lists.openvehicles.com/mailman/listinfo/ovmsdev
_______________________________________________ OvmsDev mailing listOvmsDev@lists.openvehicles.comhttp://lists.openvehicles.com/mailman/listinfo/ovmsdev
-- Michael Balzer * Helkenberger Weg 9 * D-58256 Ennepetal Fon 02333 / 833 5735 * Handy 0176 / 206 989 26
_______________________________________________ OvmsDev mailing list OvmsDev@lists.openvehicles.com http://lists.openvehicles.com/mailman/listinfo/ovmsdev
You did say max/pead value. I also halved the N for both. I'm not sure whether the 'max' should be the maximum of the smoothed value.. or the maximum of the raw value. This is currently the raw-value maximum. The problem is that the middle column is the maximum of the {{sum over 10s} / (10*1000,000) I could easily change the 'period' to 1s and see how that goes.. was just trying to reduce the larger calculations. Usage: poller [pause|resume|status|times|trace] OVMS# poller time status Poller timing is: on Type | Count | Ave time | Ave length | per s | ms per s | ms -------------+----------+-----------+----------- Poll:PRI | 1.00| 0.559| 0.543 peak | | 0.663| 1.528 -------------+----------+-----------+----------- Poll:SRX | 0.08| 0.009| 0.038 peak | | 0.068| 0.146 -------------+----------+-----------+----------- CAN1 RX[778] | 0.11| 0.061| 0.280 peak | | 0.458| 1.046 -------------+----------+-----------+----------- CAN1 RX[7a8] | 0.04| 0.024| 0.124 peak | | 0.160| 0.615 -------------+----------+-----------+----------- CAN1 TX[770] | 0.05| 0.004| 0.016 peak | | 0.022| 0.102 -------------+----------+-----------+----------- CAN1 TX[7a0] | 0.02| 0.002| 0.011 peak | | 0.010| 0.098 -------------+----------+-----------+----------- CAN1 TX[7b3] | 0.01| 0.001| 0.006 peak | | 0.000| 0.099 -------------+----------+-----------+----------- CAN1 TX[7e2] | 0.02| 0.002| 0.011 peak | | 0.010| 0.099 -------------+----------+-----------+----------- CAN1 TX[7e4] | 0.08| 0.008| 0.048 peak | | 0.049| 0.107 -------------+----------+-----------+----------- Cmd:State | 0.00| 0.000| 0.005 peak | | 0.000| 0.094 On Fri, 17 May 2024 at 15:26, Michael Geddes <frog@bunyip.wheelycreek.net> wrote:
This is what I have now. The one on the end is the one MIchael B was after using an N of 32. (up for discussion).
The middle is the time spent in that even t per second. It accumulates times (in microseconds), and then every 10s it stores it as smoothed (N=16) value. The Count is similar (except that we store a value of '100' as 1 event so it can be still integers and has 2 decimal places).
Every received poll does a 64bit difference to 32bit (for the elapsed time) and 64bit comparison (for end-of-period). It also does 1x 32bit smoothing and 2x 32bit adds.
Then at the end of a 10s period, it will do a 64bit add to get the next end-of-period value, as well as the 2x 32bit smoothing calcs.
This is from the Ioniq 5 so not any big values yet. You can certainly see how insignificant the TX callbacks are. I'll leave it on for when the car is moving and gets some faster polling.
OVMS# poll time status Poller timing is: on Type | Count | Ave time | Ave Length | per s | ms per s | ms -------------+----------+-----------+----------- Poll:PRI | 1.00| 0.540| 0.539 Poll:SRX | 0.03| 0.004| 0.017 CAN1 RX[778] | 0.06| 0.042| 0.175 CAN1 TX[770] | 0.04| 0.002| 0.008 Cmd:State | 0.01| 0.001| 0.005
----------------------8<--------------------------------
Nice smoothing class (forces N as a power of 2): constexpr unsigned floorlog2(unsigned x) { return x == 1 ? 0 : 1+floorlog2(x >> 1); } /* Maintain a smoothed average using shifts for division. * T should be an integer type * N needs to be a power of 2 */ template <typename T, unsigned N> class average_util_t { private: T m_ave; public: average_util_t() : m_ave(0) {} static const uint8_t _BITS = floorlog2(N); void add( T val) { static_assert(N == (1 << _BITS), "N must be a power of 2"); m_ave = (((N-1) * m_ave) + val) >> _BITS; } T get() { return m_ave; } operator T() { return m_ave; } };
On Thu, 16 May 2024 at 10:29, Michael Geddes <frog@bunyip.wheelycreek.net> wrote:
Thanks Michael,
My calculations give me ((2^32)-1) / (1000*1000*3600) = only 1.2 hours of processing time in 32bit. The initial subtraction is 64bit anyway and I can't see a further 64bit addition being a problem. I have the calculations being performed in doubles at print-out where performance is not really an issue anyway. (Though apparently doing 64 bit division is worse than floating point).
In addition * I currently have this being able to be turned on and off and reset manually (only do it when required).
* For the lower volume commands, the smoothed average is not going to be useful - the count is more interesting for different reasons.
* The total time is quite useful. Ie a high average time doesn't matter if the count is low. The things that are affecting performance are stuff with high total time. Stuff which is happening 100 times a second needs to be a much lower average than once a second.
* A measure like 'time per minute/second' and possibly count per minute/seconds as a smoothed average would potentially be more useful. (or in addition?) I think we could do _that_ in a reasonably efficient manner using a 64 bit 'last measured time', a 32 bit accumulated value and the stored 32 bit rolling average. It would boils down to some iterative (integer) sums and multiplications plus a divide by n ^ (time periods passed) - which is a shift - and which can be optimised to '0' if 'time-periods-passed' is more than 32/(bits-per-n) - effectively limiting the number of iterations. The one issue I can see is that we need to calculate 'number of time-periods passed' which is a 64 bit subtraction followed by a 32 bit division (not optimisable to a simple shift).
* I'm also happy to keep a rolling (32bit) average time. Even if you assume averages in the 100ms, 32bit is going to happily support an N of 64 or even 128. Am I right in thinking that the choice of N is highly dependent on frequency. For things happening 100 times per second, you might want an N like 128.. where things happening once per second, you might want an N of 4 or 8. The other things we keep track of in this manner we have a better idea of the frequency of the thing.
How about we have (per record type): * total count (since last reset?) (32 bit) * smoothed average of time per instance (32 bit)
* ?xx? total accumulated time since last reset (64bit) ?? <-- with the below stats this is much less useful
* last-measured-time (64 bit) * accumulated count since last time-period (16bit - but maybe 32bit anyway for byte alignment?) * smoothed average of count per time-period (32bit) * accumulated time since last time-period (32bit) * smoothed average of time per time-period (32bit)
It's possible to keep the
Is this going to be too much per record type? The number of 'records' we are keeping is quite low (so 10 to 20 maybe) - so it's not a huge memory burden.
Thoughts?
//.ichael On Thu, 16 May 2024 at 03:09, Michael Balzer via OvmsDev < ovmsdev@lists.openvehicles.com> wrote:
esp_timer_get_time() is the right choice for precision timing.
I'd say uint32 is enough though, even if counting microseconds that can hold a total of more than 71 hours of actual processing time. uint64 has a significant performance penalty, although I don't recall the overhead for simple additions.
Also & more important, the average wouldn't be my main focus, but the maximum processing time seen per ID, which seems to be missing in your draft.
Second thought on the average… the exact overall average really has a minor meaning, I'd rather see the current average, adapting to the current mode of operation (drive/charge/…). I suggest feeding the measurements to a low pass filter to get the smoothed average of the last n measurements. Pattern:
runavg = ((N-1) * runavg + newval) / N
By using a low power of 2 for N (e.g. 8 or 16), you can replace the division by a simple bit shift, and have enough headroom to use 32 bit integers.
Regards, Michael
Am 15.05.24 um 06:51 schrieb Michael Geddes via OvmsDev:
Formatting aside, I have implemented what I think Michael B was suggesting. This is a sample run on the Ioniq 5 (which doesn't have unsolicited RX events).
This uses the call esp_timer_get_time() got get a 64bit *microseconds* since started value - and works out the time to execute that way. It's looking at absolute time and not time in the Task - so other things going on at the same time in other tasks will have an effect. (The normal tick count doesn't have nearly enough resolution to be useful - any other ideas on measurement?) I've got total accumulated time displaying in seconds and the average in milliseconds currently - but I can change that easy enough. The cumulative time is stored as uint64_t which will be plenty, as 32bit wouldn't be nearly enough.
OVMS# *poller time on* Poller timing is now on
OVMS# *poller time status* Poller timing is: on Poll [PRI] : n=390 tot=0.2s ave=0.586ms Poll [SRX] : n=316 tot=0.1s ave=0.196ms CAN1 RX[0778] : n=382 tot=0.2s ave=0.615ms CAN1 RX[07a8] : n=48 tot=0.0s ave=0.510ms CAN1 RX[07bb] : n=162 tot=0.1s ave=0.519ms CAN1 RX[07ce] : n=33 tot=0.0s ave=0.469ms CAN1 RX[07ea] : n=408 tot=0.2s ave=0.467ms CAN1 RX[07ec] : n=486 tot=0.2s ave=0.477ms CAN3 RX[07df] : n=769 tot=0.2s ave=0.261ms CAN1 TX[0770] : n=191 tot=0.0s ave=0.054ms CAN1 TX[07a0] : n=16 tot=0.0s ave=0.047ms CAN1 TX[07b3] : n=31 tot=0.0s ave=0.069ms CAN1 TX[07c6] : n=11 tot=0.0s ave=0.044ms CAN1 TX[07e2] : n=82 tot=0.0s ave=0.067ms CAN1 TX[07e4] : n=54 tot=0.0s ave=0.044ms Set State : n=7 tot=0.0s ave=0.104ms
This is probably going to be quite useful in general! The TX call-backs don't seem to be significant here. (oh, I should probably implement a reset of the values too).
//.ichael
On Sun, 12 May 2024 at 22:58, Michael Geddes < frog@bunyip.wheelycreek.net> wrote:
Yeah - I certainly wasn't going to put a hard limit. Just a log above a certain time, that being said, the idea of just collecting stats (being able to turn it on via a "poller timer" set of commands) would be much more useful. I'll look into that.
Average time is probably a good stat - and certainly what we care about.
I actually am hopeful that those couple of things I did might help reduce that average time quite a bit (that short-cutting the isotp protocol handling especially).
That p/r with logging changes might help reduce the unproductive log time further, but also makes it possible to turn on the poller logging without the RX task logs kicking in.
//.ichael
On Sun, 12 May 2024 at 22:29, Michael Balzer via OvmsDev < ovmsdev@lists.openvehicles.com> wrote:
Warning / gathering debug statistics about slow processing can be helpful, but there must not be a hard limit. Frame/poll response processing may need disk or network I/O, and the vehicle task may be starving from punctual high loads on higher priority tasks (e.g. networking) or by needing to wait for some semaphore -- that's outside the application's control, and must not lead to termination/recreation of the task (in case you're heading towards that direction).
I have no idea how much processing time the current vehicles actually need in their respective worst cases. Your draft is probably too lax, poll responses and frames normally need to be processed much faster. I'd say 10 ms is already too slow, but any wait for a queue/semaphore will already mean at least 10 ms (FreeRTOS tick). Probably best to begin with just collecting stats.
Btw, to help in narrowing down the actual problem case, the profiler could collect max times per RX message ID.
Regards, Michael
Am 12.05.24 um 10:41 schrieb Michael Geddes:
I have a question for Michael B (or whoever) - I have a commit lined up that would add a bit of a time check to the poller loop. What do we expect the maximum time to execute a poller loop command should be? This is a rough idea (in ms) I have.. based on nothing much really, so any ideas would be appreciated: int TardyMaxTime_ms(OvmsPoller::OvmsPollEntryType entry_type) { switch (entry_type) { case OvmsPoller::OvmsPollEntryType::Poll: return 80; case OvmsPoller::OvmsPollEntryType::FrameRx: return 30; case OvmsPoller::OvmsPollEntryType::FrameTx: return 20; case OvmsPoller::OvmsPollEntryType::Command: return 10; case OvmsPoller::OvmsPollEntryType::PollState: return 15; default: return 80; } }
//.ichael
On Mon, 6 May 2024 at 07:45, Michael Geddes < frog@bunyip.wheelycreek.net> wrote:
I realise that I was only using the standard cable to test - which probably is not sufficient - I haven't looked closely at how the Leaf OBD to Db9 cable is different from standard.
Ah, my bad out the queue length. We are definitely queueing more messages though. From my log of when the overflow happened, the poller was in state 0 which means OFF - ie nothing was being sent!!
I'll look at the TX message thing - opt in sounds good - though it shouldn't be playing that much of a part here as the TXs are infrequent in this case (or zero when the leaf is off or driving) - On the ioniq 5 when I'm using the HUD - I'm polling quite frequently - multiple times per second and that seems to be fine!.
I did find an issue with the throttling .. but it would still mostly apply the throttling where it matters, so again, it shouldn't be the problem (also, we aren't transmitting in the leaf case).
The change I made to the logging of RX messages showed how many in a row were dropped... and it was mostly 1 only in a run - which means even if it is a short time between - that means that the drops are being interleaved by at least one success!
Sooo.. I'm still wondering what is going on. Some things I'm going to try:
* If the number of messages on the Can bus (coming in through RX) means that the queue is slowly getting longer and not quite catching up, then making the queue longer will help it last longer... but only pushes the problem down the road. - Add 'current queue length' to the poller status information to see if this is indeed the case? - Add some kind of alert when the queue reaches a % full? * Once you start overflowing and getting overflow log messages, I wonder if this is then contributing to the problem. - Push the overflow logging into Poller Task which can look at how many drops occurred since last received item. * Split up the flags for the poller messages into 2: - Messages that are/could be happening in the TX/RX tasks - Other noisy messages that always happen in the poller task.
Thoughts on what else we might measure to figure out what is going on?
//.ichael
On Sun, 5 May 2024, 19:29 Michael Balzer via OvmsDev, < ovmsdev@lists.openvehicles.com> wrote:
> Michael, > > the queue size isn't in bytes, it's in messages: > > * @param uxQueueLength The maximum number of items that the queue > can contain. > * > * @param uxItemSize The number of bytes each item in the queue will > require. > > > Also, from the time stamps in Dereks log excerpt, there were quite > some dropped frames in that time window -- at least 23 frames in 40 ms, > that's bad. > > Queue sizes are currently: > > CONFIG_OVMS_HW_CAN_RX_QUEUE_SIZE=60 > CONFIG_OVMS_VEHICLE_CAN_RX_QUEUE_SIZE=60 > > The new poller now channels all TX callbacks through the task queue > additionally to RX and commands. So setting the queue size to be larger > than the CAN RX queue size seems appropriate. > > Nevertheless, an overflow with more than 60 waiting messages still > indicates some too long processing time in the vehicle task. > > TX callbacks previously were done directly in the CAN context, and > no current vehicle overrides the empty default handler, so this imposed > almost no additional overhead. By requiring a queue entry for each TX > callback, this feature now has a potentially high impact for all vehicles. > If passing these to the task is actually necessary, it needs to become an > opt-in feature, so only vehicles subscribing to the callback actually need > to cope with that additional load & potential processing delays involved. > > Regards, > Michael > > -- Michael Balzer * Helkenberger Weg 9 * D-58256 Ennepetal Fon 02333 / 833 5735 * Handy 0176 / 206 989 26
_______________________________________________ OvmsDev mailing list OvmsDev@lists.openvehicles.com http://lists.openvehicles.com/mailman/listinfo/ovmsdev
_______________________________________________ OvmsDev mailing listOvmsDev@lists.openvehicles.comhttp://lists.openvehicles.com/mailman/listinfo/ovmsdev
-- Michael Balzer * Helkenberger Weg 9 * D-58256 Ennepetal Fon 02333 / 833 5735 * Handy 0176 / 206 989 26
_______________________________________________ OvmsDev mailing list OvmsDev@lists.openvehicles.com http://lists.openvehicles.com/mailman/listinfo/ovmsdev
I'm not sure whether the 'max' should be the maximum of the smoothed value.. or the maximum of the raw value.
It should normally be the maximum of the raw value I think, the maximum of the smoothed value cannot tell about how bad the processing of an ID can become. The naming in the table is a bit confusing I think. (besides: I've never seen "ave" as the abbreviation for average) If I understand you correctly, "time ms per s" is the time share in per mille, so something in that direction would be more clear, and "length ms" would then be "time [ms]". The totals for all averages in the table foot would also be nice. Maybe "Ave" (or avg?) also should be placed on the left, as the "peak" label now suggests being the peak of the average. Btw, keep in mind, not all "edge" users / testers are developers (e.g. the Twizy driver I'm in contact with), collecting stats feedback for vehicles from testers should be straight forward. Maybe add a data/history record, sent automatically on every drive/charge stop when the poller tracing is on? Regards, Michael Am 18.05.24 um 02:28 schrieb Michael Geddes:
You did say max/pead value. I also halved the N for both. I'm not sure whether the 'max' should be the maximum of the smoothed value.. or the maximum of the raw value. This is currently the raw-value maximum. The problem is that the middle column is the maximum of the {{sum over 10s} / (10*1000,000) I could easily change the 'period' to 1s and see how that goes.. was just trying to reduce the larger calculations.
Usage: poller [pause|resume|status|times|trace]
OVMS# poller time status Poller timing is: on Type | Count | Ave time | Ave length | per s | ms per s | ms -------------+----------+-----------+----------- Poll:PRI | 1.00| 0.559| 0.543 peak | | 0.663| 1.528 -------------+----------+-----------+----------- Poll:SRX | 0.08| 0.009| 0.038 peak | | 0.068| 0.146 -------------+----------+-----------+----------- CAN1 RX[778] | 0.11| 0.061| 0.280 peak | | 0.458| 1.046 -------------+----------+-----------+----------- CAN1 RX[7a8] | 0.04| 0.024| 0.124 peak | | 0.160| 0.615 -------------+----------+-----------+----------- CAN1 TX[770] | 0.05| 0.004| 0.016 peak | | 0.022| 0.102 -------------+----------+-----------+----------- CAN1 TX[7a0] | 0.02| 0.002| 0.011 peak | | 0.010| 0.098 -------------+----------+-----------+----------- CAN1 TX[7b3] | 0.01| 0.001| 0.006 peak | | 0.000| 0.099 -------------+----------+-----------+----------- CAN1 TX[7e2] | 0.02| 0.002| 0.011 peak | | 0.010| 0.099 -------------+----------+-----------+----------- CAN1 TX[7e4] | 0.08| 0.008| 0.048 peak | | 0.049| 0.107 -------------+----------+-----------+----------- Cmd:State | 0.00| 0.000| 0.005 peak | | 0.000| 0.094
On Fri, 17 May 2024 at 15:26, Michael Geddes <frog@bunyip.wheelycreek.net> wrote:
This is what I have now. The one on the end is the one MIchael B was after using an N of 32. (up for discussion).
The middle is the time spent in that even t per second. It accumulates times (in microseconds), and then every 10s it stores it as smoothed (N=16) value. The Count is similar (except that we store a value of '100' as 1 event so it can be still integers and has 2 decimal places).
Every received poll does a 64bit difference to 32bit (for the elapsed time) and 64bit comparison (for end-of-period). It also does 1x 32bit smoothing and 2x 32bit adds.
Then at the end of a 10s period, it will do a 64bit add to get the next end-of-period value, as well as the 2x 32bit smoothing calcs.
This is from the Ioniq 5 so not any big values yet. You can certainly see how insignificant the TX callbacks are. I'll leave it on for when the car is moving and gets some faster polling.
OVMS# poll time status Poller timing is: on Type | Count | Ave time | Ave Length | per s | ms per s | ms -------------+----------+-----------+----------- Poll:PRI | 1.00| 0.540| 0.539 Poll:SRX | 0.03| 0.004| 0.017 CAN1 RX[778] | 0.06| 0.042| 0.175 CAN1 TX[770] | 0.04| 0.002| 0.008 Cmd:State | 0.01| 0.001| 0.005
----------------------8<--------------------------------
Nice smoothing class (forces N as a power of 2): constexpr unsigned floorlog2(unsigned x) { return x == 1 ? 0 : 1+floorlog2(x >> 1); } /* Maintain a smoothed average using shifts for division. * T should be an integer type * N needs to be a power of 2 */ template <typename T, unsigned N> class average_util_t { private: T m_ave; public: average_util_t() : m_ave(0) {} static const uint8_t _BITS = floorlog2(N); void add( T val) { static_assert(N == (1 << _BITS), "N must be a power of 2"); m_ave = (((N-1) * m_ave) + val) >> _BITS; } T get() { return m_ave; } operator T() { return m_ave; } };
On Thu, 16 May 2024 at 10:29, Michael Geddes <frog@bunyip.wheelycreek.net> wrote:
Thanks Michael,
My calculations give me ((2^32)-1) / (1000*1000*3600) = only 1.2 hours of processing time in 32bit. The initial subtraction is 64bit anyway and I can't see a further 64bit addition being a problem. I have the calculations being performed in doubles at print-out where performance is not really an issue anyway. (Though apparently doing 64 bit division is worse than floating point).
In addition * I currently have this being able to be turned on and off and reset manually (only do it when required).
* For the lower volume commands, the smoothed average is not going to be useful - the count is more interesting for different reasons.
* The total time is quite useful. Ie a high average time doesn't matter if the count is low. The things that are affecting performance are stuff with high total time. Stuff which is happening 100 times a second needs to be a much lower average than once a second.
* A measure like 'time per minute/second' and possibly count per minute/seconds as a smoothed average would potentially be more useful. (or in addition?) I think we could do _that_ in a reasonably efficient manner using a 64 bit 'last measured time', a 32 bit accumulated value and the stored 32 bit rolling average. It would boils down to some iterative (integer) sums and multiplications plus a divide by n ^ (time periods passed) - which is a shift - and which can be optimised to '0' if 'time-periods-passed' is more than 32/(bits-per-n) - effectively limiting the number of iterations. The one issue I can see is that we need to calculate 'number of time-periods passed' which is a 64 bit subtraction followed by a 32 bit division (not optimisable to a simple shift).
* I'm also happy to keep a rolling (32bit) average time. Even if you assume averages in the 100ms, 32bit is going to happily support an N of 64 or even 128. Am I right in thinking that the choice of N is highly dependent on frequency. For things happening 100 times per second, you might want an N like 128.. where things happening once per second, you might want an N of 4 or 8. The other things we keep track of in this manner we have a better idea of the frequency of the thing.
How about we have (per record type): * total count (since last reset?) (32 bit) * smoothed average of time per instance (32 bit)
* ?xx? total accumulated time since last reset (64bit) ?? <-- with the below stats this is much less useful
* last-measured-time (64 bit) * accumulated count since last time-period (16bit - but maybe 32bit anyway for byte alignment?) * smoothed average of count per time-period (32bit) * accumulated time since last time-period (32bit) * smoothed average of time per time-period (32bit)
It's possible to keep the
Is this going to be too much per record type? The number of 'records' we are keeping is quite low (so 10 to 20 maybe) - so it's not a huge memory burden.
Thoughts?
//.ichael On Thu, 16 May 2024 at 03:09, Michael Balzer via OvmsDev <ovmsdev@lists.openvehicles.com> wrote:
esp_timer_get_time() is the right choice for precision timing.
I'd say uint32 is enough though, even if counting microseconds that can hold a total of more than 71 hours of actual processing time. uint64 has a significant performance penalty, although I don't recall the overhead for simple additions.
Also & more important, the average wouldn't be my main focus, but the maximum processing time seen per ID, which seems to be missing in your draft.
Second thought on the average… the exact overall average really has a minor meaning, I'd rather see the current average, adapting to the current mode of operation (drive/charge/…). I suggest feeding the measurements to a low pass filter to get the smoothed average of the last n measurements. Pattern:
runavg = ((N-1) * runavg + newval) / N
By using a low power of 2 for N (e.g. 8 or 16), you can replace the division by a simple bit shift, and have enough headroom to use 32 bit integers.
Regards, Michael
Am 15.05.24 um 06:51 schrieb Michael Geddes via OvmsDev:
Formatting aside, I have implemented what I think Michael B was suggesting. This is a sample run on the Ioniq 5 (which doesn't have unsolicited RX events).
This uses the call esp_timer_get_time() got get a 64bit *microseconds* since started value - and works out the time to execute that way. It's looking at absolute time and not time in the Task - so other things going on at the same time in other tasks will have an effect. (The normal tick count doesn't have nearly enough resolution to be useful - any other ideas on measurement?) I've got total accumulated time displaying in seconds and the average in milliseconds currently - but I can change that easy enough. The cumulative time is stored as uint64_t which will be plenty, as 32bit wouldn't be nearly enough.
OVMS# *poller time on* Poller timing is now on
OVMS# *poller time status* Poller timing is: on Poll [PRI] : n=390 tot=0.2s ave=0.586ms Poll [SRX] : n=316 tot=0.1s ave=0.196ms CAN1 RX[0778] : n=382 tot=0.2s ave=0.615ms CAN1 RX[07a8] : n=48 tot=0.0s ave=0.510ms CAN1 RX[07bb] : n=162 tot=0.1s ave=0.519ms CAN1 RX[07ce] : n=33 tot=0.0s ave=0.469ms CAN1 RX[07ea] : n=408 tot=0.2s ave=0.467ms CAN1 RX[07ec] : n=486 tot=0.2s ave=0.477ms CAN3 RX[07df] : n=769 tot=0.2s ave=0.261ms CAN1 TX[0770] : n=191 tot=0.0s ave=0.054ms CAN1 TX[07a0] : n=16 tot=0.0s ave=0.047ms CAN1 TX[07b3] : n=31 tot=0.0s ave=0.069ms CAN1 TX[07c6] : n=11 tot=0.0s ave=0.044ms CAN1 TX[07e2] : n=82 tot=0.0s ave=0.067ms CAN1 TX[07e4] : n=54 tot=0.0s ave=0.044ms Set State : n=7 tot=0.0s ave=0.104ms
This is probably going to be quite useful in general! The TX call-backs don't seem to be significant here. (oh, I should probably implement a reset of the values too).
//.ichael
On Sun, 12 May 2024 at 22:58, Michael Geddes <frog@bunyip.wheelycreek.net> wrote:
Yeah - I certainly wasn't going to put a hard limit. Just a log above a certain time, that being said, the idea of just collecting stats (being able to turn it on via a "poller timer" set of commands) would be much more useful. I'll look into that.
Average time is probably a good stat - and certainly what we care about.
I actually am hopeful that those couple of things I did might help reduce that average time quite a bit (that short-cutting the isotp protocol handling especially).
That p/r with logging changes might help reduce the unproductive log time further, but also makes it possible to turn on the poller logging without the RX task logs kicking in.
//.ichael
On Sun, 12 May 2024 at 22:29, Michael Balzer via OvmsDev <ovmsdev@lists.openvehicles.com> wrote:
Warning / gathering debug statistics about slow processing can be helpful, but there must not be a hard limit. Frame/poll response processing may need disk or network I/O, and the vehicle task may be starving from punctual high loads on higher priority tasks (e.g. networking) or by needing to wait for some semaphore -- that's outside the application's control, and must not lead to termination/recreation of the task (in case you're heading towards that direction).
I have no idea how much processing time the current vehicles actually need in their respective worst cases. Your draft is probably too lax, poll responses and frames normally need to be processed much faster. I'd say 10 ms is already too slow, but any wait for a queue/semaphore will already mean at least 10 ms (FreeRTOS tick). Probably best to begin with just collecting stats.
Btw, to help in narrowing down the actual problem case, the profiler could collect max times per RX message ID.
Regards, Michael
Am 12.05.24 um 10:41 schrieb Michael Geddes:
I have a question for Michael B (or whoever) - I have a commit lined up that would add a bit of a time check to the poller loop. What do we expect the maximum time to execute a poller loop command should be? This is a rough idea (in ms) I have.. based on nothing much really, so any ideas would be appreciated: int TardyMaxTime_ms(OvmsPoller::OvmsPollEntryType entry_type) { switch (entry_type) { case OvmsPoller::OvmsPollEntryType::Poll: return 80; case OvmsPoller::OvmsPollEntryType::FrameRx: return 30; case OvmsPoller::OvmsPollEntryType::FrameTx: return 20; case OvmsPoller::OvmsPollEntryType::Command: return 10; case OvmsPoller::OvmsPollEntryType::PollState: return 15; default: return 80; } }
//.ichael
On Mon, 6 May 2024 at 07:45, Michael Geddes <frog@bunyip.wheelycreek.net> wrote:
I realise that I was only using the standard cable to test - which probably is not sufficient - I haven't looked closely at how the Leaf OBD to Db9 cable is different from standard.
Ah, my bad out the queue length. We are definitely queueing more messages though. From my log of when the overflow happened, the poller was in state 0 which means OFF - ie nothing was being sent!!
I'll look at the TX message thing - opt in sounds good - though it shouldn't be playing that much of a part here as the TXs are infrequent in this case (or zero when the leaf is off or driving) - On the ioniq 5 when I'm using the HUD - I'm polling quite frequently - multiple times per second and that seems to be fine!.
I did find an issue with the throttling .. but it would still mostly apply the throttling where it matters, so again, it shouldn't be the problem (also, we aren't transmitting in the leaf case).
The change I made to the logging of RX messages showed how many in a row were dropped... and it was mostly 1 only in a run - which means even if it is a short time between - that means that the drops are being interleaved by at least one success!
Sooo.. I'm still wondering what is going on. Some things I'm going to try:
* If the number of messages on the Can bus (coming in through RX) means that the queue is slowly getting longer and not quite catching up, then making the queue longer will help it last longer... but only pushes the problem down the road. - Add 'current queue length' to the poller status information to see if this is indeed the case? - Add some kind of alert when the queue reaches a % full? * Once you start overflowing and getting overflow log messages, I wonder if this is then contributing to the problem. - Push the overflow logging into Poller Task which can look at how many drops occurred since last received item. * Split up the flags for the poller messages into 2: - Messages that are/could be happening in the TX/RX tasks - Other noisy messages that always happen in the poller task.
Thoughts on what else we might measure to figure out what is going on?
//.ichael
On Sun, 5 May 2024, 19:29 Michael Balzer via OvmsDev, <ovmsdev@lists.openvehicles.com> wrote:
Michael,
the queue size isn't in bytes, it's in messages:
* @param uxQueueLength The maximum number of items that the queue can contain. * * @param uxItemSize The number of bytes each item in the queue will require.
Also, from the time stamps in Dereks log excerpt, there were quite some dropped frames in that time window -- at least 23 frames in 40 ms, that's bad.
Queue sizes are currently:
CONFIG_OVMS_HW_CAN_RX_QUEUE_SIZE=60 CONFIG_OVMS_VEHICLE_CAN_RX_QUEUE_SIZE=60
The new poller now channels all TX callbacks through the task queue additionally to RX and commands. So setting the queue size to be larger than the CAN RX queue size seems appropriate.
Nevertheless, an overflow with more than 60 waiting messages still indicates some too long processing time in the vehicle task.
TX callbacks previously were done directly in the CAN context, and no current vehicle overrides the empty default handler, so this imposed almost no additional overhead. By requiring a queue entry for each TX callback, this feature now has a potentially high impact for all vehicles. If passing these to the task is actually necessary, it needs to become an opt-in feature, so only vehicles subscribing to the callback actually need to cope with that additional load & potential processing delays involved.
Regards, Michael
-- Michael Balzer * Helkenberger Weg 9 * D-58256 Ennepetal Fon 02333 / 833 5735 * Handy 0176 / 206 989 26
_______________________________________________ OvmsDev mailing list OvmsDev@lists.openvehicles.com http://lists.openvehicles.com/mailman/listinfo/ovmsdev
_______________________________________________ OvmsDev mailing list OvmsDev@lists.openvehicles.com http://lists.openvehicles.com/mailman/listinfo/ovmsdev
-- Michael Balzer * Helkenberger Weg 9 * D-58256 Ennepetal Fon 02333 / 833 5735 * Handy 0176 / 206 989 26
_______________________________________________ OvmsDev mailing list OvmsDev@lists.openvehicles.com http://lists.openvehicles.com/mailman/listinfo/ovmsdev
-- Michael Balzer * Helkenberger Weg 9 * D-58256 Ennepetal Fon 02333 / 833 5735 * Handy 0176 / 206 989 26
I was so focused on how I calculated the value that I totally missed that ‰ would be a better description. I could also use the system 'Ratio' unit... so % or ‰. I'll make space to put 'Avg' on the row. Was trying to limit the width for output on a mobile. I agree it would make it easier to understand. Totals also makes sense. Should I make this a configuration that can be set on the web-page? I'd probably use a configuration change notification so that the very bit setting is sync'd with the 'configuration' value. //.ichael On Sat, 18 May 2024, 14:05 Michael Balzer, <dexter@expeedo.de> wrote:
I'm not sure whether the 'max' should be the maximum of the smoothed value.. or the maximum of the raw value.
It should normally be the maximum of the raw value I think, the maximum of the smoothed value cannot tell about how bad the processing of an ID can become.
The naming in the table is a bit confusing I think. (besides: I've never seen "ave" as the abbreviation for average)
If I understand you correctly, "time ms per s" is the time share in per mille, so something in that direction would be more clear, and "length ms" would then be "time [ms]".
The totals for all averages in the table foot would also be nice.
Maybe "Ave" (or avg?) also should be placed on the left, as the "peak" label now suggests being the peak of the average.
Btw, keep in mind, not all "edge" users / testers are developers (e.g. the Twizy driver I'm in contact with), collecting stats feedback for vehicles from testers should be straight forward. Maybe add a data/history record, sent automatically on every drive/charge stop when the poller tracing is on?
Regards, Michael
Am 18.05.24 um 02:28 schrieb Michael Geddes:
You did say max/pead value. I also halved the N for both. I'm not sure whether the 'max' should be the maximum of the smoothed value.. or the maximum of the raw value. This is currently the raw-value maximum. The problem is that the middle column is the maximum of the {{sum over 10s} / (10*1000,000) I could easily change the 'period' to 1s and see how that goes.. was just trying to reduce the larger calculations.
Usage: poller [pause|resume|status|times|trace]
OVMS# poller time status Poller timing is: on Type | Count | Ave time | Ave length | per s | ms per s | ms -------------+----------+-----------+----------- Poll:PRI | 1.00| 0.559| 0.543 peak | | 0.663| 1.528 -------------+----------+-----------+----------- Poll:SRX | 0.08| 0.009| 0.038 peak | | 0.068| 0.146 -------------+----------+-----------+----------- CAN1 RX[778] | 0.11| 0.061| 0.280 peak | | 0.458| 1.046 -------------+----------+-----------+----------- CAN1 RX[7a8] | 0.04| 0.024| 0.124 peak | | 0.160| 0.615 -------------+----------+-----------+----------- CAN1 TX[770] | 0.05| 0.004| 0.016 peak | | 0.022| 0.102 -------------+----------+-----------+----------- CAN1 TX[7a0] | 0.02| 0.002| 0.011 peak | | 0.010| 0.098 -------------+----------+-----------+----------- CAN1 TX[7b3] | 0.01| 0.001| 0.006 peak | | 0.000| 0.099 -------------+----------+-----------+----------- CAN1 TX[7e2] | 0.02| 0.002| 0.011 peak | | 0.010| 0.099 -------------+----------+-----------+----------- CAN1 TX[7e4] | 0.08| 0.008| 0.048 peak | | 0.049| 0.107 -------------+----------+-----------+----------- Cmd:State | 0.00| 0.000| 0.005 peak | | 0.000| 0.094
On Fri, 17 May 2024 at 15:26, Michael Geddes <frog@bunyip.wheelycreek.net> wrote:
This is what I have now. The one on the end is the one MIchael B was after using an N of 32. (up for discussion).
The middle is the time spent in that even t per second. It accumulates times (in microseconds), and then every 10s it stores it as smoothed (N=16) value. The Count is similar (except that we store a value of '100' as 1 event so it can be still integers and has 2 decimal places).
Every received poll does a 64bit difference to 32bit (for the elapsed time) and 64bit comparison (for end-of-period). It also does 1x 32bit smoothing and 2x 32bit adds.
Then at the end of a 10s period, it will do a 64bit add to get the next end-of-period value, as well as the 2x 32bit smoothing calcs.
This is from the Ioniq 5 so not any big values yet. You can certainly see how insignificant the TX callbacks are. I'll leave it on for when the car is moving and gets some faster polling.
OVMS# poll time status Poller timing is: on Type | Count | Ave time | Ave Length | per s | ms per s | ms -------------+----------+-----------+----------- Poll:PRI | 1.00| 0.540| 0.539 Poll:SRX | 0.03| 0.004| 0.017 CAN1 RX[778] | 0.06| 0.042| 0.175 CAN1 TX[770] | 0.04| 0.002| 0.008 Cmd:State | 0.01| 0.001| 0.005
----------------------8<--------------------------------
Nice smoothing class (forces N as a power of 2): constexpr unsigned floorlog2(unsigned x) { return x == 1 ? 0 : 1+floorlog2(x >> 1); } /* Maintain a smoothed average using shifts for division. * T should be an integer type * N needs to be a power of 2 */ template <typename T, unsigned N> class average_util_t { private: T m_ave; public: average_util_t() : m_ave(0) {} static const uint8_t _BITS = floorlog2(N); void add( T val) { static_assert(N == (1 << _BITS), "N must be a power of 2"); m_ave = (((N-1) * m_ave) + val) >> _BITS; } T get() { return m_ave; } operator T() { return m_ave; } };
On Thu, 16 May 2024 at 10:29, Michael Geddes <frog@bunyip.wheelycreek.net> wrote:
Thanks Michael,
My calculations give me ((2^32)-1) / (1000*1000*3600) = only 1.2 hours of processing time in 32bit. The initial subtraction is 64bit anyway and I can't see a further 64bit addition being a problem. I have the calculations being performed in doubles at print-out where performance is not really an issue anyway. (Though apparently doing 64 bit division is worse than floating point).
In addition * I currently have this being able to be turned on and off and reset manually (only do it when required).
* For the lower volume commands, the smoothed average is not going to be useful - the count is more interesting for different reasons.
* The total time is quite useful. Ie a high average time doesn't matter if the count is low. The things that are affecting performance are stuff with high total time. Stuff which is happening 100 times a second needs to be a much lower average than once a second.
* A measure like 'time per minute/second' and possibly count per minute/seconds as a smoothed average would potentially be more useful. (or in addition?) I think we could do _that_ in a reasonably efficient manner using a 64 bit 'last measured time', a 32 bit accumulated value and the stored 32 bit rolling average. It would boils down to some iterative (integer) sums and multiplications plus a divide by n ^ (time periods passed) - which is a shift - and which can be optimised to '0' if 'time-periods-passed' is more than 32/(bits-per-n) - effectively limiting the number of iterations. The one issue I can see is that we need to calculate 'number of time-periods passed' which is a 64 bit subtraction followed by a 32 bit division (not optimisable to a simple shift).
* I'm also happy to keep a rolling (32bit) average time. Even if you assume averages in the 100ms, 32bit is going to happily support an N of 64 or even 128. Am I right in thinking that the choice of N is highly dependent on frequency. For things happening 100 times per second, you might want an N like 128.. where things happening once per second, you might want an N of 4 or 8. The other things we keep track of in this manner we have a better idea of the frequency of the thing.
How about we have (per record type): * total count (since last reset?) (32 bit) * smoothed average of time per instance (32 bit)
* ?xx? total accumulated time since last reset (64bit) ?? <-- with the below stats this is much less useful
* last-measured-time (64 bit) * accumulated count since last time-period (16bit - but maybe 32bit anyway for byte alignment?) * smoothed average of count per time-period (32bit) * accumulated time since last time-period (32bit) * smoothed average of time per time-period (32bit)
It's possible to keep the
Is this going to be too much per record type? The number of 'records' we are keeping is quite low (so 10 to 20 maybe) - so it's not a huge memory burden.
Thoughts?
//.ichael On Thu, 16 May 2024 at 03:09, Michael Balzer via OvmsDev < ovmsdev@lists.openvehicles.com> wrote:
esp_timer_get_time() is the right choice for precision timing.
I'd say uint32 is enough though, even if counting microseconds that can hold a total of more than 71 hours of actual processing time. uint64 has a significant performance penalty, although I don't recall the overhead for simple additions.
Also & more important, the average wouldn't be my main focus, but the maximum processing time seen per ID, which seems to be missing in your draft.
Second thought on the average… the exact overall average really has a minor meaning, I'd rather see the current average, adapting to the current mode of operation (drive/charge/…). I suggest feeding the measurements to a low pass filter to get the smoothed average of the last n measurements. Pattern:
runavg = ((N-1) * runavg + newval) / N
By using a low power of 2 for N (e.g. 8 or 16), you can replace the division by a simple bit shift, and have enough headroom to use 32 bit integers.
Regards, Michael
Am 15.05.24 um 06:51 schrieb Michael Geddes via OvmsDev:
Formatting aside, I have implemented what I think Michael B was suggesting. This is a sample run on the Ioniq 5 (which doesn't have unsolicited RX events).
This uses the call esp_timer_get_time() got get a 64bit *microseconds* since started value - and works out the time to execute that way. It's looking at absolute time and not time in the Task - so other things going on at the same time in other tasks will have an effect. (The normal tick count doesn't have nearly enough resolution to be useful - any other ideas on measurement?) I've got total accumulated time displaying in seconds and the average in milliseconds currently - but I can change that easy enough. The cumulative time is stored as uint64_t which will be plenty, as 32bit wouldn't be nearly enough.
OVMS# *poller time on* Poller timing is now on
OVMS# *poller time status* Poller timing is: on Poll [PRI] : n=390 tot=0.2s ave=0.586ms Poll [SRX] : n=316 tot=0.1s ave=0.196ms CAN1 RX[0778] : n=382 tot=0.2s ave=0.615ms CAN1 RX[07a8] : n=48 tot=0.0s ave=0.510ms CAN1 RX[07bb] : n=162 tot=0.1s ave=0.519ms CAN1 RX[07ce] : n=33 tot=0.0s ave=0.469ms CAN1 RX[07ea] : n=408 tot=0.2s ave=0.467ms CAN1 RX[07ec] : n=486 tot=0.2s ave=0.477ms CAN3 RX[07df] : n=769 tot=0.2s ave=0.261ms CAN1 TX[0770] : n=191 tot=0.0s ave=0.054ms CAN1 TX[07a0] : n=16 tot=0.0s ave=0.047ms CAN1 TX[07b3] : n=31 tot=0.0s ave=0.069ms CAN1 TX[07c6] : n=11 tot=0.0s ave=0.044ms CAN1 TX[07e2] : n=82 tot=0.0s ave=0.067ms CAN1 TX[07e4] : n=54 tot=0.0s ave=0.044ms Set State : n=7 tot=0.0s ave=0.104ms
This is probably going to be quite useful in general! The TX call-backs don't seem to be significant here. (oh, I should probably implement a reset of the values too).
//.ichael
On Sun, 12 May 2024 at 22:58, Michael Geddes < frog@bunyip.wheelycreek.net> wrote:
Yeah - I certainly wasn't going to put a hard limit. Just a log above a certain time, that being said, the idea of just collecting stats (being able to turn it on via a "poller timer" set of commands) would be much more useful. I'll look into that.
Average time is probably a good stat - and certainly what we care about.
I actually am hopeful that those couple of things I did might help reduce that average time quite a bit (that short-cutting the isotp protocol handling especially).
That p/r with logging changes might help reduce the unproductive log time further, but also makes it possible to turn on the poller logging without the RX task logs kicking in.
//.ichael
On Sun, 12 May 2024 at 22:29, Michael Balzer via OvmsDev < ovmsdev@lists.openvehicles.com> wrote:
Warning / gathering debug statistics about slow processing can be helpful, but there must not be a hard limit. Frame/poll response processing may need disk or network I/O, and the vehicle task may be starving from punctual high loads on higher priority tasks (e.g. networking) or by needing to wait for some semaphore -- that's outside the application's control, and must not lead to termination/recreation of the task (in case you're heading towards that direction).
I have no idea how much processing time the current vehicles actually need in their respective worst cases. Your draft is probably too lax, poll responses and frames normally need to be processed much faster. I'd say 10 ms is already too slow, but any wait for a queue/semaphore will already mean at least 10 ms (FreeRTOS tick). Probably best to begin with just collecting stats.
Btw, to help in narrowing down the actual problem case, the profiler could collect max times per RX message ID.
Regards, Michael
Am 12.05.24 um 10:41 schrieb Michael Geddes:
I have a question for Michael B (or whoever) - I have a commit lined up that would add a bit of a time check to the poller loop. What do we expect the maximum time to execute a poller loop command should be? This is a rough idea (in ms) I have.. based on nothing much really, so any ideas would be appreciated: int TardyMaxTime_ms(OvmsPoller::OvmsPollEntryType entry_type) { switch (entry_type) { case OvmsPoller::OvmsPollEntryType::Poll: return 80; case OvmsPoller::OvmsPollEntryType::FrameRx: return 30; case OvmsPoller::OvmsPollEntryType::FrameTx: return 20; case OvmsPoller::OvmsPollEntryType::Command: return 10; case OvmsPoller::OvmsPollEntryType::PollState: return 15; default: return 80; } }
//.ichael
On Mon, 6 May 2024 at 07:45, Michael Geddes < frog@bunyip.wheelycreek.net> wrote:
> I realise that I was only using the standard cable to test - which > probably is not sufficient - I haven't looked closely at how the Leaf OBD > to Db9 cable is different from standard. > > Ah, my bad out the queue length. We are definitely queueing more > messages though. From my log of when the overflow happened, the poller > was in state 0 which means OFF - ie nothing was being sent!! > > I'll look at the TX message thing - opt in sounds good - though it > shouldn't be playing that much of a part here as the TXs are infrequent in > this case (or zero when the leaf is off or driving) - On the ioniq 5 when > I'm using the HUD - I'm polling quite frequently - multiple times per > second and that seems to be fine!. > > I did find an issue with the throttling .. but it would still > mostly apply the throttling where it matters, so again, it shouldn't be the > problem (also, we aren't transmitting in the leaf case). > > The change I made to the logging of RX messages showed how many in a > row were dropped... and it was mostly 1 only in a run - which means even if > it is a short time between - that means that the drops are being > interleaved by at least one success! > > Sooo.. I'm still wondering what is going on. Some things I'm going > to try: > > * If the number of messages on the Can bus (coming in through RX) > means that the queue is slowly getting longer and not quite catching up, > then making the queue longer will help it last longer... but only pushes > the problem down the road. > - Add 'current queue length' to the poller status information to > see if this is indeed the case? > - Add some kind of alert when the queue reaches a % full? > * Once you start overflowing and getting overflow log messages, I > wonder if this is then contributing to the problem. > - Push the overflow logging into Poller Task which can look at how > many drops occurred since last received item. > * Split up the flags for the poller messages into 2: > - Messages that are/could be happening in the TX/RX tasks > - Other noisy messages that always happen in the poller task. > > Thoughts on what else we might measure to figure out what is going > on? > > //.ichael > > > On Sun, 5 May 2024, 19:29 Michael Balzer via OvmsDev, < > ovmsdev@lists.openvehicles.com> wrote: > >> Michael, >> >> the queue size isn't in bytes, it's in messages: >> >> * @param uxQueueLength The maximum number of items that the queue >> can contain. >> * >> * @param uxItemSize The number of bytes each item in the queue >> will require. >> >> >> Also, from the time stamps in Dereks log excerpt, there were quite >> some dropped frames in that time window -- at least 23 frames in 40 ms, >> that's bad. >> >> Queue sizes are currently: >> >> CONFIG_OVMS_HW_CAN_RX_QUEUE_SIZE=60 >> CONFIG_OVMS_VEHICLE_CAN_RX_QUEUE_SIZE=60 >> >> The new poller now channels all TX callbacks through the task queue >> additionally to RX and commands. So setting the queue size to be larger >> than the CAN RX queue size seems appropriate. >> >> Nevertheless, an overflow with more than 60 waiting messages still >> indicates some too long processing time in the vehicle task. >> >> TX callbacks previously were done directly in the CAN context, and >> no current vehicle overrides the empty default handler, so this imposed >> almost no additional overhead. By requiring a queue entry for each TX >> callback, this feature now has a potentially high impact for all vehicles. >> If passing these to the task is actually necessary, it needs to become an >> opt-in feature, so only vehicles subscribing to the callback actually need >> to cope with that additional load & potential processing delays involved. >> >> Regards, >> Michael >> >> -- Michael Balzer * Helkenberger Weg 9 * D-58256 Ennepetal Fon 02333 / 833 5735 * Handy 0176 / 206 989 26
_______________________________________________ OvmsDev mailing list OvmsDev@lists.openvehicles.com http://lists.openvehicles.com/mailman/listinfo/ovmsdev
_______________________________________________ OvmsDev mailing listOvmsDev@lists.openvehicles.comhttp://lists.openvehicles.com/mailman/listinfo/ovmsdev
-- Michael Balzer * Helkenberger Weg 9 * D-58256 Ennepetal Fon 02333 / 833 5735 * Handy 0176 / 206 989 26
_______________________________________________ OvmsDev mailing list OvmsDev@lists.openvehicles.com http://lists.openvehicles.com/mailman/listinfo/ovmsdev
-- Michael Balzer * Helkenberger Weg 9 * D-58256 Ennepetal Fon 02333 / 833 5735 * Handy 0176 / 206 989 26
A builtin web UI for this seems a bit over the top. Builtin web config pages should focus on user features, this is clearly a feature only needed during/for the development/extension of a vehicle adapter. Development features in the web UI are confusing for end users. If persistent enabling/disabling is done by a simple config command (e.g. "config set can poller.trace on"), that's also doable by users. Regards, Michael Am 19.05.24 um 02:06 schrieb Michael Geddes:
I was so focused on how I calculated the value that I totally missed that ‰ would be a better description. I could also use the system 'Ratio' unit... so % or ‰.
I'll make space to put 'Avg' on the row. Was trying to limit the width for output on a mobile. I agree it would make it easier to understand. Totals also makes sense.
Should I make this a configuration that can be set on the web-page? I'd probably use a configuration change notification so that the very bit setting is sync'd with the 'configuration' value.
//.ichael
On Sat, 18 May 2024, 14:05 Michael Balzer, <dexter@expeedo.de> wrote:
I'm not sure whether the 'max' should be the maximum of the smoothed value.. or the maximum of the raw value.
It should normally be the maximum of the raw value I think, the maximum of the smoothed value cannot tell about how bad the processing of an ID can become.
The naming in the table is a bit confusing I think. (besides: I've never seen "ave" as the abbreviation for average)
If I understand you correctly, "time ms per s" is the time share in per mille, so something in that direction would be more clear, and "length ms" would then be "time [ms]".
The totals for all averages in the table foot would also be nice.
Maybe "Ave" (or avg?) also should be placed on the left, as the "peak" label now suggests being the peak of the average.
Btw, keep in mind, not all "edge" users / testers are developers (e.g. the Twizy driver I'm in contact with), collecting stats feedback for vehicles from testers should be straight forward. Maybe add a data/history record, sent automatically on every drive/charge stop when the poller tracing is on?
Regards, Michael
Am 18.05.24 um 02:28 schrieb Michael Geddes:
You did say max/pead value. I also halved the N for both. I'm not sure whether the 'max' should be the maximum of the smoothed value.. or the maximum of the raw value. This is currently the raw-value maximum. The problem is that the middle column is the maximum of the {{sum over 10s} / (10*1000,000) I could easily change the 'period' to 1s and see how that goes.. was just trying to reduce the larger calculations.
Usage: poller [pause|resume|status|times|trace]
OVMS# poller time status Poller timing is: on Type | Count | Ave time | Ave length | per s | ms per s | ms -------------+----------+-----------+----------- Poll:PRI | 1.00| 0.559| 0.543 peak | | 0.663| 1.528 -------------+----------+-----------+----------- Poll:SRX | 0.08| 0.009| 0.038 peak | | 0.068| 0.146 -------------+----------+-----------+----------- CAN1 RX[778] | 0.11| 0.061| 0.280 peak | | 0.458| 1.046 -------------+----------+-----------+----------- CAN1 RX[7a8] | 0.04| 0.024| 0.124 peak | | 0.160| 0.615 -------------+----------+-----------+----------- CAN1 TX[770] | 0.05| 0.004| 0.016 peak | | 0.022| 0.102 -------------+----------+-----------+----------- CAN1 TX[7a0] | 0.02| 0.002| 0.011 peak | | 0.010| 0.098 -------------+----------+-----------+----------- CAN1 TX[7b3] | 0.01| 0.001| 0.006 peak | | 0.000| 0.099 -------------+----------+-----------+----------- CAN1 TX[7e2] | 0.02| 0.002| 0.011 peak | | 0.010| 0.099 -------------+----------+-----------+----------- CAN1 TX[7e4] | 0.08| 0.008| 0.048 peak | | 0.049| 0.107 -------------+----------+-----------+----------- Cmd:State | 0.00| 0.000| 0.005 peak | | 0.000| 0.094
On Fri, 17 May 2024 at 15:26, Michael Geddes <frog@bunyip.wheelycreek.net> wrote:
This is what I have now. The one on the end is the one MIchael B was after using an N of 32. (up for discussion).
The middle is the time spent in that even t per second. It accumulates times (in microseconds), and then every 10s it stores it as smoothed (N=16) value. The Count is similar (except that we store a value of '100' as 1 event so it can be still integers and has 2 decimal places).
Every received poll does a 64bit difference to 32bit (for the elapsed time) and 64bit comparison (for end-of-period). It also does 1x 32bit smoothing and 2x 32bit adds.
Then at the end of a 10s period, it will do a 64bit add to get the next end-of-period value, as well as the 2x 32bit smoothing calcs.
This is from the Ioniq 5 so not any big values yet. You can certainly see how insignificant the TX callbacks are. I'll leave it on for when the car is moving and gets some faster polling.
OVMS# poll time status Poller timing is: on Type | Count | Ave time | Ave Length | per s | ms per s | ms -------------+----------+-----------+----------- Poll:PRI | 1.00| 0.540| 0.539 Poll:SRX | 0.03| 0.004| 0.017 CAN1 RX[778] | 0.06| 0.042| 0.175 CAN1 TX[770] | 0.04| 0.002| 0.008 Cmd:State | 0.01| 0.001| 0.005
----------------------8<--------------------------------
Nice smoothing class (forces N as a power of 2): constexpr unsigned floorlog2(unsigned x) { return x == 1 ? 0 : 1+floorlog2(x >> 1); } /* Maintain a smoothed average using shifts for division. * T should be an integer type * N needs to be a power of 2 */ template <typename T, unsigned N> class average_util_t { private: T m_ave; public: average_util_t() : m_ave(0) {} static const uint8_t _BITS = floorlog2(N); void add( T val) { static_assert(N == (1 << _BITS), "N must be a power of 2"); m_ave = (((N-1) * m_ave) + val) >> _BITS; } T get() { return m_ave; } operator T() { return m_ave; } };
On Thu, 16 May 2024 at 10:29, Michael Geddes <frog@bunyip.wheelycreek.net> wrote:
Thanks Michael,
My calculations give me ((2^32)-1) / (1000*1000*3600) = only 1.2 hours of processing time in 32bit. The initial subtraction is 64bit anyway and I can't see a further 64bit addition being a problem. I have the calculations being performed in doubles at print-out where performance is not really an issue anyway. (Though apparently doing 64 bit division is worse than floating point).
In addition * I currently have this being able to be turned on and off and reset manually (only do it when required).
* For the lower volume commands, the smoothed average is not going to be useful - the count is more interesting for different reasons.
* The total time is quite useful. Ie a high average time doesn't matter if the count is low. The things that are affecting performance are stuff with high total time. Stuff which is happening 100 times a second needs to be a much lower average than once a second.
* A measure like 'time per minute/second' and possibly count per minute/seconds as a smoothed average would potentially be more useful. (or in addition?) I think we could do _that_ in a reasonably efficient manner using a 64 bit 'last measured time', a 32 bit accumulated value and the stored 32 bit rolling average. It would boils down to some iterative (integer) sums and multiplications plus a divide by n ^ (time periods passed) - which is a shift - and which can be optimised to '0' if 'time-periods-passed' is more than 32/(bits-per-n) - effectively limiting the number of iterations. The one issue I can see is that we need to calculate 'number of time-periods passed' which is a 64 bit subtraction followed by a 32 bit division (not optimisable to a simple shift).
* I'm also happy to keep a rolling (32bit) average time. Even if you assume averages in the 100ms, 32bit is going to happily support an N of 64 or even 128. Am I right in thinking that the choice of N is highly dependent on frequency. For things happening 100 times per second, you might want an N like 128.. where things happening once per second, you might want an N of 4 or 8. The other things we keep track of in this manner we have a better idea of the frequency of the thing.
How about we have (per record type): * total count (since last reset?) (32 bit) * smoothed average of time per instance (32 bit)
* ?xx? total accumulated time since last reset (64bit) ?? <-- with the below stats this is much less useful
* last-measured-time (64 bit) * accumulated count since last time-period (16bit - but maybe 32bit anyway for byte alignment?) * smoothed average of count per time-period (32bit) * accumulated time since last time-period (32bit) * smoothed average of time per time-period (32bit)
It's possible to keep the
Is this going to be too much per record type? The number of 'records' we are keeping is quite low (so 10 to 20 maybe) - so it's not a huge memory burden.
Thoughts?
//.ichael On Thu, 16 May 2024 at 03:09, Michael Balzer via OvmsDev <ovmsdev@lists.openvehicles.com> wrote:
esp_timer_get_time() is the right choice for precision timing.
I'd say uint32 is enough though, even if counting microseconds that can hold a total of more than 71 hours of actual processing time. uint64 has a significant performance penalty, although I don't recall the overhead for simple additions.
Also & more important, the average wouldn't be my main focus, but the maximum processing time seen per ID, which seems to be missing in your draft.
Second thought on the average… the exact overall average really has a minor meaning, I'd rather see the current average, adapting to the current mode of operation (drive/charge/…). I suggest feeding the measurements to a low pass filter to get the smoothed average of the last n measurements. Pattern:
runavg = ((N-1) * runavg + newval) / N
By using a low power of 2 for N (e.g. 8 or 16), you can replace the division by a simple bit shift, and have enough headroom to use 32 bit integers.
Regards, Michael
Am 15.05.24 um 06:51 schrieb Michael Geddes via OvmsDev:
Formatting aside, I have implemented what I think Michael B was suggesting. This is a sample run on the Ioniq 5 (which doesn't have unsolicited RX events).
This uses the call esp_timer_get_time() got get a 64bit *microseconds* since started value - and works out the time to execute that way. It's looking at absolute time and not time in the Task - so other things going on at the same time in other tasks will have an effect. (The normal tick count doesn't have nearly enough resolution to be useful - any other ideas on measurement?) I've got total accumulated time displaying in seconds and the average in milliseconds currently - but I can change that easy enough. The cumulative time is stored as uint64_t which will be plenty, as 32bit wouldn't be nearly enough.
OVMS# *poller time on* Poller timing is now on
OVMS# *poller time status* Poller timing is: on Poll [PRI] : n=390 tot=0.2s ave=0.586ms Poll [SRX] : n=316 tot=0.1s ave=0.196ms CAN1 RX[0778] : n=382 tot=0.2s ave=0.615ms CAN1 RX[07a8] : n=48 tot=0.0s ave=0.510ms CAN1 RX[07bb] : n=162 tot=0.1s ave=0.519ms CAN1 RX[07ce] : n=33 tot=0.0s ave=0.469ms CAN1 RX[07ea] : n=408 tot=0.2s ave=0.467ms CAN1 RX[07ec] : n=486 tot=0.2s ave=0.477ms CAN3 RX[07df] : n=769 tot=0.2s ave=0.261ms CAN1 TX[0770] : n=191 tot=0.0s ave=0.054ms CAN1 TX[07a0] : n=16 tot=0.0s ave=0.047ms CAN1 TX[07b3] : n=31 tot=0.0s ave=0.069ms CAN1 TX[07c6] : n=11 tot=0.0s ave=0.044ms CAN1 TX[07e2] : n=82 tot=0.0s ave=0.067ms CAN1 TX[07e4] : n=54 tot=0.0s ave=0.044ms Set State : n=7 tot=0.0s ave=0.104ms
This is probably going to be quite useful in general! The TX call-backs don't seem to be significant here. (oh, I should probably implement a reset of the values too).
//.ichael
On Sun, 12 May 2024 at 22:58, Michael Geddes <frog@bunyip.wheelycreek.net> wrote:
Yeah - I certainly wasn't going to put a hard limit. Just a log above a certain time, that being said, the idea of just collecting stats (being able to turn it on via a "poller timer" set of commands) would be much more useful. I'll look into that.
Average time is probably a good stat - and certainly what we care about.
I actually am hopeful that those couple of things I did might help reduce that average time quite a bit (that short-cutting the isotp protocol handling especially).
That p/r with logging changes might help reduce the unproductive log time further, but also makes it possible to turn on the poller logging without the RX task logs kicking in.
//.ichael
On Sun, 12 May 2024 at 22:29, Michael Balzer via OvmsDev <ovmsdev@lists.openvehicles.com> wrote:
Warning / gathering debug statistics about slow processing can be helpful, but there must not be a hard limit. Frame/poll response processing may need disk or network I/O, and the vehicle task may be starving from punctual high loads on higher priority tasks (e.g. networking) or by needing to wait for some semaphore -- that's outside the application's control, and must not lead to termination/recreation of the task (in case you're heading towards that direction).
I have no idea how much processing time the current vehicles actually need in their respective worst cases. Your draft is probably too lax, poll responses and frames normally need to be processed much faster. I'd say 10 ms is already too slow, but any wait for a queue/semaphore will already mean at least 10 ms (FreeRTOS tick). Probably best to begin with just collecting stats.
Btw, to help in narrowing down the actual problem case, the profiler could collect max times per RX message ID.
Regards, Michael
Am 12.05.24 um 10:41 schrieb Michael Geddes:
I have a question for Michael B (or whoever) - I have a commit lined up that would add a bit of a time check to the poller loop. What do we expect the maximum time to execute a poller loop command should be? This is a rough idea (in ms) I have.. based on nothing much really, so any ideas would be appreciated: int TardyMaxTime_ms(OvmsPoller::OvmsPollEntryType entry_type) { switch (entry_type) { case OvmsPoller::OvmsPollEntryType::Poll: return 80; case OvmsPoller::OvmsPollEntryType::FrameRx: return 30; case OvmsPoller::OvmsPollEntryType::FrameTx: return 20; case OvmsPoller::OvmsPollEntryType::Command: return 10; case OvmsPoller::OvmsPollEntryType::PollState: return 15; default: return 80; } }
//.ichael
On Mon, 6 May 2024 at 07:45, Michael Geddes <frog@bunyip.wheelycreek.net> wrote:
I realise that I was only using the standard cable to test - which probably is not sufficient - I haven't looked closely at how the Leaf OBD to Db9 cable is different from standard.
Ah, my bad out the queue length. We are definitely queueing more messages though. From my log of when the overflow happened, the poller was in state 0 which means OFF - ie nothing was being sent!!
I'll look at the TX message thing - opt in sounds good - though it shouldn't be playing that much of a part here as the TXs are infrequent in this case (or zero when the leaf is off or driving) - On the ioniq 5 when I'm using the HUD - I'm polling quite frequently - multiple times per second and that seems to be fine!.
I did find an issue with the throttling .. but it would still mostly apply the throttling where it matters, so again, it shouldn't be the problem (also, we aren't transmitting in the leaf case).
The change I made to the logging of RX messages showed how many in a row were dropped... and it was mostly 1 only in a run - which means even if it is a short time between - that means that the drops are being interleaved by at least one success!
Sooo.. I'm still wondering what is going on. Some things I'm going to try:
* If the number of messages on the Can bus (coming in through RX) means that the queue is slowly getting longer and not quite catching up, then making the queue longer will help it last longer... but only pushes the problem down the road. - Add 'current queue length' to the poller status information to see if this is indeed the case? - Add some kind of alert when the queue reaches a % full? * Once you start overflowing and getting overflow log messages, I wonder if this is then contributing to the problem. - Push the overflow logging into Poller Task which can look at how many drops occurred since last received item. * Split up the flags for the poller messages into 2: - Messages that are/could be happening in the TX/RX tasks - Other noisy messages that always happen in the poller task.
Thoughts on what else we might measure to figure out what is going on?
//.ichael
On Sun, 5 May 2024, 19:29 Michael Balzer via OvmsDev, <ovmsdev@lists.openvehicles.com> wrote:
Michael,
the queue size isn't in bytes, it's in messages:
* @param uxQueueLength The maximum number of items that the queue can contain. * * @param uxItemSize The number of bytes each item in the queue will require.
Also, from the time stamps in Dereks log excerpt, there were quite some dropped frames in that time window -- at least 23 frames in 40 ms, that's bad.
Queue sizes are currently:
CONFIG_OVMS_HW_CAN_RX_QUEUE_SIZE=60 CONFIG_OVMS_VEHICLE_CAN_RX_QUEUE_SIZE=60
The new poller now channels all TX callbacks through the task queue additionally to RX and commands. So setting the queue size to be larger than the CAN RX queue size seems appropriate.
Nevertheless, an overflow with more than 60 waiting messages still indicates some too long processing time in the vehicle task.
TX callbacks previously were done directly in the CAN context, and no current vehicle overrides the empty default handler, so this imposed almost no additional overhead. By requiring a queue entry for each TX callback, this feature now has a potentially high impact for all vehicles. If passing these to the task is actually necessary, it needs to become an opt-in feature, so only vehicles subscribing to the callback actually need to cope with that additional load & potential processing delays involved.
Regards, Michael
-- Michael Balzer * Helkenberger Weg 9 * D-58256 Ennepetal Fon 02333 / 833 5735 * Handy 0176 / 206 989 26
_______________________________________________ OvmsDev mailing list OvmsDev@lists.openvehicles.com http://lists.openvehicles.com/mailman/listinfo/ovmsdev
_______________________________________________ OvmsDev mailing list OvmsDev@lists.openvehicles.com http://lists.openvehicles.com/mailman/listinfo/ovmsdev
-- Michael Balzer * Helkenberger Weg 9 * D-58256 Ennepetal Fon 02333 / 833 5735 * Handy 0176 / 206 989 26
_______________________________________________ OvmsDev mailing list OvmsDev@lists.openvehicles.com http://lists.openvehicles.com/mailman/listinfo/ovmsdev
-- Michael Balzer * Helkenberger Weg 9 * D-58256 Ennepetal Fon 02333 / 833 5735 * Handy 0176 / 206 989 26
-- Michael Balzer * Helkenberger Weg 9 * D-58256 Ennepetal Fon 02333 / 833 5735 * Handy 0176 / 206 989 26
If the configuration gets more complex, you can provide a web plugin, or a builtin page that needs to be enabled explicitly by the developer, e.g. to be placed in the vehicle menu. That way the developer can decide when to show/hide this from users. Am 19.05.24 um 06:50 schrieb Michael Balzer via OvmsDev:
A builtin web UI for this seems a bit over the top. Builtin web config pages should focus on user features, this is clearly a feature only needed during/for the development/extension of a vehicle adapter. Development features in the web UI are confusing for end users.
If persistent enabling/disabling is done by a simple config command (e.g. "config set can poller.trace on"), that's also doable by users.
Regards, Michael
Am 19.05.24 um 02:06 schrieb Michael Geddes:
I was so focused on how I calculated the value that I totally missed that ‰ would be a better description. I could also use the system 'Ratio' unit... so % or ‰.
I'll make space to put 'Avg' on the row. Was trying to limit the width for output on a mobile. I agree it would make it easier to understand. Totals also makes sense.
Should I make this a configuration that can be set on the web-page? I'd probably use a configuration change notification so that the very bit setting is sync'd with the 'configuration' value.
//.ichael
On Sat, 18 May 2024, 14:05 Michael Balzer, <dexter@expeedo.de> wrote:
I'm not sure whether the 'max' should be the maximum of the smoothed value.. or the maximum of the raw value.
It should normally be the maximum of the raw value I think, the maximum of the smoothed value cannot tell about how bad the processing of an ID can become.
The naming in the table is a bit confusing I think. (besides: I've never seen "ave" as the abbreviation for average)
If I understand you correctly, "time ms per s" is the time share in per mille, so something in that direction would be more clear, and "length ms" would then be "time [ms]".
The totals for all averages in the table foot would also be nice.
Maybe "Ave" (or avg?) also should be placed on the left, as the "peak" label now suggests being the peak of the average.
Btw, keep in mind, not all "edge" users / testers are developers (e.g. the Twizy driver I'm in contact with), collecting stats feedback for vehicles from testers should be straight forward. Maybe add a data/history record, sent automatically on every drive/charge stop when the poller tracing is on?
Regards, Michael
Am 18.05.24 um 02:28 schrieb Michael Geddes:
You did say max/pead value. I also halved the N for both. I'm not sure whether the 'max' should be the maximum of the smoothed value.. or the maximum of the raw value. This is currently the raw-value maximum. The problem is that the middle column is the maximum of the {{sum over 10s} / (10*1000,000) I could easily change the 'period' to 1s and see how that goes.. was just trying to reduce the larger calculations.
Usage: poller [pause|resume|status|times|trace]
OVMS# poller time status Poller timing is: on Type | Count | Ave time | Ave length | per s | ms per s | ms -------------+----------+-----------+----------- Poll:PRI | 1.00| 0.559| 0.543 peak | | 0.663| 1.528 -------------+----------+-----------+----------- Poll:SRX | 0.08| 0.009| 0.038 peak | | 0.068| 0.146 -------------+----------+-----------+----------- CAN1 RX[778] | 0.11| 0.061| 0.280 peak | | 0.458| 1.046 -------------+----------+-----------+----------- CAN1 RX[7a8] | 0.04| 0.024| 0.124 peak | | 0.160| 0.615 -------------+----------+-----------+----------- CAN1 TX[770] | 0.05| 0.004| 0.016 peak | | 0.022| 0.102 -------------+----------+-----------+----------- CAN1 TX[7a0] | 0.02| 0.002| 0.011 peak | | 0.010| 0.098 -------------+----------+-----------+----------- CAN1 TX[7b3] | 0.01| 0.001| 0.006 peak | | 0.000| 0.099 -------------+----------+-----------+----------- CAN1 TX[7e2] | 0.02| 0.002| 0.011 peak | | 0.010| 0.099 -------------+----------+-----------+----------- CAN1 TX[7e4] | 0.08| 0.008| 0.048 peak | | 0.049| 0.107 -------------+----------+-----------+----------- Cmd:State | 0.00| 0.000| 0.005 peak | | 0.000| 0.094
On Fri, 17 May 2024 at 15:26, Michael Geddes <frog@bunyip.wheelycreek.net> wrote:
This is what I have now. The one on the end is the one MIchael B was after using an N of 32. (up for discussion).
The middle is the time spent in that even t per second. It accumulates times (in microseconds), and then every 10s it stores it as smoothed (N=16) value. The Count is similar (except that we store a value of '100' as 1 event so it can be still integers and has 2 decimal places).
Every received poll does a 64bit difference to 32bit (for the elapsed time) and 64bit comparison (for end-of-period). It also does 1x 32bit smoothing and 2x 32bit adds.
Then at the end of a 10s period, it will do a 64bit add to get the next end-of-period value, as well as the 2x 32bit smoothing calcs.
This is from the Ioniq 5 so not any big values yet. You can certainly see how insignificant the TX callbacks are. I'll leave it on for when the car is moving and gets some faster polling.
OVMS# poll time status Poller timing is: on Type | Count | Ave time | Ave Length | per s | ms per s | ms -------------+----------+-----------+----------- Poll:PRI | 1.00| 0.540| 0.539 Poll:SRX | 0.03| 0.004| 0.017 CAN1 RX[778] | 0.06| 0.042| 0.175 CAN1 TX[770] | 0.04| 0.002| 0.008 Cmd:State | 0.01| 0.001| 0.005
----------------------8<--------------------------------
Nice smoothing class (forces N as a power of 2): constexpr unsigned floorlog2(unsigned x) { return x == 1 ? 0 : 1+floorlog2(x >> 1); } /* Maintain a smoothed average using shifts for division. * T should be an integer type * N needs to be a power of 2 */ template <typename T, unsigned N> class average_util_t { private: T m_ave; public: average_util_t() : m_ave(0) {} static const uint8_t _BITS = floorlog2(N); void add( T val) { static_assert(N == (1 << _BITS), "N must be a power of 2"); m_ave = (((N-1) * m_ave) + val) >> _BITS; } T get() { return m_ave; } operator T() { return m_ave; } };
On Thu, 16 May 2024 at 10:29, Michael Geddes <frog@bunyip.wheelycreek.net> wrote:
Thanks Michael,
My calculations give me ((2^32)-1) / (1000*1000*3600) = only 1.2 hours of processing time in 32bit. The initial subtraction is 64bit anyway and I can't see a further 64bit addition being a problem. I have the calculations being performed in doubles at print-out where performance is not really an issue anyway. (Though apparently doing 64 bit division is worse than floating point).
In addition * I currently have this being able to be turned on and off and reset manually (only do it when required).
* For the lower volume commands, the smoothed average is not going to be useful - the count is more interesting for different reasons.
* The total time is quite useful. Ie a high average time doesn't matter if the count is low. The things that are affecting performance are stuff with high total time. Stuff which is happening 100 times a second needs to be a much lower average than once a second.
* A measure like 'time per minute/second' and possibly count per minute/seconds as a smoothed average would potentially be more useful. (or in addition?) I think we could do _that_ in a reasonably efficient manner using a 64 bit 'last measured time', a 32 bit accumulated value and the stored 32 bit rolling average. It would boils down to some iterative (integer) sums and multiplications plus a divide by n ^ (time periods passed) - which is a shift - and which can be optimised to '0' if 'time-periods-passed' is more than 32/(bits-per-n) - effectively limiting the number of iterations. The one issue I can see is that we need to calculate 'number of time-periods passed' which is a 64 bit subtraction followed by a 32 bit division (not optimisable to a simple shift).
* I'm also happy to keep a rolling (32bit) average time. Even if you assume averages in the 100ms, 32bit is going to happily support an N of 64 or even 128. Am I right in thinking that the choice of N is highly dependent on frequency. For things happening 100 times per second, you might want an N like 128.. where things happening once per second, you might want an N of 4 or 8. The other things we keep track of in this manner we have a better idea of the frequency of the thing.
How about we have (per record type): * total count (since last reset?) (32 bit) * smoothed average of time per instance (32 bit)
* ?xx? total accumulated time since last reset (64bit) ?? <-- with the below stats this is much less useful
* last-measured-time (64 bit) * accumulated count since last time-period (16bit - but maybe 32bit anyway for byte alignment?) * smoothed average of count per time-period (32bit) * accumulated time since last time-period (32bit) * smoothed average of time per time-period (32bit)
It's possible to keep the
Is this going to be too much per record type? The number of 'records' we are keeping is quite low (so 10 to 20 maybe) - so it's not a huge memory burden.
Thoughts?
//.ichael On Thu, 16 May 2024 at 03:09, Michael Balzer via OvmsDev <ovmsdev@lists.openvehicles.com> wrote:
esp_timer_get_time() is the right choice for precision timing.
I'd say uint32 is enough though, even if counting microseconds that can hold a total of more than 71 hours of actual processing time. uint64 has a significant performance penalty, although I don't recall the overhead for simple additions.
Also & more important, the average wouldn't be my main focus, but the maximum processing time seen per ID, which seems to be missing in your draft.
Second thought on the average… the exact overall average really has a minor meaning, I'd rather see the current average, adapting to the current mode of operation (drive/charge/…). I suggest feeding the measurements to a low pass filter to get the smoothed average of the last n measurements. Pattern:
runavg = ((N-1) * runavg + newval) / N
By using a low power of 2 for N (e.g. 8 or 16), you can replace the division by a simple bit shift, and have enough headroom to use 32 bit integers.
Regards, Michael
Am 15.05.24 um 06:51 schrieb Michael Geddes via OvmsDev:
Formatting aside, I have implemented what I think Michael B was suggesting. This is a sample run on the Ioniq 5 (which doesn't have unsolicited RX events).
This uses the call esp_timer_get_time() got get a 64bit *microseconds* since started value - and works out the time to execute that way. It's looking at absolute time and not time in the Task - so other things going on at the same time in other tasks will have an effect. (The normal tick count doesn't have nearly enough resolution to be useful - any other ideas on measurement?) I've got total accumulated time displaying in seconds and the average in milliseconds currently - but I can change that easy enough. The cumulative time is stored as uint64_t which will be plenty, as 32bit wouldn't be nearly enough.
OVMS# *poller time on* Poller timing is now on
OVMS# *poller time status* Poller timing is: on Poll [PRI] : n=390 tot=0.2s ave=0.586ms Poll [SRX] : n=316 tot=0.1s ave=0.196ms CAN1 RX[0778] : n=382 tot=0.2s ave=0.615ms CAN1 RX[07a8] : n=48 tot=0.0s ave=0.510ms CAN1 RX[07bb] : n=162 tot=0.1s ave=0.519ms CAN1 RX[07ce] : n=33 tot=0.0s ave=0.469ms CAN1 RX[07ea] : n=408 tot=0.2s ave=0.467ms CAN1 RX[07ec] : n=486 tot=0.2s ave=0.477ms CAN3 RX[07df] : n=769 tot=0.2s ave=0.261ms CAN1 TX[0770] : n=191 tot=0.0s ave=0.054ms CAN1 TX[07a0] : n=16 tot=0.0s ave=0.047ms CAN1 TX[07b3] : n=31 tot=0.0s ave=0.069ms CAN1 TX[07c6] : n=11 tot=0.0s ave=0.044ms CAN1 TX[07e2] : n=82 tot=0.0s ave=0.067ms CAN1 TX[07e4] : n=54 tot=0.0s ave=0.044ms Set State : n=7 tot=0.0s ave=0.104ms
This is probably going to be quite useful in general! The TX call-backs don't seem to be significant here. (oh, I should probably implement a reset of the values too).
//.ichael
On Sun, 12 May 2024 at 22:58, Michael Geddes <frog@bunyip.wheelycreek.net> wrote:
Yeah - I certainly wasn't going to put a hard limit. Just a log above a certain time, that being said, the idea of just collecting stats (being able to turn it on via a "poller timer" set of commands) would be much more useful. I'll look into that.
Average time is probably a good stat - and certainly what we care about.
I actually am hopeful that those couple of things I did might help reduce that average time quite a bit (that short-cutting the isotp protocol handling especially).
That p/r with logging changes might help reduce the unproductive log time further, but also makes it possible to turn on the poller logging without the RX task logs kicking in.
//.ichael
On Sun, 12 May 2024 at 22:29, Michael Balzer via OvmsDev <ovmsdev@lists.openvehicles.com> wrote:
Warning / gathering debug statistics about slow processing can be helpful, but there must not be a hard limit. Frame/poll response processing may need disk or network I/O, and the vehicle task may be starving from punctual high loads on higher priority tasks (e.g. networking) or by needing to wait for some semaphore -- that's outside the application's control, and must not lead to termination/recreation of the task (in case you're heading towards that direction).
I have no idea how much processing time the current vehicles actually need in their respective worst cases. Your draft is probably too lax, poll responses and frames normally need to be processed much faster. I'd say 10 ms is already too slow, but any wait for a queue/semaphore will already mean at least 10 ms (FreeRTOS tick). Probably best to begin with just collecting stats.
Btw, to help in narrowing down the actual problem case, the profiler could collect max times per RX message ID.
Regards, Michael
Am 12.05.24 um 10:41 schrieb Michael Geddes:
I have a question for Michael B (or whoever) - I have a commit lined up that would add a bit of a time check to the poller loop. What do we expect the maximum time to execute a poller loop command should be? This is a rough idea (in ms) I have.. based on nothing much really, so any ideas would be appreciated: int TardyMaxTime_ms(OvmsPoller::OvmsPollEntryType entry_type) { switch (entry_type) { case OvmsPoller::OvmsPollEntryType::Poll: return 80; case OvmsPoller::OvmsPollEntryType::FrameRx: return 30; case OvmsPoller::OvmsPollEntryType::FrameTx: return 20; case OvmsPoller::OvmsPollEntryType::Command: return 10; case OvmsPoller::OvmsPollEntryType::PollState: return 15; default: return 80; } }
//.ichael
On Mon, 6 May 2024 at 07:45, Michael Geddes <frog@bunyip.wheelycreek.net> wrote:
I realise that I was only using the standard cable to test - which probably is not sufficient - I haven't looked closely at how the Leaf OBD to Db9 cable is different from standard.
Ah, my bad out the queue length. We are definitely queueing more messages though. From my log of when the overflow happened, the poller was in state 0 which means OFF - ie nothing was being sent!!
I'll look at the TX message thing - opt in sounds good - though it shouldn't be playing that much of a part here as the TXs are infrequent in this case (or zero when the leaf is off or driving) - On the ioniq 5 when I'm using the HUD - I'm polling quite frequently - multiple times per second and that seems to be fine!.
I did find an issue with the throttling .. but it would still mostly apply the throttling where it matters, so again, it shouldn't be the problem (also, we aren't transmitting in the leaf case).
The change I made to the logging of RX messages showed how many in a row were dropped... and it was mostly 1 only in a run - which means even if it is a short time between - that means that the drops are being interleaved by at least one success!
Sooo.. I'm still wondering what is going on. Some things I'm going to try:
* If the number of messages on the Can bus (coming in through RX) means that the queue is slowly getting longer and not quite catching up, then making the queue longer will help it last longer... but only pushes the problem down the road. - Add 'current queue length' to the poller status information to see if this is indeed the case? - Add some kind of alert when the queue reaches a % full? * Once you start overflowing and getting overflow log messages, I wonder if this is then contributing to the problem. - Push the overflow logging into Poller Task which can look at how many drops occurred since last received item. * Split up the flags for the poller messages into 2: - Messages that are/could be happening in the TX/RX tasks - Other noisy messages that always happen in the poller task.
Thoughts on what else we might measure to figure out what is going on?
//.ichael
On Sun, 5 May 2024, 19:29 Michael Balzer via OvmsDev, <ovmsdev@lists.openvehicles.com> wrote:
Michael,
the queue size isn't in bytes, it's in messages:
* @param uxQueueLength The maximum number of items that the queue can contain. * * @param uxItemSize The number of bytes each item in the queue will require.
Also, from the time stamps in Dereks log excerpt, there were quite some dropped frames in that time window -- at least 23 frames in 40 ms, that's bad.
Queue sizes are currently:
CONFIG_OVMS_HW_CAN_RX_QUEUE_SIZE=60 CONFIG_OVMS_VEHICLE_CAN_RX_QUEUE_SIZE=60
The new poller now channels all TX callbacks through the task queue additionally to RX and commands. So setting the queue size to be larger than the CAN RX queue size seems appropriate.
Nevertheless, an overflow with more than 60 waiting messages still indicates some too long processing time in the vehicle task.
TX callbacks previously were done directly in the CAN context, and no current vehicle overrides the empty default handler, so this imposed almost no additional overhead. By requiring a queue entry for each TX callback, this feature now has a potentially high impact for all vehicles. If passing these to the task is actually necessary, it needs to become an opt-in feature, so only vehicles subscribing to the callback actually need to cope with that additional load & potential processing delays involved.
Regards, Michael
-- Michael Balzer * Helkenberger Weg 9 * D-58256 Ennepetal Fon 02333 / 833 5735 * Handy 0176 / 206 989 26
_______________________________________________ OvmsDev mailing list OvmsDev@lists.openvehicles.com http://lists.openvehicles.com/mailman/listinfo/ovmsdev
_______________________________________________ OvmsDev mailing list OvmsDev@lists.openvehicles.com http://lists.openvehicles.com/mailman/listinfo/ovmsdev
-- Michael Balzer * Helkenberger Weg 9 * D-58256 Ennepetal Fon 02333 / 833 5735 * Handy 0176 / 206 989 26
_______________________________________________ OvmsDev mailing list OvmsDev@lists.openvehicles.com http://lists.openvehicles.com/mailman/listinfo/ovmsdev
-- Michael Balzer * Helkenberger Weg 9 * D-58256 Ennepetal Fon 02333 / 833 5735 * Handy 0176 / 206 989 26
-- Michael Balzer * Helkenberger Weg 9 * D-58256 Ennepetal Fon 02333 / 833 5735 * Handy 0176 / 206 989 26
_______________________________________________ OvmsDev mailing list OvmsDev@lists.openvehicles.com http://lists.openvehicles.com/mailman/listinfo/ovmsdev
-- Michael Balzer * Helkenberger Weg 9 * D-58256 Ennepetal Fon 02333 / 833 5735 * Handy 0176 / 206 989 26
Hi, I'm trying to finalise this now .. and one last thing is that I don't get the report coming to my mobile. I'm using the command: MyNotify.NotifyString("info", "poller.report", buf.c_str()); Where the buffer string is just the same as the report output. Should I be using some other format or command? I get "alert" types (like the ioniq5 door-open alert) fine to my mobile. Michael. On Sun, 19 May 2024, 12:51 Michael Balzer via OvmsDev, < ovmsdev@lists.openvehicles.com> wrote:
A builtin web UI for this seems a bit over the top. Builtin web config pages should focus on user features, this is clearly a feature only needed during/for the development/extension of a vehicle adapter. Development features in the web UI are confusing for end users.
If persistent enabling/disabling is done by a simple config command (e.g. "config set can poller.trace on"), that's also doable by users.
Regards, Michael
Am 19.05.24 um 02:06 schrieb Michael Geddes:
I was so focused on how I calculated the value that I totally missed that ‰ would be a better description. I could also use the system 'Ratio' unit... so % or ‰.
I'll make space to put 'Avg' on the row. Was trying to limit the width for output on a mobile. I agree it would make it easier to understand. Totals also makes sense.
Should I make this a configuration that can be set on the web-page? I'd probably use a configuration change notification so that the very bit setting is sync'd with the 'configuration' value.
//.ichael
On Sat, 18 May 2024, 14:05 Michael Balzer, <dexter@expeedo.de> wrote:
I'm not sure whether the 'max' should be the maximum of the smoothed value.. or the maximum of the raw value.
It should normally be the maximum of the raw value I think, the maximum of the smoothed value cannot tell about how bad the processing of an ID can become.
The naming in the table is a bit confusing I think. (besides: I've never seen "ave" as the abbreviation for average)
If I understand you correctly, "time ms per s" is the time share in per mille, so something in that direction would be more clear, and "length ms" would then be "time [ms]".
The totals for all averages in the table foot would also be nice.
Maybe "Ave" (or avg?) also should be placed on the left, as the "peak" label now suggests being the peak of the average.
Btw, keep in mind, not all "edge" users / testers are developers (e.g. the Twizy driver I'm in contact with), collecting stats feedback for vehicles from testers should be straight forward. Maybe add a data/history record, sent automatically on every drive/charge stop when the poller tracing is on?
Regards, Michael
Am 18.05.24 um 02:28 schrieb Michael Geddes:
You did say max/pead value. I also halved the N for both. I'm not sure whether the 'max' should be the maximum of the smoothed value.. or the maximum of the raw value. This is currently the raw-value maximum. The problem is that the middle column is the maximum of the {{sum over 10s} / (10*1000,000) I could easily change the 'period' to 1s and see how that goes.. was just trying to reduce the larger calculations.
Usage: poller [pause|resume|status|times|trace]
OVMS# poller time status Poller timing is: on Type | Count | Ave time | Ave length | per s | ms per s | ms -------------+----------+-----------+----------- Poll:PRI | 1.00| 0.559| 0.543 peak | | 0.663| 1.528 -------------+----------+-----------+----------- Poll:SRX | 0.08| 0.009| 0.038 peak | | 0.068| 0.146 -------------+----------+-----------+----------- CAN1 RX[778] | 0.11| 0.061| 0.280 peak | | 0.458| 1.046 -------------+----------+-----------+----------- CAN1 RX[7a8] | 0.04| 0.024| 0.124 peak | | 0.160| 0.615 -------------+----------+-----------+----------- CAN1 TX[770] | 0.05| 0.004| 0.016 peak | | 0.022| 0.102 -------------+----------+-----------+----------- CAN1 TX[7a0] | 0.02| 0.002| 0.011 peak | | 0.010| 0.098 -------------+----------+-----------+----------- CAN1 TX[7b3] | 0.01| 0.001| 0.006 peak | | 0.000| 0.099 -------------+----------+-----------+----------- CAN1 TX[7e2] | 0.02| 0.002| 0.011 peak | | 0.010| 0.099 -------------+----------+-----------+----------- CAN1 TX[7e4] | 0.08| 0.008| 0.048 peak | | 0.049| 0.107 -------------+----------+-----------+----------- Cmd:State | 0.00| 0.000| 0.005 peak | | 0.000| 0.094
On Fri, 17 May 2024 at 15:26, Michael Geddes <frog@bunyip.wheelycreek.net> wrote:
This is what I have now. The one on the end is the one MIchael B was after using an N of 32. (up for discussion).
The middle is the time spent in that even t per second. It accumulates times (in microseconds), and then every 10s it stores it as smoothed (N=16) value. The Count is similar (except that we store a value of '100' as 1 event so it can be still integers and has 2 decimal places).
Every received poll does a 64bit difference to 32bit (for the elapsed time) and 64bit comparison (for end-of-period). It also does 1x 32bit smoothing and 2x 32bit adds.
Then at the end of a 10s period, it will do a 64bit add to get the next end-of-period value, as well as the 2x 32bit smoothing calcs.
This is from the Ioniq 5 so not any big values yet. You can certainly see how insignificant the TX callbacks are. I'll leave it on for when the car is moving and gets some faster polling.
OVMS# poll time status Poller timing is: on Type | Count | Ave time | Ave Length | per s | ms per s | ms -------------+----------+-----------+----------- Poll:PRI | 1.00| 0.540| 0.539 Poll:SRX | 0.03| 0.004| 0.017 CAN1 RX[778] | 0.06| 0.042| 0.175 CAN1 TX[770] | 0.04| 0.002| 0.008 Cmd:State | 0.01| 0.001| 0.005
----------------------8<--------------------------------
Nice smoothing class (forces N as a power of 2): constexpr unsigned floorlog2(unsigned x) { return x == 1 ? 0 : 1+floorlog2(x >> 1); } /* Maintain a smoothed average using shifts for division. * T should be an integer type * N needs to be a power of 2 */ template <typename T, unsigned N> class average_util_t { private: T m_ave; public: average_util_t() : m_ave(0) {} static const uint8_t _BITS = floorlog2(N); void add( T val) { static_assert(N == (1 << _BITS), "N must be a power of 2"); m_ave = (((N-1) * m_ave) + val) >> _BITS; } T get() { return m_ave; } operator T() { return m_ave; } };
On Thu, 16 May 2024 at 10:29, Michael Geddes < frog@bunyip.wheelycreek.net> wrote:
Thanks Michael,
My calculations give me ((2^32)-1) / (1000*1000*3600) = only 1.2 hours of processing time in 32bit. The initial subtraction is 64bit anyway and I can't see a further 64bit addition being a problem. I have the calculations being performed in doubles at print-out where performance is not really an issue anyway. (Though apparently doing 64 bit division is worse than floating point).
In addition * I currently have this being able to be turned on and off and reset manually (only do it when required).
* For the lower volume commands, the smoothed average is not going to be useful - the count is more interesting for different reasons.
* The total time is quite useful. Ie a high average time doesn't matter if the count is low. The things that are affecting performance are stuff with high total time. Stuff which is happening 100 times a second needs to be a much lower average than once a second.
* A measure like 'time per minute/second' and possibly count per minute/seconds as a smoothed average would potentially be more useful. (or in addition?) I think we could do _that_ in a reasonably efficient manner using a 64 bit 'last measured time', a 32 bit accumulated value and the stored 32 bit rolling average. It would boils down to some iterative (integer) sums and multiplications plus a divide by n ^ (time periods passed) - which is a shift - and which can be optimised to '0' if 'time-periods-passed' is more than 32/(bits-per-n) - effectively limiting the number of iterations. The one issue I can see is that we need to calculate 'number of time-periods passed' which is a 64 bit subtraction followed by a 32 bit division (not optimisable to a simple shift).
* I'm also happy to keep a rolling (32bit) average time. Even if you assume averages in the 100ms, 32bit is going to happily support an N of 64 or even 128. Am I right in thinking that the choice of N is highly dependent on frequency. For things happening 100 times per second, you might want an N like 128.. where things happening once per second, you might want an N of 4 or 8. The other things we keep track of in this manner we have a better idea of the frequency of the thing.
How about we have (per record type): * total count (since last reset?) (32 bit) * smoothed average of time per instance (32 bit)
* ?xx? total accumulated time since last reset (64bit) ?? <-- with the below stats this is much less useful
* last-measured-time (64 bit) * accumulated count since last time-period (16bit - but maybe 32bit anyway for byte alignment?) * smoothed average of count per time-period (32bit) * accumulated time since last time-period (32bit) * smoothed average of time per time-period (32bit)
It's possible to keep the
Is this going to be too much per record type? The number of 'records' we are keeping is quite low (so 10 to 20 maybe) - so it's not a huge memory burden.
Thoughts?
//.ichael On Thu, 16 May 2024 at 03:09, Michael Balzer via OvmsDev < ovmsdev@lists.openvehicles.com> wrote:
esp_timer_get_time() is the right choice for precision timing.
I'd say uint32 is enough though, even if counting microseconds that can hold a total of more than 71 hours of actual processing time. uint64 has a significant performance penalty, although I don't recall the overhead for simple additions.
Also & more important, the average wouldn't be my main focus, but the maximum processing time seen per ID, which seems to be missing in your draft.
Second thought on the average… the exact overall average really has a minor meaning, I'd rather see the current average, adapting to the current mode of operation (drive/charge/…). I suggest feeding the measurements to a low pass filter to get the smoothed average of the last n measurements. Pattern:
runavg = ((N-1) * runavg + newval) / N
By using a low power of 2 for N (e.g. 8 or 16), you can replace the division by a simple bit shift, and have enough headroom to use 32 bit integers.
Regards, Michael
Am 15.05.24 um 06:51 schrieb Michael Geddes via OvmsDev:
Formatting aside, I have implemented what I think Michael B was suggesting. This is a sample run on the Ioniq 5 (which doesn't have unsolicited RX events).
This uses the call esp_timer_get_time() got get a 64bit *microseconds* since started value - and works out the time to execute that way. It's looking at absolute time and not time in the Task - so other things going on at the same time in other tasks will have an effect. (The normal tick count doesn't have nearly enough resolution to be useful - any other ideas on measurement?) I've got total accumulated time displaying in seconds and the average in milliseconds currently - but I can change that easy enough. The cumulative time is stored as uint64_t which will be plenty, as 32bit wouldn't be nearly enough.
OVMS# *poller time on* Poller timing is now on
OVMS# *poller time status* Poller timing is: on Poll [PRI] : n=390 tot=0.2s ave=0.586ms Poll [SRX] : n=316 tot=0.1s ave=0.196ms CAN1 RX[0778] : n=382 tot=0.2s ave=0.615ms CAN1 RX[07a8] : n=48 tot=0.0s ave=0.510ms CAN1 RX[07bb] : n=162 tot=0.1s ave=0.519ms CAN1 RX[07ce] : n=33 tot=0.0s ave=0.469ms CAN1 RX[07ea] : n=408 tot=0.2s ave=0.467ms CAN1 RX[07ec] : n=486 tot=0.2s ave=0.477ms CAN3 RX[07df] : n=769 tot=0.2s ave=0.261ms CAN1 TX[0770] : n=191 tot=0.0s ave=0.054ms CAN1 TX[07a0] : n=16 tot=0.0s ave=0.047ms CAN1 TX[07b3] : n=31 tot=0.0s ave=0.069ms CAN1 TX[07c6] : n=11 tot=0.0s ave=0.044ms CAN1 TX[07e2] : n=82 tot=0.0s ave=0.067ms CAN1 TX[07e4] : n=54 tot=0.0s ave=0.044ms Set State : n=7 tot=0.0s ave=0.104ms
This is probably going to be quite useful in general! The TX call-backs don't seem to be significant here. (oh, I should probably implement a reset of the values too).
//.ichael
On Sun, 12 May 2024 at 22:58, Michael Geddes < frog@bunyip.wheelycreek.net> wrote:
Yeah - I certainly wasn't going to put a hard limit. Just a log above a certain time, that being said, the idea of just collecting stats (being able to turn it on via a "poller timer" set of commands) would be much more useful. I'll look into that.
Average time is probably a good stat - and certainly what we care about.
I actually am hopeful that those couple of things I did might help reduce that average time quite a bit (that short-cutting the isotp protocol handling especially).
That p/r with logging changes might help reduce the unproductive log time further, but also makes it possible to turn on the poller logging without the RX task logs kicking in.
//.ichael
On Sun, 12 May 2024 at 22:29, Michael Balzer via OvmsDev < ovmsdev@lists.openvehicles.com> wrote:
> Warning / gathering debug statistics about slow processing can be > helpful, but there must not be a hard limit. Frame/poll response processing > may need disk or network I/O, and the vehicle task may be starving from > punctual high loads on higher priority tasks (e.g. networking) or by > needing to wait for some semaphore -- that's outside the application's > control, and must not lead to termination/recreation of the task (in case > you're heading towards that direction). > > I have no idea how much processing time the current vehicles > actually need in their respective worst cases. Your draft is probably too > lax, poll responses and frames normally need to be processed much faster. > I'd say 10 ms is already too slow, but any wait for a queue/semaphore will > already mean at least 10 ms (FreeRTOS tick). Probably best to begin with > just collecting stats. > > Btw, to help in narrowing down the actual problem case, the profiler > could collect max times per RX message ID. > > Regards, > Michael > > > Am 12.05.24 um 10:41 schrieb Michael Geddes: > > I have a question for Michael B (or whoever) - I have a commit > lined up that would add a bit of a time check to the poller loop. What do > we expect the maximum time to execute a poller loop command should be? > This is a rough idea (in ms) I have.. based on nothing much really, > so any ideas would be appreciated: > int TardyMaxTime_ms(OvmsPoller::OvmsPollEntryType entry_type) > { > switch (entry_type) > { > case OvmsPoller::OvmsPollEntryType::Poll: return 80; > case OvmsPoller::OvmsPollEntryType::FrameRx: return 30; > case OvmsPoller::OvmsPollEntryType::FrameTx: return 20; > case OvmsPoller::OvmsPollEntryType::Command: return 10; > case OvmsPoller::OvmsPollEntryType::PollState: return 15; > default: return 80; > } > } > > //.ichael > > On Mon, 6 May 2024 at 07:45, Michael Geddes < > frog@bunyip.wheelycreek.net> wrote: > >> I realise that I was only using the standard cable to test - which >> probably is not sufficient - I haven't looked closely at how the Leaf OBD >> to Db9 cable is different from standard. >> >> Ah, my bad out the queue length. We are definitely queueing more >> messages though. From my log of when the overflow happened, the poller >> was in state 0 which means OFF - ie nothing was being sent!! >> >> I'll look at the TX message thing - opt in sounds good - though it >> shouldn't be playing that much of a part here as the TXs are infrequent in >> this case (or zero when the leaf is off or driving) - On the ioniq 5 when >> I'm using the HUD - I'm polling quite frequently - multiple times per >> second and that seems to be fine!. >> >> I did find an issue with the throttling .. but it would still >> mostly apply the throttling where it matters, so again, it shouldn't be the >> problem (also, we aren't transmitting in the leaf case). >> >> The change I made to the logging of RX messages showed how many in >> a row were dropped... and it was mostly 1 only in a run - which means even >> if it is a short time between - that means that the drops are being >> interleaved by at least one success! >> >> Sooo.. I'm still wondering what is going on. Some things I'm going >> to try: >> >> * If the number of messages on the Can bus (coming in through RX) >> means that the queue is slowly getting longer and not quite catching up, >> then making the queue longer will help it last longer... but only pushes >> the problem down the road. >> - Add 'current queue length' to the poller status information to >> see if this is indeed the case? >> - Add some kind of alert when the queue reaches a % full? >> * Once you start overflowing and getting overflow log messages, I >> wonder if this is then contributing to the problem. >> - Push the overflow logging into Poller Task which can look at >> how many drops occurred since last received item. >> * Split up the flags for the poller messages into 2: >> - Messages that are/could be happening in the TX/RX tasks >> - Other noisy messages that always happen in the poller task. >> >> Thoughts on what else we might measure to figure out what is going >> on? >> >> //.ichael >> >> >> On Sun, 5 May 2024, 19:29 Michael Balzer via OvmsDev, < >> ovmsdev@lists.openvehicles.com> wrote: >> >>> Michael, >>> >>> the queue size isn't in bytes, it's in messages: >>> >>> * @param uxQueueLength The maximum number of items that the queue >>> can contain. >>> * >>> * @param uxItemSize The number of bytes each item in the queue >>> will require. >>> >>> >>> Also, from the time stamps in Dereks log excerpt, there were quite >>> some dropped frames in that time window -- at least 23 frames in 40 ms, >>> that's bad. >>> >>> Queue sizes are currently: >>> >>> CONFIG_OVMS_HW_CAN_RX_QUEUE_SIZE=60 >>> CONFIG_OVMS_VEHICLE_CAN_RX_QUEUE_SIZE=60 >>> >>> The new poller now channels all TX callbacks through the task >>> queue additionally to RX and commands. So setting the queue size to be >>> larger than the CAN RX queue size seems appropriate. >>> >>> Nevertheless, an overflow with more than 60 waiting messages still >>> indicates some too long processing time in the vehicle task. >>> >>> TX callbacks previously were done directly in the CAN context, and >>> no current vehicle overrides the empty default handler, so this imposed >>> almost no additional overhead. By requiring a queue entry for each TX >>> callback, this feature now has a potentially high impact for all vehicles. >>> If passing these to the task is actually necessary, it needs to become an >>> opt-in feature, so only vehicles subscribing to the callback actually need >>> to cope with that additional load & potential processing delays involved. >>> >>> Regards, >>> Michael >>> >>> > -- > Michael Balzer * Helkenberger Weg 9 * D-58256 Ennepetal > Fon 02333 / 833 5735 * Handy 0176 / 206 989 26 > > _______________________________________________ > OvmsDev mailing list > OvmsDev@lists.openvehicles.com > http://lists.openvehicles.com/mailman/listinfo/ovmsdev >
_______________________________________________ OvmsDev mailing listOvmsDev@lists.openvehicles.comhttp://lists.openvehicles.com/mailman/listinfo/ovmsdev
-- Michael Balzer * Helkenberger Weg 9 * D-58256 Ennepetal Fon 02333 / 833 5735 * Handy 0176 / 206 989 26
_______________________________________________ OvmsDev mailing list OvmsDev@lists.openvehicles.com http://lists.openvehicles.com/mailman/listinfo/ovmsdev
-- Michael Balzer * Helkenberger Weg 9 * D-58256 Ennepetal Fon 02333 / 833 5735 * Handy 0176 / 206 989 26
-- Michael Balzer * Helkenberger Weg 9 * D-58256 Ennepetal Fon 02333 / 833 5735 * Handy 0176 / 206 989 26
_______________________________________________ OvmsDev mailing list OvmsDev@lists.openvehicles.com http://lists.openvehicles.com/mailman/listinfo/ovmsdev
The notification works on my devices, it only has a garbled per mille character -- see attached screenshot. The same applies to the mail version:
Poller timing is: on Type | count | Utlztn | Time | per s | [‰] | [ms] ---------------+--------+--------+--------- Poll:PRI Avg| 0.25| 0.119| 0.382 Peak| | 0.513| 0.678 ---------------+--------+--------+--------- RxCan1[597] Avg| 0.01| 0.004| 0.021 Peak| | 0.000| 0.338 ---------------+--------+--------+--------- RxCan1[59b] Avg| 0.01| 0.011| 0.053 Peak| | 0.000| 0.848 ---------------+--------+--------+--------- Cmd:State Avg| 0.01| 0.002| 0.012 Peak| | 0.000| 0.120 ===============+========+========+========= Total Avg| 0.28| 0.135| 0.468
The encoding is a general issue. The character encoding for text messages via V2/MP is quite old & clumsy, it's got an issue with the degree celcius character as well. We previously tried to keep all text messages within the SMS safe character set (which e.g. lead to writing just "C" instead of "°C"). I'd say we should head towards UTF-8 now. If we ever refit SMS support, we can recode on the fly. Regarding not seeing the notification on your phone: a) Check your notification subtype/channel filters on the module. See https://docs.openvehicles.com/en/latest/userguide/notifications.html#suppres... b) Check your notification vehicle filters on the phone (menu on notification tab): if you enabled the vehicle filter, it will add the messages of not currently selected vehicles to the list only, but not raise a system notification. (Applies to the Android App, no idea about the iOS version) Regards, Michael Am 26.05.24 um 06:32 schrieb Michael Geddes:
Hi,
I'm trying to finalise this now .. and one last thing is that I don't get the report coming to my mobile. I'm using the command: MyNotify.NotifyString("info", "poller.report", buf.c_str());
Where the buffer string is just the same as the report output. Should I be using some other format or command? I get "alert" types (like the ioniq5 door-open alert) fine to my mobile.
Michael.
On Sun, 19 May 2024, 12:51 Michael Balzer via OvmsDev, <ovmsdev@lists.openvehicles.com> wrote:
A builtin web UI for this seems a bit over the top. Builtin web config pages should focus on user features, this is clearly a feature only needed during/for the development/extension of a vehicle adapter. Development features in the web UI are confusing for end users.
If persistent enabling/disabling is done by a simple config command (e.g. "config set can poller.trace on"), that's also doable by users.
Regards, Michael
Am 19.05.24 um 02:06 schrieb Michael Geddes:
I was so focused on how I calculated the value that I totally missed that ‰ would be a better description. I could also use the system 'Ratio' unit... so % or ‰.
I'll make space to put 'Avg' on the row. Was trying to limit the width for output on a mobile. I agree it would make it easier to understand. Totals also makes sense.
Should I make this a configuration that can be set on the web-page? I'd probably use a configuration change notification so that the very bit setting is sync'd with the 'configuration' value.
//.ichael
On Sat, 18 May 2024, 14:05 Michael Balzer, <dexter@expeedo.de> wrote:
I'm not sure whether the 'max' should be the maximum of the smoothed value.. or the maximum of the raw value.
It should normally be the maximum of the raw value I think, the maximum of the smoothed value cannot tell about how bad the processing of an ID can become.
The naming in the table is a bit confusing I think. (besides: I've never seen "ave" as the abbreviation for average)
If I understand you correctly, "time ms per s" is the time share in per mille, so something in that direction would be more clear, and "length ms" would then be "time [ms]".
The totals for all averages in the table foot would also be nice.
Maybe "Ave" (or avg?) also should be placed on the left, as the "peak" label now suggests being the peak of the average.
Btw, keep in mind, not all "edge" users / testers are developers (e.g. the Twizy driver I'm in contact with), collecting stats feedback for vehicles from testers should be straight forward. Maybe add a data/history record, sent automatically on every drive/charge stop when the poller tracing is on?
Regards, Michael
Am 18.05.24 um 02:28 schrieb Michael Geddes:
You did say max/pead value. I also halved the N for both. I'm not sure whether the 'max' should be the maximum of the smoothed value.. or the maximum of the raw value. This is currently the raw-value maximum. The problem is that the middle column is the maximum of the {{sum over 10s} / (10*1000,000) I could easily change the 'period' to 1s and see how that goes.. was just trying to reduce the larger calculations.
Usage: poller [pause|resume|status|times|trace]
OVMS# poller time status Poller timing is: on Type | Count | Ave time | Ave length | per s | ms per s | ms -------------+----------+-----------+----------- Poll:PRI | 1.00| 0.559| 0.543 peak | | 0.663| 1.528 -------------+----------+-----------+----------- Poll:SRX | 0.08| 0.009| 0.038 peak | | 0.068| 0.146 -------------+----------+-----------+----------- CAN1 RX[778] | 0.11| 0.061| 0.280 peak | | 0.458| 1.046 -------------+----------+-----------+----------- CAN1 RX[7a8] | 0.04| 0.024| 0.124 peak | | 0.160| 0.615 -------------+----------+-----------+----------- CAN1 TX[770] | 0.05| 0.004| 0.016 peak | | 0.022| 0.102 -------------+----------+-----------+----------- CAN1 TX[7a0] | 0.02| 0.002| 0.011 peak | | 0.010| 0.098 -------------+----------+-----------+----------- CAN1 TX[7b3] | 0.01| 0.001| 0.006 peak | | 0.000| 0.099 -------------+----------+-----------+----------- CAN1 TX[7e2] | 0.02| 0.002| 0.011 peak | | 0.010| 0.099 -------------+----------+-----------+----------- CAN1 TX[7e4] | 0.08| 0.008| 0.048 peak | | 0.049| 0.107 -------------+----------+-----------+----------- Cmd:State | 0.00| 0.000| 0.005 peak | | 0.000| 0.094
On Fri, 17 May 2024 at 15:26, Michael Geddes <frog@bunyip.wheelycreek.net> wrote:
This is what I have now. The one on the end is the one MIchael B was after using an N of 32. (up for discussion).
The middle is the time spent in that even t per second. It accumulates times (in microseconds), and then every 10s it stores it as smoothed (N=16) value. The Count is similar (except that we store a value of '100' as 1 event so it can be still integers and has 2 decimal places).
Every received poll does a 64bit difference to 32bit (for the elapsed time) and 64bit comparison (for end-of-period). It also does 1x 32bit smoothing and 2x 32bit adds.
Then at the end of a 10s period, it will do a 64bit add to get the next end-of-period value, as well as the 2x 32bit smoothing calcs.
This is from the Ioniq 5 so not any big values yet. You can certainly see how insignificant the TX callbacks are. I'll leave it on for when the car is moving and gets some faster polling.
OVMS# poll time status Poller timing is: on Type | Count | Ave time | Ave Length | per s | ms per s | ms -------------+----------+-----------+----------- Poll:PRI | 1.00| 0.540| 0.539 Poll:SRX | 0.03| 0.004| 0.017 CAN1 RX[778] | 0.06| 0.042| 0.175 CAN1 TX[770] | 0.04| 0.002| 0.008 Cmd:State | 0.01| 0.001| 0.005
----------------------8<--------------------------------
Nice smoothing class (forces N as a power of 2): constexpr unsigned floorlog2(unsigned x) { return x == 1 ? 0 : 1+floorlog2(x >> 1); } /* Maintain a smoothed average using shifts for division. * T should be an integer type * N needs to be a power of 2 */ template <typename T, unsigned N> class average_util_t { private: T m_ave; public: average_util_t() : m_ave(0) {} static const uint8_t _BITS = floorlog2(N); void add( T val) { static_assert(N == (1 << _BITS), "N must be a power of 2"); m_ave = (((N-1) * m_ave) + val) >> _BITS; } T get() { return m_ave; } operator T() { return m_ave; } };
On Thu, 16 May 2024 at 10:29, Michael Geddes <frog@bunyip.wheelycreek.net> wrote:
Thanks Michael,
My calculations give me ((2^32)-1) / (1000*1000*3600) = only 1.2 hours of processing time in 32bit. The initial subtraction is 64bit anyway and I can't see a further 64bit addition being a problem. I have the calculations being performed in doubles at print-out where performance is not really an issue anyway. (Though apparently doing 64 bit division is worse than floating point).
In addition * I currently have this being able to be turned on and off and reset manually (only do it when required).
* For the lower volume commands, the smoothed average is not going to be useful - the count is more interesting for different reasons.
* The total time is quite useful. Ie a high average time doesn't matter if the count is low. The things that are affecting performance are stuff with high total time. Stuff which is happening 100 times a second needs to be a much lower average than once a second.
* A measure like 'time per minute/second' and possibly count per minute/seconds as a smoothed average would potentially be more useful. (or in addition?) I think we could do _that_ in a reasonably efficient manner using a 64 bit 'last measured time', a 32 bit accumulated value and the stored 32 bit rolling average. It would boils down to some iterative (integer) sums and multiplications plus a divide by n ^ (time periods passed) - which is a shift - and which can be optimised to '0' if 'time-periods-passed' is more than 32/(bits-per-n) - effectively limiting the number of iterations. The one issue I can see is that we need to calculate 'number of time-periods passed' which is a 64 bit subtraction followed by a 32 bit division (not optimisable to a simple shift).
* I'm also happy to keep a rolling (32bit) average time. Even if you assume averages in the 100ms, 32bit is going to happily support an N of 64 or even 128. Am I right in thinking that the choice of N is highly dependent on frequency. For things happening 100 times per second, you might want an N like 128.. where things happening once per second, you might want an N of 4 or 8. The other things we keep track of in this manner we have a better idea of the frequency of the thing.
How about we have (per record type): * total count (since last reset?) (32 bit) * smoothed average of time per instance (32 bit)
* ?xx? total accumulated time since last reset (64bit) ?? <-- with the below stats this is much less useful
* last-measured-time (64 bit) * accumulated count since last time-period (16bit - but maybe 32bit anyway for byte alignment?) * smoothed average of count per time-period (32bit) * accumulated time since last time-period (32bit) * smoothed average of time per time-period (32bit)
It's possible to keep the
Is this going to be too much per record type? The number of 'records' we are keeping is quite low (so 10 to 20 maybe) - so it's not a huge memory burden.
Thoughts?
//.ichael On Thu, 16 May 2024 at 03:09, Michael Balzer via OvmsDev <ovmsdev@lists.openvehicles.com> wrote:
esp_timer_get_time() is the right choice for precision timing.
I'd say uint32 is enough though, even if counting microseconds that can hold a total of more than 71 hours of actual processing time. uint64 has a significant performance penalty, although I don't recall the overhead for simple additions.
Also & more important, the average wouldn't be my main focus, but the maximum processing time seen per ID, which seems to be missing in your draft.
Second thought on the average… the exact overall average really has a minor meaning, I'd rather see the current average, adapting to the current mode of operation (drive/charge/…). I suggest feeding the measurements to a low pass filter to get the smoothed average of the last n measurements. Pattern:
runavg = ((N-1) * runavg + newval) / N
By using a low power of 2 for N (e.g. 8 or 16), you can replace the division by a simple bit shift, and have enough headroom to use 32 bit integers.
Regards, Michael
Am 15.05.24 um 06:51 schrieb Michael Geddes via OvmsDev:
Formatting aside, I have implemented what I think Michael B was suggesting. This is a sample run on the Ioniq 5 (which doesn't have unsolicited RX events).
This uses the call esp_timer_get_time() got get a 64bit *microseconds* since started value - and works out the time to execute that way. It's looking at absolute time and not time in the Task - so other things going on at the same time in other tasks will have an effect. (The normal tick count doesn't have nearly enough resolution to be useful - any other ideas on measurement?) I've got total accumulated time displaying in seconds and the average in milliseconds currently - but I can change that easy enough. The cumulative time is stored as uint64_t which will be plenty, as 32bit wouldn't be nearly enough.
OVMS# *poller time on* Poller timing is now on
OVMS# *poller time status* Poller timing is: on Poll [PRI] : n=390 tot=0.2s ave=0.586ms Poll [SRX] : n=316 tot=0.1s ave=0.196ms CAN1 RX[0778] : n=382 tot=0.2s ave=0.615ms CAN1 RX[07a8] : n=48 tot=0.0s ave=0.510ms CAN1 RX[07bb] : n=162 tot=0.1s ave=0.519ms CAN1 RX[07ce] : n=33 tot=0.0s ave=0.469ms CAN1 RX[07ea] : n=408 tot=0.2s ave=0.467ms CAN1 RX[07ec] : n=486 tot=0.2s ave=0.477ms CAN3 RX[07df] : n=769 tot=0.2s ave=0.261ms CAN1 TX[0770] : n=191 tot=0.0s ave=0.054ms CAN1 TX[07a0] : n=16 tot=0.0s ave=0.047ms CAN1 TX[07b3] : n=31 tot=0.0s ave=0.069ms CAN1 TX[07c6] : n=11 tot=0.0s ave=0.044ms CAN1 TX[07e2] : n=82 tot=0.0s ave=0.067ms CAN1 TX[07e4] : n=54 tot=0.0s ave=0.044ms Set State : n=7 tot=0.0s ave=0.104ms
This is probably going to be quite useful in general! The TX call-backs don't seem to be significant here. (oh, I should probably implement a reset of the values too).
//.ichael
On Sun, 12 May 2024 at 22:58, Michael Geddes <frog@bunyip.wheelycreek.net> wrote:
Yeah - I certainly wasn't going to put a hard limit. Just a log above a certain time, that being said, the idea of just collecting stats (being able to turn it on via a "poller timer" set of commands) would be much more useful. I'll look into that.
Average time is probably a good stat - and certainly what we care about.
I actually am hopeful that those couple of things I did might help reduce that average time quite a bit (that short-cutting the isotp protocol handling especially).
That p/r with logging changes might help reduce the unproductive log time further, but also makes it possible to turn on the poller logging without the RX task logs kicking in.
//.ichael
On Sun, 12 May 2024 at 22:29, Michael Balzer via OvmsDev <ovmsdev@lists.openvehicles.com> wrote:
Warning / gathering debug statistics about slow processing can be helpful, but there must not be a hard limit. Frame/poll response processing may need disk or network I/O, and the vehicle task may be starving from punctual high loads on higher priority tasks (e.g. networking) or by needing to wait for some semaphore -- that's outside the application's control, and must not lead to termination/recreation of the task (in case you're heading towards that direction).
I have no idea how much processing time the current vehicles actually need in their respective worst cases. Your draft is probably too lax, poll responses and frames normally need to be processed much faster. I'd say 10 ms is already too slow, but any wait for a queue/semaphore will already mean at least 10 ms (FreeRTOS tick). Probably best to begin with just collecting stats.
Btw, to help in narrowing down the actual problem case, the profiler could collect max times per RX message ID.
Regards, Michael
Am 12.05.24 um 10:41 schrieb Michael Geddes:
I have a question for Michael B (or whoever) - I have a commit lined up that would add a bit of a time check to the poller loop. What do we expect the maximum time to execute a poller loop command should be? This is a rough idea (in ms) I have.. based on nothing much really, so any ideas would be appreciated: int TardyMaxTime_ms(OvmsPoller::OvmsPollEntryType entry_type) { switch (entry_type) { case OvmsPoller::OvmsPollEntryType::Poll: return 80; case OvmsPoller::OvmsPollEntryType::FrameRx: return 30; case OvmsPoller::OvmsPollEntryType::FrameTx: return 20; case OvmsPoller::OvmsPollEntryType::Command: return 10; case OvmsPoller::OvmsPollEntryType::PollState: return 15; default: return 80; } }
//.ichael
On Mon, 6 May 2024 at 07:45, Michael Geddes <frog@bunyip.wheelycreek.net> wrote:
I realise that I was only using the standard cable to test - which probably is not sufficient - I haven't looked closely at how the Leaf OBD to Db9 cable is different from standard.
Ah, my bad out the queue length. We are definitely queueing more messages though. From my log of when the overflow happened, the poller was in state 0 which means OFF - ie nothing was being sent!!
I'll look at the TX message thing - opt in sounds good - though it shouldn't be playing that much of a part here as the TXs are infrequent in this case (or zero when the leaf is off or driving) - On the ioniq 5 when I'm using the HUD - I'm polling quite frequently - multiple times per second and that seems to be fine!.
I did find an issue with the throttling .. but it would still mostly apply the throttling where it matters, so again, it shouldn't be the problem (also, we aren't transmitting in the leaf case).
The change I made to the logging of RX messages showed how many in a row were dropped... and it was mostly 1 only in a run - which means even if it is a short time between - that means that the drops are being interleaved by at least one success!
Sooo.. I'm still wondering what is going on. Some things I'm going to try:
* If the number of messages on the Can bus (coming in through RX) means that the queue is slowly getting longer and not quite catching up, then making the queue longer will help it last longer... but only pushes the problem down the road. - Add 'current queue length' to the poller status information to see if this is indeed the case? - Add some kind of alert when the queue reaches a % full? * Once you start overflowing and getting overflow log messages, I wonder if this is then contributing to the problem. - Push the overflow logging into Poller Task which can look at how many drops occurred since last received item. * Split up the flags for the poller messages into 2: - Messages that are/could be happening in the TX/RX tasks - Other noisy messages that always happen in the poller task.
Thoughts on what else we might measure to figure out what is going on?
//.ichael
On Sun, 5 May 2024, 19:29 Michael Balzer via OvmsDev, <ovmsdev@lists.openvehicles.com> wrote:
Michael,
the queue size isn't in bytes, it's in messages:
* @param uxQueueLength The maximum number of items that the queue can contain. * * @param uxItemSize The number of bytes each item in the queue will require.
Also, from the time stamps in Dereks log excerpt, there were quite some dropped frames in that time window -- at least 23 frames in 40 ms, that's bad.
Queue sizes are currently:
CONFIG_OVMS_HW_CAN_RX_QUEUE_SIZE=60 CONFIG_OVMS_VEHICLE_CAN_RX_QUEUE_SIZE=60
The new poller now channels all TX callbacks through the task queue additionally to RX and commands. So setting the queue size to be larger than the CAN RX queue size seems appropriate.
Nevertheless, an overflow with more than 60 waiting messages still indicates some too long processing time in the vehicle task.
TX callbacks previously were done directly in the CAN context, and no current vehicle overrides the empty default handler, so this imposed almost no additional overhead. By requiring a queue entry for each TX callback, this feature now has a potentially high impact for all vehicles. If passing these to the task is actually necessary, it needs to become an opt-in feature, so only vehicles subscribing to the callback actually need to cope with that additional load & potential processing delays involved.
Regards, Michael
-- Michael Balzer * Helkenberger Weg 9 * D-58256 Ennepetal Fon 02333 / 833 5735 * Handy 0176 / 206 989 26
_______________________________________________ OvmsDev mailing list OvmsDev@lists.openvehicles.com http://lists.openvehicles.com/mailman/listinfo/ovmsdev
_______________________________________________ OvmsDev mailing list OvmsDev@lists.openvehicles.com http://lists.openvehicles.com/mailman/listinfo/ovmsdev
-- Michael Balzer * Helkenberger Weg 9 * D-58256 Ennepetal Fon 02333 / 833 5735 * Handy 0176 / 206 989 26
_______________________________________________ OvmsDev mailing list OvmsDev@lists.openvehicles.com http://lists.openvehicles.com/mailman/listinfo/ovmsdev
-- Michael Balzer * Helkenberger Weg 9 * D-58256 Ennepetal Fon 02333 / 833 5735 * Handy 0176 / 206 989 26
-- Michael Balzer * Helkenberger Weg 9 * D-58256 Ennepetal Fon 02333 / 833 5735 * Handy 0176 / 206 989 26
_______________________________________________ OvmsDev mailing list OvmsDev@lists.openvehicles.com http://lists.openvehicles.com/mailman/listinfo/ovmsdev
-- Michael Balzer * Helkenberger Weg 9 * D-58256 Ennepetal Fon 02333 / 833 5735 * Handy 0176 / 206 989 26
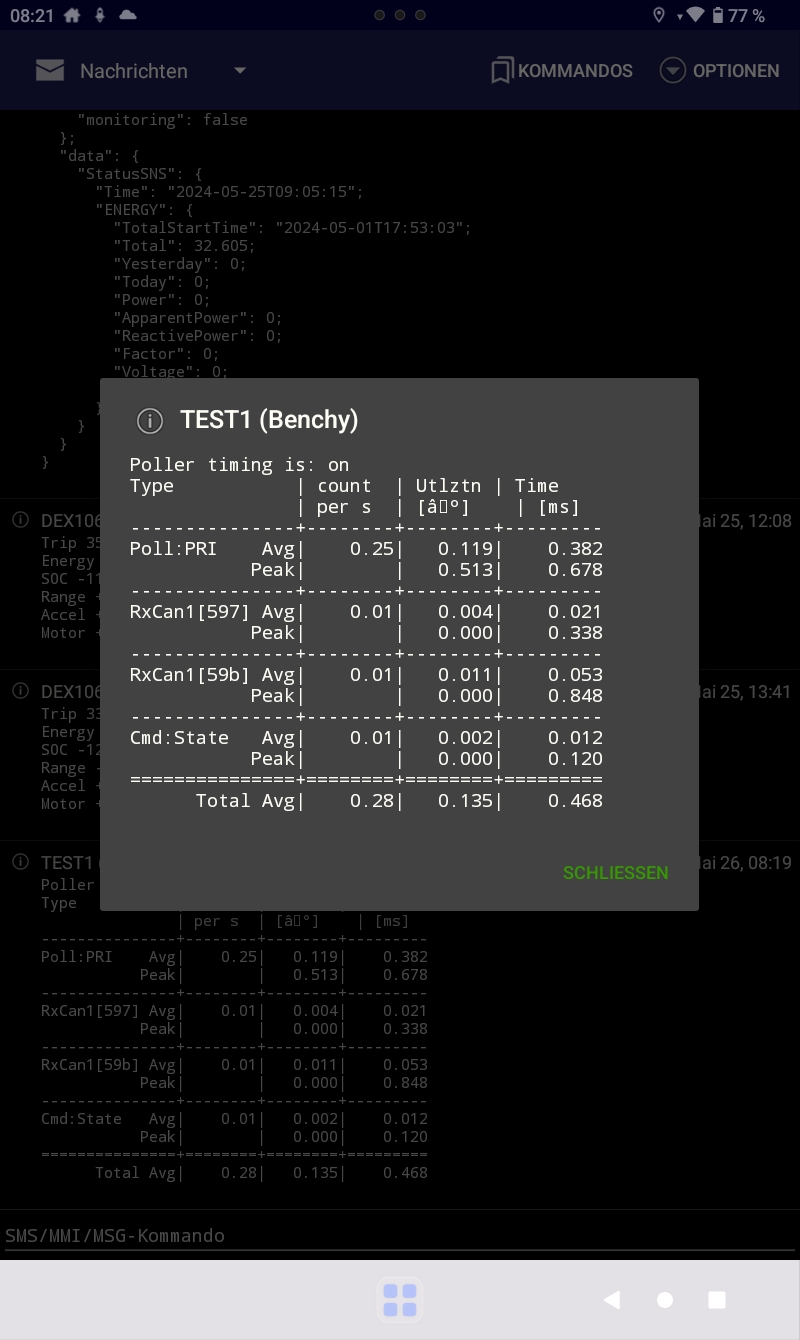
As the averages quickly decline when idle, an automatic report should probably also be sent on charge stop. Also, I think you should automatically reset the timer statistics on drive & charge start. First stats from charging my UpMiiGo: Type | count | Utlztn | Time | per s | [‰] | [ms] ---------------+--------+--------+--------- Poll:PRI Avg| 1.00| 0.723| 0.716 Peak| | 1.282| 3.822 ---------------+--------+--------+--------- Poll:SRX Avg| 7.72| 1.246| 0.184 Peak| | 3.128| 1.058 ---------------+--------+--------+--------- RxCan1[7ae] Avg| 2.48| 0.915| 0.362 Peak| | 1.217| 1.661 ---------------+--------+--------+--------- RxCan1[7cf] Avg| 4.76| 1.928| 0.397 Peak| | 2.317| 2.687 ---------------+--------+--------+--------- RxCan1[7ed] Avg| 3.38| 1.251| 0.327 Peak| | 8.154| 12.273 ---------------+--------+--------+--------- RxCan1[7ee] Avg| 0.21| 0.066| 0.297 Peak| | 0.225| 1.690 ---------------+--------+--------+--------- TxCan1[744] Avg| 1.49| 0.022| 0.011 Peak| | 0.032| 0.095 ---------------+--------+--------+--------- TxCan1[765] Avg| 3.89| 0.134| 0.027 Peak| | 0.155| 0.113 ---------------+--------+--------+--------- TxCan1[7e5] Avg| 2.32| 0.038| 0.013 Peak| | 0.295| 0.084 ---------------+--------+--------+--------- TxCan1[7e6] Avg| 0.21| 0.002| 0.008 Peak| | 0.010| 0.041 ---------------+--------+--------+--------- Cmd:State Avg| 0.00| 0.000| 0.007 Peak| | 0.005| 0.072 ===============+========+========+========= Total Avg| 27.46| 6.324| 2.349 Overall healthy I'd say, but let's see how it compares. 7ed is the BMS, the peak time is probably related to the extended cell data logging -- I've enabled log intervals for both cell voltages & temperatures. Regards, Michael Am 26.05.24 um 08:42 schrieb Michael Balzer via OvmsDev:
The notification works on my devices, it only has a garbled per mille character -- see attached screenshot. The same applies to the mail version:
Poller timing is: on Type | count | Utlztn | Time | per s | [‰] | [ms] ---------------+--------+--------+--------- Poll:PRI Avg| 0.25| 0.119| 0.382 Peak| | 0.513| 0.678 ---------------+--------+--------+--------- RxCan1[597] Avg| 0.01| 0.004| 0.021 Peak| | 0.000| 0.338 ---------------+--------+--------+--------- RxCan1[59b] Avg| 0.01| 0.011| 0.053 Peak| | 0.000| 0.848 ---------------+--------+--------+--------- Cmd:State Avg| 0.01| 0.002| 0.012 Peak| | 0.000| 0.120 ===============+========+========+========= Total Avg| 0.28| 0.135| 0.468
The encoding is a general issue. The character encoding for text messages via V2/MP is quite old & clumsy, it's got an issue with the degree celcius character as well. We previously tried to keep all text messages within the SMS safe character set (which e.g. lead to writing just "C" instead of "°C"). I'd say we should head towards UTF-8 now. If we ever refit SMS support, we can recode on the fly.
Regarding not seeing the notification on your phone:
a) Check your notification subtype/channel filters on the module. See https://docs.openvehicles.com/en/latest/userguide/notifications.html#suppres...
b) Check your notification vehicle filters on the phone (menu on notification tab): if you enabled the vehicle filter, it will add the messages of not currently selected vehicles to the list only, but not raise a system notification. (Applies to the Android App, no idea about the iOS version)
Regards, Michael
Am 26.05.24 um 06:32 schrieb Michael Geddes:
Hi,
I'm trying to finalise this now .. and one last thing is that I don't get the report coming to my mobile. I'm using the command: MyNotify.NotifyString("info", "poller.report", buf.c_str());
Where the buffer string is just the same as the report output. Should I be using some other format or command? I get "alert" types (like the ioniq5 door-open alert) fine to my mobile.
Michael.
On Sun, 19 May 2024, 12:51 Michael Balzer via OvmsDev, <ovmsdev@lists.openvehicles.com> wrote:
A builtin web UI for this seems a bit over the top. Builtin web config pages should focus on user features, this is clearly a feature only needed during/for the development/extension of a vehicle adapter. Development features in the web UI are confusing for end users.
If persistent enabling/disabling is done by a simple config command (e.g. "config set can poller.trace on"), that's also doable by users.
Regards, Michael
Am 19.05.24 um 02:06 schrieb Michael Geddes:
I was so focused on how I calculated the value that I totally missed that ‰ would be a better description. I could also use the system 'Ratio' unit... so % or ‰.
I'll make space to put 'Avg' on the row. Was trying to limit the width for output on a mobile. I agree it would make it easier to understand. Totals also makes sense.
Should I make this a configuration that can be set on the web-page? I'd probably use a configuration change notification so that the very bit setting is sync'd with the 'configuration' value.
//.ichael
On Sat, 18 May 2024, 14:05 Michael Balzer, <dexter@expeedo.de> wrote:
I'm not sure whether the 'max' should be the maximum of the smoothed value.. or the maximum of the raw value.
It should normally be the maximum of the raw value I think, the maximum of the smoothed value cannot tell about how bad the processing of an ID can become.
The naming in the table is a bit confusing I think. (besides: I've never seen "ave" as the abbreviation for average)
If I understand you correctly, "time ms per s" is the time share in per mille, so something in that direction would be more clear, and "length ms" would then be "time [ms]".
The totals for all averages in the table foot would also be nice.
Maybe "Ave" (or avg?) also should be placed on the left, as the "peak" label now suggests being the peak of the average.
Btw, keep in mind, not all "edge" users / testers are developers (e.g. the Twizy driver I'm in contact with), collecting stats feedback for vehicles from testers should be straight forward. Maybe add a data/history record, sent automatically on every drive/charge stop when the poller tracing is on?
Regards, Michael
Am 18.05.24 um 02:28 schrieb Michael Geddes:
You did say max/pead value. I also halved the N for both. I'm not sure whether the 'max' should be the maximum of the smoothed value.. or the maximum of the raw value. This is currently the raw-value maximum. The problem is that the middle column is the maximum of the {{sum over 10s} / (10*1000,000) I could easily change the 'period' to 1s and see how that goes.. was just trying to reduce the larger calculations.
Usage: poller [pause|resume|status|times|trace]
OVMS# poller time status Poller timing is: on Type | Count | Ave time | Ave length | per s | ms per s | ms -------------+----------+-----------+----------- Poll:PRI | 1.00| 0.559| 0.543 peak | | 0.663| 1.528 -------------+----------+-----------+----------- Poll:SRX | 0.08| 0.009| 0.038 peak | | 0.068| 0.146 -------------+----------+-----------+----------- CAN1 RX[778] | 0.11| 0.061| 0.280 peak | | 0.458| 1.046 -------------+----------+-----------+----------- CAN1 RX[7a8] | 0.04| 0.024| 0.124 peak | | 0.160| 0.615 -------------+----------+-----------+----------- CAN1 TX[770] | 0.05| 0.004| 0.016 peak | | 0.022| 0.102 -------------+----------+-----------+----------- CAN1 TX[7a0] | 0.02| 0.002| 0.011 peak | | 0.010| 0.098 -------------+----------+-----------+----------- CAN1 TX[7b3] | 0.01| 0.001| 0.006 peak | | 0.000| 0.099 -------------+----------+-----------+----------- CAN1 TX[7e2] | 0.02| 0.002| 0.011 peak | | 0.010| 0.099 -------------+----------+-----------+----------- CAN1 TX[7e4] | 0.08| 0.008| 0.048 peak | | 0.049| 0.107 -------------+----------+-----------+----------- Cmd:State | 0.00| 0.000| 0.005 peak | | 0.000| 0.094
On Fri, 17 May 2024 at 15:26, Michael Geddes <frog@bunyip.wheelycreek.net> wrote:
This is what I have now. The one on the end is the one MIchael B was after using an N of 32. (up for discussion).
The middle is the time spent in that even t per second. It accumulates times (in microseconds), and then every 10s it stores it as smoothed (N=16) value. The Count is similar (except that we store a value of '100' as 1 event so it can be still integers and has 2 decimal places).
Every received poll does a 64bit difference to 32bit (for the elapsed time) and 64bit comparison (for end-of-period). It also does 1x 32bit smoothing and 2x 32bit adds.
Then at the end of a 10s period, it will do a 64bit add to get the next end-of-period value, as well as the 2x 32bit smoothing calcs.
This is from the Ioniq 5 so not any big values yet. You can certainly see how insignificant the TX callbacks are. I'll leave it on for when the car is moving and gets some faster polling.
OVMS# poll time status Poller timing is: on Type | Count | Ave time | Ave Length | per s | ms per s | ms -------------+----------+-----------+----------- Poll:PRI | 1.00| 0.540| 0.539 Poll:SRX | 0.03| 0.004| 0.017 CAN1 RX[778] | 0.06| 0.042| 0.175 CAN1 TX[770] | 0.04| 0.002| 0.008 Cmd:State | 0.01| 0.001| 0.005
----------------------8<--------------------------------
Nice smoothing class (forces N as a power of 2): constexpr unsigned floorlog2(unsigned x) { return x == 1 ? 0 : 1+floorlog2(x >> 1); } /* Maintain a smoothed average using shifts for division. * T should be an integer type * N needs to be a power of 2 */ template <typename T, unsigned N> class average_util_t { private: T m_ave; public: average_util_t() : m_ave(0) {} static const uint8_t _BITS = floorlog2(N); void add( T val) { static_assert(N == (1 << _BITS), "N must be a power of 2"); m_ave = (((N-1) * m_ave) + val) >> _BITS; } T get() { return m_ave; } operator T() { return m_ave; } };
On Thu, 16 May 2024 at 10:29, Michael Geddes <frog@bunyip.wheelycreek.net> wrote:
Thanks Michael,
My calculations give me ((2^32)-1) / (1000*1000*3600) = only 1.2 hours of processing time in 32bit. The initial subtraction is 64bit anyway and I can't see a further 64bit addition being a problem. I have the calculations being performed in doubles at print-out where performance is not really an issue anyway. (Though apparently doing 64 bit division is worse than floating point).
In addition * I currently have this being able to be turned on and off and reset manually (only do it when required).
* For the lower volume commands, the smoothed average is not going to be useful - the count is more interesting for different reasons.
* The total time is quite useful. Ie a high average time doesn't matter if the count is low. The things that are affecting performance are stuff with high total time. Stuff which is happening 100 times a second needs to be a much lower average than once a second.
* A measure like 'time per minute/second' and possibly count per minute/seconds as a smoothed average would potentially be more useful. (or in addition?) I think we could do _that_ in a reasonably efficient manner using a 64 bit 'last measured time', a 32 bit accumulated value and the stored 32 bit rolling average. It would boils down to some iterative (integer) sums and multiplications plus a divide by n ^ (time periods passed) - which is a shift - and which can be optimised to '0' if 'time-periods-passed' is more than 32/(bits-per-n) - effectively limiting the number of iterations. The one issue I can see is that we need to calculate 'number of time-periods passed' which is a 64 bit subtraction followed by a 32 bit division (not optimisable to a simple shift).
* I'm also happy to keep a rolling (32bit) average time. Even if you assume averages in the 100ms, 32bit is going to happily support an N of 64 or even 128. Am I right in thinking that the choice of N is highly dependent on frequency. For things happening 100 times per second, you might want an N like 128.. where things happening once per second, you might want an N of 4 or 8. The other things we keep track of in this manner we have a better idea of the frequency of the thing.
How about we have (per record type): * total count (since last reset?) (32 bit) * smoothed average of time per instance (32 bit)
* ?xx? total accumulated time since last reset (64bit) ?? <-- with the below stats this is much less useful
* last-measured-time (64 bit) * accumulated count since last time-period (16bit - but maybe 32bit anyway for byte alignment?) * smoothed average of count per time-period (32bit) * accumulated time since last time-period (32bit) * smoothed average of time per time-period (32bit)
It's possible to keep the
Is this going to be too much per record type? The number of 'records' we are keeping is quite low (so 10 to 20 maybe) - so it's not a huge memory burden.
Thoughts?
//.ichael On Thu, 16 May 2024 at 03:09, Michael Balzer via OvmsDev <ovmsdev@lists.openvehicles.com> wrote:
esp_timer_get_time() is the right choice for precision timing.
I'd say uint32 is enough though, even if counting microseconds that can hold a total of more than 71 hours of actual processing time. uint64 has a significant performance penalty, although I don't recall the overhead for simple additions.
Also & more important, the average wouldn't be my main focus, but the maximum processing time seen per ID, which seems to be missing in your draft.
Second thought on the average… the exact overall average really has a minor meaning, I'd rather see the current average, adapting to the current mode of operation (drive/charge/…). I suggest feeding the measurements to a low pass filter to get the smoothed average of the last n measurements. Pattern:
runavg = ((N-1) * runavg + newval) / N
By using a low power of 2 for N (e.g. 8 or 16), you can replace the division by a simple bit shift, and have enough headroom to use 32 bit integers.
Regards, Michael
Am 15.05.24 um 06:51 schrieb Michael Geddes via OvmsDev:
Formatting aside, I have implemented what I think Michael B was suggesting. This is a sample run on the Ioniq 5 (which doesn't have unsolicited RX events).
This uses the call esp_timer_get_time() got get a 64bit *microseconds* since started value - and works out the time to execute that way. It's looking at absolute time and not time in the Task - so other things going on at the same time in other tasks will have an effect. (The normal tick count doesn't have nearly enough resolution to be useful - any other ideas on measurement?) I've got total accumulated time displaying in seconds and the average in milliseconds currently - but I can change that easy enough. The cumulative time is stored as uint64_t which will be plenty, as 32bit wouldn't be nearly enough.
OVMS# *poller time on* Poller timing is now on
OVMS# *poller time status* Poller timing is: on Poll [PRI] : n=390 tot=0.2s ave=0.586ms Poll [SRX] : n=316 tot=0.1s ave=0.196ms CAN1 RX[0778] : n=382 tot=0.2s ave=0.615ms CAN1 RX[07a8] : n=48 tot=0.0s ave=0.510ms CAN1 RX[07bb] : n=162 tot=0.1s ave=0.519ms CAN1 RX[07ce] : n=33 tot=0.0s ave=0.469ms CAN1 RX[07ea] : n=408 tot=0.2s ave=0.467ms CAN1 RX[07ec] : n=486 tot=0.2s ave=0.477ms CAN3 RX[07df] : n=769 tot=0.2s ave=0.261ms CAN1 TX[0770] : n=191 tot=0.0s ave=0.054ms CAN1 TX[07a0] : n=16 tot=0.0s ave=0.047ms CAN1 TX[07b3] : n=31 tot=0.0s ave=0.069ms CAN1 TX[07c6] : n=11 tot=0.0s ave=0.044ms CAN1 TX[07e2] : n=82 tot=0.0s ave=0.067ms CAN1 TX[07e4] : n=54 tot=0.0s ave=0.044ms Set State : n=7 tot=0.0s ave=0.104ms
This is probably going to be quite useful in general! The TX call-backs don't seem to be significant here. (oh, I should probably implement a reset of the values too).
//.ichael
On Sun, 12 May 2024 at 22:58, Michael Geddes <frog@bunyip.wheelycreek.net> wrote:
Yeah - I certainly wasn't going to put a hard limit. Just a log above a certain time, that being said, the idea of just collecting stats (being able to turn it on via a "poller timer" set of commands) would be much more useful. I'll look into that.
Average time is probably a good stat - and certainly what we care about.
I actually am hopeful that those couple of things I did might help reduce that average time quite a bit (that short-cutting the isotp protocol handling especially).
That p/r with logging changes might help reduce the unproductive log time further, but also makes it possible to turn on the poller logging without the RX task logs kicking in.
//.ichael
On Sun, 12 May 2024 at 22:29, Michael Balzer via OvmsDev <ovmsdev@lists.openvehicles.com> wrote:
Warning / gathering debug statistics about slow processing can be helpful, but there must not be a hard limit. Frame/poll response processing may need disk or network I/O, and the vehicle task may be starving from punctual high loads on higher priority tasks (e.g. networking) or by needing to wait for some semaphore -- that's outside the application's control, and must not lead to termination/recreation of the task (in case you're heading towards that direction).
I have no idea how much processing time the current vehicles actually need in their respective worst cases. Your draft is probably too lax, poll responses and frames normally need to be processed much faster. I'd say 10 ms is already too slow, but any wait for a queue/semaphore will already mean at least 10 ms (FreeRTOS tick). Probably best to begin with just collecting stats.
Btw, to help in narrowing down the actual problem case, the profiler could collect max times per RX message ID.
Regards, Michael
Am 12.05.24 um 10:41 schrieb Michael Geddes:
I have a question for Michael B (or whoever) - I have a commit lined up that would add a bit of a time check to the poller loop. What do we expect the maximum time to execute a poller loop command should be? This is a rough idea (in ms) I have.. based on nothing much really, so any ideas would be appreciated: int TardyMaxTime_ms(OvmsPoller::OvmsPollEntryType entry_type) { switch (entry_type) { case OvmsPoller::OvmsPollEntryType::Poll: return 80; case OvmsPoller::OvmsPollEntryType::FrameRx: return 30; case OvmsPoller::OvmsPollEntryType::FrameTx: return 20; case OvmsPoller::OvmsPollEntryType::Command: return 10; case OvmsPoller::OvmsPollEntryType::PollState: return 15; default: return 80; } }
//.ichael
On Mon, 6 May 2024 at 07:45, Michael Geddes <frog@bunyip.wheelycreek.net> wrote:
I realise that I was only using the standard cable to test - which probably is not sufficient - I haven't looked closely at how the Leaf OBD to Db9 cable is different from standard.
Ah, my bad out the queue length. We are definitely queueing more messages though. From my log of when the overflow happened, the poller was in state 0 which means OFF - ie nothing was being sent!!
I'll look at the TX message thing - opt in sounds good - though it shouldn't be playing that much of a part here as the TXs are infrequent in this case (or zero when the leaf is off or driving) - On the ioniq 5 when I'm using the HUD - I'm polling quite frequently - multiple times per second and that seems to be fine!.
I did find an issue with the throttling .. but it would still mostly apply the throttling where it matters, so again, it shouldn't be the problem (also, we aren't transmitting in the leaf case).
The change I made to the logging of RX messages showed how many in a row were dropped... and it was mostly 1 only in a run - which means even if it is a short time between - that means that the drops are being interleaved by at least one success!
Sooo.. I'm still wondering what is going on. Some things I'm going to try:
* If the number of messages on the Can bus (coming in through RX) means that the queue is slowly getting longer and not quite catching up, then making the queue longer will help it last longer... but only pushes the problem down the road. - Add 'current queue length' to the poller status information to see if this is indeed the case? - Add some kind of alert when the queue reaches a % full? * Once you start overflowing and getting overflow log messages, I wonder if this is then contributing to the problem. - Push the overflow logging into Poller Task which can look at how many drops occurred since last received item. * Split up the flags for the poller messages into 2: - Messages that are/could be happening in the TX/RX tasks - Other noisy messages that always happen in the poller task.
Thoughts on what else we might measure to figure out what is going on?
//.ichael
On Sun, 5 May 2024, 19:29 Michael Balzer via OvmsDev, <ovmsdev@lists.openvehicles.com> wrote:
Michael,
the queue size isn't in bytes, it's in messages:
> * @param uxQueueLength The > maximum number of items that > the queue can contain. > * > * @param uxItemSize The > number of bytes each item in > the queue will require.
Also, from the time stamps in Dereks log excerpt, there were quite some dropped frames in that time window -- at least 23 frames in 40 ms, that's bad.
Queue sizes are currently:
CONFIG_OVMS_HW_CAN_RX_QUEUE_SIZE=60 CONFIG_OVMS_VEHICLE_CAN_RX_QUEUE_SIZE=60
The new poller now channels all TX callbacks through the task queue additionally to RX and commands. So setting the queue size to be larger than the CAN RX queue size seems appropriate.
Nevertheless, an overflow with more than 60 waiting messages still indicates some too long processing time in the vehicle task.
TX callbacks previously were done directly in the CAN context, and no current vehicle overrides the empty default handler, so this imposed almost no additional overhead. By requiring a queue entry for each TX callback, this feature now has a potentially high impact for all vehicles. If passing these to the task is actually necessary, it needs to become an opt-in feature, so only vehicles subscribing to the callback actually need to cope with that additional load & potential processing delays involved.
Regards, Michael
-- Michael Balzer * Helkenberger Weg 9 * D-58256 Ennepetal Fon 02333 / 833 5735 * Handy 0176 / 206 989 26
_______________________________________________ OvmsDev mailing list OvmsDev@lists.openvehicles.com http://lists.openvehicles.com/mailman/listinfo/ovmsdev
_______________________________________________ OvmsDev mailing list OvmsDev@lists.openvehicles.com http://lists.openvehicles.com/mailman/listinfo/ovmsdev
-- Michael Balzer * Helkenberger Weg 9 * D-58256 Ennepetal Fon 02333 / 833 5735 * Handy 0176 / 206 989 26
_______________________________________________ OvmsDev mailing list OvmsDev@lists.openvehicles.com http://lists.openvehicles.com/mailman/listinfo/ovmsdev
-- Michael Balzer * Helkenberger Weg 9 * D-58256 Ennepetal Fon 02333 / 833 5735 * Handy 0176 / 206 989 26
-- Michael Balzer * Helkenberger Weg 9 * D-58256 Ennepetal Fon 02333 / 833 5735 * Handy 0176 / 206 989 26
_______________________________________________ OvmsDev mailing list OvmsDev@lists.openvehicles.com http://lists.openvehicles.com/mailman/listinfo/ovmsdev
-- Michael Balzer * Helkenberger Weg 9 * D-58256 Ennepetal Fon 02333 / 833 5735 * Handy 0176 / 206 989 26
_______________________________________________ OvmsDev mailing list OvmsDev@lists.openvehicles.com http://lists.openvehicles.com/mailman/listinfo/ovmsdev
-- Michael Balzer * Helkenberger Weg 9 * D-58256 Ennepetal Fon 02333 / 833 5735 * Handy 0176 / 206 989 26
It _should_ already be sending a report on charge stop. MyEvents.RegisterEvent(TAG, "vehicle.charge.stop", std::bind(&OvmsPollers::VehicleChargeStop, this, _1, _2)); Reset on charge start/vehicle on is a good idea. A question – would it be silly if the first value after a reset, rather than using 0 average to start with, if the average got set to the initial value? I’m in 2 minds about it. It would make the average more useful quicker. //.ichael On Sun, 26 May 2024, 19:39 Michael Balzer via OvmsDev, <ovmsdev@lists.openvehicles.com <mailto:ovmsdev@lists.openvehicles.com> > wrote: As the averages quickly decline when idle, an automatic report should probably also be sent on charge stop. Also, I think you should automatically reset the timer statistics on drive & charge start. First stats from charging my UpMiiGo: Type | count | Utlztn | Time | per s | [‰] | [ms] ---------------+--------+--------+--------- Poll:PRI Avg| 1.00| 0.723| 0.716 Peak| | 1.282| 3.822 ---------------+--------+--------+--------- Poll:SRX Avg| 7.72| 1.246| 0.184 Peak| | 3.128| 1.058 ---------------+--------+--------+--------- RxCan1[7ae] Avg| 2.48| 0.915| 0.362 Peak| | 1.217| 1.661 ---------------+--------+--------+--------- RxCan1[7cf] Avg| 4.76| 1.928| 0.397 Peak| | 2.317| 2.687 ---------------+--------+--------+--------- RxCan1[7ed] Avg| 3.38| 1.251| 0.327 Peak| | 8.154| 12.273 ---------------+--------+--------+--------- RxCan1[7ee] Avg| 0.21| 0.066| 0.297 Peak| | 0.225| 1.690 ---------------+--------+--------+--------- TxCan1[744] Avg| 1.49| 0.022| 0.011 Peak| | 0.032| 0.095 ---------------+--------+--------+--------- TxCan1[765] Avg| 3.89| 0.134| 0.027 Peak| | 0.155| 0.113 ---------------+--------+--------+--------- TxCan1[7e5] Avg| 2.32| 0.038| 0.013 Peak| | 0.295| 0.084 ---------------+--------+--------+--------- TxCan1[7e6] Avg| 1 0.21| 0.002| 0.008 Peak| | 0.010| 0.041 ---------------+--------+--------+--------- Cmd:State Avg| 0.00| 0.000| 0.007 Peak| | 0.005| 0.072 ===============+========+========+========= Total Avg| 27.46| 6.324| 2.349 Overall healthy I'd say, but let's see how it compares. 7ed is the BMS, the peak time is probably related to the extended cell data logging -- I've enabled log intervals for both cell voltages & temperatures. Regards, Michael Am 26.05.24 um 08:42 schrieb Michael Balzer via OvmsDev: The notification works on my devices, it only has a garbled per mille character -- see attached screenshot. The same applies to the mail version: Poller timing is: on Type | count | Utlztn | Time | per s | [‰] | [ms] ---------------+--------+--------+--------- Poll:PRI Avg| 0.25| 0.119| 0.382 Peak| | 0.513| 0.678 ---------------+--------+--------+--------- RxCan1[597] Avg| 0.01| 0.004| 0.021 Peak| | 0.000| 0.338 ---------------+--------+--------+--------- RxCan1[59b] Avg| 0.01| 0.011| 0.053 Peak| | 0.000| 0.848 ---------------+--------+--------+--------- Cmd:State Avg| 0.01| 0.002| 0.012 Peak| | 0.000| 0.120 ===============+========+========+========= Total Avg| 0.28| 0.135| 0.468 The encoding is a general issue. The character encoding for text messages via V2/MP is quite old & clumsy, it's got an issue with the degree celcius character as well. We previously tried to keep all text messages within the SMS safe character set (which e.g. lead to writing just "C" instead of "°C"). I'd say we should head towards UTF-8 now. If we ever refit SMS support, we can recode on the fly. Regarding not seeing the notification on your phone: a) Check your notification subtype/channel filters on the module. See https://docs.openvehicles.com/en/latest/userguide/notifications.html#suppres... b) Check your notification vehicle filters on the phone (menu on notification tab): if you enabled the vehicle filter, it will add the messages of not currently selected vehicles to the list only, but not raise a system notification. (Applies to the Android App, no idea about the iOS version) Regards, Michael Am 26.05.24 um 06:32 schrieb Michael Geddes: Hi, I'm trying to finalise this now .. and one last thing is that I don't get the report coming to my mobile. I'm using the command: MyNotify.NotifyString("info", "poller.report", buf.c_str()); Where the buffer string is just the same as the report output. Should I be using some other format or command? I get "alert" types (like the ioniq5 door-open alert) fine to my mobile. Michael. On Sun, 19 May 2024, 12:51 Michael Balzer via OvmsDev, <ovmsdev@lists.openvehicles.com <mailto:ovmsdev@lists.openvehicles.com> > wrote: A builtin web UI for this seems a bit over the top. Builtin web config pages should focus on user features, this is clearly a feature only needed during/for the development/extension of a vehicle adapter. Development features in the web UI are confusing for end users. If persistent enabling/disabling is done by a simple config command (e.g. "config set can poller.trace on"), that's also doable by users. Regards, Michael Am 19.05.24 um 02:06 schrieb Michael Geddes: I was so focused on how I calculated the value that I totally missed that ‰ would be a better description. I could also use the system 'Ratio' unit... so % or ‰. I'll make space to put 'Avg' on the row. Was trying to limit the width for output on a mobile. I agree it would make it easier to understand. Totals also makes sense. Should I make this a configuration that can be set on the web-page? I'd probably use a configuration change notification so that the very bit setting is sync'd with the 'configuration' value. //.ichael On Sat, 18 May 2024, 14:05 Michael Balzer, <dexter@expeedo.de <mailto:dexter@expeedo.de> > wrote: I'm not sure whether the 'max' should be the maximum of the smoothed value.. or the maximum of the raw value. It should normally be the maximum of the raw value I think, the maximum of the smoothed value cannot tell about how bad the processing of an ID can become. The naming in the table is a bit confusing I think. (besides: I've never seen "ave" as the abbreviation for average) If I understand you correctly, "time ms per s" is the time share in per mille, so something in that direction would be more clear, and "length ms" would then be "time [ms]". The totals for all averages in the table foot would also be nice. Maybe "Ave" (or avg?) also should be placed on the left, as the "peak" label now suggests being the peak of the average. Btw, keep in mind, not all "edge" users / testers are developers (e.g. the Twizy driver I'm in contact with), collecting stats feedback for vehicles from testers should be straight forward. Maybe add a data/history record, sent automatically on every drive/charge stop when the poller tracing is on? Regards, Michael Am 18.05.24 um 02:28 schrieb Michael Geddes: You did say max/pead value. I also halved the N for both. I'm not sure whether the 'max' should be the maximum of the smoothed value.. or the maximum of the raw value. This is currently the raw-value maximum. The problem is that the middle column is the maximum of the {{sum over 10s} / (10*1000,000) I could easily change the 'period' to 1s and see how that goes.. was just trying to reduce the larger calculations. Usage: poller [pause|resume|status|times|trace] OVMS# poller time status Poller timing is: on Type | Count | Ave time | Ave length | per s | ms per s | ms -------------+----------+-----------+----------- Poll:PRI | 1.00| 0.559| 0.543 peak | | 0.663| 1.528 -------------+----------+-----------+----------- Poll:SRX | 0.08| 0.009| 0.038 peak | | 0.068| 0.146 -------------+----------+-----------+----------- CAN1 RX[778] | 0.11| 0.061| 0.280 peak | | 0.458| 1.046 -------------+----------+-----------+----------- CAN1 RX[7a8] | 0.04| 0.024| 0.124 peak | | 0.160| 0.615 -------------+----------+-----------+----------- CAN1 TX[770] | 0.05| 0.004| 0.016 peak | | 0.022| 0.102 -------------+----------+-----------+----------- CAN1 TX[7a0] | 0.02| 0.002| 0.011 peak | | 0.010| 0.098 -------------+----------+-----------+----------- CAN1 TX[7b3] | 0.01| 0.001| 0.006 peak | | 0.000| 0.099 -------------+----------+-----------+----------- CAN1 TX[7e2] | 0.02| 0.002| 0.011 peak | | 0.010| 0.099 -------------+----------+-----------+----------- CAN1 TX[7e4] | 0.08| 0.008| 0.048 peak | | 0.049| 0.107 -------------+----------+-----------+----------- Cmd:State | 0.00| 0.000| 0.005 peak | | 0.000| 0.094 On Fri, 17 May 2024 at 15:26, Michael Geddes <frog@bunyip.wheelycreek.net <mailto:frog@bunyip.wheelycreek.net> > wrote: This is what I have now. The one on the end is the one MIchael B was after using an N of 32. (up for discussion). The middle is the time spent in that even t per second. It accumulates times (in microseconds), and then every 10s it stores it as smoothed (N=16) value. The Count is similar (except that we store a value of '100' as 1 event so it can be still integers and has 2 decimal places). Every received poll does a 64bit difference to 32bit (for the elapsed time) and 64bit comparison (for end-of-period). It also does 1x 32bit smoothing and 2x 32bit adds. Then at the end of a 10s period, it will do a 64bit add to get the next end-of-period value, as well as the 2x 32bit smoothing calcs. This is from the Ioniq 5 so not any big values yet. You can certainly see how insignificant the TX callbacks are. I'll leave it on for when the car is moving and gets some faster polling. OVMS# poll time status Poller timing is: on Type | Count | Ave time | Ave Length | per s | ms per s | ms -------------+----------+-----------+----------- Poll:PRI | 1.00| 0.540| 0.539 Poll:SRX | 0.03| 0.004| 0.017 CAN1 RX[778] | 0.06| 0.042| 0.175 CAN1 TX[770] | 0.04| 0.002| 0.008 Cmd:State | 0.01| 0.001| 0.005 ----------------------8<-------------------------------- Nice smoothing class (forces N as a power of 2): constexpr unsigned floorlog2(unsigned x) { return x == 1 ? 0 : 1+floorlog2(x >> 1); } /* Maintain a smoothed average using shifts for division. * T should be an integer type * N needs to be a power of 2 */ template <typename T, unsigned N> class average_util_t { private: T m_ave; public: average_util_t() : m_ave(0) {} static const uint8_t _BITS = floorlog2(N); void add( T val) { static_assert(N == (1 << _BITS), "N must be a power of 2"); m_ave = (((N-1) * m_ave) + val) >> _BITS; } T get() { return m_ave; } operator T() { return m_ave; } }; On Thu, 16 May 2024 at 10:29, Michael Geddes <frog@bunyip.wheelycreek.net <mailto:frog@bunyip.wheelycreek.net> > wrote: Thanks Michael, My calculations give me ((2^32)-1) / (1000*1000*3600) = only 1.2 hours of processing time in 32bit. The initial subtraction is 64bit anyway and I can't see a further 64bit addition being a problem. I have the calculations being performed in doubles at print-out where performance is not really an issue anyway. (Though apparently doing 64 bit division is worse than floating point). In addition * I currently have this being able to be turned on and off and reset manually (only do it when required). * For the lower volume commands, the smoothed average is not going to be useful - the count is more interesting for different reasons. * The total time is quite useful. Ie a high average time doesn't matter if the count is low. The things that are affecting performance are stuff with high total time. Stuff which is happening 100 times a second needs to be a much lower average than once a second. * A measure like 'time per minute/second' and possibly count per minute/seconds as a smoothed average would potentially be more useful. (or in addition?) I think we could do _that_ in a reasonably efficient manner using a 64 bit 'last measured time', a 32 bit accumulated value and the stored 32 bit rolling average. It would boils down to some iterative (integer) sums and multiplications plus a divide by n ^ (time periods passed) - which is a shift - and which can be optimised to '0' if 'time-periods-passed' is more than 32/(bits-per-n) - effectively limiting the number of iterations. The one issue I can see is that we need to calculate 'number of time-periods passed' which is a 64 bit subtraction followed by a 32 bit division (not optimisable to a simple shift). * I'm also happy to keep a rolling (32bit) average time. Even if you assume averages in the 100ms, 32bit is going to happily support an N of 64 or even 128. Am I right in thinking that the choice of N is highly dependent on frequency. For things happening 100 times per second, you might want an N like 128.. where things happening once per second, you might want an N of 4 or 8. The other things we keep track of in this manner we have a better idea of the frequency of the thing. How about we have (per record type): * total count (since last reset?) (32 bit) * smoothed average of time per instance (32 bit) * ?xx? total accumulated time since last reset (64bit) ?? <-- with the below stats this is much less useful * last-measured-time (64 bit) * accumulated count since last time-period (16bit - but maybe 32bit anyway for byte alignment?) * smoothed average of count per time-period (32bit) * accumulated time since last time-period (32bit) * smoothed average of time per time-period (32bit) It's possible to keep the Is this going to be too much per record type? The number of 'records' we are keeping is quite low (so 10 to 20 maybe) - so it's not a huge memory burden. Thoughts? //.ichael On Thu, 16 May 2024 at 03:09, Michael Balzer via OvmsDev <ovmsdev@lists.openvehicles.com <mailto:ovmsdev@lists.openvehicles.com> > wrote: esp_timer_get_time() is the right choice for precision timing. I'd say uint32 is enough though, even if counting microseconds that can hold a total of more than 71 hours of actual processing time. uint64 has a significant performance penalty, although I don't recall the overhead for simple additions. Also & more important, the average wouldn't be my main focus, but the maximum processing time seen per ID, which seems to be missing in your draft. Second thought on the average… the exact overall average really has a minor meaning, I'd rather see the current average, adapting to the current mode of operation (drive/charge/…). I suggest feeding the measurements to a low pass filter to get the smoothed average of the last n measurements. Pattern: runavg = ((N-1) * runavg + newval) / N By using a low power of 2 for N (e.g. 8 or 16), you can replace the division by a simple bit shift, and have enough headroom to use 32 bit integers. Regards, Michael Am 15.05.24 um 06:51 schrieb Michael Geddes via OvmsDev: Formatting aside, I have implemented what I think Michael B was suggesting. This is a sample run on the Ioniq 5 (which doesn't have unsolicited RX events). This uses the call esp_timer_get_time() got get a 64bit microseconds since started value - and works out the time to execute that way. It's looking at absolute time and not time in the Task - so other things going on at the same time in other tasks will have an effect. (The normal tick count doesn't have nearly enough resolution to be useful - any other ideas on measurement?) I've got total accumulated time displaying in seconds and the average in milliseconds currently - but I can change that easy enough. The cumulative time is stored as uint64_t which will be plenty, as 32bit wouldn't be nearly enough. OVMS# poller time on Poller timing is now on OVMS# poller time status Poller timing is: on Poll [PRI] : n=390 tot=0.2s ave=0.586ms Poll [SRX] : n=316 tot=0.1s ave=0.196ms CAN1 RX[0778] : n=382 tot=0.2s ave=0.615ms CAN1 RX[07a8] : n=48 tot=0.0s ave=0.510ms CAN1 RX[07bb] : n=162 tot=0.1s ave=0.519ms CAN1 RX[07ce] : n=33 tot=0.0s ave=0.469ms CAN1 RX[07ea] : n=408 tot=0.2s ave=0.467ms CAN1 RX[07ec] : n=486 tot=0.2s ave=0.477ms CAN3 RX[07df] : n=769 tot=0.2s ave=0.261ms CAN1 TX[0770] : n=191 tot=0.0s ave=0.054ms CAN1 TX[07a0] : n=16 tot=0.0s ave=0.047ms CAN1 TX[07b3] : n=31 tot=0.0s ave=0.069ms CAN1 TX[07c6] : n=11 tot=0.0s ave=0.044ms CAN1 TX[07e2] : n=82 tot=0.0s ave=0.067ms CAN1 TX[07e4] : n=54 tot=0.0s ave=0.044ms Set State : n=7 tot=0.0s ave=0.104ms This is probably going to be quite useful in general! The TX call-backs don't seem to be significant here. (oh, I should probably implement a reset of the values too). //.ichael On Sun, 12 May 2024 at 22:58, Michael Geddes <frog@bunyip.wheelycreek.net <mailto:frog@bunyip.wheelycreek.net> > wrote: Yeah - I certainly wasn't going to put a hard limit. Just a log above a certain time, that being said, the idea of just collecting stats (being able to turn it on via a "poller timer" set of commands) would be much more useful. I'll look into that. Average time is probably a good stat - and certainly what we care about. I actually am hopeful that those couple of things I did might help reduce that average time quite a bit (that short-cutting the isotp protocol handling especially). That p/r with logging changes might help reduce the unproductive log time further, but also makes it possible to turn on the poller logging without the RX task logs kicking in. //.ichael On Sun, 12 May 2024 at 22:29, Michael Balzer via OvmsDev <ovmsdev@lists.openvehicles.com <mailto:ovmsdev@lists.openvehicles.com> > wrote: Warning / gathering debug statistics about slow processing can be helpful, but there must not be a hard limit. Frame/poll response processing may need disk or network I/O, and the vehicle task may be starving from punctual high loads on higher priority tasks (e.g. networking) or by needing to wait for some semaphore -- that's outside the application's control, and must not lead to termination/recreation of the task (in case you're heading towards that direction). I have no idea how much processing time the current vehicles actually need in their respective worst cases. Your draft is probably too lax, poll responses and frames normally need to be processed much faster. I'd say 10 ms is already too slow, but any wait for a queue/semaphore will already mean at least 10 ms (FreeRTOS tick). Probably best to begin with just collecting stats. Btw, to help in narrowing down the actual problem case, the profiler could collect max times per RX message ID. Regards, Michael Am 12.05.24 um 10:41 schrieb Michael Geddes: I have a question for Michael B (or whoever) - I have a commit lined up that would add a bit of a time check to the poller loop. What do we expect the maximum time to execute a poller loop command should be? This is a rough idea (in ms) I have.. based on nothing much really, so any ideas would be appreciated: int TardyMaxTime_ms(OvmsPoller::OvmsPollEntryType entry_type) { switch (entry_type) { case OvmsPoller::OvmsPollEntryType::Poll: return 80; case OvmsPoller::OvmsPollEntryType::FrameRx: return 30; case OvmsPoller::OvmsPollEntryType::FrameTx: return 20; case OvmsPoller::OvmsPollEntryType::Command: return 10; case OvmsPoller::OvmsPollEntryType::PollState: return 15; default: return 80; } } //.ichael On Mon, 6 May 2024 at 07:45, Michael Geddes <frog@bunyip.wheelycreek.net <mailto:frog@bunyip.wheelycreek.net> > wrote: I realise that I was only using the standard cable to test - which probably is not sufficient - I haven't looked closely at how the Leaf OBD to Db9 cable is different from standard. Ah, my bad out the queue length. We are definitely queueing more messages though. From my log of when the overflow happened, the poller was in state 0 which means OFF - ie nothing was being sent!! I'll look at the TX message thing - opt in sounds good - though it shouldn't be playing that much of a part here as the TXs are infrequent in this case (or zero when the leaf is off or driving) - On the ioniq 5 when I'm using the HUD - I'm polling quite frequently - multiple times per second and that seems to be fine!. I did find an issue with the throttling .. but it would still mostly apply the throttling where it matters, so again, it shouldn't be the problem (also, we aren't transmitting in the leaf case). The change I made to the logging of RX messages showed how many in a row were dropped... and it was mostly 1 only in a run - which means even if it is a short time between - that means that the drops are being interleaved by at least one success! Sooo.. I'm still wondering what is going on. Some things I'm going to try: * If the number of messages on the Can bus (coming in through RX) means that the queue is slowly getting longer and not quite catching up, then making the queue longer will help it last longer... but only pushes the problem down the road. - Add 'current queue length' to the poller status information to see if this is indeed the case? - Add some kind of alert when the queue reaches a % full? * Once you start overflowing and getting overflow log messages, I wonder if this is then contributing to the problem. - Push the overflow logging into Poller Task which can look at how many drops occurred since last received item. * Split up the flags for the poller messages into 2: - Messages that are/could be happening in the TX/RX tasks - Other noisy messages that always happen in the poller task. Thoughts on what else we might measure to figure out what is going on? //.ichael On Sun, 5 May 2024, 19:29 Michael Balzer via OvmsDev, <ovmsdev@lists.openvehicles.com <mailto:ovmsdev@lists.openvehicles.com> > wrote: Michael, the queue size isn't in bytes, it's in messages: * @param uxQueueLength The maximum number of items that the queue can contain. * * @param uxItemSize The number of bytes each item in the queue will require. Also, from the time stamps in Dereks log excerpt, there were quite some dropped frames in that time window -- at least 23 frames in 40 ms, that's bad. Queue sizes are currently: CONFIG_OVMS_HW_CAN_RX_QUEUE_SIZE=60 CONFIG_OVMS_VEHICLE_CAN_RX_QUEUE_SIZE=60 The new poller now channels all TX callbacks through the task queue additionally to RX and commands. So setting the queue size to be larger than the CAN RX queue size seems appropriate. Nevertheless, an overflow with more than 60 waiting messages still indicates some too long processing time in the vehicle task. TX callbacks previously were done directly in the CAN context, and no current vehicle overrides the empty default handler, so this imposed almost no additional overhead. By requiring a queue entry for each TX callback, this feature now has a potentially high impact for all vehicles. If passing these to the task is actually necessary, it needs to become an opt-in feature, so only vehicles subscribing to the callback actually need to cope with that additional load & potential processing delays involved. Regards, Michael
OK, I see now why it wouldn't send the notification: the V2 & V3 server register for notifications up to COMMAND_RESULT_NORMAL = 1024 characters. The report quickly becomes larger than 1024 characters, so the notifications no longer get sent via the server connectors. You need to either reduce the size, split the report, or use data notifications instead. On the reset value init: for my float targeting smoothing helper class for the UpMiiGo, I implemented a gradual ramp up from 1 to the requested sample size. You can do something similar also with powers of 2. IOW, yes, initialization from the first values received is perfectly OK. Regards, Michael Am 26.05.24 um 14:35 schrieb Michael Geddes:
It _/should/_ already be sending a report on charge stop.
MyEvents.RegisterEvent(TAG, "vehicle.charge.stop", std::bind(&OvmsPollers::VehicleChargeStop, this, _1, _2));
Reset on charge start/vehicle on is a good idea.
A question – would it be silly if the first value after a reset, rather than using 0 average to start with, if the average got set to the initial value? I’m in 2 minds about it. It would make the average more useful quicker.
//.ichael
On Sun, 26 May 2024, 19:39 Michael Balzer via OvmsDev, <ovmsdev@lists.openvehicles.com> wrote:
As the averages quickly decline when idle, an automatic report should probably also be sent on charge stop.
Also, I think you should automatically reset the timer statistics on drive & charge start.
First stats from charging my UpMiiGo:
Type | count | Utlztn | Time | per s | [‰] | [ms] ---------------+--------+--------+--------- Poll:PRI Avg| 1.00| 0.723| 0.716 Peak| | 1.282| 3.822 ---------------+--------+--------+--------- Poll:SRX Avg| 7.72| 1.246| 0.184 Peak| | 3.128| 1.058 ---------------+--------+--------+--------- RxCan1[7ae] Avg| 2.48| 0.915| 0.362 Peak| | 1.217| 1.661 ---------------+--------+--------+--------- RxCan1[7cf] Avg| 4.76| 1.928| 0.397 Peak| | 2.317| 2.687 ---------------+--------+--------+--------- RxCan1[7ed] Avg| 3.38| 1.251| 0.327 Peak| | 8.154| 12.273 ---------------+--------+--------+--------- RxCan1[7ee] Avg| 0.21| 0.066| 0.297 Peak| | 0.225| 1.690 ---------------+--------+--------+--------- TxCan1[744] Avg| 1.49| 0.022| 0.011 Peak| | 0.032| 0.095 ---------------+--------+--------+--------- TxCan1[765] Avg| 3.89| 0.134| 0.027 Peak| | 0.155| 0.113 ---------------+--------+--------+--------- TxCan1[7e5] Avg| 2.32| 0.038| 0.013 Peak| | 0.295| 0.084 ---------------+--------+--------+--------- TxCan1[7e6] Avg| 1 0.21| 0.002| 0.008 Peak| | 0.010| 0.041 ---------------+--------+--------+--------- Cmd:State Avg| 0.00| 0.000| 0.007 Peak| | 0.005| 0.072 ===============+========+========+========= Total Avg| 27.46| 6.324| 2.349
Overall healthy I'd say, but let's see how it compares.
7ed is the BMS, the peak time is probably related to the extended cell data logging -- I've enabled log intervals for both cell voltages & temperatures.
Regards, Michael
Am 26.05.24 um 08:42 schrieb Michael Balzer via OvmsDev:
The notification works on my devices, it only has a garbled per mille character -- see attached screenshot. The same applies to the mail version:
Poller timing is: on
Type | count | Utlztn | Time
| per s | [‰] | [ms]
---------------+--------+--------+---------
Poll:PRI Avg| 0.25| 0.119| 0.382
Peak| | 0.513| 0.678
---------------+--------+--------+---------
RxCan1[597] Avg| 0.01| 0.004| 0.021
Peak| | 0.000| 0.338
---------------+--------+--------+---------
RxCan1[59b] Avg| 0.01| 0.011| 0.053
Peak| | 0.000| 0.848
---------------+--------+--------+---------
Cmd:State Avg| 0.01| 0.002| 0.012
Peak| | 0.000| 0.120
===============+========+========+=========
Total Avg| 0.28| 0.135| 0.468
The encoding is a general issue. The character encoding for text messages via V2/MP is quite old & clumsy, it's got an issue with the degree celcius character as well. We previously tried to keep all text messages within the SMS safe character set (which e.g. lead to writing just "C" instead of "°C"). I'd say we should head towards UTF-8 now. If we ever refit SMS support, we can recode on the fly.
Regarding not seeing the notification on your phone:
a) Check your notification subtype/channel filters on the module. See https://docs.openvehicles.com/en/latest/userguide/notifications.html#suppres...
b) Check your notification vehicle filters on the phone (menu on notification tab): if you enabled the vehicle filter, it will add the messages of not currently selected vehicles to the list only, but not raise a system notification. (Applies to the Android App, no idea about the iOS version)
Regards, Michael
Am 26.05.24 um 06:32 schrieb Michael Geddes:
Hi,
I'm trying to finalise this now .. and one last thing is that I don't get the report coming to my mobile. I'm using the command:
MyNotify.NotifyString("info", "poller.report", buf.c_str());
Where the buffer string is just the same as the report output. Should I be using some other format or command?
I get "alert" types (like the ioniq5 door-open alert) fine to my mobile.
Michael.
On Sun, 19 May 2024, 12:51 Michael Balzer via OvmsDev, <ovmsdev@lists.openvehicles.com> wrote:
A builtin web UI for this seems a bit over the top. Builtin web config pages should focus on user features, this is clearly a feature only needed during/for the development/extension of a vehicle adapter. Development features in the web UI are confusing for end users.
If persistent enabling/disabling is done by a simple config command (e.g. "config set can poller.trace on"), that's also doable by users.
Regards, Michael
Am 19.05.24 um 02:06 schrieb Michael Geddes:
I was so focused on how I calculated the value that I totally missed that ‰ would be a better description. I could also use the system 'Ratio' unit... so % or ‰.
I'll make space to put 'Avg' on the row. Was trying to limit the width for output on a mobile. I agree it would make it easier to understand.
Totals also makes sense.
Should I make this a configuration that can be set on the web-page? I'd probably use a configuration change notification so that the very bit setting is sync'd with the 'configuration' value.
//.ichael
On Sat, 18 May 2024, 14:05 Michael Balzer, <dexter@expeedo.de> wrote:
I'm not sure whether the 'max' should be the maximum of the smoothed value.. or the maximum of the raw value.
It should normally be the maximum of the raw value I think, the maximum of the smoothed value cannot tell about how bad the processing of an ID can become.
The naming in the table is a bit confusing I think. (besides: I've never seen "ave" as the abbreviation for average)
If I understand you correctly, "time ms per s" is the time share in per mille, so something in that direction would be more clear, and "length ms" would then be "time [ms]".
The totals for all averages in the table foot would also be nice.
Maybe "Ave" (or avg?) also should be placed on the left, as the "peak" label now suggests being the peak of the average.
Btw, keep in mind, not all "edge" users / testers are developers (e.g. the Twizy driver I'm in contact with), collecting stats feedback for vehicles from testers should be straight forward. Maybe add a data/history record, sent automatically on every drive/charge stop when the poller tracing is on?
Regards, Michael
Am 18.05.24 um 02:28 schrieb Michael Geddes:
You did say max/pead value. I also halved the N for both.
I'm not sure whether the 'max' should be the maximum of the smoothed value.. or the maximum of the raw value.
This is currently the raw-value maximum.
The problem is that the middle column is the maximum of the {{sum over 10s} / (10*1000,000)
I could easily change the 'period' to 1s and see how that goes.. was just trying to reduce the larger calculations.
Usage: poller [pause|resume|status|times|trace]
OVMS# poller time status Poller timing is: on Type | Count | Ave time | Ave length | per s | ms per s | ms -------------+----------+-----------+----------- Poll:PRI | 1.00| 0.559| 0.543 peak | | 0.663| 1.528 -------------+----------+-----------+----------- Poll:SRX | 0.08| 0.009| 0.038 peak | | 0.068| 0.146 -------------+----------+-----------+----------- CAN1 RX[778] | 0.11| 0.061| 0.280 peak | | 0.458| 1.046 -------------+----------+-----------+----------- CAN1 RX[7a8] | 0.04| 0.024| 0.124 peak | | 0.160| 0.615 -------------+----------+-----------+----------- CAN1 TX[770] | 0.05| 0.004| 0.016 peak | | 0.022| 0.102 -------------+----------+-----------+----------- CAN1 TX[7a0] | 0.02| 0.002| 0.011 peak | | 0.010| 0.098 -------------+----------+-----------+----------- CAN1 TX[7b3] | 0.01| 0.001| 0.006 peak | | 0.000| 0.099 -------------+----------+-----------+----------- CAN1 TX[7e2] | 0.02| 0.002| 0.011 peak | | 0.010| 0.099 -------------+----------+-----------+----------- CAN1 TX[7e4] | 0.08| 0.008| 0.048 peak | | 0.049| 0.107 -------------+----------+-----------+----------- Cmd:State | 0.00| 0.000| 0.005 peak | | 0.000| 0.094
On Fri, 17 May 2024 at 15:26, Michael Geddes <frog@bunyip.wheelycreek.net> wrote:
This is what I have now.
The one on the end is the one MIchael B was after using an N of 32. (up for discussion).
The middle is the time spent in that even t per second. It accumulates times (in microseconds), and then every 10s it stores it as smoothed (N=16) value.
The Count is similar (except that we store a value of '100' as 1 event so it can be still integers and has 2 decimal places).
Every received poll does a 64bit difference to 32bit (for the elapsed time) and 64bit comparison (for end-of-period).
It also does 1x 32bit smoothing and 2x 32bit adds.
Then at the end of a 10s period, it will do a 64bit add to get the next end-of-period value, as well as the 2x 32bit smoothing calcs.
This is from the Ioniq 5 so not any big values yet. You can certainly see how insignificant the TX callbacks are.
I'll leave it on for when the car is moving and gets some faster polling.
OVMS# poll time status Poller timing is: on Type | Count | Ave time | Ave Length | per s | ms per s | ms -------------+----------+-----------+----------- Poll:PRI | 1.00| 0.540| 0.539 Poll:SRX | 0.03| 0.004| 0.017 CAN1 RX[778] | 0.06| 0.042| 0.175 CAN1 TX[770] | 0.04| 0.002| 0.008 Cmd:State | 0.01| 0.001| 0.005
----------------------8<--------------------------------
Nice smoothing class (forces N as a power of 2):
constexpr unsigned floorlog2(unsigned x) { return x == 1 ? 0 : 1+floorlog2(x >> 1); } /* Maintain a smoothed average using shifts for division. * T should be an integer type * N needs to be a power of 2 */ template <typename T, unsigned N> class average_util_t { private: T m_ave; public: average_util_t() : m_ave(0) {} static const uint8_t _BITS = floorlog2(N); void add( T val) { static_assert(N == (1 << _BITS), "N must be a power of 2"); m_ave = (((N-1) * m_ave) + val) >> _BITS; } T get() { return m_ave; } operator T() { return m_ave; } };
On Thu, 16 May 2024 at 10:29, Michael Geddes <frog@bunyip.wheelycreek.net> wrote:
Thanks Michael,
My calculations give me ((2^32)-1) / (1000*1000*3600) = only 1.2 hours of processing time in 32bit. The initial subtraction is 64bit anyway and I can't see a further 64bit addition being a problem. I have the calculations being performed in doubles at print-out where performance is not really an issue anyway. (Though apparently doing 64 bit division is worse than floating point).
In addition
* I currently have this being able to be turned on and off and reset manually (only do it when required).
* For the lower volume commands, the smoothed average is not going to be useful - the count is more interesting for different reasons.
* The total time is quite useful. Ie a high average time doesn't matter if the count is low. The things that are affecting performance are stuff with high total time. Stuff which is happening 100 times a second needs to be a much lower average than once a second.
* A measure like 'time per minute/second' and possibly count per minute/seconds as a smoothed average would potentially be more useful. (or in addition?)
I think we could do _that_ in a reasonably efficient manner using a 64 bit 'last measured time', a 32 bit accumulated value and the stored 32 bit rolling average.
It would boils down to some iterative (integer) sums and multiplications plus a divide by n ^ (time periods passed) - which is a shift - and which can be optimised to '0' if 'time-periods-passed' is more than 32/(bits-per-n) - effectively limiting the number of iterations.
The one issue I can see is that we need to calculate 'number of time-periods passed' which is a 64 bit subtraction followed by a 32 bit division (not optimisable to a simple shift).
* I'm also happy to keep a rolling (32bit) average time.
Even if you assume averages in the 100ms, 32bit is going to happily support an N of 64 or even 128.
Am I right in thinking that the choice of N is highly dependent on frequency. For things happening 100 times per second, you might want an N like 128.. where things happening once per
second, you might want an N of 4 or 8. The other things we keep track of in this manner we have a better idea of the frequency of the thing.
How about we have (per record type):
* total count (since last reset?) (32 bit)
* smoothed average of time per instance (32 bit)
* ?xx? total accumulated time since last reset (64bit) ?? <-- with the below stats this is much less useful
* last-measured-time (64 bit)
* accumulated count since last time-period (16bit - but maybe 32bit anyway for byte alignment?)
* smoothed average of count per time-period (32bit)
* accumulated time since last time-period (32bit)
* smoothed average of time per time-period (32bit)
It's possible to keep the
Is this going to be too much per record type? The number of 'records' we are keeping is quite low (so 10 to 20 maybe) - so it's not a huge memory burden.
Thoughts?
//.ichael
On Thu, 16 May 2024 at 03:09, Michael Balzer via OvmsDev <ovmsdev@lists.openvehicles.com> wrote:
esp_timer_get_time() is the right choice for precision timing.
I'd say uint32 is enough though, even if counting microseconds that can hold a total of more than 71 hours of actual processing time. uint64 has a significant performance penalty, although I don't recall the overhead for simple additions.
Also & more important, the average wouldn't be my main focus, but the maximum processing time seen per ID, which seems to be missing in your draft.
Second thought on the average… the exact overall average really has a minor meaning, I'd rather see the current average, adapting to the current mode of operation (drive/charge/…). I suggest feeding the measurements to a low pass filter to get the smoothed average of the last n measurements. Pattern:
runavg = ((N-1) * runavg + newval) / N
By using a low power of 2 for N (e.g. 8 or 16), you can replace the division by a simple bit shift, and have enough headroom to use 32 bit integers.
Regards, Michael
Am 15.05.24 um 06:51 schrieb Michael Geddes via OvmsDev:
Formatting aside, I have implemented what I think Michael B was suggesting. This is a sample run on the Ioniq 5 (which doesn't have unsolicited RX events).
This uses the call esp_timer_get_time() got get a 64bit *microseconds* since started value - and works out the time to execute that way. It's looking at absolute time and not time in the Task - so other things going on at the same time in other tasks will have an effect. (The normal tick count doesn't have nearly enough resolution to be useful - any other ideas on measurement?) I've got total accumulated time displaying in seconds and the average in milliseconds currently - but I can change that easy enough.
The cumulative time is stored as uint64_t which will be plenty, as 32bit wouldn't be nearly enough.
OVMS# *poller time on* Poller timing is now on
OVMS# *poller time status* Poller timing is: on Poll [PRI] : n=390 tot=0.2s ave=0.586ms Poll [SRX] : n=316 tot=0.1s ave=0.196ms CAN1 RX[0778] : n=382 tot=0.2s ave=0.615ms CAN1 RX[07a8] : n=48 tot=0.0s ave=0.510ms CAN1 RX[07bb] : n=162 tot=0.1s ave=0.519ms CAN1 RX[07ce] : n=33 tot=0.0s ave=0.469ms CAN1 RX[07ea] : n=408 tot=0.2s ave=0.467ms CAN1 RX[07ec] : n=486 tot=0.2s ave=0.477ms CAN3 RX[07df] : n=769 tot=0.2s ave=0.261ms CAN1 TX[0770] : n=191 tot=0.0s ave=0.054ms CAN1 TX[07a0] : n=16 tot=0.0s ave=0.047ms CAN1 TX[07b3] : n=31 tot=0.0s ave=0.069ms CAN1 TX[07c6] : n=11 tot=0.0s ave=0.044ms CAN1 TX[07e2] : n=82 tot=0.0s ave=0.067ms CAN1 TX[07e4] : n=54 tot=0.0s ave=0.044ms Set State : n=7 tot=0.0s ave=0.104ms
This is probably going to be quite useful in general! The TX call-backs don't seem to be significant here. (oh, I should probably implement a reset of the values too).
//.ichael
On Sun, 12 May 2024 at 22:58, Michael Geddes <frog@bunyip.wheelycreek.net> wrote:
Yeah - I certainly wasn't going to put a hard limit. Just a log above a certain time, that being said, the idea of just collecting stats (being able to turn it on via a "poller timer" set of commands) would be much more useful. I'll look into that.
Average time is probably a good stat - and certainly what we care about.
I actually am hopeful that those couple of things I did might help reduce that average time quite a bit (that short-cutting the isotp protocol handling especially).
That p/r with logging changes might help reduce the unproductive log time further, but also makes it possible to turn on the poller logging without the RX task logs kicking in.
//.ichael
On Sun, 12 May 2024 at 22:29, Michael Balzer via OvmsDev <ovmsdev@lists.openvehicles.com> wrote:
Warning / gathering debug statistics about slow processing can be helpful, but there must not be a hard limit. Frame/poll response processing may need disk or network I/O, and the vehicle task may be starving from punctual high loads on higher priority tasks (e.g. networking) or by needing to wait for some semaphore -- that's outside the application's control, and must not lead to termination/recreation of the task (in case you're heading towards that direction).
I have no idea how much processing time the current vehicles actually need in their respective worst cases. Your draft is probably too lax, poll responses and frames normally need to be processed much faster. I'd say 10 ms is already too slow, but any wait for a queue/semaphore will already mean at least 10 ms (FreeRTOS tick). Probably best to begin with just collecting stats.
Btw, to help in narrowing down the actual problem case, the profiler could collect max times per RX message ID.
Regards, Michael
Am 12.05.24 um 10:41 schrieb Michael Geddes:
I have a question for Michael B (or whoever) - I have a commit lined up that would add a bit of a time check to the poller loop. What do we expect the maximum time to execute a poller loop command should be?
This is a rough idea (in ms) I have.. based on nothing much really, so any ideas would be appreciated:
int TardyMaxTime_ms(OvmsPoller::OvmsPollEntryType entry_type) { switch (entry_type) { case OvmsPoller::OvmsPollEntryType::Poll: return 80; case OvmsPoller::OvmsPollEntryType::FrameRx: return 30; case OvmsPoller::OvmsPollEntryType::FrameTx: return 20; case OvmsPoller::OvmsPollEntryType::Command: return 10; case OvmsPoller::OvmsPollEntryType::PollState: return 15; default: return 80; } }
//.ichael
On Mon, 6 May 2024 at 07:45, Michael Geddes <frog@bunyip.wheelycreek.net> wrote:
I realise that I was only using the standard cable to test - which probably is not sufficient - I haven't looked closely at how the Leaf OBD to Db9 cable is different from standard.
Ah, my bad out the queue length. We are definitely queueing more messages though. From my log of when the overflow happened, the poller was in state 0 which means OFF - ie nothing was being sent!!
I'll look at the TX message thing - opt in sounds good - though it shouldn't be playing that much of a part here as the TXs are infrequent in this case (or zero when the leaf is off or driving) - On the ioniq 5 when I'm using the HUD - I'm polling quite frequently - multiple times per second and that seems to be fine!.
I did find an issue with the throttling .. but it would still mostly apply the throttling where it matters, so again, it shouldn't be the problem (also, we aren't transmitting in the leaf case).
The change I made to the logging of RX messages showed how many in a row were dropped... and it was mostly 1 only in a run - which means even if it is a short time between - that means that the drops are being interleaved by at least one success!
Sooo.. I'm still wondering what is going on. Some things I'm going to try:
* If the number of messages on the Can bus (coming in through RX) means that the queue is slowly getting longer and not quite catching up, then making the queue longer will help it last longer... but only pushes the problem down the road.
- Add 'current queue length' to the poller status information to see if this is indeed the case?
- Add some kind of alert when the queue reaches a % full?
* Once you start overflowing and getting overflow log messages, I wonder if this is then contributing to the problem.
- Push the overflow logging into Poller Task which can look at how many drops occurred since last received item.
* Split up the flags for the poller messages into 2:
- Messages that are/could be happening in the TX/RX tasks
- Other noisy messages that always happen in the poller task.
Thoughts on what else we might measure to figure out what is going on?
//.ichael
On Sun, 5 May 2024, 19:29 Michael Balzer via OvmsDev, <ovmsdev@lists.openvehicles.com> wrote:
Michael,
the queue size isn't in bytes, it's in messages:
* @param uxQueueLength The maximum number of items that the queue can contain. * * @param uxItemSize The number of bytes each item in the queue will require.
Also, from the time stamps in Dereks log excerpt, there were quite some dropped frames in that time window -- at least 23 frames in 40 ms, that's bad.
Queue sizes are currently:
CONFIG_OVMS_HW_CAN_RX_QUEUE_SIZE=60 CONFIG_OVMS_VEHICLE_CAN_RX_QUEUE_SIZE=60
The new poller now channels all TX callbacks through the task queue additionally to RX and commands. So setting the queue size to be larger than the CAN RX queue size seems appropriate.
Nevertheless, an overflow with more than 60 waiting messages still indicates some too long processing time in the vehicle task.
TX callbacks previously were done directly in the CAN context, and no current vehicle overrides the empty default handler, so this imposed almost no additional overhead. By requiring a queue entry for each TX callback, this feature now has a potentially high impact for all vehicles. If passing these to the task is actually necessary, it needs to become an opt-in feature, so only vehicles subscribing to the callback actually need to cope with that additional load & potential processing delays involved.
Regards, Michael
-- Michael Balzer * Helkenberger Weg 9 * D-58256 Ennepetal Fon 02333 / 833 5735 * Handy 0176 / 206 989 26
Was this all good? I want to make sure I get to the bottom of this whole issue asap! https://github.com/openvehicles/Open-Vehicle-Monitoring-System-3/pull/1018 Was there something else you needed me to work on to make sure this all works for all supported cars? //.ichael On Sun, 26 May 2024 at 21:15, Michael Balzer via OvmsDev < ovmsdev@lists.openvehicles.com> wrote:
OK, I see now why it wouldn't send the notification: the V2 & V3 server register for notifications up to COMMAND_RESULT_NORMAL = 1024 characters.
The report quickly becomes larger than 1024 characters, so the notifications no longer get sent via the server connectors.
You need to either reduce the size, split the report, or use data notifications instead.
On the reset value init: for my float targeting smoothing helper class for the UpMiiGo, I implemented a gradual ramp up from 1 to the requested sample size. You can do something similar also with powers of 2. IOW, yes, initialization from the first values received is perfectly OK.
Regards, Michael
Am 26.05.24 um 14:35 schrieb Michael Geddes:
It _*should*_ already be sending a report on charge stop.
MyEvents.RegisterEvent(TAG, "vehicle.charge.stop", std::bind(&OvmsPollers::VehicleChargeStop, this, _1, _2));
Reset on charge start/vehicle on is a good idea.
A question – would it be silly if the first value after a reset, rather than using 0 average to start with, if the average got set to the initial value? I’m in 2 minds about it. It would make the average more useful quicker.
//.ichael
On Sun, 26 May 2024, 19:39 Michael Balzer via OvmsDev, < ovmsdev@lists.openvehicles.com> wrote:
As the averages quickly decline when idle, an automatic report should probably also be sent on charge stop.
Also, I think you should automatically reset the timer statistics on drive & charge start.
First stats from charging my UpMiiGo:
Type | count | Utlztn | Time | per s | [‰] | [ms] ---------------+--------+--------+--------- Poll:PRI Avg| 1.00| 0.723| 0.716 Peak| | 1.282| 3.822 ---------------+--------+--------+--------- Poll:SRX Avg| 7.72| 1.246| 0.184 Peak| | 3.128| 1.058 ---------------+--------+--------+--------- RxCan1[7ae] Avg| 2.48| 0.915| 0.362 Peak| | 1.217| 1.661 ---------------+--------+--------+--------- RxCan1[7cf] Avg| 4.76| 1.928| 0.397 Peak| | 2.317| 2.687 ---------------+--------+--------+--------- RxCan1[7ed] Avg| 3.38| 1.251| 0.327 Peak| | 8.154| 12.273 ---------------+--------+--------+--------- RxCan1[7ee] Avg| 0.21| 0.066| 0.297 Peak| | 0.225| 1.690 ---------------+--------+--------+--------- TxCan1[744] Avg| 1.49| 0.022| 0.011 Peak| | 0.032| 0.095 ---------------+--------+--------+--------- TxCan1[765] Avg| 3.89| 0.134| 0.027 Peak| | 0.155| 0.113 ---------------+--------+--------+--------- TxCan1[7e5] Avg| 2.32| 0.038| 0.013 Peak| | 0.295| 0.084 ---------------+--------+--------+--------- TxCan1[7e6] Avg| 1 0.21| 0.002| 0.008 Peak| | 0.010| 0.041 ---------------+--------+--------+--------- Cmd:State Avg| 0.00| 0.000| 0.007 Peak| | 0.005| 0.072 ===============+========+========+========= Total Avg| 27.46| 6.324| 2.349
Overall healthy I'd say, but let's see how it compares.
7ed is the BMS, the peak time is probably related to the extended cell data logging -- I've enabled log intervals for both cell voltages & temperatures.
Regards, Michael
Am 26.05.24 um 08:42 schrieb Michael Balzer via OvmsDev:
The notification works on my devices, it only has a garbled per mille character -- see attached screenshot. The same applies to the mail version:
Poller timing is: on
Type | count | Utlztn | Time
| per s | [‰] | [ms]
---------------+--------+--------+---------
Poll:PRI Avg| 0.25| 0.119| 0.382
Peak| | 0.513| 0.678
---------------+--------+--------+---------
RxCan1[597] Avg| 0.01| 0.004| 0.021
Peak| | 0.000| 0.338
---------------+--------+--------+---------
RxCan1[59b] Avg| 0.01| 0.011| 0.053
Peak| | 0.000| 0.848
---------------+--------+--------+---------
Cmd:State Avg| 0.01| 0.002| 0.012
Peak| | 0.000| 0.120
===============+========+========+=========
Total Avg| 0.28| 0.135| 0.468
The encoding is a general issue. The character encoding for text messages via V2/MP is quite old & clumsy, it's got an issue with the degree celcius character as well. We previously tried to keep all text messages within the SMS safe character set (which e.g. lead to writing just "C" instead of "°C"). I'd say we should head towards UTF-8 now. If we ever refit SMS support, we can recode on the fly.
Regarding not seeing the notification on your phone:
a) Check your notification subtype/channel filters on the module. See https://docs.openvehicles.com/en/latest/userguide/notifications.html#suppres...
b) Check your notification vehicle filters on the phone (menu on notification tab): if you enabled the vehicle filter, it will add the messages of not currently selected vehicles to the list only, but not raise a system notification. (Applies to the Android App, no idea about the iOS version)
Regards, Michael
Am 26.05.24 um 06:32 schrieb Michael Geddes:
Hi,
I'm trying to finalise this now .. and one last thing is that I don't get the report coming to my mobile. I'm using the command:
MyNotify.NotifyString("info", "poller.report", buf.c_str());
Where the buffer string is just the same as the report output. Should I be using some other format or command?
I get "alert" types (like the ioniq5 door-open alert) fine to my mobile.
Michael.
On Sun, 19 May 2024, 12:51 Michael Balzer via OvmsDev, < ovmsdev@lists.openvehicles.com> wrote:
A builtin web UI for this seems a bit over the top. Builtin web config pages should focus on user features, this is clearly a feature only needed during/for the development/extension of a vehicle adapter. Development features in the web UI are confusing for end users.
If persistent enabling/disabling is done by a simple config command (e.g. "config set can poller.trace on"), that's also doable by users.
Regards, Michael
Am 19.05.24 um 02:06 schrieb Michael Geddes:
I was so focused on how I calculated the value that I totally missed that ‰ would be a better description. I could also use the system 'Ratio' unit... so % or ‰.
I'll make space to put 'Avg' on the row. Was trying to limit the width for output on a mobile. I agree it would make it easier to understand.
Totals also makes sense.
Should I make this a configuration that can be set on the web-page? I'd probably use a configuration change notification so that the very bit setting is sync'd with the 'configuration' value.
//.ichael
On Sat, 18 May 2024, 14:05 Michael Balzer, <dexter@expeedo.de> wrote:
I'm not sure whether the 'max' should be the maximum of the smoothed value.. or the maximum of the raw value.
It should normally be the maximum of the raw value I think, the maximum of the smoothed value cannot tell about how bad the processing of an ID can become.
The naming in the table is a bit confusing I think. (besides: I've never seen "ave" as the abbreviation for average)
If I understand you correctly, "time ms per s" is the time share in per mille, so something in that direction would be more clear, and "length ms" would then be "time [ms]".
The totals for all averages in the table foot would also be nice.
Maybe "Ave" (or avg?) also should be placed on the left, as the "peak" label now suggests being the peak of the average.
Btw, keep in mind, not all "edge" users / testers are developers (e.g. the Twizy driver I'm in contact with), collecting stats feedback for vehicles from testers should be straight forward. Maybe add a data/history record, sent automatically on every drive/charge stop when the poller tracing is on?
Regards, Michael
Am 18.05.24 um 02:28 schrieb Michael Geddes:
You did say max/pead value. I also halved the N for both.
I'm not sure whether the 'max' should be the maximum of the smoothed value.. or the maximum of the raw value.
This is currently the raw-value maximum.
The problem is that the middle column is the maximum of the {{sum over 10s} / (10*1000,000)
I could easily change the 'period' to 1s and see how that goes.. was just trying to reduce the larger calculations.
Usage: poller [pause|resume|status|times|trace]
OVMS# poller time status Poller timing is: on Type | Count | Ave time | Ave length | per s | ms per s | ms -------------+----------+-----------+----------- Poll:PRI | 1.00| 0.559| 0.543 peak | | 0.663| 1.528 -------------+----------+-----------+----------- Poll:SRX | 0.08| 0.009| 0.038 peak | | 0.068| 0.146 -------------+----------+-----------+----------- CAN1 RX[778] | 0.11| 0.061| 0.280 peak | | 0.458| 1.046 -------------+----------+-----------+----------- CAN1 RX[7a8] | 0.04| 0.024| 0.124 peak | | 0.160| 0.615 -------------+----------+-----------+----------- CAN1 TX[770] | 0.05| 0.004| 0.016 peak | | 0.022| 0.102 -------------+----------+-----------+----------- CAN1 TX[7a0] | 0.02| 0.002| 0.011 peak | | 0.010| 0.098 -------------+----------+-----------+----------- CAN1 TX[7b3] | 0.01| 0.001| 0.006 peak | | 0.000| 0.099 -------------+----------+-----------+----------- CAN1 TX[7e2] | 0.02| 0.002| 0.011 peak | | 0.010| 0.099 -------------+----------+-----------+----------- CAN1 TX[7e4] | 0.08| 0.008| 0.048 peak | | 0.049| 0.107 -------------+----------+-----------+----------- Cmd:State | 0.00| 0.000| 0.005 peak | | 0.000| 0.094
On Fri, 17 May 2024 at 15:26, Michael Geddes <frog@bunyip.wheelycreek.net> wrote:
This is what I have now.
The one on the end is the one MIchael B was after using an N of 32. (up for discussion).
The middle is the time spent in that even t per second. It accumulates times (in microseconds), and then every 10s it stores it as smoothed (N=16) value.
The Count is similar (except that we store a value of '100' as 1 event so it can be still integers and has 2 decimal places).
Every received poll does a 64bit difference to 32bit (for the elapsed time) and 64bit comparison (for end-of-period).
It also does 1x 32bit smoothing and 2x 32bit adds.
Then at the end of a 10s period, it will do a 64bit add to get the next end-of-period value, as well as the 2x 32bit smoothing calcs.
This is from the Ioniq 5 so not any big values yet. You can certainly see how insignificant the TX callbacks are.
I'll leave it on for when the car is moving and gets some faster polling.
OVMS# poll time status Poller timing is: on Type | Count | Ave time | Ave Length | per s | ms per s | ms -------------+----------+-----------+----------- Poll:PRI | 1.00| 0.540| 0.539 Poll:SRX | 0.03| 0.004| 0.017 CAN1 RX[778] | 0.06| 0.042| 0.175 CAN1 TX[770] | 0.04| 0.002| 0.008 Cmd:State | 0.01| 0.001| 0.005
----------------------8<--------------------------------
Nice smoothing class (forces N as a power of 2):
constexpr unsigned floorlog2(unsigned x) { return x == 1 ? 0 : 1+floorlog2(x >> 1); } /* Maintain a smoothed average using shifts for division. * T should be an integer type * N needs to be a power of 2 */ template <typename T, unsigned N> class average_util_t { private: T m_ave; public: average_util_t() : m_ave(0) {} static const uint8_t _BITS = floorlog2(N); void add( T val) { static_assert(N == (1 << _BITS), "N must be a power of 2"); m_ave = (((N-1) * m_ave) + val) >> _BITS; } T get() { return m_ave; } operator T() { return m_ave; } };
On Thu, 16 May 2024 at 10:29, Michael Geddes <frog@bunyip.wheelycreek.net> wrote:
Thanks Michael,
My calculations give me ((2^32)-1) / (1000*1000*3600) = only 1.2 hours of processing time in 32bit. The initial subtraction is 64bit anyway and I can't see a further 64bit addition being a problem. I have the calculations being performed in doubles at print-out where performance is not really an issue anyway. (Though apparently doing 64 bit division is worse than floating point).
In addition
* I currently have this being able to be turned on and off and reset manually (only do it when required).
* For the lower volume commands, the smoothed average is not going to be useful - the count is more interesting for different reasons.
* The total time is quite useful. Ie a high average time doesn't matter if the count is low. The things that are affecting performance are stuff with high total time. Stuff which is happening 100 times a second needs to be a much lower average than once a second.
* A measure like 'time per minute/second' and possibly count per minute/seconds as a smoothed average would potentially be more useful. (or in addition?)
I think we could do _that_ in a reasonably efficient manner using a 64 bit 'last measured time', a 32 bit accumulated value and the stored 32 bit rolling average.
It would boils down to some iterative (integer) sums and multiplications plus a divide by n ^ (time periods passed) - which is a shift - and which can be optimised to '0' if 'time-periods-passed' is more than 32/(bits-per-n) - effectively limiting the number of iterations.
The one issue I can see is that we need to calculate 'number of time-periods passed' which is a 64 bit subtraction followed by a 32 bit division (not optimisable to a simple shift).
* I'm also happy to keep a rolling (32bit) average time.
Even if you assume averages in the 100ms, 32bit is going to happily support an N of 64 or even 128.
Am I right in thinking that the choice of N is highly dependent on frequency. For things happening 100 times per second, you might want an N like 128.. where things happening once per
second, you might want an N of 4 or 8. The other things we keep track of in this manner we have a better idea of the frequency of the thing.
How about we have (per record type):
* total count (since last reset?) (32 bit)
* smoothed average of time per instance (32 bit)
* ?xx? total accumulated time since last reset (64bit) ?? <-- with the below stats this is much less useful
* last-measured-time (64 bit)
* accumulated count since last time-period (16bit - but maybe 32bit anyway for byte alignment?)
* smoothed average of count per time-period (32bit)
* accumulated time since last time-period (32bit)
* smoothed average of time per time-period (32bit)
It's possible to keep the
Is this going to be too much per record type? The number of 'records' we are keeping is quite low (so 10 to 20 maybe) - so it's not a huge memory burden.
Thoughts?
//.ichael
On Thu, 16 May 2024 at 03:09, Michael Balzer via OvmsDev < ovmsdev@lists.openvehicles.com> wrote:
esp_timer_get_time() is the right choice for precision timing.
I'd say uint32 is enough though, even if counting microseconds that can hold a total of more than 71 hours of actual processing time. uint64 has a significant performance penalty, although I don't recall the overhead for simple additions.
Also & more important, the average wouldn't be my main focus, but the maximum processing time seen per ID, which seems to be missing in your draft.
Second thought on the average… the exact overall average really has a minor meaning, I'd rather see the current average, adapting to the current mode of operation (drive/charge/…). I suggest feeding the measurements to a low pass filter to get the smoothed average of the last n measurements. Pattern:
runavg = ((N-1) * runavg + newval) / N
By using a low power of 2 for N (e.g. 8 or 16), you can replace the division by a simple bit shift, and have enough headroom to use 32 bit integers.
Regards, Michael
Am 15.05.24 um 06:51 schrieb Michael Geddes via OvmsDev:
Formatting aside, I have implemented what I think Michael B was suggesting. This is a sample run on the Ioniq 5 (which doesn't have unsolicited RX events).
This uses the call esp_timer_get_time() got get a 64bit *microseconds* since started value - and works out the time to execute that way. It's looking at absolute time and not time in the Task - so other things going on at the same time in other tasks will have an effect. (The normal tick count doesn't have nearly enough resolution to be useful - any other ideas on measurement?) I've got total accumulated time displaying in seconds and the average in milliseconds currently - but I can change that easy enough.
The cumulative time is stored as uint64_t which will be plenty, as 32bit wouldn't be nearly enough.
OVMS# *poller time on* Poller timing is now on
OVMS# *poller time status* Poller timing is: on Poll [PRI] : n=390 tot=0.2s ave=0.586ms Poll [SRX] : n=316 tot=0.1s ave=0.196ms CAN1 RX[0778] : n=382 tot=0.2s ave=0.615ms CAN1 RX[07a8] : n=48 tot=0.0s ave=0.510ms CAN1 RX[07bb] : n=162 tot=0.1s ave=0.519ms CAN1 RX[07ce] : n=33 tot=0.0s ave=0.469ms CAN1 RX[07ea] : n=408 tot=0.2s ave=0.467ms CAN1 RX[07ec] : n=486 tot=0.2s ave=0.477ms CAN3 RX[07df] : n=769 tot=0.2s ave=0.261ms CAN1 TX[0770] : n=191 tot=0.0s ave=0.054ms CAN1 TX[07a0] : n=16 tot=0.0s ave=0.047ms CAN1 TX[07b3] : n=31 tot=0.0s ave=0.069ms CAN1 TX[07c6] : n=11 tot=0.0s ave=0.044ms CAN1 TX[07e2] : n=82 tot=0.0s ave=0.067ms CAN1 TX[07e4] : n=54 tot=0.0s ave=0.044ms Set State : n=7 tot=0.0s ave=0.104ms
This is probably going to be quite useful in general! The TX call-backs don't seem to be significant here. (oh, I should probably implement a reset of the values too).
//.ichael
On Sun, 12 May 2024 at 22:58, Michael Geddes <frog@bunyip.wheelycreek.net> wrote:
Yeah - I certainly wasn't going to put a hard limit. Just a log above a certain time, that being said, the idea of just collecting stats (being able to turn it on via a "poller timer" set of commands) would be much more useful. I'll look into that.
Average time is probably a good stat - and certainly what we care about.
I actually am hopeful that those couple of things I did might help reduce that average time quite a bit (that short-cutting the isotp protocol handling especially).
That p/r with logging changes might help reduce the unproductive log time further, but also makes it possible to turn on the poller logging without the RX task logs kicking in.
//.ichael
On Sun, 12 May 2024 at 22:29, Michael Balzer via OvmsDev < ovmsdev@lists.openvehicles.com> wrote:
Warning / gathering debug statistics about slow processing can be helpful, but there must not be a hard limit. Frame/poll response processing may need disk or network I/O, and the vehicle task may be starving from punctual high loads on higher priority tasks (e.g. networking) or by needing to wait for some semaphore -- that's outside the application's control, and must not lead to termination/recreation of the task (in case you're heading towards that direction).
I have no idea how much processing time the current vehicles actually need in their respective worst cases. Your draft is probably too lax, poll responses and frames normally need to be processed much faster. I'd say 10 ms is already too slow, but any wait for a queue/semaphore will already mean at least 10 ms (FreeRTOS tick). Probably best to begin with just collecting stats.
Btw, to help in narrowing down the actual problem case, the profiler could collect max times per RX message ID.
Regards, Michael
Am 12.05.24 um 10:41 schrieb Michael Geddes:
I have a question for Michael B (or whoever) - I have a commit lined up that would add a bit of a time check to the poller loop. What do we expect the maximum time to execute a poller loop command should be?
This is a rough idea (in ms) I have.. based on nothing much really, so any ideas would be appreciated:
int TardyMaxTime_ms(OvmsPoller::OvmsPollEntryType entry_type) { switch (entry_type) { case OvmsPoller::OvmsPollEntryType::Poll: return 80; case OvmsPoller::OvmsPollEntryType::FrameRx: return 30; case OvmsPoller::OvmsPollEntryType::FrameTx: return 20; case OvmsPoller::OvmsPollEntryType::Command: return 10; case OvmsPoller::OvmsPollEntryType::PollState: return 15; default: return 80; } }
//.ichael
On Mon, 6 May 2024 at 07:45, Michael Geddes <frog@bunyip.wheelycreek.net> wrote:
I realise that I was only using the standard cable to test - which probably is not sufficient - I haven't looked closely at how the Leaf OBD to Db9 cable is different from standard.
Ah, my bad out the queue length. We are definitely queueing more messages though. From my log of when the overflow happened, the poller was in state 0 which means OFF - ie nothing was being sent!!
I'll look at the TX message thing - opt in sounds good - though it shouldn't be playing that much of a part here as the TXs are infrequent in this case (or zero when the leaf is off or driving) - On the ioniq 5 when I'm using the HUD - I'm polling quite frequently - multiple times per second and that seems to be fine!.
I did find an issue with the throttling .. but it would still mostly apply the throttling where it matters, so again, it shouldn't be the problem (also, we aren't transmitting in the leaf case).
The change I made to the logging of RX messages showed how many in a row were dropped... and it was mostly 1 only in a run - which means even if it is a short time between - that means that the drops are being interleaved by at least one success!
Sooo.. I'm still wondering what is going on. Some things I'm going to try:
* If the number of messages on the Can bus (coming in through RX) means that the queue is slowly getting longer and not quite catching up, then making the queue longer will help it last longer... but only pushes the problem down the road.
- Add 'current queue length' to the poller status information to see if this is indeed the case?
- Add some kind of alert when the queue reaches a % full?
* Once you start overflowing and getting overflow log messages, I wonder if this is then contributing to the problem.
- Push the overflow logging into Poller Task which can look at how many drops occurred since last received item.
* Split up the flags for the poller messages into 2:
- Messages that are/could be happening in the TX/RX tasks
- Other noisy messages that always happen in the poller task.
Thoughts on what else we might measure to figure out what is going on?
//.ichael
On Sun, 5 May 2024, 19:29 Michael Balzer via OvmsDev, < ovmsdev@lists.openvehicles.com> wrote:
Michael,
the queue size isn't in bytes, it's in messages:
* @param uxQueueLength The maximum number of items that the queue can contain. * * @param uxItemSize The number of bytes each item in the queue will require.
Also, from the time stamps in Dereks log excerpt, there were quite some dropped frames in that time window -- at least 23 frames in 40 ms, that's bad.
Queue sizes are currently:
CONFIG_OVMS_HW_CAN_RX_QUEUE_SIZE=60 CONFIG_OVMS_VEHICLE_CAN_RX_QUEUE_SIZE=60
The new poller now channels all TX callbacks through the task queue additionally to RX and commands. So setting the queue size to be larger than the CAN RX queue size seems appropriate.
Nevertheless, an overflow with more than 60 waiting messages still indicates some too long processing time in the vehicle task.
TX callbacks previously were done directly in the CAN context, and no current vehicle overrides the empty default handler, so this imposed almost no additional overhead. By requiring a queue entry for each TX callback, this feature now has a potentially high impact for all vehicles. If passing these to the task is actually necessary, it needs to become an opt-in feature, so only vehicles subscribing to the callback actually need to cope with that additional load & potential processing delays involved.
Regards, Michael
-- Michael Balzer * Helkenberger Weg 9 * D-58256 Ennepetal Fon 02333 / 833 5735 * Handy 0176 / 206 989 26
_______________________________________________ OvmsDev mailing list OvmsDev@lists.openvehicles.com http://lists.openvehicles.com/mailman/listinfo/ovmsdev
Sorry, I know I'm behind with PRs. I'll try to find some time this weekend. Regards, Michael Am 14.06.24 um 08:31 schrieb Michael Geddes via OvmsDev:
Was this all good? I want to make sure I get to the bottom of this whole issue asap!
https://github.com/openvehicles/Open-Vehicle-Monitoring-System-3/pull/1018
Was there something else you needed me to work on to make sure this all works for all supported cars?
//.ichael
On Sun, 26 May 2024 at 21:15, Michael Balzer via OvmsDev <ovmsdev@lists.openvehicles.com> wrote:
OK, I see now why it wouldn't send the notification: the V2 & V3 server register for notifications up to COMMAND_RESULT_NORMAL = 1024 characters.
The report quickly becomes larger than 1024 characters, so the notifications no longer get sent via the server connectors.
You need to either reduce the size, split the report, or use data notifications instead.
On the reset value init: for my float targeting smoothing helper class for the UpMiiGo, I implemented a gradual ramp up from 1 to the requested sample size. You can do something similar also with powers of 2. IOW, yes, initialization from the first values received is perfectly OK.
Regards, Michael
Am 26.05.24 um 14:35 schrieb Michael Geddes:
It _/should/_ already be sending a report on charge stop.
MyEvents.RegisterEvent(TAG, "vehicle.charge.stop", std::bind(&OvmsPollers::VehicleChargeStop, this, _1, _2));
Reset on charge start/vehicle on is a good idea.
A question – would it be silly if the first value after a reset, rather than using 0 average to start with, if the average got set to the initial value? I’m in 2 minds about it. It would make the average more useful quicker.
//.ichael
On Sun, 26 May 2024, 19:39 Michael Balzer via OvmsDev, <ovmsdev@lists.openvehicles.com> wrote:
As the averages quickly decline when idle, an automatic report should probably also be sent on charge stop.
Also, I think you should automatically reset the timer statistics on drive & charge start.
First stats from charging my UpMiiGo:
Type | count | Utlztn | Time | per s | [‰] | [ms] ---------------+--------+--------+--------- Poll:PRI Avg| 1.00| 0.723| 0.716 Peak| | 1.282| 3.822 ---------------+--------+--------+--------- Poll:SRX Avg| 7.72| 1.246| 0.184 Peak| | 3.128| 1.058 ---------------+--------+--------+--------- RxCan1[7ae] Avg| 2.48| 0.915| 0.362 Peak| | 1.217| 1.661 ---------------+--------+--------+--------- RxCan1[7cf] Avg| 4.76| 1.928| 0.397 Peak| | 2.317| 2.687 ---------------+--------+--------+--------- RxCan1[7ed] Avg| 3.38| 1.251| 0.327 Peak| | 8.154| 12.273 ---------------+--------+--------+--------- RxCan1[7ee] Avg| 0.21| 0.066| 0.297 Peak| | 0.225| 1.690 ---------------+--------+--------+--------- TxCan1[744] Avg| 1.49| 0.022| 0.011 Peak| | 0.032| 0.095 ---------------+--------+--------+--------- TxCan1[765] Avg| 3.89| 0.134| 0.027 Peak| | 0.155| 0.113 ---------------+--------+--------+--------- TxCan1[7e5] Avg| 2.32| 0.038| 0.013 Peak| | 0.295| 0.084 ---------------+--------+--------+--------- TxCan1[7e6] Avg| 1 0.21| 0.002| 0.008 Peak| | 0.010| 0.041 ---------------+--------+--------+--------- Cmd:State Avg| 0.00| 0.000| 0.007 Peak| | 0.005| 0.072 ===============+========+========+========= Total Avg| 27.46| 6.324| 2.349
Overall healthy I'd say, but let's see how it compares.
7ed is the BMS, the peak time is probably related to the extended cell data logging -- I've enabled log intervals for both cell voltages & temperatures.
Regards, Michael
Am 26.05.24 um 08:42 schrieb Michael Balzer via OvmsDev:
The notification works on my devices, it only has a garbled per mille character -- see attached screenshot. The same applies to the mail version:
Poller timing is: on
Type | count | Utlztn | Time
| per s | [‰] | [ms]
---------------+--------+--------+---------
Poll:PRI Avg| 0.25| 0.119| 0.382
Peak| | 0.513| 0.678
---------------+--------+--------+---------
RxCan1[597] Avg| 0.01| 0.004| 0.021
Peak| | 0.000| 0.338
---------------+--------+--------+---------
RxCan1[59b] Avg| 0.01| 0.011| 0.053
Peak| | 0.000| 0.848
---------------+--------+--------+---------
Cmd:State Avg| 0.01| 0.002| 0.012
Peak| | 0.000| 0.120
===============+========+========+=========
Total Avg| 0.28| 0.135| 0.468
The encoding is a general issue. The character encoding for text messages via V2/MP is quite old & clumsy, it's got an issue with the degree celcius character as well. We previously tried to keep all text messages within the SMS safe character set (which e.g. lead to writing just "C" instead of "°C"). I'd say we should head towards UTF-8 now. If we ever refit SMS support, we can recode on the fly.
Regarding not seeing the notification on your phone:
a) Check your notification subtype/channel filters on the module. See https://docs.openvehicles.com/en/latest/userguide/notifications.html#suppres...
b) Check your notification vehicle filters on the phone (menu on notification tab): if you enabled the vehicle filter, it will add the messages of not currently selected vehicles to the list only, but not raise a system notification. (Applies to the Android App, no idea about the iOS version)
Regards, Michael
Am 26.05.24 um 06:32 schrieb Michael Geddes:
Hi,
I'm trying to finalise this now .. and one last thing is that I don't get the report coming to my mobile. I'm using the command:
MyNotify.NotifyString("info", "poller.report", buf.c_str());
Where the buffer string is just the same as the report output. Should I be using some other format or command?
I get "alert" types (like the ioniq5 door-open alert) fine to my mobile.
Michael.
On Sun, 19 May 2024, 12:51 Michael Balzer via OvmsDev, <ovmsdev@lists.openvehicles.com> wrote:
A builtin web UI for this seems a bit over the top. Builtin web config pages should focus on user features, this is clearly a feature only needed during/for the development/extension of a vehicle adapter. Development features in the web UI are confusing for end users.
If persistent enabling/disabling is done by a simple config command (e.g. "config set can poller.trace on"), that's also doable by users.
Regards, Michael
Am 19.05.24 um 02:06 schrieb Michael Geddes:
I was so focused on how I calculated the value that I totally missed that ‰ would be a better description. I could also use the system 'Ratio' unit... so % or ‰.
I'll make space to put 'Avg' on the row. Was trying to limit the width for output on a mobile. I agree it would make it easier to understand.
Totals also makes sense.
Should I make this a configuration that can be set on the web-page? I'd probably use a configuration change notification so that the very bit setting is sync'd with the 'configuration' value.
//.ichael
On Sat, 18 May 2024, 14:05 Michael Balzer, <dexter@expeedo.de> wrote:
I'm not sure whether the 'max' should be the maximum of the smoothed value.. or the maximum of the raw value.
It should normally be the maximum of the raw value I think, the maximum of the smoothed value cannot tell about how bad the processing of an ID can become.
The naming in the table is a bit confusing I think. (besides: I've never seen "ave" as the abbreviation for average)
If I understand you correctly, "time ms per s" is the time share in per mille, so something in that direction would be more clear, and "length ms" would then be "time [ms]".
The totals for all averages in the table foot would also be nice.
Maybe "Ave" (or avg?) also should be placed on the left, as the "peak" label now suggests being the peak of the average.
Btw, keep in mind, not all "edge" users / testers are developers (e.g. the Twizy driver I'm in contact with), collecting stats feedback for vehicles from testers should be straight forward. Maybe add a data/history record, sent automatically on every drive/charge stop when the poller tracing is on?
Regards, Michael
Am 18.05.24 um 02:28 schrieb Michael Geddes:
You did say max/pead value. I also halved the N for both.
I'm not sure whether the 'max' should be the maximum of the smoothed value.. or the maximum of the raw value.
This is currently the raw-value maximum.
The problem is that the middle column is the maximum of the {{sum over 10s} / (10*1000,000)
I could easily change the 'period' to 1s and see how that goes.. was just trying to reduce the larger calculations.
Usage: poller [pause|resume|status|times|trace]
OVMS# poller time status Poller timing is: on Type | Count | Ave time | Ave length | per s | ms per s | ms -------------+----------+-----------+----------- Poll:PRI | 1.00| 0.559| 0.543 peak | | 0.663| 1.528 -------------+----------+-----------+----------- Poll:SRX | 0.08| 0.009| 0.038 peak | | 0.068| 0.146 -------------+----------+-----------+----------- CAN1 RX[778] | 0.11| 0.061| 0.280 peak | | 0.458| 1.046 -------------+----------+-----------+----------- CAN1 RX[7a8] | 0.04| 0.024| 0.124 peak | | 0.160| 0.615 -------------+----------+-----------+----------- CAN1 TX[770] | 0.05| 0.004| 0.016 peak | | 0.022| 0.102 -------------+----------+-----------+----------- CAN1 TX[7a0] | 0.02| 0.002| 0.011 peak | | 0.010| 0.098 -------------+----------+-----------+----------- CAN1 TX[7b3] | 0.01| 0.001| 0.006 peak | | 0.000| 0.099 -------------+----------+-----------+----------- CAN1 TX[7e2] | 0.02| 0.002| 0.011 peak | | 0.010| 0.099 -------------+----------+-----------+----------- CAN1 TX[7e4] | 0.08| 0.008| 0.048 peak | | 0.049| 0.107 -------------+----------+-----------+----------- Cmd:State | 0.00| 0.000| 0.005 peak | | 0.000| 0.094
On Fri, 17 May 2024 at 15:26, Michael Geddes <frog@bunyip.wheelycreek.net> wrote:
This is what I have now.
The one on the end is the one MIchael B was after using an N of 32. (up for discussion).
The middle is the time spent in that even t per second. It accumulates times (in microseconds), and then every 10s it stores it as smoothed (N=16) value.
The Count is similar (except that we store a value of '100' as 1 event so it can be still integers and has 2 decimal places).
Every received poll does a 64bit difference to 32bit (for the elapsed time) and 64bit comparison (for end-of-period).
It also does 1x 32bit smoothing and 2x 32bit adds.
Then at the end of a 10s period, it will do a 64bit add to get the next end-of-period value, as well as the 2x 32bit smoothing calcs.
This is from the Ioniq 5 so not any big values yet. You can certainly see how insignificant the TX callbacks are.
I'll leave it on for when the car is moving and gets some faster polling.
OVMS# poll time status Poller timing is: on Type | Count | Ave time | Ave Length | per s | ms per s | ms -------------+----------+-----------+----------- Poll:PRI | 1.00| 0.540| 0.539 Poll:SRX | 0.03| 0.004| 0.017 CAN1 RX[778] | 0.06| 0.042| 0.175 CAN1 TX[770] | 0.04| 0.002| 0.008 Cmd:State | 0.01| 0.001| 0.005
----------------------8<--------------------------------
Nice smoothing class (forces N as a power of 2):
constexpr unsigned floorlog2(unsigned x) { return x == 1 ? 0 : 1+floorlog2(x >> 1); } /* Maintain a smoothed average using shifts for division. * T should be an integer type * N needs to be a power of 2 */ template <typename T, unsigned N> class average_util_t { private: T m_ave; public: average_util_t() : m_ave(0) {} static const uint8_t _BITS = floorlog2(N); void add( T val) { static_assert(N == (1 << _BITS), "N must be a power of 2"); m_ave = (((N-1) * m_ave) + val) >> _BITS; } T get() { return m_ave; } operator T() { return m_ave; } };
On Thu, 16 May 2024 at 10:29, Michael Geddes <frog@bunyip.wheelycreek.net> wrote:
Thanks Michael,
My calculations give me ((2^32)-1) / (1000*1000*3600) = only 1.2 hours of processing time in 32bit. The initial subtraction is 64bit anyway and I can't see a further 64bit addition being a problem. I have the calculations being performed in doubles at print-out where performance is not really an issue anyway. (Though apparently doing 64 bit division is worse than floating point).
In addition
* I currently have this being able to be turned on and off and reset manually (only do it when required).
* For the lower volume commands, the smoothed average is not going to be useful - the count is more interesting for different reasons.
* The total time is quite useful. Ie a high average time doesn't matter if the count is low. The things that are affecting performance are stuff with high total time. Stuff which is happening 100 times a second needs to be a much lower average than once a second.
* A measure like 'time per minute/second' and possibly count per minute/seconds as a smoothed average would potentially be more useful. (or in addition?)
I think we could do _that_ in a reasonably efficient manner using a 64 bit 'last measured time', a 32 bit accumulated value and the stored 32 bit rolling average.
It would boils down to some iterative (integer) sums and multiplications plus a divide by n ^ (time periods passed) - which is a shift - and which can be optimised to '0' if 'time-periods-passed' is more than 32/(bits-per-n) - effectively limiting the number of iterations.
The one issue I can see is that we need to calculate 'number of time-periods passed' which is a 64 bit subtraction followed by a 32 bit division (not optimisable to a simple shift).
* I'm also happy to keep a rolling (32bit) average time.
Even if you assume averages in the 100ms, 32bit is going to happily support an N of 64 or even 128.
Am I right in thinking that the choice of N is highly dependent on frequency. For things happening 100 times per second, you might want an N like 128.. where things happening once per
second, you might want an N of 4 or 8. The other things we keep track of in this manner we have a better idea of the frequency of the thing.
How about we have (per record type):
* total count (since last reset?) (32 bit)
* smoothed average of time per instance (32 bit)
* ?xx? total accumulated time since last reset (64bit) ?? <-- with the below stats this is much less useful
* last-measured-time (64 bit)
* accumulated count since last time-period (16bit - but maybe 32bit anyway for byte alignment?)
* smoothed average of count per time-period (32bit)
* accumulated time since last time-period (32bit)
* smoothed average of time per time-period (32bit)
It's possible to keep the
Is this going to be too much per record type? The number of 'records' we are keeping is quite low (so 10 to 20 maybe) - so it's not a huge memory burden.
Thoughts?
//.ichael
On Thu, 16 May 2024 at 03:09, Michael Balzer via OvmsDev <ovmsdev@lists.openvehicles.com> wrote:
esp_timer_get_time() is the right choice for precision timing.
I'd say uint32 is enough though, even if counting microseconds that can hold a total of more than 71 hours of actual processing time. uint64 has a significant performance penalty, although I don't recall the overhead for simple additions.
Also & more important, the average wouldn't be my main focus, but the maximum processing time seen per ID, which seems to be missing in your draft.
Second thought on the average… the exact overall average really has a minor meaning, I'd rather see the current average, adapting to the current mode of operation (drive/charge/…). I suggest feeding the measurements to a low pass filter to get the smoothed average of the last n measurements. Pattern:
runavg = ((N-1) * runavg + newval) / N
By using a low power of 2 for N (e.g. 8 or 16), you can replace the division by a simple bit shift, and have enough headroom to use 32 bit integers.
Regards, Michael
Am 15.05.24 um 06:51 schrieb Michael Geddes via OvmsDev:
Formatting aside, I have implemented what I think Michael B was suggesting. This is a sample run on the Ioniq 5 (which doesn't have unsolicited RX events).
This uses the call esp_timer_get_time() got get a 64bit *microseconds* since started value - and works out the time to execute that way. It's looking at absolute time and not time in the Task - so other things going on at the same time in other tasks will have an effect. (The normal tick count doesn't have nearly enough resolution to be useful - any other ideas on measurement?) I've got total accumulated time displaying in seconds and the average in milliseconds currently - but I can change that easy enough.
The cumulative time is stored as uint64_t which will be plenty, as 32bit wouldn't be nearly enough.
OVMS# *poller time on* Poller timing is now on
OVMS# *poller time status* Poller timing is: on Poll [PRI] : n=390 tot=0.2s ave=0.586ms Poll [SRX] : n=316 tot=0.1s ave=0.196ms CAN1 RX[0778] : n=382 tot=0.2s ave=0.615ms CAN1 RX[07a8] : n=48 tot=0.0s ave=0.510ms CAN1 RX[07bb] : n=162 tot=0.1s ave=0.519ms CAN1 RX[07ce] : n=33 tot=0.0s ave=0.469ms CAN1 RX[07ea] : n=408 tot=0.2s ave=0.467ms CAN1 RX[07ec] : n=486 tot=0.2s ave=0.477ms CAN3 RX[07df] : n=769 tot=0.2s ave=0.261ms CAN1 TX[0770] : n=191 tot=0.0s ave=0.054ms CAN1 TX[07a0] : n=16 tot=0.0s ave=0.047ms CAN1 TX[07b3] : n=31 tot=0.0s ave=0.069ms CAN1 TX[07c6] : n=11 tot=0.0s ave=0.044ms CAN1 TX[07e2] : n=82 tot=0.0s ave=0.067ms CAN1 TX[07e4] : n=54 tot=0.0s ave=0.044ms Set State : n=7 tot=0.0s ave=0.104ms
This is probably going to be quite useful in general! The TX call-backs don't seem to be significant here. (oh, I should probably implement a reset of the values too).
//.ichael
On Sun, 12 May 2024 at 22:58, Michael Geddes <frog@bunyip.wheelycreek.net> wrote:
Yeah - I certainly wasn't going to put a hard limit. Just a log above a certain time, that being said, the idea of just collecting stats (being able to turn it on via a "poller timer" set of commands) would be much more useful. I'll look into that.
Average time is probably a good stat - and certainly what we care about.
I actually am hopeful that those couple of things I did might help reduce that average time quite a bit (that short-cutting the isotp protocol handling especially).
That p/r with logging changes might help reduce the unproductive log time further, but also makes it possible to turn on the poller logging without the RX task logs kicking in.
//.ichael
On Sun, 12 May 2024 at 22:29, Michael Balzer via OvmsDev <ovmsdev@lists.openvehicles.com> wrote:
Warning / gathering debug statistics about slow processing can be helpful, but there must not be a hard limit. Frame/poll response processing may need disk or network I/O, and the vehicle task may be starving from punctual high loads on higher priority tasks (e.g. networking) or by needing to wait for some semaphore -- that's outside the application's control, and must not lead to termination/recreation of the task (in case you're heading towards that direction).
I have no idea how much processing time the current vehicles actually need in their respective worst cases. Your draft is probably too lax, poll responses and frames normally need to be processed much faster. I'd say 10 ms is already too slow, but any wait for a queue/semaphore will already mean at least 10 ms (FreeRTOS tick). Probably best to begin with just collecting stats.
Btw, to help in narrowing down the actual problem case, the profiler could collect max times per RX message ID.
Regards, Michael
Am 12.05.24 um 10:41 schrieb Michael Geddes:
I have a question for Michael B (or whoever) - I have a commit lined up that would add a bit of a time check to the poller loop. What do we expect the maximum time to execute a poller loop command should be?
This is a rough idea (in ms) I have.. based on nothing much really, so any ideas would be appreciated:
int TardyMaxTime_ms(OvmsPoller::OvmsPollEntryType entry_type) { switch (entry_type) { case OvmsPoller::OvmsPollEntryType::Poll: return 80; case OvmsPoller::OvmsPollEntryType::FrameRx: return 30; case OvmsPoller::OvmsPollEntryType::FrameTx: return 20; case OvmsPoller::OvmsPollEntryType::Command: return 10; case OvmsPoller::OvmsPollEntryType::PollState: return 15; default: return 80; } }
//.ichael
On Mon, 6 May 2024 at 07:45, Michael Geddes <frog@bunyip.wheelycreek.net> wrote:
I realise that I was only using the standard cable to test - which probably is not sufficient - I haven't looked closely at how the Leaf OBD to Db9 cable is different from standard.
Ah, my bad out the queue length. We are definitely queueing more messages though. From my log of when the overflow happened, the poller was in state 0 which means OFF - ie nothing was being sent!!
I'll look at the TX message thing - opt in sounds good - though it shouldn't be playing that much of a part here as the TXs are infrequent in this case (or zero when the leaf is off or driving) - On the ioniq 5 when I'm using the HUD - I'm polling quite frequently - multiple times per second and that seems to be fine!.
I did find an issue with the throttling .. but it would still mostly apply the throttling where it matters, so again, it shouldn't be the problem (also, we aren't transmitting in the leaf case).
The change I made to the logging of RX messages showed how many in a row were dropped... and it was mostly 1 only in a run - which means even if it is a short time between - that means that the drops are being interleaved by at least one success!
Sooo.. I'm still wondering what is going on. Some things I'm going to try:
* If the number of messages on the Can bus (coming in through RX) means that the queue is slowly getting longer and not quite catching up, then making the queue longer will help it last longer... but only pushes the problem down the road.
- Add 'current queue length' to the poller status information to see if this is indeed the case?
- Add some kind of alert when the queue reaches a % full?
* Once you start overflowing and getting overflow log messages, I wonder if this is then contributing to the problem.
- Push the overflow logging into Poller Task which can look at how many drops occurred since last received item.
* Split up the flags for the poller messages into 2:
- Messages that are/could be happening in the TX/RX tasks
- Other noisy messages that always happen in the poller task.
Thoughts on what else we might measure to figure out what is going on?
//.ichael
On Sun, 5 May 2024, 19:29 Michael Balzer via OvmsDev, <ovmsdev@lists.openvehicles.com> wrote:
Michael,
the queue size isn't in bytes, it's in messages:
* @param uxQueueLength The maximum number of items that the queue can contain. * * @param uxItemSize The number of bytes each item in the queue will require.
Also, from the time stamps in Dereks log excerpt, there were quite some dropped frames in that time window -- at least 23 frames in 40 ms, that's bad.
Queue sizes are currently:
CONFIG_OVMS_HW_CAN_RX_QUEUE_SIZE=60 CONFIG_OVMS_VEHICLE_CAN_RX_QUEUE_SIZE=60
The new poller now channels all TX callbacks through the task queue additionally to RX and commands. So setting the queue size to be larger than the CAN RX queue size seems appropriate.
Nevertheless, an overflow with more than 60 waiting messages still indicates some too long processing time in the vehicle task.
TX callbacks previously were done directly in the CAN context, and no current vehicle overrides the empty default handler, so this imposed almost no additional overhead. By requiring a queue entry for each TX callback, this feature now has a potentially high impact for all vehicles. If passing these to the task is actually necessary, it needs to become an opt-in feature, so only vehicles subscribing to the callback actually need to cope with that additional load & potential processing delays involved.
Regards, Michael
-- Michael Balzer * Helkenberger Weg 9 * D-58256 Ennepetal Fon 02333 / 833 5735 * Handy 0176 / 206 989 26
_______________________________________________ OvmsDev mailing list OvmsDev@lists.openvehicles.com http://lists.openvehicles.com/mailman/listinfo/ovmsdev
_______________________________________________ OvmsDev mailing list OvmsDev@lists.openvehicles.com http://lists.openvehicles.com/mailman/listinfo/ovmsdev
-- Michael Balzer * Helkenberger Weg 9 * D-58256 Ennepetal Fon 02333 / 833 5735 * Handy 0176 / 206 989 26
Thankyou. I was more worried that we might be waiting on each other. I don't think I have quite the correct able to test on my friends Leaf properly, or does it use the standard cable? Anyway, let me know what I can do to. //.ichael On Fri, 14 Jun 2024 at 14:46, Michael Balzer via OvmsDev < ovmsdev@lists.openvehicles.com> wrote:
Sorry, I know I'm behind with PRs.
I'll try to find some time this weekend.
Regards, Michael
Am 14.06.24 um 08:31 schrieb Michael Geddes via OvmsDev:
Was this all good? I want to make sure I get to the bottom of this whole issue asap!
https://github.com/openvehicles/Open-Vehicle-Monitoring-System-3/pull/1018
Was there something else you needed me to work on to make sure this all works for all supported cars?
//.ichael
On Sun, 26 May 2024 at 21:15, Michael Balzer via OvmsDev < ovmsdev@lists.openvehicles.com> wrote:
OK, I see now why it wouldn't send the notification: the V2 & V3 server register for notifications up to COMMAND_RESULT_NORMAL = 1024 characters.
The report quickly becomes larger than 1024 characters, so the notifications no longer get sent via the server connectors.
You need to either reduce the size, split the report, or use data notifications instead.
On the reset value init: for my float targeting smoothing helper class for the UpMiiGo, I implemented a gradual ramp up from 1 to the requested sample size. You can do something similar also with powers of 2. IOW, yes, initialization from the first values received is perfectly OK.
Regards, Michael
Am 26.05.24 um 14:35 schrieb Michael Geddes:
It _*should*_ already be sending a report on charge stop.
MyEvents.RegisterEvent(TAG, "vehicle.charge.stop", std::bind(&OvmsPollers::VehicleChargeStop, this, _1, _2));
Reset on charge start/vehicle on is a good idea.
A question – would it be silly if the first value after a reset, rather than using 0 average to start with, if the average got set to the initial value? I’m in 2 minds about it. It would make the average more useful quicker.
//.ichael
On Sun, 26 May 2024, 19:39 Michael Balzer via OvmsDev, < ovmsdev@lists.openvehicles.com> wrote:
As the averages quickly decline when idle, an automatic report should probably also be sent on charge stop.
Also, I think you should automatically reset the timer statistics on drive & charge start.
First stats from charging my UpMiiGo:
Type | count | Utlztn | Time | per s | [‰] | [ms] ---------------+--------+--------+--------- Poll:PRI Avg| 1.00| 0.723| 0.716 Peak| | 1.282| 3.822 ---------------+--------+--------+--------- Poll:SRX Avg| 7.72| 1.246| 0.184 Peak| | 3.128| 1.058 ---------------+--------+--------+--------- RxCan1[7ae] Avg| 2.48| 0.915| 0.362 Peak| | 1.217| 1.661 ---------------+--------+--------+--------- RxCan1[7cf] Avg| 4.76| 1.928| 0.397 Peak| | 2.317| 2.687 ---------------+--------+--------+--------- RxCan1[7ed] Avg| 3.38| 1.251| 0.327 Peak| | 8.154| 12.273 ---------------+--------+--------+--------- RxCan1[7ee] Avg| 0.21| 0.066| 0.297 Peak| | 0.225| 1.690 ---------------+--------+--------+--------- TxCan1[744] Avg| 1.49| 0.022| 0.011 Peak| | 0.032| 0.095 ---------------+--------+--------+--------- TxCan1[765] Avg| 3.89| 0.134| 0.027 Peak| | 0.155| 0.113 ---------------+--------+--------+--------- TxCan1[7e5] Avg| 2.32| 0.038| 0.013 Peak| | 0.295| 0.084 ---------------+--------+--------+--------- TxCan1[7e6] Avg| 1 0.21| 0.002| 0.008 Peak| | 0.010| 0.041 ---------------+--------+--------+--------- Cmd:State Avg| 0.00| 0.000| 0.007 Peak| | 0.005| 0.072 ===============+========+========+========= Total Avg| 27.46| 6.324| 2.349
Overall healthy I'd say, but let's see how it compares.
7ed is the BMS, the peak time is probably related to the extended cell data logging -- I've enabled log intervals for both cell voltages & temperatures.
Regards, Michael
Am 26.05.24 um 08:42 schrieb Michael Balzer via OvmsDev:
The notification works on my devices, it only has a garbled per mille character -- see attached screenshot. The same applies to the mail version:
Poller timing is: on
Type | count | Utlztn | Time
| per s | [‰] | [ms]
---------------+--------+--------+---------
Poll:PRI Avg| 0.25| 0.119| 0.382
Peak| | 0.513| 0.678
---------------+--------+--------+---------
RxCan1[597] Avg| 0.01| 0.004| 0.021
Peak| | 0.000| 0.338
---------------+--------+--------+---------
RxCan1[59b] Avg| 0.01| 0.011| 0.053
Peak| | 0.000| 0.848
---------------+--------+--------+---------
Cmd:State Avg| 0.01| 0.002| 0.012
Peak| | 0.000| 0.120
===============+========+========+=========
Total Avg| 0.28| 0.135| 0.468
The encoding is a general issue. The character encoding for text messages via V2/MP is quite old & clumsy, it's got an issue with the degree celcius character as well. We previously tried to keep all text messages within the SMS safe character set (which e.g. lead to writing just "C" instead of "°C"). I'd say we should head towards UTF-8 now. If we ever refit SMS support, we can recode on the fly.
Regarding not seeing the notification on your phone:
a) Check your notification subtype/channel filters on the module. See https://docs.openvehicles.com/en/latest/userguide/notifications.html#suppres...
b) Check your notification vehicle filters on the phone (menu on notification tab): if you enabled the vehicle filter, it will add the messages of not currently selected vehicles to the list only, but not raise a system notification. (Applies to the Android App, no idea about the iOS version)
Regards, Michael
Am 26.05.24 um 06:32 schrieb Michael Geddes:
Hi,
I'm trying to finalise this now .. and one last thing is that I don't get the report coming to my mobile. I'm using the command:
MyNotify.NotifyString("info", "poller.report", buf.c_str());
Where the buffer string is just the same as the report output. Should I be using some other format or command?
I get "alert" types (like the ioniq5 door-open alert) fine to my mobile.
Michael.
On Sun, 19 May 2024, 12:51 Michael Balzer via OvmsDev, < ovmsdev@lists.openvehicles.com> wrote:
A builtin web UI for this seems a bit over the top. Builtin web config pages should focus on user features, this is clearly a feature only needed during/for the development/extension of a vehicle adapter. Development features in the web UI are confusing for end users.
If persistent enabling/disabling is done by a simple config command (e.g. "config set can poller.trace on"), that's also doable by users.
Regards, Michael
Am 19.05.24 um 02:06 schrieb Michael Geddes:
I was so focused on how I calculated the value that I totally missed that ‰ would be a better description. I could also use the system 'Ratio' unit... so % or ‰.
I'll make space to put 'Avg' on the row. Was trying to limit the width for output on a mobile. I agree it would make it easier to understand.
Totals also makes sense.
Should I make this a configuration that can be set on the web-page? I'd probably use a configuration change notification so that the very bit setting is sync'd with the 'configuration' value.
//.ichael
On Sat, 18 May 2024, 14:05 Michael Balzer, <dexter@expeedo.de> wrote:
I'm not sure whether the 'max' should be the maximum of the smoothed value.. or the maximum of the raw value.
It should normally be the maximum of the raw value I think, the maximum of the smoothed value cannot tell about how bad the processing of an ID can become.
The naming in the table is a bit confusing I think. (besides: I've never seen "ave" as the abbreviation for average)
If I understand you correctly, "time ms per s" is the time share in per mille, so something in that direction would be more clear, and "length ms" would then be "time [ms]".
The totals for all averages in the table foot would also be nice.
Maybe "Ave" (or avg?) also should be placed on the left, as the "peak" label now suggests being the peak of the average.
Btw, keep in mind, not all "edge" users / testers are developers (e.g. the Twizy driver I'm in contact with), collecting stats feedback for vehicles from testers should be straight forward. Maybe add a data/history record, sent automatically on every drive/charge stop when the poller tracing is on?
Regards, Michael
Am 18.05.24 um 02:28 schrieb Michael Geddes:
You did say max/pead value. I also halved the N for both.
I'm not sure whether the 'max' should be the maximum of the smoothed value.. or the maximum of the raw value.
This is currently the raw-value maximum.
The problem is that the middle column is the maximum of the {{sum over 10s} / (10*1000,000)
I could easily change the 'period' to 1s and see how that goes.. was just trying to reduce the larger calculations.
Usage: poller [pause|resume|status|times|trace]
OVMS# poller time status Poller timing is: on Type | Count | Ave time | Ave length | per s | ms per s | ms -------------+----------+-----------+----------- Poll:PRI | 1.00| 0.559| 0.543 peak | | 0.663| 1.528 -------------+----------+-----------+----------- Poll:SRX | 0.08| 0.009| 0.038 peak | | 0.068| 0.146 -------------+----------+-----------+----------- CAN1 RX[778] | 0.11| 0.061| 0.280 peak | | 0.458| 1.046 -------------+----------+-----------+----------- CAN1 RX[7a8] | 0.04| 0.024| 0.124 peak | | 0.160| 0.615 -------------+----------+-----------+----------- CAN1 TX[770] | 0.05| 0.004| 0.016 peak | | 0.022| 0.102 -------------+----------+-----------+----------- CAN1 TX[7a0] | 0.02| 0.002| 0.011 peak | | 0.010| 0.098 -------------+----------+-----------+----------- CAN1 TX[7b3] | 0.01| 0.001| 0.006 peak | | 0.000| 0.099 -------------+----------+-----------+----------- CAN1 TX[7e2] | 0.02| 0.002| 0.011 peak | | 0.010| 0.099 -------------+----------+-----------+----------- CAN1 TX[7e4] | 0.08| 0.008| 0.048 peak | | 0.049| 0.107 -------------+----------+-----------+----------- Cmd:State | 0.00| 0.000| 0.005 peak | | 0.000| 0.094
On Fri, 17 May 2024 at 15:26, Michael Geddes <frog@bunyip.wheelycreek.net> wrote:
This is what I have now.
The one on the end is the one MIchael B was after using an N of 32. (up for discussion).
The middle is the time spent in that even t per second. It accumulates times (in microseconds), and then every 10s it stores it as smoothed (N=16) value.
The Count is similar (except that we store a value of '100' as 1 event so it can be still integers and has 2 decimal places).
Every received poll does a 64bit difference to 32bit (for the elapsed time) and 64bit comparison (for end-of-period).
It also does 1x 32bit smoothing and 2x 32bit adds.
Then at the end of a 10s period, it will do a 64bit add to get the next end-of-period value, as well as the 2x 32bit smoothing calcs.
This is from the Ioniq 5 so not any big values yet. You can certainly see how insignificant the TX callbacks are.
I'll leave it on for when the car is moving and gets some faster polling.
OVMS# poll time status Poller timing is: on Type | Count | Ave time | Ave Length | per s | ms per s | ms -------------+----------+-----------+----------- Poll:PRI | 1.00| 0.540| 0.539 Poll:SRX | 0.03| 0.004| 0.017 CAN1 RX[778] | 0.06| 0.042| 0.175 CAN1 TX[770] | 0.04| 0.002| 0.008 Cmd:State | 0.01| 0.001| 0.005
----------------------8<--------------------------------
Nice smoothing class (forces N as a power of 2):
constexpr unsigned floorlog2(unsigned x) { return x == 1 ? 0 : 1+floorlog2(x >> 1); } /* Maintain a smoothed average using shifts for division. * T should be an integer type * N needs to be a power of 2 */ template <typename T, unsigned N> class average_util_t { private: T m_ave; public: average_util_t() : m_ave(0) {} static const uint8_t _BITS = floorlog2(N); void add( T val) { static_assert(N == (1 << _BITS), "N must be a power of 2"); m_ave = (((N-1) * m_ave) + val) >> _BITS; } T get() { return m_ave; } operator T() { return m_ave; } };
On Thu, 16 May 2024 at 10:29, Michael Geddes <frog@bunyip.wheelycreek.net> wrote:
Thanks Michael,
My calculations give me ((2^32)-1) / (1000*1000*3600) = only 1.2 hours of processing time in 32bit. The initial subtraction is 64bit anyway and I can't see a further 64bit addition being a problem. I have the calculations being performed in doubles at print-out where performance is not really an issue anyway. (Though apparently doing 64 bit division is worse than floating point).
In addition
* I currently have this being able to be turned on and off and reset manually (only do it when required).
* For the lower volume commands, the smoothed average is not going to be useful - the count is more interesting for different reasons.
* The total time is quite useful. Ie a high average time doesn't matter if the count is low. The things that are affecting performance are stuff with high total time. Stuff which is happening 100 times a second needs to be a much lower average than once a second.
* A measure like 'time per minute/second' and possibly count per minute/seconds as a smoothed average would potentially be more useful. (or in addition?)
I think we could do _that_ in a reasonably efficient manner using a 64 bit 'last measured time', a 32 bit accumulated value and the stored 32 bit rolling average.
It would boils down to some iterative (integer) sums and multiplications plus a divide by n ^ (time periods passed) - which is a shift - and which can be optimised to '0' if 'time-periods-passed' is more than 32/(bits-per-n) - effectively limiting the number of iterations.
The one issue I can see is that we need to calculate 'number of time-periods passed' which is a 64 bit subtraction followed by a 32 bit division (not optimisable to a simple shift).
* I'm also happy to keep a rolling (32bit) average time.
Even if you assume averages in the 100ms, 32bit is going to happily support an N of 64 or even 128.
Am I right in thinking that the choice of N is highly dependent on frequency. For things happening 100 times per second, you might want an N like 128.. where things happening once per
second, you might want an N of 4 or 8. The other things we keep track of in this manner we have a better idea of the frequency of the thing.
How about we have (per record type):
* total count (since last reset?) (32 bit)
* smoothed average of time per instance (32 bit)
* ?xx? total accumulated time since last reset (64bit) ?? <-- with the below stats this is much less useful
* last-measured-time (64 bit)
* accumulated count since last time-period (16bit - but maybe 32bit anyway for byte alignment?)
* smoothed average of count per time-period (32bit)
* accumulated time since last time-period (32bit)
* smoothed average of time per time-period (32bit)
It's possible to keep the
Is this going to be too much per record type? The number of 'records' we are keeping is quite low (so 10 to 20 maybe) - so it's not a huge memory burden.
Thoughts?
//.ichael
On Thu, 16 May 2024 at 03:09, Michael Balzer via OvmsDev < ovmsdev@lists.openvehicles.com> wrote:
esp_timer_get_time() is the right choice for precision timing.
I'd say uint32 is enough though, even if counting microseconds that can hold a total of more than 71 hours of actual processing time. uint64 has a significant performance penalty, although I don't recall the overhead for simple additions.
Also & more important, the average wouldn't be my main focus, but the maximum processing time seen per ID, which seems to be missing in your draft.
Second thought on the average… the exact overall average really has a minor meaning, I'd rather see the current average, adapting to the current mode of operation (drive/charge/…). I suggest feeding the measurements to a low pass filter to get the smoothed average of the last n measurements. Pattern:
runavg = ((N-1) * runavg + newval) / N
By using a low power of 2 for N (e.g. 8 or 16), you can replace the division by a simple bit shift, and have enough headroom to use 32 bit integers.
Regards, Michael
Am 15.05.24 um 06:51 schrieb Michael Geddes via OvmsDev:
Formatting aside, I have implemented what I think Michael B was suggesting. This is a sample run on the Ioniq 5 (which doesn't have unsolicited RX events).
This uses the call esp_timer_get_time() got get a 64bit *microseconds* since started value - and works out the time to execute that way. It's looking at absolute time and not time in the Task - so other things going on at the same time in other tasks will have an effect. (The normal tick count doesn't have nearly enough resolution to be useful - any other ideas on measurement?) I've got total accumulated time displaying in seconds and the average in milliseconds currently - but I can change that easy enough.
The cumulative time is stored as uint64_t which will be plenty, as 32bit wouldn't be nearly enough.
OVMS# *poller time on* Poller timing is now on
OVMS# *poller time status* Poller timing is: on Poll [PRI] : n=390 tot=0.2s ave=0.586ms Poll [SRX] : n=316 tot=0.1s ave=0.196ms CAN1 RX[0778] : n=382 tot=0.2s ave=0.615ms CAN1 RX[07a8] : n=48 tot=0.0s ave=0.510ms CAN1 RX[07bb] : n=162 tot=0.1s ave=0.519ms CAN1 RX[07ce] : n=33 tot=0.0s ave=0.469ms CAN1 RX[07ea] : n=408 tot=0.2s ave=0.467ms CAN1 RX[07ec] : n=486 tot=0.2s ave=0.477ms CAN3 RX[07df] : n=769 tot=0.2s ave=0.261ms CAN1 TX[0770] : n=191 tot=0.0s ave=0.054ms CAN1 TX[07a0] : n=16 tot=0.0s ave=0.047ms CAN1 TX[07b3] : n=31 tot=0.0s ave=0.069ms CAN1 TX[07c6] : n=11 tot=0.0s ave=0.044ms CAN1 TX[07e2] : n=82 tot=0.0s ave=0.067ms CAN1 TX[07e4] : n=54 tot=0.0s ave=0.044ms Set State : n=7 tot=0.0s ave=0.104ms
This is probably going to be quite useful in general! The TX call-backs don't seem to be significant here. (oh, I should probably implement a reset of the values too).
//.ichael
On Sun, 12 May 2024 at 22:58, Michael Geddes <frog@bunyip.wheelycreek.net> wrote:
Yeah - I certainly wasn't going to put a hard limit. Just a log above a certain time, that being said, the idea of just collecting stats (being able to turn it on via a "poller timer" set of commands) would be much more useful. I'll look into that.
Average time is probably a good stat - and certainly what we care about.
I actually am hopeful that those couple of things I did might help reduce that average time quite a bit (that short-cutting the isotp protocol handling especially).
That p/r with logging changes might help reduce the unproductive log time further, but also makes it possible to turn on the poller logging without the RX task logs kicking in.
//.ichael
On Sun, 12 May 2024 at 22:29, Michael Balzer via OvmsDev < ovmsdev@lists.openvehicles.com> wrote:
Warning / gathering debug statistics about slow processing can be helpful, but there must not be a hard limit. Frame/poll response processing may need disk or network I/O, and the vehicle task may be starving from punctual high loads on higher priority tasks (e.g. networking) or by needing to wait for some semaphore -- that's outside the application's control, and must not lead to termination/recreation of the task (in case you're heading towards that direction).
I have no idea how much processing time the current vehicles actually need in their respective worst cases. Your draft is probably too lax, poll responses and frames normally need to be processed much faster. I'd say 10 ms is already too slow, but any wait for a queue/semaphore will already mean at least 10 ms (FreeRTOS tick). Probably best to begin with just collecting stats.
Btw, to help in narrowing down the actual problem case, the profiler could collect max times per RX message ID.
Regards, Michael
Am 12.05.24 um 10:41 schrieb Michael Geddes:
I have a question for Michael B (or whoever) - I have a commit lined up that would add a bit of a time check to the poller loop. What do we expect the maximum time to execute a poller loop command should be?
This is a rough idea (in ms) I have.. based on nothing much really, so any ideas would be appreciated:
int TardyMaxTime_ms(OvmsPoller::OvmsPollEntryType entry_type) { switch (entry_type) { case OvmsPoller::OvmsPollEntryType::Poll: return 80; case OvmsPoller::OvmsPollEntryType::FrameRx: return 30; case OvmsPoller::OvmsPollEntryType::FrameTx: return 20; case OvmsPoller::OvmsPollEntryType::Command: return 10; case OvmsPoller::OvmsPollEntryType::PollState: return 15; default: return 80; } }
//.ichael
On Mon, 6 May 2024 at 07:45, Michael Geddes <frog@bunyip.wheelycreek.net> wrote:
I realise that I was only using the standard cable to test - which probably is not sufficient - I haven't looked closely at how the Leaf OBD to Db9 cable is different from standard.
Ah, my bad out the queue length. We are definitely queueing more messages though. From my log of when the overflow happened, the poller was in state 0 which means OFF - ie nothing was being sent!!
I'll look at the TX message thing - opt in sounds good - though it shouldn't be playing that much of a part here as the TXs are infrequent in this case (or zero when the leaf is off or driving) - On the ioniq 5 when I'm using the HUD - I'm polling quite frequently - multiple times per second and that seems to be fine!.
I did find an issue with the throttling .. but it would still mostly apply the throttling where it matters, so again, it shouldn't be the problem (also, we aren't transmitting in the leaf case).
The change I made to the logging of RX messages showed how many in a row were dropped... and it was mostly 1 only in a run - which means even if it is a short time between - that means that the drops are being interleaved by at least one success!
Sooo.. I'm still wondering what is going on. Some things I'm going to try:
* If the number of messages on the Can bus (coming in through RX) means that the queue is slowly getting longer and not quite catching up, then making the queue longer will help it last longer... but only pushes the problem down the road.
- Add 'current queue length' to the poller status information to see if this is indeed the case?
- Add some kind of alert when the queue reaches a % full?
* Once you start overflowing and getting overflow log messages, I wonder if this is then contributing to the problem.
- Push the overflow logging into Poller Task which can look at how many drops occurred since last received item.
* Split up the flags for the poller messages into 2:
- Messages that are/could be happening in the TX/RX tasks
- Other noisy messages that always happen in the poller task.
Thoughts on what else we might measure to figure out what is going on?
//.ichael
On Sun, 5 May 2024, 19:29 Michael Balzer via OvmsDev, < ovmsdev@lists.openvehicles.com> wrote:
Michael,
the queue size isn't in bytes, it's in messages:
* @param uxQueueLength The maximum number of items that the queue can contain. * * @param uxItemSize The number of bytes each item in the queue will require.
Also, from the time stamps in Dereks log excerpt, there were quite some dropped frames in that time window -- at least 23 frames in 40 ms, that's bad.
Queue sizes are currently:
CONFIG_OVMS_HW_CAN_RX_QUEUE_SIZE=60 CONFIG_OVMS_VEHICLE_CAN_RX_QUEUE_SIZE=60
The new poller now channels all TX callbacks through the task queue additionally to RX and commands. So setting the queue size to be larger than the CAN RX queue size seems appropriate.
Nevertheless, an overflow with more than 60 waiting messages still indicates some too long processing time in the vehicle task.
TX callbacks previously were done directly in the CAN context, and no current vehicle overrides the empty default handler, so this imposed almost no additional overhead. By requiring a queue entry for each TX callback, this feature now has a potentially high impact for all vehicles. If passing these to the task is actually necessary, it needs to become an opt-in feature, so only vehicles subscribing to the callback actually need to cope with that additional load & potential processing delays involved.
Regards, Michael
-- Michael Balzer * Helkenberger Weg 9 * D-58256 Ennepetal Fon 02333 / 833 5735 * Handy 0176 / 206 989 26
_______________________________________________ OvmsDev mailing list OvmsDev@lists.openvehicles.com http://lists.openvehicles.com/mailman/listinfo/ovmsdev
_______________________________________________ OvmsDev mailing listOvmsDev@lists.openvehicles.comhttp://lists.openvehicles.com/mailman/listinfo/ovmsdev
-- Michael Balzer * Helkenberger Weg 9 * D-58256 Ennepetal Fon 02333 / 833 5735 * Handy 0176 / 206 989 26
_______________________________________________ OvmsDev mailing list OvmsDev@lists.openvehicles.com http://lists.openvehicles.com/mailman/listinfo/ovmsdev
Michael, I've received the new drive report notifications now; these need to be changed: please do not use text notifications to transport CSV data. That's what "data" notifications are meant for, which are stored in their raw form on the server for later retrieval. See e.g. the vehicle trip & grid logs for reference on how to build the messages, or have a look at the specific Twizy and UpMiiGo data messages. Data notifications also are designed to transport one row at a time, so you normally don't run into buffer size issues. A header can be supplied as a row, but you normally add one when downloading the data from the server, so tools don't need to filter these out. I provide headers automatically on my server for known message types, just send me your template and I'll include that. Apart from that, the timing statistics now seem to work pretty well, providing valuable insights. Regards, Michael Am 14.06.24 um 08:59 schrieb Michael Geddes:
Thankyou. I was more worried that we might be waiting on each other.
I don't think I have quite the correct able to test on my friends Leaf properly, or does it use the standard cable?
Anyway, let me know what I can do to.
//.ichael
On Fri, 14 Jun 2024 at 14:46, Michael Balzer via OvmsDev <ovmsdev@lists.openvehicles.com> wrote:
Sorry, I know I'm behind with PRs.
I'll try to find some time this weekend.
Regards, Michael
Am 14.06.24 um 08:31 schrieb Michael Geddes via OvmsDev:
Was this all good? I want to make sure I get to the bottom of this whole issue asap!
https://github.com/openvehicles/Open-Vehicle-Monitoring-System-3/pull/1018
Was there something else you needed me to work on to make sure this all works for all supported cars?
//.ichael
On Sun, 26 May 2024 at 21:15, Michael Balzer via OvmsDev <ovmsdev@lists.openvehicles.com> wrote:
OK, I see now why it wouldn't send the notification: the V2 & V3 server register for notifications up to COMMAND_RESULT_NORMAL = 1024 characters.
The report quickly becomes larger than 1024 characters, so the notifications no longer get sent via the server connectors.
You need to either reduce the size, split the report, or use data notifications instead.
On the reset value init: for my float targeting smoothing helper class for the UpMiiGo, I implemented a gradual ramp up from 1 to the requested sample size. You can do something similar also with powers of 2. IOW, yes, initialization from the first values received is perfectly OK.
Regards, Michael
Am 26.05.24 um 14:35 schrieb Michael Geddes:
It _/should/_ already be sending a report on charge stop.
MyEvents.RegisterEvent(TAG, "vehicle.charge.stop", std::bind(&OvmsPollers::VehicleChargeStop, this, _1, _2));
Reset on charge start/vehicle on is a good idea.
A question – would it be silly if the first value after a reset, rather than using 0 average to start with, if the average got set to the initial value? I’m in 2 minds about it. It would make the average more useful quicker.
//.ichael
On Sun, 26 May 2024, 19:39 Michael Balzer via OvmsDev, <ovmsdev@lists.openvehicles.com> wrote:
As the averages quickly decline when idle, an automatic report should probably also be sent on charge stop.
Also, I think you should automatically reset the timer statistics on drive & charge start.
First stats from charging my UpMiiGo:
Type | count | Utlztn | Time | per s | [‰] | [ms] ---------------+--------+--------+--------- Poll:PRI Avg| 1.00| 0.723| 0.716 Peak| | 1.282| 3.822 ---------------+--------+--------+--------- Poll:SRX Avg| 7.72| 1.246| 0.184 Peak| | 3.128| 1.058 ---------------+--------+--------+--------- RxCan1[7ae] Avg| 2.48| 0.915| 0.362 Peak| | 1.217| 1.661 ---------------+--------+--------+--------- RxCan1[7cf] Avg| 4.76| 1.928| 0.397 Peak| | 2.317| 2.687 ---------------+--------+--------+--------- RxCan1[7ed] Avg| 3.38| 1.251| 0.327 Peak| | 8.154| 12.273 ---------------+--------+--------+--------- RxCan1[7ee] Avg| 0.21| 0.066| 0.297 Peak| | 0.225| 1.690 ---------------+--------+--------+--------- TxCan1[744] Avg| 1.49| 0.022| 0.011 Peak| | 0.032| 0.095 ---------------+--------+--------+--------- TxCan1[765] Avg| 3.89| 0.134| 0.027 Peak| | 0.155| 0.113 ---------------+--------+--------+--------- TxCan1[7e5] Avg| 2.32| 0.038| 0.013 Peak| | 0.295| 0.084 ---------------+--------+--------+--------- TxCan1[7e6] Avg| 1 0.21| 0.002| 0.008 Peak| | 0.010| 0.041 ---------------+--------+--------+--------- Cmd:State Avg| 0.00| 0.000| 0.007 Peak| | 0.005| 0.072 ===============+========+========+========= Total Avg| 27.46| 6.324| 2.349
Overall healthy I'd say, but let's see how it compares.
7ed is the BMS, the peak time is probably related to the extended cell data logging -- I've enabled log intervals for both cell voltages & temperatures.
Regards, Michael
Am 26.05.24 um 08:42 schrieb Michael Balzer via OvmsDev:
The notification works on my devices, it only has a garbled per mille character -- see attached screenshot. The same applies to the mail version:
Poller timing is: on
Type | count | Utlztn | Time
| per s | [‰] | [ms]
---------------+--------+--------+---------
Poll:PRI Avg| 0.25| 0.119| 0.382
Peak| | 0.513| 0.678
---------------+--------+--------+---------
RxCan1[597] Avg| 0.01| 0.004| 0.021
Peak| | 0.000| 0.338
---------------+--------+--------+---------
RxCan1[59b] Avg| 0.01| 0.011| 0.053
Peak| | 0.000| 0.848
---------------+--------+--------+---------
Cmd:State Avg| 0.01| 0.002| 0.012
Peak| | 0.000| 0.120
===============+========+========+=========
Total Avg| 0.28| 0.135| 0.468
The encoding is a general issue. The character encoding for text messages via V2/MP is quite old & clumsy, it's got an issue with the degree celcius character as well. We previously tried to keep all text messages within the SMS safe character set (which e.g. lead to writing just "C" instead of "°C"). I'd say we should head towards UTF-8 now. If we ever refit SMS support, we can recode on the fly.
Regarding not seeing the notification on your phone:
a) Check your notification subtype/channel filters on the module. See https://docs.openvehicles.com/en/latest/userguide/notifications.html#suppres...
b) Check your notification vehicle filters on the phone (menu on notification tab): if you enabled the vehicle filter, it will add the messages of not currently selected vehicles to the list only, but not raise a system notification. (Applies to the Android App, no idea about the iOS version)
Regards, Michael
Am 26.05.24 um 06:32 schrieb Michael Geddes:
Hi,
I'm trying to finalise this now .. and one last thing is that I don't get the report coming to my mobile. I'm using the command:
MyNotify.NotifyString("info", "poller.report", buf.c_str());
Where the buffer string is just the same as the report output. Should I be using some other format or command?
I get "alert" types (like the ioniq5 door-open alert) fine to my mobile.
Michael.
On Sun, 19 May 2024, 12:51 Michael Balzer via OvmsDev, <ovmsdev@lists.openvehicles.com> wrote:
A builtin web UI for this seems a bit over the top. Builtin web config pages should focus on user features, this is clearly a feature only needed during/for the development/extension of a vehicle adapter. Development features in the web UI are confusing for end users.
If persistent enabling/disabling is done by a simple config command (e.g. "config set can poller.trace on"), that's also doable by users.
Regards, Michael
Am 19.05.24 um 02:06 schrieb Michael Geddes:
I was so focused on how I calculated the value that I totally missed that ‰ would be a better description. I could also use the system 'Ratio' unit... so % or ‰.
I'll make space to put 'Avg' on the row. Was trying to limit the width for output on a mobile. I agree it would make it easier to understand.
Totals also makes sense.
Should I make this a configuration that can be set on the web-page? I'd probably use a configuration change notification so that the very bit setting is sync'd with the 'configuration' value.
//.ichael
On Sat, 18 May 2024, 14:05 Michael Balzer, <dexter@expeedo.de> wrote:
I'm not sure whether the 'max' should be the maximum of the smoothed value.. or the maximum of the raw value.
It should normally be the maximum of the raw value I think, the maximum of the smoothed value cannot tell about how bad the processing of an ID can become.
The naming in the table is a bit confusing I think. (besides: I've never seen "ave" as the abbreviation for average)
If I understand you correctly, "time ms per s" is the time share in per mille, so something in that direction would be more clear, and "length ms" would then be "time [ms]".
The totals for all averages in the table foot would also be nice.
Maybe "Ave" (or avg?) also should be placed on the left, as the "peak" label now suggests being the peak of the average.
Btw, keep in mind, not all "edge" users / testers are developers (e.g. the Twizy driver I'm in contact with), collecting stats feedback for vehicles from testers should be straight forward. Maybe add a data/history record, sent automatically on every drive/charge stop when the poller tracing is on?
Regards, Michael
Am 18.05.24 um 02:28 schrieb Michael Geddes:
You did say max/pead value. I also halved the N for both.
I'm not sure whether the 'max' should be the maximum of the smoothed value.. or the maximum of the raw value.
This is currently the raw-value maximum.
The problem is that the middle column is the maximum of the {{sum over 10s} / (10*1000,000)
I could easily change the 'period' to 1s and see how that goes.. was just trying to reduce the larger calculations.
Usage: poller [pause|resume|status|times|trace]
OVMS# poller time status Poller timing is: on Type | Count | Ave time | Ave length | per s | ms per s | ms -------------+----------+-----------+----------- Poll:PRI | 1.00| 0.559| 0.543 peak | | 0.663| 1.528 -------------+----------+-----------+----------- Poll:SRX | 0.08| 0.009| 0.038 peak | | 0.068| 0.146 -------------+----------+-----------+----------- CAN1 RX[778] | 0.11| 0.061| 0.280 peak | | 0.458| 1.046 -------------+----------+-----------+----------- CAN1 RX[7a8] | 0.04| 0.024| 0.124 peak | | 0.160| 0.615 -------------+----------+-----------+----------- CAN1 TX[770] | 0.05| 0.004| 0.016 peak | | 0.022| 0.102 -------------+----------+-----------+----------- CAN1 TX[7a0] | 0.02| 0.002| 0.011 peak | | 0.010| 0.098 -------------+----------+-----------+----------- CAN1 TX[7b3] | 0.01| 0.001| 0.006 peak | | 0.000| 0.099 -------------+----------+-----------+----------- CAN1 TX[7e2] | 0.02| 0.002| 0.011 peak | | 0.010| 0.099 -------------+----------+-----------+----------- CAN1 TX[7e4] | 0.08| 0.008| 0.048 peak | | 0.049| 0.107 -------------+----------+-----------+----------- Cmd:State | 0.00| 0.000| 0.005 peak | | 0.000| 0.094
On Fri, 17 May 2024 at 15:26, Michael Geddes <frog@bunyip.wheelycreek.net> wrote:
This is what I have now.
The one on the end is the one MIchael B was after using an N of 32. (up for discussion).
The middle is the time spent in that even t per second. It accumulates times (in microseconds), and then every 10s it stores it as smoothed (N=16) value.
The Count is similar (except that we store a value of '100' as 1 event so it can be still integers and has 2 decimal places).
Every received poll does a 64bit difference to 32bit (for the elapsed time) and 64bit comparison (for end-of-period).
It also does 1x 32bit smoothing and 2x 32bit adds.
Then at the end of a 10s period, it will do a 64bit add to get the next end-of-period value, as well as the 2x 32bit smoothing calcs.
This is from the Ioniq 5 so not any big values yet. You can certainly see how insignificant the TX callbacks are.
I'll leave it on for when the car is moving and gets some faster polling.
OVMS# poll time status Poller timing is: on Type | Count | Ave time | Ave Length | per s | ms per s | ms -------------+----------+-----------+----------- Poll:PRI | 1.00| 0.540| 0.539 Poll:SRX | 0.03| 0.004| 0.017 CAN1 RX[778] | 0.06| 0.042| 0.175 CAN1 TX[770] | 0.04| 0.002| 0.008 Cmd:State | 0.01| 0.001| 0.005
----------------------8<--------------------------------
Nice smoothing class (forces N as a power of 2):
constexpr unsigned floorlog2(unsigned x) { return x == 1 ? 0 : 1+floorlog2(x >> 1); } /* Maintain a smoothed average using shifts for division. * T should be an integer type * N needs to be a power of 2 */ template <typename T, unsigned N> class average_util_t { private: T m_ave; public: average_util_t() : m_ave(0) {} static const uint8_t _BITS = floorlog2(N); void add( T val) { static_assert(N == (1 << _BITS), "N must be a power of 2"); m_ave = (((N-1) * m_ave) + val) >> _BITS; } T get() { return m_ave; } operator T() { return m_ave; } };
On Thu, 16 May 2024 at 10:29, Michael Geddes <frog@bunyip.wheelycreek.net> wrote:
Thanks Michael,
My calculations give me ((2^32)-1) / (1000*1000*3600) = only 1.2 hours of processing time in 32bit. The initial subtraction is 64bit anyway and I can't see a further 64bit addition being a problem. I have the calculations being performed in doubles at print-out where performance is not really an issue anyway. (Though apparently doing 64 bit division is worse than floating point).
In addition
* I currently have this being able to be turned on and off and reset manually (only do it when required).
* For the lower volume commands, the smoothed average is not going to be useful - the count is more interesting for different reasons.
* The total time is quite useful. Ie a high average time doesn't matter if the count is low. The things that are affecting performance are stuff with high total time. Stuff which is happening 100 times a second needs to be a much lower average than once a second.
* A measure like 'time per minute/second' and possibly count per minute/seconds as a smoothed average would potentially be more useful. (or in addition?)
I think we could do _that_ in a reasonably efficient manner using a 64 bit 'last measured time', a 32 bit accumulated value and the stored 32 bit rolling average.
It would boils down to some iterative (integer) sums and multiplications plus a divide by n ^ (time periods passed) - which is a shift - and which can be optimised to '0' if 'time-periods-passed' is more than 32/(bits-per-n) - effectively limiting the number of iterations.
The one issue I can see is that we need to calculate 'number of time-periods passed' which is a 64 bit subtraction followed by a 32 bit division (not optimisable to a simple shift).
* I'm also happy to keep a rolling (32bit) average time.
Even if you assume averages in the 100ms, 32bit is going to happily support an N of 64 or even 128.
Am I right in thinking that the choice of N is highly dependent on frequency. For things happening 100 times per second, you might want an N like 128.. where things happening once per
second, you might want an N of 4 or 8. The other things we keep track of in this manner we have a better idea of the frequency of the thing.
How about we have (per record type):
* total count (since last reset?) (32 bit)
* smoothed average of time per instance (32 bit)
* ?xx? total accumulated time since last reset (64bit) ?? <-- with the below stats this is much less useful
* last-measured-time (64 bit)
* accumulated count since last time-period (16bit - but maybe 32bit anyway for byte alignment?)
* smoothed average of count per time-period (32bit)
* accumulated time since last time-period (32bit)
* smoothed average of time per time-period (32bit)
It's possible to keep the
Is this going to be too much per record type? The number of 'records' we are keeping is quite low (so 10 to 20 maybe) - so it's not a huge memory burden.
Thoughts?
//.ichael
On Thu, 16 May 2024 at 03:09, Michael Balzer via OvmsDev <ovmsdev@lists.openvehicles.com> wrote:
esp_timer_get_time() is the right choice for precision timing.
I'd say uint32 is enough though, even if counting microseconds that can hold a total of more than 71 hours of actual processing time. uint64 has a significant performance penalty, although I don't recall the overhead for simple additions.
Also & more important, the average wouldn't be my main focus, but the maximum processing time seen per ID, which seems to be missing in your draft.
Second thought on the average… the exact overall average really has a minor meaning, I'd rather see the current average, adapting to the current mode of operation (drive/charge/…). I suggest feeding the measurements to a low pass filter to get the smoothed average of the last n measurements. Pattern:
runavg = ((N-1) * runavg + newval) / N
By using a low power of 2 for N (e.g. 8 or 16), you can replace the division by a simple bit shift, and have enough headroom to use 32 bit integers.
Regards, Michael
Am 15.05.24 um 06:51 schrieb Michael Geddes via OvmsDev:
Formatting aside, I have implemented what I think Michael B was suggesting. This is a sample run on the Ioniq 5 (which doesn't have unsolicited RX events).
This uses the call esp_timer_get_time() got get a 64bit *microseconds* since started value - and works out the time to execute that way. It's looking at absolute time and not time in the Task - so other things going on at the same time in other tasks will have an effect. (The normal tick count doesn't have nearly enough resolution to be useful - any other ideas on measurement?) I've got total accumulated time displaying in seconds and the average in milliseconds currently - but I can change that easy enough.
The cumulative time is stored as uint64_t which will be plenty, as 32bit wouldn't be nearly enough.
OVMS# *poller time on* Poller timing is now on
OVMS# *poller time status* Poller timing is: on Poll [PRI] : n=390 tot=0.2s ave=0.586ms Poll [SRX] : n=316 tot=0.1s ave=0.196ms CAN1 RX[0778] : n=382 tot=0.2s ave=0.615ms CAN1 RX[07a8] : n=48 tot=0.0s ave=0.510ms CAN1 RX[07bb] : n=162 tot=0.1s ave=0.519ms CAN1 RX[07ce] : n=33 tot=0.0s ave=0.469ms CAN1 RX[07ea] : n=408 tot=0.2s ave=0.467ms CAN1 RX[07ec] : n=486 tot=0.2s ave=0.477ms CAN3 RX[07df] : n=769 tot=0.2s ave=0.261ms CAN1 TX[0770] : n=191 tot=0.0s ave=0.054ms CAN1 TX[07a0] : n=16 tot=0.0s ave=0.047ms CAN1 TX[07b3] : n=31 tot=0.0s ave=0.069ms CAN1 TX[07c6] : n=11 tot=0.0s ave=0.044ms CAN1 TX[07e2] : n=82 tot=0.0s ave=0.067ms CAN1 TX[07e4] : n=54 tot=0.0s ave=0.044ms Set State : n=7 tot=0.0s ave=0.104ms
This is probably going to be quite useful in general! The TX call-backs don't seem to be significant here. (oh, I should probably implement a reset of the values too).
//.ichael
On Sun, 12 May 2024 at 22:58, Michael Geddes <frog@bunyip.wheelycreek.net> wrote:
Yeah - I certainly wasn't going to put a hard limit. Just a log above a certain time, that being said, the idea of just collecting stats (being able to turn it on via a "poller timer" set of commands) would be much more useful. I'll look into that.
Average time is probably a good stat - and certainly what we care about.
I actually am hopeful that those couple of things I did might help reduce that average time quite a bit (that short-cutting the isotp protocol handling especially).
That p/r with logging changes might help reduce the unproductive log time further, but also makes it possible to turn on the poller logging without the RX task logs kicking in.
//.ichael
On Sun, 12 May 2024 at 22:29, Michael Balzer via OvmsDev <ovmsdev@lists.openvehicles.com> wrote:
Warning / gathering debug statistics about slow processing can be helpful, but there must not be a hard limit. Frame/poll response processing may need disk or network I/O, and the vehicle task may be starving from punctual high loads on higher priority tasks (e.g. networking) or by needing to wait for some semaphore -- that's outside the application's control, and must not lead to termination/recreation of the task (in case you're heading towards that direction).
I have no idea how much processing time the current vehicles actually need in their respective worst cases. Your draft is probably too lax, poll responses and frames normally need to be processed much faster. I'd say 10 ms is already too slow, but any wait for a queue/semaphore will already mean at least 10 ms (FreeRTOS tick). Probably best to begin with just collecting stats.
Btw, to help in narrowing down the actual problem case, the profiler could collect max times per RX message ID.
Regards, Michael
Am 12.05.24 um 10:41 schrieb Michael Geddes:
I have a question for Michael B (or whoever) - I have a commit lined up that would add a bit of a time check to the poller loop. What do we expect the maximum time to execute a poller loop command should be?
This is a rough idea (in ms) I have.. based on nothing much really, so any ideas would be appreciated:
int TardyMaxTime_ms(OvmsPoller::OvmsPollEntryType entry_type) { switch (entry_type) { case OvmsPoller::OvmsPollEntryType::Poll: return 80; case OvmsPoller::OvmsPollEntryType::FrameRx: return 30; case OvmsPoller::OvmsPollEntryType::FrameTx: return 20; case OvmsPoller::OvmsPollEntryType::Command: return 10; case OvmsPoller::OvmsPollEntryType::PollState: return 15; default: return 80; } }
//.ichael
On Mon, 6 May 2024 at 07:45, Michael Geddes <frog@bunyip.wheelycreek.net> wrote:
I realise that I was only using the standard cable to test - which probably is not sufficient - I haven't looked closely at how the Leaf OBD to Db9 cable is different from standard.
Ah, my bad out the queue length. We are definitely queueing more messages though. From my log of when the overflow happened, the poller was in state 0 which means OFF - ie nothing was being sent!!
I'll look at the TX message thing - opt in sounds good - though it shouldn't be playing that much of a part here as the TXs are infrequent in this case (or zero when the leaf is off or driving) - On the ioniq 5 when I'm using the HUD - I'm polling quite frequently - multiple times per second and that seems to be fine!.
I did find an issue with the throttling .. but it would still mostly apply the throttling where it matters, so again, it shouldn't be the problem (also, we aren't transmitting in the leaf case).
The change I made to the logging of RX messages showed how many in a row were dropped... and it was mostly 1 only in a run - which means even if it is a short time between - that means that the drops are being interleaved by at least one success!
Sooo.. I'm still wondering what is going on. Some things I'm going to try:
* If the number of messages on the Can bus (coming in through RX) means that the queue is slowly getting longer and not quite catching up, then making the queue longer will help it last longer... but only pushes the problem down the road.
- Add 'current queue length' to the poller status information to see if this is indeed the case?
- Add some kind of alert when the queue reaches a % full?
* Once you start overflowing and getting overflow log messages, I wonder if this is then contributing to the problem.
- Push the overflow logging into Poller Task which can look at how many drops occurred since last received item.
* Split up the flags for the poller messages into 2:
- Messages that are/could be happening in the TX/RX tasks
- Other noisy messages that always happen in the poller task.
Thoughts on what else we might measure to figure out what is going on?
//.ichael
On Sun, 5 May 2024, 19:29 Michael Balzer via OvmsDev, <ovmsdev@lists.openvehicles.com> wrote:
Michael,
the queue size isn't in bytes, it's in messages:
* @param uxQueueLength The maximum number of items that the queue can contain. * * @param uxItemSize The number of bytes each item in the queue will require.
Also, from the time stamps in Dereks log excerpt, there were quite some dropped frames in that time window -- at least 23 frames in 40 ms, that's bad.
Queue sizes are currently:
CONFIG_OVMS_HW_CAN_RX_QUEUE_SIZE=60 CONFIG_OVMS_VEHICLE_CAN_RX_QUEUE_SIZE=60
The new poller now channels all TX callbacks through the task queue additionally to RX and commands. So setting the queue size to be larger than the CAN RX queue size seems appropriate.
Nevertheless, an overflow with more than 60 waiting messages still indicates some too long processing time in the vehicle task.
TX callbacks previously were done directly in the CAN context, and no current vehicle overrides the empty default handler, so this imposed almost no additional overhead. By requiring a queue entry for each TX callback, this feature now has a potentially high impact for all vehicles. If passing these to the task is actually necessary, it needs to become an opt-in feature, so only vehicles subscribing to the callback actually need to cope with that additional load & potential processing delays involved.
Regards, Michael
-- Michael Balzer * Helkenberger Weg 9 * D-58256 Ennepetal Fon 02333 / 833 5735 * Handy 0176 / 206 989 26
_______________________________________________ OvmsDev mailing list OvmsDev@lists.openvehicles.com http://lists.openvehicles.com/mailman/listinfo/ovmsdev
_______________________________________________ OvmsDev mailing list OvmsDev@lists.openvehicles.com http://lists.openvehicles.com/mailman/listinfo/ovmsdev
-- Michael Balzer * Helkenberger Weg 9 * D-58256 Ennepetal Fon 02333 / 833 5735 * Handy 0176 / 206 989 26
_______________________________________________ OvmsDev mailing list OvmsDev@lists.openvehicles.com http://lists.openvehicles.com/mailman/listinfo/ovmsdev
-- Michael Balzer * Helkenberger Weg 9 * D-58256 Ennepetal Fon 02333 / 833 5735 * Handy 0176 / 206 989 26
Sure, I can do that. I did it this way because it was easier and could mostly do it in one message. As soon as I added spaces for alignment it pushed the message over 2 notifications. Also, I wasn't sure about making a new Data type and how that worked. I'm assuming something like: *-LOG-Poll would work (unless you want to suggest something else) The next 2 cols seem to be ID and lifetime. What do I use as an ID? Can it be an alpha string or does it have to be a number? (LIke using the first column descriptor). I'm not sure how the ID column is treated. I _could_ just send a line number for the dump group I guess? These are the columns I have. I can force the two cols to be always permille. "Type","Count (hz)","Avg utlization (permille)","Peak utlization (permille)", "Avg Time (ms)","Peak Time (ms)" Type is the only alpha column.. but if I can use that for the ID I guess that would be better? How would I provide a header if I wanted to? Is there some indicator saying it's a header line? I'm not sure I want to - just asking. //.ichael On Wed, 19 June 2024, 00:11 Michael Balzer via OvmsDev, < ovmsdev@lists.openvehicles.com> wrote:
Michael,
I've received the new drive report notifications now; these need to be changed: please do not use text notifications to transport CSV data. That's what "data" notifications are meant for, which are stored in their raw form on the server for later retrieval. See e.g. the vehicle trip & grid logs for reference on how to build the messages, or have a look at the specific Twizy and UpMiiGo data messages.
Data notifications also are designed to transport one row at a time, so you normally don't run into buffer size issues. A header can be supplied as a row, but you normally add one when downloading the data from the server, so tools don't need to filter these out. I provide headers automatically on my server for known message types, just send me your template and I'll include that.
Apart from that, the timing statistics now seem to work pretty well, providing valuable insights.
Regards, Michael
Am 14.06.24 um 08:59 schrieb Michael Geddes:
Thankyou. I was more worried that we might be waiting on each other.
I don't think I have quite the correct able to test on my friends Leaf properly, or does it use the standard cable?
Anyway, let me know what I can do to.
//.ichael
On Fri, 14 Jun 2024 at 14:46, Michael Balzer via OvmsDev < ovmsdev@lists.openvehicles.com> wrote:
Sorry, I know I'm behind with PRs.
I'll try to find some time this weekend.
Regards, Michael
Am 14.06.24 um 08:31 schrieb Michael Geddes via OvmsDev:
Was this all good? I want to make sure I get to the bottom of this whole issue asap!
https://github.com/openvehicles/Open-Vehicle-Monitoring-System-3/pull/1018
Was there something else you needed me to work on to make sure this all works for all supported cars?
//.ichael
On Sun, 26 May 2024 at 21:15, Michael Balzer via OvmsDev < ovmsdev@lists.openvehicles.com> wrote:
OK, I see now why it wouldn't send the notification: the V2 & V3 server register for notifications up to COMMAND_RESULT_NORMAL = 1024 characters.
The report quickly becomes larger than 1024 characters, so the notifications no longer get sent via the server connectors.
You need to either reduce the size, split the report, or use data notifications instead.
On the reset value init: for my float targeting smoothing helper class for the UpMiiGo, I implemented a gradual ramp up from 1 to the requested sample size. You can do something similar also with powers of 2. IOW, yes, initialization from the first values received is perfectly OK.
Regards, Michael
Am 26.05.24 um 14:35 schrieb Michael Geddes:
It _*should*_ already be sending a report on charge stop.
MyEvents.RegisterEvent(TAG, "vehicle.charge.stop", std::bind(&OvmsPollers::VehicleChargeStop, this, _1, _2));
Reset on charge start/vehicle on is a good idea.
A question – would it be silly if the first value after a reset, rather than using 0 average to start with, if the average got set to the initial value? I’m in 2 minds about it. It would make the average more useful quicker.
//.ichael
On Sun, 26 May 2024, 19:39 Michael Balzer via OvmsDev, < ovmsdev@lists.openvehicles.com> wrote:
As the averages quickly decline when idle, an automatic report should probably also be sent on charge stop.
Also, I think you should automatically reset the timer statistics on drive & charge start.
First stats from charging my UpMiiGo:
Type | count | Utlztn | Time | per s | [‰] | [ms] ---------------+--------+--------+--------- Poll:PRI Avg| 1.00| 0.723| 0.716 Peak| | 1.282| 3.822 ---------------+--------+--------+--------- Poll:SRX Avg| 7.72| 1.246| 0.184 Peak| | 3.128| 1.058 ---------------+--------+--------+--------- RxCan1[7ae] Avg| 2.48| 0.915| 0.362 Peak| | 1.217| 1.661 ---------------+--------+--------+--------- RxCan1[7cf] Avg| 4.76| 1.928| 0.397 Peak| | 2.317| 2.687 ---------------+--------+--------+--------- RxCan1[7ed] Avg| 3.38| 1.251| 0.327 Peak| | 8.154| 12.273 ---------------+--------+--------+--------- RxCan1[7ee] Avg| 0.21| 0.066| 0.297 Peak| | 0.225| 1.690 ---------------+--------+--------+--------- TxCan1[744] Avg| 1.49| 0.022| 0.011 Peak| | 0.032| 0.095 ---------------+--------+--------+--------- TxCan1[765] Avg| 3.89| 0.134| 0.027 Peak| | 0.155| 0.113 ---------------+--------+--------+--------- TxCan1[7e5] Avg| 2.32| 0.038| 0.013 Peak| | 0.295| 0.084 ---------------+--------+--------+--------- TxCan1[7e6] Avg| 1 0.21| 0.002| 0.008 Peak| | 0.010| 0.041 ---------------+--------+--------+--------- Cmd:State Avg| 0.00| 0.000| 0.007 Peak| | 0.005| 0.072 ===============+========+========+========= Total Avg| 27.46| 6.324| 2.349
Overall healthy I'd say, but let's see how it compares.
7ed is the BMS, the peak time is probably related to the extended cell data logging -- I've enabled log intervals for both cell voltages & temperatures.
Regards, Michael
Am 26.05.24 um 08:42 schrieb Michael Balzer via OvmsDev:
The notification works on my devices, it only has a garbled per mille character -- see attached screenshot. The same applies to the mail version:
Poller timing is: on
Type | count | Utlztn | Time
| per s | [‰] | [ms]
---------------+--------+--------+---------
Poll:PRI Avg| 0.25| 0.119| 0.382
Peak| | 0.513| 0.678
---------------+--------+--------+---------
RxCan1[597] Avg| 0.01| 0.004| 0.021
Peak| | 0.000| 0.338
---------------+--------+--------+---------
RxCan1[59b] Avg| 0.01| 0.011| 0.053
Peak| | 0.000| 0.848
---------------+--------+--------+---------
Cmd:State Avg| 0.01| 0.002| 0.012
Peak| | 0.000| 0.120
===============+========+========+=========
Total Avg| 0.28| 0.135| 0.468
The encoding is a general issue. The character encoding for text messages via V2/MP is quite old & clumsy, it's got an issue with the degree celcius character as well. We previously tried to keep all text messages within the SMS safe character set (which e.g. lead to writing just "C" instead of "°C"). I'd say we should head towards UTF-8 now. If we ever refit SMS support, we can recode on the fly.
Regarding not seeing the notification on your phone:
a) Check your notification subtype/channel filters on the module. See https://docs.openvehicles.com/en/latest/userguide/notifications.html#suppres...
b) Check your notification vehicle filters on the phone (menu on notification tab): if you enabled the vehicle filter, it will add the messages of not currently selected vehicles to the list only, but not raise a system notification. (Applies to the Android App, no idea about the iOS version)
Regards, Michael
Am 26.05.24 um 06:32 schrieb Michael Geddes:
Hi,
I'm trying to finalise this now .. and one last thing is that I don't get the report coming to my mobile. I'm using the command:
MyNotify.NotifyString("info", "poller.report", buf.c_str());
Where the buffer string is just the same as the report output. Should I be using some other format or command?
I get "alert" types (like the ioniq5 door-open alert) fine to my mobile.
Michael.
On Sun, 19 May 2024, 12:51 Michael Balzer via OvmsDev, < ovmsdev@lists.openvehicles.com> wrote:
A builtin web UI for this seems a bit over the top. Builtin web config pages should focus on user features, this is clearly a feature only needed during/for the development/extension of a vehicle adapter. Development features in the web UI are confusing for end users.
If persistent enabling/disabling is done by a simple config command (e.g. "config set can poller.trace on"), that's also doable by users.
Regards, Michael
Am 19.05.24 um 02:06 schrieb Michael Geddes:
I was so focused on how I calculated the value that I totally missed that ‰ would be a better description. I could also use the system 'Ratio' unit... so % or ‰.
I'll make space to put 'Avg' on the row. Was trying to limit the width for output on a mobile. I agree it would make it easier to understand.
Totals also makes sense.
Should I make this a configuration that can be set on the web-page? I'd probably use a configuration change notification so that the very bit setting is sync'd with the 'configuration' value.
//.ichael
On Sat, 18 May 2024, 14:05 Michael Balzer, <dexter@expeedo.de> wrote:
I'm not sure whether the 'max' should be the maximum of the smoothed value.. or the maximum of the raw value.
It should normally be the maximum of the raw value I think, the maximum of the smoothed value cannot tell about how bad the processing of an ID can become.
The naming in the table is a bit confusing I think. (besides: I've never seen "ave" as the abbreviation for average)
If I understand you correctly, "time ms per s" is the time share in per mille, so something in that direction would be more clear, and "length ms" would then be "time [ms]".
The totals for all averages in the table foot would also be nice.
Maybe "Ave" (or avg?) also should be placed on the left, as the "peak" label now suggests being the peak of the average.
Btw, keep in mind, not all "edge" users / testers are developers (e.g. the Twizy driver I'm in contact with), collecting stats feedback for vehicles from testers should be straight forward. Maybe add a data/history record, sent automatically on every drive/charge stop when the poller tracing is on?
Regards, Michael
Am 18.05.24 um 02:28 schrieb Michael Geddes:
You did say max/pead value. I also halved the N for both.
I'm not sure whether the 'max' should be the maximum of the smoothed value.. or the maximum of the raw value.
This is currently the raw-value maximum.
The problem is that the middle column is the maximum of the {{sum over 10s} / (10*1000,000)
I could easily change the 'period' to 1s and see how that goes.. was just trying to reduce the larger calculations.
Usage: poller [pause|resume|status|times|trace]
OVMS# poller time status Poller timing is: on Type | Count | Ave time | Ave length | per s | ms per s | ms -------------+----------+-----------+----------- Poll:PRI | 1.00| 0.559| 0.543 peak | | 0.663| 1.528 -------------+----------+-----------+----------- Poll:SRX | 0.08| 0.009| 0.038 peak | | 0.068| 0.146 -------------+----------+-----------+----------- CAN1 RX[778] | 0.11| 0.061| 0.280 peak | | 0.458| 1.046 -------------+----------+-----------+----------- CAN1 RX[7a8] | 0.04| 0.024| 0.124 peak | | 0.160| 0.615 -------------+----------+-----------+----------- CAN1 TX[770] | 0.05| 0.004| 0.016 peak | | 0.022| 0.102 -------------+----------+-----------+----------- CAN1 TX[7a0] | 0.02| 0.002| 0.011 peak | | 0.010| 0.098 -------------+----------+-----------+----------- CAN1 TX[7b3] | 0.01| 0.001| 0.006 peak | | 0.000| 0.099 -------------+----------+-----------+----------- CAN1 TX[7e2] | 0.02| 0.002| 0.011 peak | | 0.010| 0.099 -------------+----------+-----------+----------- CAN1 TX[7e4] | 0.08| 0.008| 0.048 peak | | 0.049| 0.107 -------------+----------+-----------+----------- Cmd:State | 0.00| 0.000| 0.005 peak | | 0.000| 0.094
On Fri, 17 May 2024 at 15:26, Michael Geddes < frog@bunyip.wheelycreek.net> wrote:
This is what I have now.
The one on the end is the one MIchael B was after using an N of 32. (up for discussion).
The middle is the time spent in that even t per second. It accumulates times (in microseconds), and then every 10s it stores it as smoothed (N=16) value.
The Count is similar (except that we store a value of '100' as 1 event so it can be still integers and has 2 decimal places).
Every received poll does a 64bit difference to 32bit (for the elapsed time) and 64bit comparison (for end-of-period).
It also does 1x 32bit smoothing and 2x 32bit adds.
Then at the end of a 10s period, it will do a 64bit add to get the next end-of-period value, as well as the 2x 32bit smoothing calcs.
This is from the Ioniq 5 so not any big values yet. You can certainly see how insignificant the TX callbacks are.
I'll leave it on for when the car is moving and gets some faster polling.
OVMS# poll time status Poller timing is: on Type | Count | Ave time | Ave Length | per s | ms per s | ms -------------+----------+-----------+----------- Poll:PRI | 1.00| 0.540| 0.539 Poll:SRX | 0.03| 0.004| 0.017 CAN1 RX[778] | 0.06| 0.042| 0.175 CAN1 TX[770] | 0.04| 0.002| 0.008 Cmd:State | 0.01| 0.001| 0.005
----------------------8<--------------------------------
Nice smoothing class (forces N as a power of 2):
constexpr unsigned floorlog2(unsigned x) { return x == 1 ? 0 : 1+floorlog2(x >> 1); } /* Maintain a smoothed average using shifts for division. * T should be an integer type * N needs to be a power of 2 */ template <typename T, unsigned N> class average_util_t { private: T m_ave; public: average_util_t() : m_ave(0) {} static const uint8_t _BITS = floorlog2(N); void add( T val) { static_assert(N == (1 << _BITS), "N must be a power of 2"); m_ave = (((N-1) * m_ave) + val) >> _BITS; } T get() { return m_ave; } operator T() { return m_ave; } };
On Thu, 16 May 2024 at 10:29, Michael Geddes < frog@bunyip.wheelycreek.net> wrote:
Thanks Michael,
My calculations give me ((2^32)-1) / (1000*1000*3600) = only 1.2 hours of processing time in 32bit. The initial subtraction is 64bit anyway and I can't see a further 64bit addition being a problem. I have the calculations being performed in doubles at print-out where performance is not really an issue anyway. (Though apparently doing 64 bit division is worse than floating point).
In addition
* I currently have this being able to be turned on and off and reset manually (only do it when required).
* For the lower volume commands, the smoothed average is not going to be useful - the count is more interesting for different reasons.
* The total time is quite useful. Ie a high average time doesn't matter if the count is low. The things that are affecting performance are stuff with high total time. Stuff which is happening 100 times a second needs to be a much lower average than once a second.
* A measure like 'time per minute/second' and possibly count per minute/seconds as a smoothed average would potentially be more useful. (or in addition?)
I think we could do _that_ in a reasonably efficient manner using a 64 bit 'last measured time', a 32 bit accumulated value and the stored 32 bit rolling average.
It would boils down to some iterative (integer) sums and multiplications plus a divide by n ^ (time periods passed) - which is a shift - and which can be optimised to '0' if 'time-periods-passed' is more than 32/(bits-per-n) - effectively limiting the number of iterations.
The one issue I can see is that we need to calculate 'number of time-periods passed' which is a 64 bit subtraction followed by a 32 bit division (not optimisable to a simple shift).
* I'm also happy to keep a rolling (32bit) average time.
Even if you assume averages in the 100ms, 32bit is going to happily support an N of 64 or even 128.
Am I right in thinking that the choice of N is highly dependent on frequency. For things happening 100 times per second, you might want an N like 128.. where things happening once per
second, you might want an N of 4 or 8. The other things we keep track of in this manner we have a better idea of the frequency of the thing.
How about we have (per record type):
* total count (since last reset?) (32 bit)
* smoothed average of time per instance (32 bit)
* ?xx? total accumulated time since last reset (64bit) ?? <-- with the below stats this is much less useful
* last-measured-time (64 bit)
* accumulated count since last time-period (16bit - but maybe 32bit anyway for byte alignment?)
* smoothed average of count per time-period (32bit)
* accumulated time since last time-period (32bit)
* smoothed average of time per time-period (32bit)
It's possible to keep the
Is this going to be too much per record type? The number of 'records' we are keeping is quite low (so 10 to 20 maybe) - so it's not a huge memory burden.
Thoughts?
//.ichael
On Thu, 16 May 2024 at 03:09, Michael Balzer via OvmsDev < ovmsdev@lists.openvehicles.com> wrote:
esp_timer_get_time() is the right choice for precision timing.
I'd say uint32 is enough though, even if counting microseconds that can hold a total of more than 71 hours of actual processing time. uint64 has a significant performance penalty, although I don't recall the overhead for simple additions.
Also & more important, the average wouldn't be my main focus, but the maximum processing time seen per ID, which seems to be missing in your draft.
Second thought on the average… the exact overall average really has a minor meaning, I'd rather see the current average, adapting to the current mode of operation (drive/charge/…). I suggest feeding the measurements to a low pass filter to get the smoothed average of the last n measurements. Pattern:
runavg = ((N-1) * runavg + newval) / N
By using a low power of 2 for N (e.g. 8 or 16), you can replace the division by a simple bit shift, and have enough headroom to use 32 bit integers.
Regards, Michael
Am 15.05.24 um 06:51 schrieb Michael Geddes via OvmsDev:
Formatting aside, I have implemented what I think Michael B was suggesting. This is a sample run on the Ioniq 5 (which doesn't have unsolicited RX events).
This uses the call esp_timer_get_time() got get a 64bit *microseconds* since started value - and works out the time to execute that way. It's looking at absolute time and not time in the Task - so other things going on at the same time in other tasks will have an effect. (The normal tick count doesn't have nearly enough resolution to be useful - any other ideas on measurement?) I've got total accumulated time displaying in seconds and the average in milliseconds currently - but I can change that easy enough.
The cumulative time is stored as uint64_t which will be plenty, as 32bit wouldn't be nearly enough.
OVMS# *poller time on* Poller timing is now on
OVMS# *poller time status* Poller timing is: on Poll [PRI] : n=390 tot=0.2s ave=0.586ms Poll [SRX] : n=316 tot=0.1s ave=0.196ms CAN1 RX[0778] : n=382 tot=0.2s ave=0.615ms CAN1 RX[07a8] : n=48 tot=0.0s ave=0.510ms CAN1 RX[07bb] : n=162 tot=0.1s ave=0.519ms CAN1 RX[07ce] : n=33 tot=0.0s ave=0.469ms CAN1 RX[07ea] : n=408 tot=0.2s ave=0.467ms CAN1 RX[07ec] : n=486 tot=0.2s ave=0.477ms CAN3 RX[07df] : n=769 tot=0.2s ave=0.261ms CAN1 TX[0770] : n=191 tot=0.0s ave=0.054ms CAN1 TX[07a0] : n=16 tot=0.0s ave=0.047ms CAN1 TX[07b3] : n=31 tot=0.0s ave=0.069ms CAN1 TX[07c6] : n=11 tot=0.0s ave=0.044ms CAN1 TX[07e2] : n=82 tot=0.0s ave=0.067ms CAN1 TX[07e4] : n=54 tot=0.0s ave=0.044ms Set State :
Michael, "data" notifications correspond to the V2/MP "historical" message type: * https://docs.openvehicles.com/en/latest/protocol_v2/messages.html#historical... So a record type of "*-LOG-Poll" would be OK, but I suggest using "*-LOG-PollStats" to be more precise. The record ID needs to be an integer, and the default V2 server database defines this to be a 32 bit signed integer. Note that sending a new record won't overwrite an existing one with the same ID, as the timestamp is part of the primary key. I suggest using your report line number. You can provide a header as line 0 then, or you can leave adding a header to the download tool (as do all the other data records up to now). If you use my server, you can download all data from the car UI, if you use another public server, you can still use my download tool via this page: * https://dexters-web.de/downloadtool?lang=EN Download tools other than the ones I provide in my web UI are the scripts in the server repository's client directory: * https://github.com/openvehicles/Open-Vehicle-Server/tree/master/clients The most simple form is shown by the "serverlog.sh" script, for adding headers see e.g. "rt_fetchlogs.sh". I normally let my server send me the logs by mail on a daily base, these include all historical data files with headers added. Assuming record type "*-LOG-PollStats", I've just added auto headers to my tool based on your template as follows: * type,count_hz,avg_util_pm,peak_util_pm,avg_time_ms,peak_time_ms (keeping the header style consistent with the other logs) So you can now simply send the data rows, the tool will prepend the header once on each download. Regards, Michael Am 19.06.24 um 11:10 schrieb Michael Geddes:
Sure, I can do that. I did it this way because it was easier and could mostly do it in one message. As soon as I added spaces for alignment it pushed the message over 2 notifications. Also, I wasn't sure about making a new Data type and how that worked.
I'm assuming something like: *-LOG-Poll would work (unless you want to suggest something else) The next 2 cols seem to be ID and lifetime. What do I use as an ID? Can it be an alpha string or does it have to be a number? (LIke using the first column descriptor). I'm not sure how the ID column is treated. I _could_ just send a line number for the dump group I guess?
These are the columns I have. I can force the two cols to be always permille. "Type","Count (hz)","Avg utlization (permille)","Peak utlization (permille)", "Avg Time (ms)","Peak Time (ms)"
Type is the only alpha column.. but if I can use that for the ID I guess that would be better?
How would I provide a header if I wanted to? Is there some indicator saying it's a header line? I'm not sure I want to - just asking.
//.ichael
On Wed, 19 June 2024, 00:11 Michael Balzer via OvmsDev, <ovmsdev@lists.openvehicles.com> wrote:
Michael,
I've received the new drive report notifications now; these need to be changed: please do not use text notifications to transport CSV data. That's what "data" notifications are meant for, which are stored in their raw form on the server for later retrieval. See e.g. the vehicle trip & grid logs for reference on how to build the messages, or have a look at the specific Twizy and UpMiiGo data messages.
Data notifications also are designed to transport one row at a time, so you normally don't run into buffer size issues. A header can be supplied as a row, but you normally add one when downloading the data from the server, so tools don't need to filter these out. I provide headers automatically on my server for known message types, just send me your template and I'll include that.
Apart from that, the timing statistics now seem to work pretty well, providing valuable insights.
Regards, Michael
Am 14.06.24 um 08:59 schrieb Michael Geddes:
Thankyou. I was more worried that we might be waiting on each other.
I don't think I have quite the correct able to test on my friends Leaf properly, or does it use the standard cable?
Anyway, let me know what I can do to.
//.ichael
On Fri, 14 Jun 2024 at 14:46, Michael Balzer via OvmsDev <ovmsdev@lists.openvehicles.com> wrote:
Sorry, I know I'm behind with PRs.
I'll try to find some time this weekend.
Regards, Michael
Am 14.06.24 um 08:31 schrieb Michael Geddes via OvmsDev:
Was this all good? I want to make sure I get to the bottom of this whole issue asap!
https://github.com/openvehicles/Open-Vehicle-Monitoring-System-3/pull/1018
Was there something else you needed me to work on to make sure this all works for all supported cars?
//.ichael
On Sun, 26 May 2024 at 21:15, Michael Balzer via OvmsDev <ovmsdev@lists.openvehicles.com> wrote:
OK, I see now why it wouldn't send the notification: the V2 & V3 server register for notifications up to COMMAND_RESULT_NORMAL = 1024 characters.
The report quickly becomes larger than 1024 characters, so the notifications no longer get sent via the server connectors.
You need to either reduce the size, split the report, or use data notifications instead.
On the reset value init: for my float targeting smoothing helper class for the UpMiiGo, I implemented a gradual ramp up from 1 to the requested sample size. You can do something similar also with powers of 2. IOW, yes, initialization from the first values received is perfectly OK.
Regards, Michael
Am 26.05.24 um 14:35 schrieb Michael Geddes:
It _/should/_ already be sending a report on charge stop.
MyEvents.RegisterEvent(TAG, "vehicle.charge.stop", std::bind(&OvmsPollers::VehicleChargeStop, this, _1, _2));
Reset on charge start/vehicle on is a good idea.
A question – would it be silly if the first value after a reset, rather than using 0 average to start with, if the average got set to the initial value? I’m in 2 minds about it. It would make the average more useful quicker.
//.ichael
On Sun, 26 May 2024, 19:39 Michael Balzer via OvmsDev, <ovmsdev@lists.openvehicles.com> wrote:
As the averages quickly decline when idle, an automatic report should probably also be sent on charge stop.
Also, I think you should automatically reset the timer statistics on drive & charge start.
First stats from charging my UpMiiGo:
Type | count | Utlztn | Time | per s | [‰] | [ms] ---------------+--------+--------+--------- Poll:PRI Avg| 1.00| 0.723| 0.716 Peak| | 1.282| 3.822 ---------------+--------+--------+--------- Poll:SRX Avg| 7.72| 1.246| 0.184 Peak| | 3.128| 1.058 ---------------+--------+--------+--------- RxCan1[7ae] Avg| 2.48| 0.915| 0.362 Peak| | 1.217| 1.661 ---------------+--------+--------+--------- RxCan1[7cf] Avg| 4.76| 1.928| 0.397 Peak| | 2.317| 2.687 ---------------+--------+--------+--------- RxCan1[7ed] Avg| 3.38| 1.251| 0.327 Peak| | 8.154| 12.273 ---------------+--------+--------+--------- RxCan1[7ee] Avg| 0.21| 0.066| 0.297 Peak| | 0.225| 1.690 ---------------+--------+--------+--------- TxCan1[744] Avg| 1.49| 0.022| 0.011 Peak| | 0.032| 0.095 ---------------+--------+--------+--------- TxCan1[765] Avg| 3.89| 0.134| 0.027 Peak| | 0.155| 0.113 ---------------+--------+--------+--------- TxCan1[7e5] Avg| 2.32| 0.038| 0.013 Peak| | 0.295| 0.084 ---------------+--------+--------+--------- TxCan1[7e6] Avg| 1 0.21| 0.002| 0.008 Peak| | 0.010| 0.041 ---------------+--------+--------+--------- Cmd:State Avg| 0.00| 0.000| 0.007 Peak| | 0.005| 0.072 ===============+========+========+========= Total Avg| 27.46| 6.324| 2.349
Overall healthy I'd say, but let's see how it compares.
7ed is the BMS, the peak time is probably related to the extended cell data logging -- I've enabled log intervals for both cell voltages & temperatures.
Regards, Michael
Am 26.05.24 um 08:42 schrieb Michael Balzer via OvmsDev:
The notification works on my devices, it only has a garbled per mille character -- see attached screenshot. The same applies to the mail version:
Poller timing is: on
Type | count | Utlztn | Time
| per s | [‰] | [ms]
---------------+--------+--------+---------
Poll:PRI Avg| 0.25| 0.119| 0.382
Peak| | 0.513| 0.678
---------------+--------+--------+---------
RxCan1[597] Avg| 0.01| 0.004| 0.021
Peak| | 0.000| 0.338
---------------+--------+--------+---------
RxCan1[59b] Avg| 0.01| 0.011| 0.053
Peak| | 0.000| 0.848
---------------+--------+--------+---------
Cmd:State Avg| 0.01| 0.002| 0.012
Peak| | 0.000| 0.120
===============+========+========+=========
Total Avg| 0.28| 0.135| 0.468
The encoding is a general issue. The character encoding for text messages via V2/MP is quite old & clumsy, it's got an issue with the degree celcius character as well. We previously tried to keep all text messages within the SMS safe character set (which e.g. lead to writing just "C" instead of "°C"). I'd say we should head towards UTF-8 now. If we ever refit SMS support, we can recode on the fly.
Regarding not seeing the notification on your phone:
a) Check your notification subtype/channel filters on the module. See https://docs.openvehicles.com/en/latest/userguide/notifications.html#suppres...
b) Check your notification vehicle filters on the phone (menu on notification tab): if you enabled the vehicle filter, it will add the messages of not currently selected vehicles to the list only, but not raise a system notification. (Applies to the Android App, no idea about the iOS version)
Regards, Michael
Am 26.05.24 um 06:32 schrieb Michael Geddes:
Hi,
I'm trying to finalise this now .. and one last thing is that I don't get the report coming to my mobile. I'm using the command:
MyNotify.NotifyString("info", "poller.report", buf.c_str());
Where the buffer string is just the same as the report output. Should I be using some other format or command?
I get "alert" types (like the ioniq5 door-open alert) fine to my mobile.
Michael.
On Sun, 19 May 2024, 12:51 Michael Balzer via OvmsDev, <ovmsdev@lists.openvehicles.com> wrote:
A builtin web UI for this seems a bit over the top. Builtin web config pages should focus on user features, this is clearly a feature only needed during/for the development/extension of a vehicle adapter. Development features in the web UI are confusing for end users.
If persistent enabling/disabling is done by a simple config command (e.g. "config set can poller.trace on"), that's also doable by users.
Regards, Michael
Am 19.05.24 um 02:06 schrieb Michael Geddes:
I was so focused on how I calculated the value that I totally missed that ‰ would be a better description. I could also use the system 'Ratio' unit... so % or ‰.
I'll make space to put 'Avg' on the row. Was trying to limit the width for output on a mobile. I agree it would make it easier to understand.
Totals also makes sense.
Should I make this a configuration that can be set on the web-page? I'd probably use a configuration change notification so that the very bit setting is sync'd with the 'configuration' value.
//.ichael
On Sat, 18 May 2024, 14:05 Michael Balzer, <dexter@expeedo.de> wrote:
I'm not sure whether the 'max' should be the maximum of the smoothed value.. or the maximum of the raw value.
It should normally be the maximum of the raw value I think, the maximum of the smoothed value cannot tell about how bad the processing of an ID can become.
The naming in the table is a bit confusing I think. (besides: I've never seen "ave" as the abbreviation for average)
If I understand you correctly, "time ms per s" is the time share in per mille, so something in that direction would be more clear, and "length ms" would then be "time [ms]".
The totals for all averages in the table foot would also be nice.
Maybe "Ave" (or avg?) also should be placed on the left, as the "peak" label now suggests being the peak of the average.
Btw, keep in mind, not all "edge" users / testers are developers (e.g. the Twizy driver I'm in contact with), collecting stats feedback for vehicles from testers should be straight forward. Maybe add a data/history record, sent automatically on every drive/charge stop when the poller tracing is on?
Regards, Michael
Am 18.05.24 um 02:28 schrieb Michael Geddes:
You did say max/pead value. I also halved the N for both.
I'm not sure whether the 'max' should be the maximum of the smoothed value.. or the maximum of the raw value.
This is currently the raw-value maximum.
The problem is that the middle column is the maximum of the {{sum over 10s} / (10*1000,000)
I could easily change the 'period' to 1s and see how that goes.. was just trying to reduce the larger calculations.
Usage: poller [pause|resume|status|times|trace]
OVMS# poller time status Poller timing is: on Type | Count | Ave time | Ave length | per s | ms per s | ms -------------+----------+-----------+----------- Poll:PRI | 1.00| 0.559| 0.543 peak | | 0.663| 1.528 -------------+----------+-----------+----------- Poll:SRX | 0.08| 0.009| 0.038 peak | | 0.068| 0.146 -------------+----------+-----------+----------- CAN1 RX[778] | 0.11| 0.061| 0.280 peak | | 0.458| 1.046 -------------+----------+-----------+----------- CAN1 RX[7a8] | 0.04| 0.024| 0.124 peak | | 0.160| 0.615 -------------+----------+-----------+----------- CAN1 TX[770] | 0.05| 0.004| 0.016 peak | | 0.022| 0.102 -------------+----------+-----------+----------- CAN1 TX[7a0] | 0.02| 0.002| 0.011 peak | | 0.010| 0.098 -------------+----------+-----------+----------- CAN1 TX[7b3] | 0.01| 0.001| 0.006 peak | | 0.000| 0.099 -------------+----------+-----------+----------- CAN1 TX[7e2] | 0.02| 0.002| 0.011 peak | | 0.010| 0.099 -------------+----------+-----------+----------- CAN1 TX[7e4] | 0.08| 0.008| 0.048 peak | | 0.049| 0.107 -------------+----------+-----------+----------- Cmd:State | 0.00| 0.000| 0.005 peak | | 0.000| 0.094
On Fri, 17 May 2024 at 15:26, Michael Geddes <frog@bunyip.wheelycreek.net> wrote:
This is what I have now.
The one on the end is the one MIchael B was after using an N of 32. (up for discussion).
The middle is the time spent in that even t per second. It accumulates times (in microseconds), and then every 10s it stores it as smoothed (N=16) value.
The Count is similar (except that we store a value of '100' as 1 event so it can be still integers and has 2 decimal places).
Every received poll does a 64bit difference to 32bit (for the elapsed time) and 64bit comparison (for end-of-period).
It also does 1x 32bit smoothing and 2x 32bit adds.
Then at the end of a 10s period, it will do a 64bit add to get the next end-of-period value, as well as the 2x 32bit smoothing calcs.
This is from the Ioniq 5 so not any big values yet. You can certainly see how insignificant the TX callbacks are.
I'll leave it on for when the car is moving and gets some faster polling.
OVMS# poll time status Poller timing is: on Type | Count | Ave time | Ave Length | per s | ms per s | ms -------------+----------+-----------+----------- Poll:PRI | 1.00| 0.540| 0.539 Poll:SRX | 0.03| 0.004| 0.017 CAN1 RX[778] | 0.06| 0.042| 0.175 CAN1 TX[770] | 0.04| 0.002| 0.008 Cmd:State | 0.01| 0.001| 0.005
----------------------8<--------------------------------
Nice smoothing class (forces N as a power of 2):
constexpr unsigned floorlog2(unsigned x) { return x == 1 ? 0 : 1+floorlog2(x >> 1); } /* Maintain a smoothed average using shifts for division. * T should be an integer type * N needs to be a power of 2 */ template <typename T, unsigned N> class average_util_t { private: T m_ave; public: average_util_t() : m_ave(0) {} static const uint8_t _BITS = floorlog2(N); void add( T val) { static_assert(N == (1 << _BITS), "N must be a power of 2"); m_ave = (((N-1) * m_ave) + val) >> _BITS; } T get() { return m_ave; } operator T() { return m_ave; } };
On Thu, 16 May 2024 at 10:29, Michael Geddes <frog@bunyip.wheelycreek.net> wrote:
Thanks Michael,
My calculations give me ((2^32)-1) / (1000*1000*3600) = only 1.2 hours of processing time in 32bit. The initial subtraction is 64bit anyway and I can't see a further 64bit addition being a problem. I have the calculations being performed in doubles at print-out where performance is not really an issue anyway. (Though apparently doing 64 bit division is worse than floating point).
In addition
* I currently have this being able to be turned on and off and reset manually (only do it when required).
* For the lower volume commands, the smoothed average is not going to be useful - the count is more interesting for different reasons.
* The total time is quite useful. Ie a high average time doesn't matter if the count is low. The things that are affecting performance are stuff with high total time. Stuff which is happening 100 times a second needs to be a much lower average than once a second.
* A measure like 'time per minute/second' and possibly count per minute/seconds as a smoothed average would potentially be more useful. (or in addition?)
I think we could do _that_ in a reasonably efficient manner using a 64 bit 'last measured time', a 32 bit accumulated value and the stored 32 bit rolling average.
It would boils down to some iterative (integer) sums and multiplications plus a divide by n ^ (time periods passed) - which is a shift - and which can be optimised to '0' if 'time-periods-passed' is more than 32/(bits-per-n) - effectively limiting the number of iterations.
The one issue I can see is that we need to calculate 'number of time-periods passed' which is a 64 bit subtraction followed by a 32 bit division (not optimisable to a simple shift).
* I'm also happy to keep a rolling (32bit) average time.
Even if you assume averages in the 100ms, 32bit is going to happily support an N of 64 or even 128.
Am I right in thinking that the choice of N is highly dependent on frequency. For things happening 100 times per second, you might want an N like 128.. where things happening once per
second, you might want an N of 4 or 8. The other things we keep track of in this manner we have a better idea of the frequency of the thing.
How about we have (per record type):
* total count (since last reset?) (32 bit)
* smoothed average of time per instance (32 bit)
* ?xx? total accumulated time since last reset (64bit) ?? <-- with the below stats this is much less useful
* last-measured-time (64 bit)
* accumulated count since last time-period (16bit - but maybe 32bit anyway for byte alignment?)
* smoothed average of count per time-period (32bit)
* accumulated time since last time-period (32bit)
* smoothed average of time per time-period (32bit)
It's possible to keep the
Is this going to be too much per record type? The number of 'records' we are keeping is quite low (so 10 to 20 maybe) - so it's not a huge memory burden.
Thoughts?
//.ichael
On Thu, 16 May 2024 at 03:09, Michael Balzer via OvmsDev <ovmsdev@lists.openvehicles.com> wrote:
esp_timer_get_time() is the right choice for precision timing.
I'd say uint32 is enough though, even if counting microseconds that can hold a total of more than 71 hours of actual processing time. uint64 has a significant performance penalty, although I don't recall the overhead for simple additions.
Also & more important, the average wouldn't be my main focus, but the maximum processing time seen per ID, which seems to be missing in your draft.
Second thought on the average… the exact overall average really has a minor meaning, I'd rather see the current average, adapting to the current mode of operation (drive/charge/…). I suggest feeding the measurements to a low pass filter to get the smoothed average of the last n measurements. Pattern:
runavg = ((N-1) * runavg + newval) / N
By using a low power of 2 for N (e.g. 8 or 16), you can replace the division by a simple bit shift, and have enough headroom to use 32 bit integers.
Regards, Michael
Am 15.05.24 um 06:51 schrieb Michael Geddes via OvmsDev:
Formatting aside, I have implemented what I think Michael B was suggesting. This is a sample run on the Ioniq 5 (which doesn't have unsolicited RX events).
This uses the call esp_timer_get_time() got get a 64bit *microseconds* since started value - and works out the time to execute that way. It's looking at absolute time and not time in the Task - so other things going on at the same time in other tasks will have an effect. (The normal tick count doesn't have nearly enough resolution to be useful - any other ideas on measurement?) I've got total accumulated time displaying in seconds and the average in milliseconds currently - but I can change that easy enough.
The cumulative time is stored as uint64_t which will be plenty, as 32bit wouldn't be nearly enough.
OVMS# *poller time on* Poller timing is now on
OVMS# *poller time status* Poller timing is: on Poll [PRI] : n=390 tot=0.2s ave=0.586ms Poll [SRX] : n=316 tot=0.1s ave=0.196ms CAN1 RX[0778] : n=382 tot=0.2s ave=0.615ms CAN1 RX[07a8] : n=48 tot=0.0s ave=0.510ms CAN1 RX[07bb] : n=162 tot=0.1s ave=0.519ms CAN1 RX[07ce] : n=33 tot=0.0s ave=0.469ms CAN1 RX[07ea] : n=408 tot=0.2s ave=0.467ms CAN1 RX[07ec] : n=486 tot=0.2s ave=0.477ms CAN3 RX[07df] : n=769 tot=0.2s ave=0.261ms CAN1 TX[0770] : n=191 tot=0.0s ave=0.054ms CAN1 TX[07a0] : n=16 tot=0.0s ave=0.047ms CAN1 TX[07b3] : n=31 tot=0.0s ave=0.069ms CAN1 TX[07c6] : n=11 tot=0.0s ave=0.044ms CAN1 TX[07e2] : n=82 tot=0.0s ave=0.067ms CAN1 TX[07e4] : n=54 tot=0.0s ave=0.044ms Set State :
-- Michael Balzer * Helkenberger Weg 9 * D-58256 Ennepetal Fon 02333 / 833 5735 * Handy 0176 / 206 989 26
Perfect. Thanks. Michael On Fri, 21 June 2024, 23:41 Michael Balzer via OvmsDev, < ovmsdev@lists.openvehicles.com> wrote:
Michael,
"data" notifications correspond to the V2/MP "historical" message type:
- https://docs.openvehicles.com/en/latest/protocol_v2/messages.html#historical...
So a record type of "*-LOG-Poll" would be OK, but I suggest using "*-LOG-PollStats" to be more precise.
The record ID needs to be an integer, and the default V2 server database defines this to be a 32 bit signed integer. Note that sending a new record won't overwrite an existing one with the same ID, as the timestamp is part of the primary key. I suggest using your report line number.
You can provide a header as line 0 then, or you can leave adding a header to the download tool (as do all the other data records up to now). If you use my server, you can download all data from the car UI, if you use another public server, you can still use my download tool via this page:
- https://dexters-web.de/downloadtool?lang=EN
Download tools other than the ones I provide in my web UI are the scripts in the server repository's client directory:
- https://github.com/openvehicles/Open-Vehicle-Server/tree/master/clients
The most simple form is shown by the "serverlog.sh" script, for adding headers see e.g. "rt_fetchlogs.sh". I normally let my server send me the logs by mail on a daily base, these include all historical data files with headers added. Assuming record type "*-LOG-PollStats", I've just added auto headers to my tool based on your template as follows:
- type,count_hz,avg_util_pm,peak_util_pm,avg_time_ms,peak_time_ms
(keeping the header style consistent with the other logs)
So you can now simply send the data rows, the tool will prepend the header once on each download.
Regards, Michael
Am 19.06.24 um 11:10 schrieb Michael Geddes:
Sure, I can do that. I did it this way because it was easier and could mostly do it in one message. As soon as I added spaces for alignment it pushed the message over 2 notifications. Also, I wasn't sure about making a new Data type and how that worked.
I'm assuming something like: *-LOG-Poll would work (unless you want to suggest something else) The next 2 cols seem to be ID and lifetime. What do I use as an ID? Can it be an alpha string or does it have to be a number? (LIke using the first column descriptor). I'm not sure how the ID column is treated. I _could_ just send a line number for the dump group I guess?
These are the columns I have. I can force the two cols to be always permille. "Type","Count (hz)","Avg utlization (permille)","Peak utlization (permille)", "Avg Time (ms)","Peak Time (ms)"
Type is the only alpha column.. but if I can use that for the ID I guess that would be better?
How would I provide a header if I wanted to? Is there some indicator saying it's a header line? I'm not sure I want to - just asking.
//.ichael
On Wed, 19 June 2024, 00:11 Michael Balzer via OvmsDev, < ovmsdev@lists.openvehicles.com> wrote:
Michael,
I've received the new drive report notifications now; these need to be changed: please do not use text notifications to transport CSV data. That's what "data" notifications are meant for, which are stored in their raw form on the server for later retrieval. See e.g. the vehicle trip & grid logs for reference on how to build the messages, or have a look at the specific Twizy and UpMiiGo data messages.
Data notifications also are designed to transport one row at a time, so you normally don't run into buffer size issues. A header can be supplied as a row, but you normally add one when downloading the data from the server, so tools don't need to filter these out. I provide headers automatically on my server for known message types, just send me your template and I'll include that.
Apart from that, the timing statistics now seem to work pretty well, providing valuable insights.
Regards, Michael
Am 14.06.24 um 08:59 schrieb Michael Geddes:
Thankyou. I was more worried that we might be waiting on each other.
I don't think I have quite the correct able to test on my friends Leaf properly, or does it use the standard cable?
Anyway, let me know what I can do to.
//.ichael
On Fri, 14 Jun 2024 at 14:46, Michael Balzer via OvmsDev < ovmsdev@lists.openvehicles.com> wrote:
Sorry, I know I'm behind with PRs.
I'll try to find some time this weekend.
Regards, Michael
Am 14.06.24 um 08:31 schrieb Michael Geddes via OvmsDev:
Was this all good? I want to make sure I get to the bottom of this whole issue asap!
https://github.com/openvehicles/Open-Vehicle-Monitoring-System-3/pull/1018
Was there something else you needed me to work on to make sure this all works for all supported cars?
//.ichael
On Sun, 26 May 2024 at 21:15, Michael Balzer via OvmsDev < ovmsdev@lists.openvehicles.com> wrote:
OK, I see now why it wouldn't send the notification: the V2 & V3 server register for notifications up to COMMAND_RESULT_NORMAL = 1024 characters.
The report quickly becomes larger than 1024 characters, so the notifications no longer get sent via the server connectors.
You need to either reduce the size, split the report, or use data notifications instead.
On the reset value init: for my float targeting smoothing helper class for the UpMiiGo, I implemented a gradual ramp up from 1 to the requested sample size. You can do something similar also with powers of 2. IOW, yes, initialization from the first values received is perfectly OK.
Regards, Michael
Am 26.05.24 um 14:35 schrieb Michael Geddes:
It _*should*_ already be sending a report on charge stop.
MyEvents.RegisterEvent(TAG, "vehicle.charge.stop", std::bind(&OvmsPollers::VehicleChargeStop, this, _1, _2));
Reset on charge start/vehicle on is a good idea.
A question – would it be silly if the first value after a reset, rather than using 0 average to start with, if the average got set to the initial value? I’m in 2 minds about it. It would make the average more useful quicker.
//.ichael
On Sun, 26 May 2024, 19:39 Michael Balzer via OvmsDev, < ovmsdev@lists.openvehicles.com> wrote:
As the averages quickly decline when idle, an automatic report should probably also be sent on charge stop.
Also, I think you should automatically reset the timer statistics on drive & charge start.
First stats from charging my UpMiiGo:
Type | count | Utlztn | Time | per s | [‰] | [ms] ---------------+--------+--------+--------- Poll:PRI Avg| 1.00| 0.723| 0.716 Peak| | 1.282| 3.822 ---------------+--------+--------+--------- Poll:SRX Avg| 7.72| 1.246| 0.184 Peak| | 3.128| 1.058 ---------------+--------+--------+--------- RxCan1[7ae] Avg| 2.48| 0.915| 0.362 Peak| | 1.217| 1.661 ---------------+--------+--------+--------- RxCan1[7cf] Avg| 4.76| 1.928| 0.397 Peak| | 2.317| 2.687 ---------------+--------+--------+--------- RxCan1[7ed] Avg| 3.38| 1.251| 0.327 Peak| | 8.154| 12.273 ---------------+--------+--------+--------- RxCan1[7ee] Avg| 0.21| 0.066| 0.297 Peak| | 0.225| 1.690 ---------------+--------+--------+--------- TxCan1[744] Avg| 1.49| 0.022| 0.011 Peak| | 0.032| 0.095 ---------------+--------+--------+--------- TxCan1[765] Avg| 3.89| 0.134| 0.027 Peak| | 0.155| 0.113 ---------------+--------+--------+--------- TxCan1[7e5] Avg| 2.32| 0.038| 0.013 Peak| | 0.295| 0.084 ---------------+--------+--------+--------- TxCan1[7e6] Avg| 1 0.21| 0.002| 0.008 Peak| | 0.010| 0.041 ---------------+--------+--------+--------- Cmd:State Avg| 0.00| 0.000| 0.007 Peak| | 0.005| 0.072 ===============+========+========+========= Total Avg| 27.46| 6.324| 2.349
Overall healthy I'd say, but let's see how it compares.
7ed is the BMS, the peak time is probably related to the extended cell data logging -- I've enabled log intervals for both cell voltages & temperatures.
Regards, Michael
Am 26.05.24 um 08:42 schrieb Michael Balzer via OvmsDev:
The notification works on my devices, it only has a garbled per mille character -- see attached screenshot. The same applies to the mail version:
Poller timing is: on
Type | count | Utlztn | Time
| per s | [‰] | [ms]
---------------+--------+--------+---------
Poll:PRI Avg| 0.25| 0.119| 0.382
Peak| | 0.513| 0.678
---------------+--------+--------+---------
RxCan1[597] Avg| 0.01| 0.004| 0.021
Peak| | 0.000| 0.338
---------------+--------+--------+---------
RxCan1[59b] Avg| 0.01| 0.011| 0.053
Peak| | 0.000| 0.848
---------------+--------+--------+---------
Cmd:State Avg| 0.01| 0.002| 0.012
Peak| | 0.000| 0.120
===============+========+========+=========
Total Avg| 0.28| 0.135| 0.468
The encoding is a general issue. The character encoding for text messages via V2/MP is quite old & clumsy, it's got an issue with the degree celcius character as well. We previously tried to keep all text messages within the SMS safe character set (which e.g. lead to writing just "C" instead of "°C"). I'd say we should head towards UTF-8 now. If we ever refit SMS support, we can recode on the fly.
Regarding not seeing the notification on your phone:
a) Check your notification subtype/channel filters on the module. See https://docs.openvehicles.com/en/latest/userguide/notifications.html#suppres...
b) Check your notification vehicle filters on the phone (menu on notification tab): if you enabled the vehicle filter, it will add the messages of not currently selected vehicles to the list only, but not raise a system notification. (Applies to the Android App, no idea about the iOS version)
Regards, Michael
Am 26.05.24 um 06:32 schrieb Michael Geddes:
Hi,
I'm trying to finalise this now .. and one last thing is that I don't get the report coming to my mobile. I'm using the command:
MyNotify.NotifyString("info", "poller.report", buf.c_str());
Where the buffer string is just the same as the report output. Should I be using some other format or command?
I get "alert" types (like the ioniq5 door-open alert) fine to my mobile.
Michael.
On Sun, 19 May 2024, 12:51 Michael Balzer via OvmsDev, < ovmsdev@lists.openvehicles.com> wrote:
A builtin web UI for this seems a bit over the top. Builtin web config pages should focus on user features, this is clearly a feature only needed during/for the development/extension of a vehicle adapter. Development features in the web UI are confusing for end users.
If persistent enabling/disabling is done by a simple config command (e.g. "config set can poller.trace on"), that's also doable by users.
Regards, Michael
Am 19.05.24 um 02:06 schrieb Michael Geddes:
I was so focused on how I calculated the value that I totally missed that ‰ would be a better description. I could also use the system 'Ratio' unit... so % or ‰.
I'll make space to put 'Avg' on the row. Was trying to limit the width for output on a mobile. I agree it would make it easier to understand.
Totals also makes sense.
Should I make this a configuration that can be set on the web-page? I'd probably use a configuration change notification so that the very bit setting is sync'd with the 'configuration' value.
//.ichael
On Sat, 18 May 2024, 14:05 Michael Balzer, <dexter@expeedo.de> wrote:
I'm not sure whether the 'max' should be the maximum of the smoothed value.. or the maximum of the raw value.
It should normally be the maximum of the raw value I think, the maximum of the smoothed value cannot tell about how bad the processing of an ID can become.
The naming in the table is a bit confusing I think. (besides: I've never seen "ave" as the abbreviation for average)
If I understand you correctly, "time ms per s" is the time share in per mille, so something in that direction would be more clear, and "length ms" would then be "time [ms]".
The totals for all averages in the table foot would also be nice.
Maybe "Ave" (or avg?) also should be placed on the left, as the "peak" label now suggests being the peak of the average.
Btw, keep in mind, not all "edge" users / testers are developers (e.g. the Twizy driver I'm in contact with), collecting stats feedback for vehicles from testers should be straight forward. Maybe add a data/history record, sent automatically on every drive/charge stop when the poller tracing is on?
Regards, Michael
Am 18.05.24 um 02:28 schrieb Michael Geddes:
You did say max/pead value. I also halved the N for both.
I'm not sure whether the 'max' should be the maximum of the smoothed value.. or the maximum of the raw value.
This is currently the raw-value maximum.
The problem is that the middle column is the maximum of the {{sum over 10s} / (10*1000,000)
I could easily change the 'period' to 1s and see how that goes.. was just trying to reduce the larger calculations.
Usage: poller [pause|resume|status|times|trace]
OVMS# poller time status Poller timing is: on Type | Count | Ave time | Ave length | per s | ms per s | ms -------------+----------+-----------+----------- Poll:PRI | 1.00| 0.559| 0.543 peak | | 0.663| 1.528 -------------+----------+-----------+----------- Poll:SRX | 0.08| 0.009| 0.038 peak | | 0.068| 0.146 -------------+----------+-----------+----------- CAN1 RX[778] | 0.11| 0.061| 0.280 peak | | 0.458| 1.046 -------------+----------+-----------+----------- CAN1 RX[7a8] | 0.04| 0.024| 0.124 peak | | 0.160| 0.615 -------------+----------+-----------+----------- CAN1 TX[770] | 0.05| 0.004| 0.016 peak | | 0.022| 0.102 -------------+----------+-----------+----------- CAN1 TX[7a0] | 0.02| 0.002| 0.011 peak | | 0.010| 0.098 -------------+----------+-----------+----------- CAN1 TX[7b3] | 0.01| 0.001| 0.006 peak | | 0.000| 0.099 -------------+----------+-----------+----------- CAN1 TX[7e2] | 0.02| 0.002| 0.011 peak | | 0.010| 0.099 -------------+----------+-----------+----------- CAN1 TX[7e4] | 0.08| 0.008| 0.048 peak | | 0.049| 0.107 -------------+----------+-----------+----------- Cmd:State | 0.00| 0.000| 0.005 peak | | 0.000| 0.094
On Fri, 17 May 2024 at 15:26, Michael Geddes < frog@bunyip.wheelycreek.net> wrote:
This is what I have now.
The one on the end is the one MIchael B was after using an N of 32. (up for discussion).
The middle is the time spent in that even t per second. It accumulates times (in microseconds), and then every 10s it stores it as smoothed (N=16) value.
The Count is similar (except that we store a value of '100' as 1 event so it can be still integers and has 2 decimal places).
Every received poll does a 64bit difference to 32bit (for the elapsed time) and 64bit comparison (for end-of-period).
It also does 1x 32bit smoothing and 2x 32bit adds.
Then at the end of a 10s period, it will do a 64bit add to get the next end-of-period value, as well as the 2x 32bit smoothing calcs.
This is from the Ioniq 5 so not any big values yet. You can certainly see how insignificant the TX callbacks are.
I'll leave it on for when the car is moving and gets some faster polling.
OVMS# poll time status Poller timing is: on Type | Count | Ave time | Ave Length | per s | ms per s | ms -------------+----------+-----------+----------- Poll:PRI | 1.00| 0.540| 0.539 Poll:SRX | 0.03| 0.004| 0.017 CAN1 RX[778] | 0.06| 0.042| 0.175 CAN1 TX[770] | 0.04| 0.002| 0.008 Cmd:State | 0.01| 0.001| 0.005
----------------------8<--------------------------------
Nice smoothing class (forces N as a power of 2):
constexpr unsigned floorlog2(unsigned x) { return x == 1 ? 0 : 1+floorlog2(x >> 1); } /* Maintain a smoothed average using shifts for division. * T should be an integer type * N needs to be a power of 2 */ template <typename T, unsigned N> class average_util_t { private: T m_ave; public: average_util_t() : m_ave(0) {} static const uint8_t _BITS = floorlog2(N); void add( T val) { static_assert(N == (1 << _BITS), "N must be a power of 2"); m_ave = (((N-1) * m_ave) + val) >> _BITS; } T get() { return m_ave; } operator T() { return m_ave; } };
On Thu, 16 May 2024 at 10:29, Michael Geddes < frog@bunyip.wheelycreek.net> wrote:
Thanks Michael,
My calculations give me ((2^32)-1) / (1000*1000*3600) = only 1.2 hours of processing time in 32bit. The initial subtraction is 64bit anyway and I can't see a further 64bit addition being a problem. I have the calculations being performed in doubles at print-out where performance is not really an issue anyway. (Though apparently doing 64 bit division is worse than floating point).
In addition
* I currently have this being able to be turned on and off and reset manually (only do it when required).
* For the lower volume commands, the smoothed average is not going to be useful - the count is more interesting for different reasons.
* The total time is quite useful. Ie a high average time doesn't matter if the count is low. The things that are affecting performance are stuff with high total time. Stuff which is happening 100 times a second needs to be a much lower average than once a second.
* A measure like 'time per minute/second' and possibly count per minute/seconds as a smoothed average would potentially be more useful. (or in addition?)
I think we could do _that_ in a reasonably efficient manner using a 64 bit 'last measured time', a 32 bit accumulated value and the stored 32 bit rolling average.
It would boils down to some iterative (integer) sums and multiplications plus a divide by n ^ (time periods passed) - which is a shift - and which can be optimised to '0' if 'time-periods-passed' is more than 32/(bits-per-n) - effectively limiting the number of iterations.
The one issue I can see is that we need to calculate 'number of time-periods passed' which is a 64 bit subtraction followed by a 32 bit division (not optimisable to a simple shift).
* I'm also happy to keep a rolling (32bit) average time.
Even if you assume averages in the 100ms, 32bit is going to happily support an N of 64 or even 128.
Am I right in thinking that the choice of N is highly dependent on frequency. For things happening 100 times per second, you might want an N like 128.. where things happening once per
second, you might want an N of 4 or 8. The other things we keep track of in this manner we have a better idea of the frequency of the thing.
How about we have (per record type):
* total count (since last reset?) (32 bit)
* smoothed average of time per instance (32 bit)
* ?xx? total accumulated time since last reset (64bit) ?? <-- with the below stats this is much less useful
* last-measured-time (64 bit)
* accumulated count since last time-period (16bit - but maybe 32bit anyway for byte alignment?)
* smoothed average of count per time-period (32bit)
* accumulated time since last time-period (32bit)
* smoothed average of time per time-period (32bit)
It's possible to keep the
Is this going to be too much per record type? The number of 'records' we are keeping is quite low (so 10 to 20 maybe) - so it's not a huge memory burden.
Thoughts?
//.ichael
On Thu, 16 May 2024 at 03:09, Michael Balzer via OvmsDev < ovmsdev@lists.openvehicles.com> wrote:
esp_timer_get_time() is the right choice for precision timing.
I'd say uint32 is enough though, even if counting microseconds that can hold a total of more than 71 hours of actual processing time. uint64 has a significant performance penalty, although I don't recall the overhead for simple additions.
Also & more important, the average wouldn't be my main focus, but the maximum processing time seen per ID, which
This is by-and-large working (pushed). The only thing is that occasionally the records seem to be coming in out-of-order. For example (after some munging with jq) "2024-06-23 05:28:16",6,"RxCan1[7bb]",13.63,5.933,8.526,0.06,3.685 "2024-06-23 05:28:16",7,"RxCan1[7ce]",0.57,0.195,0.365,0.034,0.759 "2024-06-23 05:28:16",8,"RxCan1[7ea]",4.41,1.796,2.416,0.052,1.557 "2024-06-23 05:28:16",9,"RxCan1[7ec]",18.95,7.672,11.532,0.112,19.324 "2024-06-23 05:28:16",10,"RxCan3[7df]",9.09,1.554,1.999,0.023,1.242 "2024-06-23 05:28:16",16,"TxCan1[7e4]",2.15,0.06,0.094,0.003,0.079 "2024-06-23 05:28:16",17,"Cmd:Thrtl",0,0,0.004,0.004,0.044 "2024-06-23 05:28:16",18,"Cmd:RspSp",0,0,0.002,0.002,0.019 "2024-06-23 05:28:16",19,"Cmd:SucSp",0,0,0.002,0.002,0.018 "2024-06-23 05:28:16",20,"Cmd:State",0,0,0,0.01,0.104 "2024-06-23 05:28:17",1,"Poll:PRI",1.07,0.472,0.565,0.039,0.675 "2024-06-23 05:28:17",2,"Poll:SEC",2.17,0.433,0.527,0.02,0.474 "2024-06-23 05:28:17",3,"Poll:SRX",6.51,1.369,1.952,0.022,0.524 "2024-06-23 05:28:17",4,"RxCan1[778]",2.42,1.216,1.801,0.064,2.412 "2024-06-23 05:28:17",5,"RxCan1[7a8]",0.9,0.367,0.769,0.045,1.343 The items 1-5 should be before 6,but the timestamp is after. //.ichael From: OvmsDev <ovmsdev-bounces@lists.openvehicles.com> On Behalf Of Michael Balzer via OvmsDev Sent: Friday, June 21, 2024 11:40 PM To: OVMS Developers <ovmsdev@lists.openvehicles.com> Cc: Michael Balzer <dexter@expeedo.de> Subject: Re: [Ovmsdev] OVMS Poller module/singleton Michael, "data" notifications correspond to the V2/MP "historical" message type: * https://docs.openvehicles.com/en/latest/protocol_v2/messages.html#historical... So a record type of "*-LOG-Poll" would be OK, but I suggest using "*-LOG-PollStats" to be more precise. The record ID needs to be an integer, and the default V2 server database defines this to be a 32 bit signed integer. Note that sending a new record won't overwrite an existing one with the same ID, as the timestamp is part of the primary key. I suggest using your report line number. You can provide a header as line 0 then, or you can leave adding a header to the download tool (as do all the other data records up to now). If you use my server, you can download all data from the car UI, if you use another public server, you can still use my download tool via this page: * https://dexters-web.de/downloadtool?lang=EN Download tools other than the ones I provide in my web UI are the scripts in the server repository's client directory: * https://github.com/openvehicles/Open-Vehicle-Server/tree/master/clients The most simple form is shown by the "serverlog.sh" script, for adding headers see e.g. "rt_fetchlogs.sh". I normally let my server send me the logs by mail on a daily base, these include all historical data files with headers added. Assuming record type "*-LOG-PollStats", I've just added auto headers to my tool based on your template as follows: * type,count_hz,avg_util_pm,peak_util_pm,avg_time_ms,peak_time_ms (keeping the header style consistent with the other logs) So you can now simply send the data rows, the tool will prepend the header once on each download. Regards, Michael Am 19.06.24 um 11:10 schrieb Michael Geddes: Sure, I can do that. I did it this way because it was easier and could mostly do it in one message. As soon as I added spaces for alignment it pushed the message over 2 notifications. Also, I wasn't sure about making a new Data type and how that worked. I'm assuming something like: *-LOG-Poll would work (unless you want to suggest something else) The next 2 cols seem to be ID and lifetime. What do I use as an ID? Can it be an alpha string or does it have to be a number? (LIke using the first column descriptor). I'm not sure how the ID column is treated. I _could_ just send a line number for the dump group I guess? These are the columns I have. I can force the two cols to be always permille. "Type","Count (hz)","Avg utlization (permille)","Peak utlization (permille)", "Avg Time (ms)","Peak Time (ms)" Type is the only alpha column.. but if I can use that for the ID I guess that would be better? How would I provide a header if I wanted to? Is there some indicator saying it's a header line? I'm not sure I want to - just asking. //.ichael On Wed, 19 June 2024, 00:11 Michael Balzer via OvmsDev, <ovmsdev@lists.openvehicles.com <mailto:ovmsdev@lists.openvehicles.com> > wrote: Michael, I've received the new drive report notifications now; these need to be changed: please do not use text notifications to transport CSV data. That's what "data" notifications are meant for, which are stored in their raw form on the server for later retrieval. See e.g. the vehicle trip & grid logs for reference on how to build the messages, or have a look at the specific Twizy and UpMiiGo data messages. Data notifications also are designed to transport one row at a time, so you normally don't run into buffer size issues. A header can be supplied as a row, but you normally add one when downloading the data from the server, so tools don't need to filter these out. I provide headers automatically on my server for known message types, just send me your template and I'll include that. Apart from that, the timing statistics now seem to work pretty well, providing valuable insights. Regards, Michael Am 14.06.24 um 08:59 schrieb Michael Geddes: Thankyou. I was more worried that we might be waiting on each other. I don't think I have quite the correct able to test on my friends Leaf properly, or does it use the standard cable? Anyway, let me know what I can do to. //.ichael On Fri, 14 Jun 2024 at 14:46, Michael Balzer via OvmsDev <ovmsdev@lists.openvehicles.com <mailto:ovmsdev@lists.openvehicles.com> > wrote: Sorry, I know I'm behind with PRs. I'll try to find some time this weekend. Regards, Michael Am 14.06.24 um 08:31 schrieb Michael Geddes via OvmsDev: Was this all good? I want to make sure I get to the bottom of this whole issue asap! https://github.com/openvehicles/Open-Vehicle-Monitoring-System-3/pull/1018 Was there something else you needed me to work on to make sure this all works for all supported cars? //.ichael On Sun, 26 May 2024 at 21:15, Michael Balzer via OvmsDev <ovmsdev@lists.openvehicles.com <mailto:ovmsdev@lists.openvehicles.com> > wrote: OK, I see now why it wouldn't send the notification: the V2 & V3 server register for notifications up to COMMAND_RESULT_NORMAL = 1024 characters. The report quickly becomes larger than 1024 characters, so the notifications no longer get sent via the server connectors. You need to either reduce the size, split the report, or use data notifications instead. On the reset value init: for my float targeting smoothing helper class for the UpMiiGo, I implemented a gradual ramp up from 1 to the requested sample size. You can do something similar also with powers of 2. IOW, yes, initialization from the first values received is perfectly OK. Regards, Michael Am 26.05.24 um 14:35 schrieb Michael Geddes: It _should_ already be sending a report on charge stop. MyEvents.RegisterEvent(TAG, "vehicle.charge.stop", std::bind(&OvmsPollers::VehicleChargeStop, this, _1, _2)); Reset on charge start/vehicle on is a good idea. A question – would it be silly if the first value after a reset, rather than using 0 average to start with, if the average got set to the initial value? I’m in 2 minds about it. It would make the average more useful quicker. //.ichael On Sun, 26 May 2024, 19:39 Michael Balzer via OvmsDev, <ovmsdev@lists.openvehicles.com <mailto:ovmsdev@lists.openvehicles.com> > wrote: As the averages quickly decline when idle, an automatic report should probably also be sent on charge stop. Also, I think you should automatically reset the timer statistics on drive & charge start. First stats from charging my UpMiiGo: Type | count | Utlztn | Time | per s | [‰] | [ms] ---------------+--------+--------+--------- Poll:PRI Avg| 1.00| 0.723| 0.716 Peak| | 1.282| 3.822 ---------------+--------+--------+--------- Poll:SRX Avg| 7.72| 1.246| 0.184 Peak| | 3.128| 1.058 ---------------+--------+--------+--------- RxCan1[7ae] Avg| 2.48| 0.915| 0.362 Peak| | 1.217| 1.661 ---------------+--------+--------+--------- RxCan1[7cf] Avg| 4.76| 1.928| 0.397 Peak| | 2.317| 2.687 ---------------+--------+--------+--------- RxCan1[7ed] Avg| 3.38| 1.251| 0.327 Peak| | 8.154| 12.273 ---------------+--------+--------+--------- RxCan1[7ee] Avg| 0.21| 0.066| 0.297 Peak| | 0.225| 1.690 ---------------+--------+--------+--------- TxCan1[744] Avg| 1.49| 0.022| 0.011 Peak| | 0.032| 0.095 ---------------+--------+--------+--------- TxCan1[765] Avg| 3.89| 0.134| 0.027 Peak| | 0.155| 0.113 ---------------+--------+--------+--------- TxCan1[7e5] Avg| 2.32| 0.038| 0.013 Peak| | 0.295| 0.084 ---------------+--------+--------+--------- TxCan1[7e6] Avg| 1 0.21| 0.002| 0.008 Peak| | 0.010| 0.041 ---------------+--------+--------+--------- Cmd:State Avg| 0.00| 0.000| 0.007 Peak| | 0.005| 0.072 ===============+========+========+========= Total Avg| 27.46| 6.324| 2.349 Overall healthy I'd say, but let's see how it compares. 7ed is the BMS, the peak time is probably related to the extended cell data logging -- I've enabled log intervals for both cell voltages & temperatures. Regards, Michael Am 26.05.24 um 08:42 schrieb Michael Balzer via OvmsDev: The notification works on my devices, it only has a garbled per mille character -- see attached screenshot. The same applies to the mail version: Poller timing is: on Type | count | Utlztn | Time | per s | [‰] | [ms] ---------------+--------+--------+--------- Poll:PRI Avg| 0.25| 0.119| 0.382 Peak| | 0.513| 0.678 ---------------+--------+--------+--------- RxCan1[597] Avg| 0.01| 0.004| 0.021 Peak| | 0.000| 0.338 ---------------+--------+--------+--------- RxCan1[59b] Avg| 0.01| 0.011| 0.053 Peak| | 0.000| 0.848 ---------------+--------+--------+--------- Cmd:State Avg| 0.01| 0.002| 0.012 Peak| | 0.000| 0.120 ===============+========+========+========= Total Avg| 0.28| 0.135| 0.468 The encoding is a general issue. The character encoding for text messages via V2/MP is quite old & clumsy, it's got an issue with the degree celcius character as well. We previously tried to keep all text messages within the SMS safe character set (which e.g. lead to writing just "C" instead of "°C"). I'd say we should head towards UTF-8 now. If we ever refit SMS support, we can recode on the fly. Regarding not seeing the notification on your phone: a) Check your notification subtype/channel filters on the module. See https://docs.openvehicles.com/en/latest/userguide/notifications.html#suppres... b) Check your notification vehicle filters on the phone (menu on notification tab): if you enabled the vehicle filter, it will add the messages of not currently selected vehicles to the list only, but not raise a system notification. (Applies to the Android App, no idea about the iOS version) Regards, Michael Am 26.05.24 um 06:32 schrieb Michael Geddes: Hi, I'm trying to finalise this now .. and one last thing is that I don't get the report coming to my mobile. I'm using the command: MyNotify.NotifyString("info", "poller.report", buf.c_str()); Where the buffer string is just the same as the report output. Should I be using some other format or command? I get "alert" types (like the ioniq5 door-open alert) fine to my mobile. Michael. On Sun, 19 May 2024, 12:51 Michael Balzer via OvmsDev, <ovmsdev@lists.openvehicles.com <mailto:ovmsdev@lists.openvehicles.com> > wrote: A builtin web UI for this seems a bit over the top. Builtin web config pages should focus on user features, this is clearly a feature only needed during/for the development/extension of a vehicle adapter. Development features in the web UI are confusing for end users. If persistent enabling/disabling is done by a simple config command (e.g. "config set can poller.trace on"), that's also doable by users. Regards, Michael Am 19.05.24 um 02:06 schrieb Michael Geddes: I was so focused on how I calculated the value that I totally missed that ‰ would be a better description. I could also use the system 'Ratio' unit... so % or ‰. I'll make space to put 'Avg' on the row. Was trying to limit the width for output on a mobile. I agree it would make it easier to understand. Totals also makes sense. Should I make this a configuration that can be set on the web-page? I'd probably use a configuration change notification so that the very bit setting is sync'd with the 'configuration' value. //.ichael On Sat, 18 May 2024, 14:05 Michael Balzer, <dexter@expeedo.de <mailto:dexter@expeedo.de> > wrote: I'm not sure whether the 'max' should be the maximum of the smoothed value.. or the maximum of the raw value. It should normally be the maximum of the raw value I think, the maximum of the smoothed value cannot tell about how bad the processing of an ID can become. The naming in the table is a bit confusing I think. (besides: I've never seen "ave" as the abbreviation for average) If I understand you correctly, "time ms per s" is the time share in per mille, so something in that direction would be more clear, and "length ms" would then be "time [ms]". The totals for all averages in the table foot would also be nice. Maybe "Ave" (or avg?) also should be placed on the left, as the "peak" label now suggests being the peak of the average. Btw, keep in mind, not all "edge" users / testers are developers (e.g. the Twizy driver I'm in contact with), collecting stats feedback for vehicles from testers should be straight forward. Maybe add a data/history record, sent automatically on every drive/charge stop when the poller tracing is on? Regards, Michael Am 18.05.24 um 02:28 schrieb Michael Geddes: You did say max/pead value. I also halved the N for both. I'm not sure whether the 'max' should be the maximum of the smoothed value.. or the maximum of the raw value. This is currently the raw-value maximum. The problem is that the middle column is the maximum of the {{sum over 10s} / (10*1000,000) I could easily change the 'period' to 1s and see how that goes.. was just trying to reduce the larger calculations. Usage: poller [pause|resume|status|times|trace] OVMS# poller time status Poller timing is: on Type | Count | Ave time | Ave length | per s | ms per s | ms -------------+----------+-----------+----------- Poll:PRI | 1.00| 0.559| 0.543 peak | | 0.663| 1.528 -------------+----------+-----------+----------- Poll:SRX | 0.08| 0.009| 0.038 peak | | 0.068| 0.146 -------------+----------+-----------+----------- CAN1 RX[778] | 0.11| 0.061| 0.280 peak | | 0.458| 1.046 -------------+----------+-----------+----------- CAN1 RX[7a8] | 0.04| 0.024| 0.124 peak | | 0.160| 0.615 -------------+----------+-----------+----------- CAN1 TX[770] | 0.05| 0.004| 0.016 peak | | 0.022| 0.102 -------------+----------+-----------+----------- CAN1 TX[7a0] | 0.02| 0.002| 0.011 peak | | 0.010| 0.098 -------------+----------+-----------+----------- CAN1 TX[7b3] | 0.01| 0.001| 0.006 peak | | 0.000| 0.099 -------------+----------+-----------+----------- CAN1 TX[7e2] | 0.02| 0.002| 0.011 peak | | 0.010| 0.099 -------------+----------+-----------+----------- CAN1 TX[7e4] | 0.08| 0.008| 0.048 peak | | 0.049| 0.107 -------------+----------+-----------+----------- Cmd:State | 0.00| 0.000| 0.005 peak | | 0.000| 0.094 On Fri, 17 May 2024 at 15:26, Michael Geddes <frog@bunyip.wheelycreek.net <mailto:frog@bunyip.wheelycreek.net> > wrote: This is what I have now. The one on the end is the one MIchael B was after using an N of 32. (up for discussion). The middle is the time spent in that even t per second. It accumulates times (in microseconds), and then every 10s it stores it as smoothed (N=16) value. The Count is similar (except that we store a value of '100' as 1 event so it can be still integers and has 2 decimal places). Every received poll does a 64bit difference to 32bit (for the elapsed time) and 64bit comparison (for end-of-period). It also does 1x 32bit smoothing and 2x 32bit adds. Then at the end of a 10s period, it will do a 64bit add to get the next end-of-period value, as well as the 2x 32bit smoothing calcs. This is from the Ioniq 5 so not any big values yet. You can certainly see how insignificant the TX callbacks are. I'll leave it on for when the car is moving and gets some faster polling. OVMS# poll time status Poller timing is: on Type | Count | Ave time | Ave Length | per s | ms per s | ms -------------+----------+-----------+----------- Poll:PRI | 1.00| 0.540| 0.539 Poll:SRX | 0.03| 0.004| 0.017 CAN1 RX[778] | 0.06| 0.042| 0.175 CAN1 TX[770] | 0.04| 0.002| 0.008 Cmd:State | 0.01| 0.001| 0.005 ----------------------8<-------------------------------- Nice smoothing class (forces N as a power of 2): constexpr unsigned floorlog2(unsigned x) { return x == 1 ? 0 : 1+floorlog2(x >> 1); } /* Maintain a smoothed average using shifts for division. * T should be an integer type * N needs to be a power of 2 */ template <typename T, unsigned N> class average_util_t { private: T m_ave; public: average_util_t() : m_ave(0) {} static const uint8_t _BITS = floorlog2(N); void add( T val) { static_assert(N == (1 << _BITS), "N must be a power of 2"); m_ave = (((N-1) * m_ave) + val) >> _BITS; } T get() { return m_ave; } operator T() { return m_ave; } }; On Thu, 16 May 2024 at 10:29, Michael Geddes <frog@bunyip.wheelycreek.net <mailto:frog@bunyip.wheelycreek.net> > wrote: Thanks Michael, My calculations give me ((2^32)-1) / (1000*1000*3600) = only 1.2 hours of processing time in 32bit. The initial subtraction is 64bit anyway and I can't see a further 64bit addition being a problem. I have the calculations being performed in doubles at print-out where performance is not really an issue anyway. (Though apparently doing 64 bit division is worse than floating point). In addition * I currently have this being able to be turned on and off and reset manually (only do it when required). * For the lower volume commands, the smoothed average is not going to be useful - the count is more interesting for different reasons. * The total time is quite useful. Ie a high average time doesn't matter if the count is low. The things that are affecting performance are stuff with high total time. Stuff which is happening 100 times a second needs to be a much lower average than once a second. * A measure like 'time per minute/second' and possibly count per minute/seconds as a smoothed average would potentially be more useful. (or in addition?) I think we could do _that_ in a reasonably efficient manner using a 64 bit 'last measured time', a 32 bit accumulated value and the stored 32 bit rolling average. It would boils down to some iterative (integer) sums and multiplications plus a divide by n ^ (time periods passed) - which is a shift - and which can be optimised to '0' if 'time-periods-passed' is more than 32/(bits-per-n) - effectively limiting the number of iterations. The one issue I can see is that we need to calculate 'number of time-periods passed' which is a 64 bit subtraction followed by a 32 bit division (not optimisable to a simple shift). * I'm also happy to keep a rolling (32bit) average time. Even if you assume averages in the 100ms, 32bit is going to happily support an N of 64 or even 128. Am I right in thinking that the choice of N is highly dependent on frequency. For things happening 100 times per second, you might want an N like 128.. where things happening once per second, you might want an N of 4 or 8. The other things we keep track of in this manner we have a better idea of the frequency of the thing. How about we have (per record type): * total count (since last reset?) (32 bit) * smoothed average of time per instance (32 bit) * ?xx? total accumulated time since last reset (64bit) ?? <-- with the below stats this is much less useful * last-measured-time (64 bit) * accumulated count since last time-period (16bit - but maybe 32bit anyway for byte alignment?) * smoothed average of count per time-period (32bit) * accumulated time since last time-period (32bit) * smoothed average of time per time-period (32bit) It's possible to keep the Is this going to be too much per record type? The number of 'records' we are keeping is quite low (so 10 to 20 maybe) - so it's not a huge memory burden. Thoughts? //.ichael On Thu, 16 May 2024 at 03:09, Michael Balzer via OvmsDev <ovmsdev@lists.openvehicles.com <mailto:ovmsdev@lists.openvehicles.com> > wrote: esp_timer_get_time() is the right choice for precision timing. I'd say uint32 is enough though, even if counting microseconds that can hold a total of more than 71 hours of actual processing time. uint64 has a significant performance penalty, although I don't recall the overhead for simple additions. Also & more important, the average wouldn't be my main focus, but the maximum processing time seen per ID, which seems to be missing in your draft. Second thought on the average… the exact overall average really has a minor meaning, I'd rather see the current average, adapting to the current mode of operation (drive/charge/…). I suggest feeding the measurements to a low pass filter to get the smoothed average of the last n measurements. Pattern: runavg = ((N-1) * runavg + newval) / N By using a low power of 2 for N (e.g. 8 or 16), you can replace the division by a simple bit shift, and have enough headroom to use 32 bit integers. Regards, Michael Am 15.05.24 um 06:51 schrieb Michael Geddes via OvmsDev: Formatting aside, I have implemented what I think Michael B was suggesting. This is a sample run on the Ioniq 5 (which doesn't have unsolicited RX events). This uses the call esp_timer_get_time() got get a 64bit microseconds since started value - and works out the time to execute that way. It's looking at absolute time and not time in the Task - so other things going on at the same time in other tasks will have an effect. (The normal tick count doesn't have nearly enough resolution to be useful - any other ideas on measurement?) I've got total accumulated time displaying in seconds and the average in milliseconds currently - but I can change that easy enough. The cumulative time is stored as uint64_t which will be plenty, as 32bit wouldn't be nearly enough. OVMS# poller time on Poller timing is now on OVMS# poller time status Poller timing is: on Poll [PRI] : n=390 tot=0.2s ave=0.586ms Poll [SRX] : n=316 tot=0.1s ave=0.196ms CAN1 RX[0778] : n=382 tot=0.2s ave=0.615ms CAN1 RX[07a8] : n=48 tot=0.0s ave=0.510ms CAN1 RX[07bb] : n=162 tot=0.1s ave=0.519ms CAN1 RX[07ce] : n=33 tot=0.0s ave=0.469ms CAN1 RX[07ea] : n=408 tot=0.2s ave=0.467ms CAN1 RX[07ec] : n=486 tot=0.2s ave=0.477ms CAN3 RX[07df] : n=769 tot=0.2s ave=0.261ms CAN1 TX[0770] : n=191 tot=0.0s ave=0.054ms CAN1 TX[07a0] : n=16 tot=0.0s ave=0.047ms CAN1 TX[07b3] : n=31 tot=0.0s ave=0.069ms CAN1 TX[07c6] : n=11 tot=0.0s ave=0.044ms CAN1 TX[07e2] : n=82 tot=0.0s ave=0.067ms CAN1 TX[07e4] : n=54 tot=0.0s ave=0.044ms Set State : -- Michael Balzer * Helkenberger Weg 9 * D-58256 Ennepetal Fon 02333 / 833 5735 * Handy 0176 / 206 989 26
The messages can get out of sequence if there are temporary network issues. For example (this case probably), IDs 1-5 get lost and need to be retransmitted. The protocol includes a time offset, and the server tries to adjust the timestamp accordingly, but offset resolution is currently 1 second and the server bases the corrections on it's own time, so there can be discrepancies. Regards, Michael Am 23.06.24 um 11:03 schrieb Michael Geddes via OvmsDev:
This is by-and-large working (pushed). The only thing is that occasionally the records seem to be coming in out-of-order. For example (after some munging with jq)
"2024-06-23 05:28:16",6,"RxCan1[7bb]",13.63,5.933,8.526,0.06,3.685
"2024-06-23 05:28:16",7,"RxCan1[7ce]",0.57,0.195,0.365,0.034,0.759
"2024-06-23 05:28:16",8,"RxCan1[7ea]",4.41,1.796,2.416,0.052,1.557
"2024-06-23 05:28:16",9,"RxCan1[7ec]",18.95,7.672,11.532,0.112,19.324
"2024-06-23 05:28:16",10,"RxCan3[7df]",9.09,1.554,1.999,0.023,1.242
"2024-06-23 05:28:16",16,"TxCan1[7e4]",2.15,0.06,0.094,0.003,0.079
"2024-06-23 05:28:16",17,"Cmd:Thrtl",0,0,0.004,0.004,0.044
"2024-06-23 05:28:16",18,"Cmd:RspSp",0,0,0.002,0.002,0.019
"2024-06-23 05:28:16",19,"Cmd:SucSp",0,0,0.002,0.002,0.018
"2024-06-23 05:28:16",20,"Cmd:State",0,0,0,0.01,0.104
"2024-06-23 05:28:17",1,"Poll:PRI",1.07,0.472,0.565,0.039,0.675
"2024-06-23 05:28:17",2,"Poll:SEC",2.17,0.433,0.527,0.02,0.474
"2024-06-23 05:28:17",3,"Poll:SRX",6.51,1.369,1.952,0.022,0.524
"2024-06-23 05:28:17",4,"RxCan1[778]",2.42,1.216,1.801,0.064,2.412
"2024-06-23 05:28:17",5,"RxCan1[7a8]",0.9,0.367,0.769,0.045,1.343
The items 1-5 should be before 6,but the timestamp is after.
//.ichael
*From:*OvmsDev <ovmsdev-bounces@lists.openvehicles.com> *On Behalf Of *Michael Balzer via OvmsDev *Sent:* Friday, June 21, 2024 11:40 PM *To:* OVMS Developers <ovmsdev@lists.openvehicles.com> *Cc:* Michael Balzer <dexter@expeedo.de> *Subject:* Re: [Ovmsdev] OVMS Poller module/singleton
Michael,
"data" notifications correspond to the V2/MP "historical" message type:
* https://docs.openvehicles.com/en/latest/protocol_v2/messages.html#historical...
So a record type of "*-LOG-Poll" would be OK, but I suggest using "*-LOG-PollStats" to be more precise.
The record ID needs to be an integer, and the default V2 server database defines this to be a 32 bit signed integer. Note that sending a new record won't overwrite an existing one with the same ID, as the timestamp is part of the primary key. I suggest using your report line number.
You can provide a header as line 0 then, or you can leave adding a header to the download tool (as do all the other data records up to now). If you use my server, you can download all data from the car UI, if you use another public server, you can still use my download tool via this page:
* https://dexters-web.de/downloadtool?lang=EN
Download tools other than the ones I provide in my web UI are the scripts in the server repository's client directory:
* https://github.com/openvehicles/Open-Vehicle-Server/tree/master/clients
The most simple form is shown by the "serverlog.sh" script, for adding headers see e.g. "rt_fetchlogs.sh". I normally let my server send me the logs by mail on a daily base, these include all historical data files with headers added.
Assuming record type "*-LOG-PollStats", I've just added auto headers to my tool based on your template as follows:
* type,count_hz,avg_util_pm,peak_util_pm,avg_time_ms,peak_time_ms
(keeping the header style consistent with the other logs)
So you can now simply send the data rows, the tool will prepend the header once on each download.
Regards, Michael
Am 19.06.24 um 11:10 schrieb Michael Geddes:
Sure, I can do that.
I did it this way because it was easier and could mostly do it in one message. As soon as I added spaces for alignment it pushed the message over 2 notifications. Also, I wasn't sure about making a new Data type and how that worked.
I'm assuming something like: *-LOG-Poll would work (unless you want to suggest something else) The next 2 cols seem to be ID and lifetime.
What do I use as an ID? Can it be an alpha string or does it have to be a number? (LIke using the first column descriptor). I'm not sure
how the ID column is treated. I _could_ just send a line number for the dump group I guess?
These are the columns I have. I can force the two cols to be always permille.
"Type","Count (hz)","Avg utlization (permille)","Peak utlization (permille)", "Avg Time (ms)","Peak Time (ms)"
Type is the only alpha column.. but if I can use that for the ID I guess that would be better?
How would I provide a header if I wanted to? Is there some indicator saying it's a header line? I'm not sure I want to - just asking.
//.ichael
On Wed, 19 June 2024, 00:11 Michael Balzer via OvmsDev, <ovmsdev@lists.openvehicles.com> wrote:
Michael,
I've received the new drive report notifications now; these need to be changed: please do not use text notifications to transport CSV data. That's what "data" notifications are meant for, which are stored in their raw form on the server for later retrieval. See e.g. the vehicle trip & grid logs for reference on how to build the messages, or have a look at the specific Twizy and UpMiiGo data messages.
Data notifications also are designed to transport one row at a time, so you normally don't run into buffer size issues. A header can be supplied as a row, but you normally add one when downloading the data from the server, so tools don't need to filter these out. I provide headers automatically on my server for known message types, just send me your template and I'll include that.
Apart from that, the timing statistics now seem to work pretty well, providing valuable insights.
Regards, Michael
Am 14.06.24 um 08:59 schrieb Michael Geddes:
Thankyou.
I was more worried that we might be waiting on each other.
I don't think I have quite the correct able to test on my friends Leaf properly, or does it use the standard cable?
Anyway, let me know what I can do to.
//.ichael
On Fri, 14 Jun 2024 at 14:46, Michael Balzer via OvmsDev <ovmsdev@lists.openvehicles.com> wrote:
Sorry, I know I'm behind with PRs.
I'll try to find some time this weekend.
Regards, Michael
Am 14.06.24 um 08:31 schrieb Michael Geddes via OvmsDev:
Was this all good? I want to make sure I get to the bottom of this whole issue asap!
https://github.com/openvehicles/Open-Vehicle-Monitoring-System-3/pull/1018
Was there something else you needed me to work on to make sure this all works for all supported cars?
//.ichael
On Sun, 26 May 2024 at 21:15, Michael Balzer via OvmsDev <ovmsdev@lists.openvehicles.com> wrote:
OK, I see now why it wouldn't send the notification: the V2 & V3 server register for notifications up to COMMAND_RESULT_NORMAL = 1024 characters.
The report quickly becomes larger than 1024 characters, so the notifications no longer get sent via the server connectors.
You need to either reduce the size, split the report, or use data notifications instead.
On the reset value init: for my float targeting smoothing helper class for the UpMiiGo, I implemented a gradual ramp up from 1 to the requested sample size. You can do something similar also with powers of 2. IOW, yes, initialization from the first values received is perfectly OK.
Regards, Michael
Am 26.05.24 um 14:35 schrieb Michael Geddes:
It _/should/_ already be sending a report on charge stop.
MyEvents.RegisterEvent(TAG, "vehicle.charge.stop", std::bind(&OvmsPollers::VehicleChargeStop, this, _1, _2));
Reset on charge start/vehicle on is a good idea.
A question – would it be silly if the first value after a reset, rather than using 0 average to start with, if the average got set to the initial value? I’m in 2 minds about it. It would make the average more useful quicker.
//.ichael
On Sun, 26 May 2024, 19:39 Michael Balzer via OvmsDev, <ovmsdev@lists.openvehicles.com> wrote:
As the averages quickly decline when idle, an automatic report should probably also be sent on charge stop.
Also, I think you should automatically reset the timer statistics on drive & charge start.
First stats from charging my UpMiiGo:
Type | count | Utlztn | Time | per s | [‰] | [ms] ---------------+--------+--------+--------- Poll:PRI Avg| 1.00| 0.723| 0.716 Peak| | 1.282| 3.822 ---------------+--------+--------+--------- Poll:SRX Avg| 7.72| 1.246| 0.184 Peak| | 3.128| 1.058 ---------------+--------+--------+--------- RxCan1[7ae] Avg| 2.48| 0.915| 0.362 Peak| | 1.217| 1.661 ---------------+--------+--------+--------- RxCan1[7cf] Avg| 4.76| 1.928| 0.397 Peak| | 2.317| 2.687 ---------------+--------+--------+--------- RxCan1[7ed] Avg| 3.38| 1.251| 0.327 Peak| | 8.154| 12.273 ---------------+--------+--------+--------- RxCan1[7ee] Avg| 0.21| 0.066| 0.297 Peak| | 0.225| 1.690 ---------------+--------+--------+--------- TxCan1[744] Avg| 1.49| 0.022| 0.011 Peak| | 0.032| 0.095 ---------------+--------+--------+--------- TxCan1[765] Avg| 3.89| 0.134| 0.027 Peak| | 0.155| 0.113 ---------------+--------+--------+--------- TxCan1[7e5] Avg| 2.32| 0.038| 0.013 Peak| | 0.295| 0.084 ---------------+--------+--------+--------- TxCan1[7e6] Avg| 1 0.21| 0.002| 0.008 Peak| | 0.010| 0.041 ---------------+--------+--------+--------- Cmd:State Avg| 0.00| 0.000| 0.007 Peak| | 0.005| 0.072 ===============+========+========+========= Total Avg| 27.46| 6.324| 2.349
Overall healthy I'd say, but let's see how it compares.
7ed is the BMS, the peak time is probably related to the extended cell data logging -- I've enabled log intervals for both cell voltages & temperatures.
Regards, Michael
Am 26.05.24 um 08:42 schrieb Michael Balzer via OvmsDev:
The notification works on my devices, it only has a garbled per mille character -- see attached screenshot. The same applies to the mail version:
Poller timing is: on
Type | count | Utlztn | Time
| per s | [‰] | [ms]
---------------+--------+--------+---------
Poll:PRI Avg| 0.25| 0.119| 0.382
Peak| | 0.513| 0.678
---------------+--------+--------+---------
RxCan1[597] Avg| 0.01| 0.004| 0.021
Peak| | 0.000| 0.338
---------------+--------+--------+---------
RxCan1[59b] Avg| 0.01| 0.011| 0.053
Peak| | 0.000| 0.848
---------------+--------+--------+---------
Cmd:State Avg| 0.01| 0.002| 0.012
Peak| | 0.000| 0.120
===============+========+========+=========
Total Avg| 0.28| 0.135| 0.468
The encoding is a general issue. The character encoding for text messages via V2/MP is quite old & clumsy, it's got an issue with the degree celcius character as well. We previously tried to keep all text messages within the SMS safe character set (which e.g. lead to writing just "C" instead of "°C"). I'd say we should head towards UTF-8 now. If we ever refit SMS support, we can recode on the fly.
Regarding not seeing the notification on your phone:
a) Check your notification subtype/channel filters on the module. See https://docs.openvehicles.com/en/latest/userguide/notifications.html#suppres...
b) Check your notification vehicle filters on the phone (menu on notification tab): if you enabled the vehicle filter, it will add the messages of not currently selected vehicles to the list only, but not raise a system notification. (Applies to the Android App, no idea about the iOS version)
Regards, Michael
Am 26.05.24 um 06:32 schrieb Michael Geddes:
Hi,
I'm trying to finalise this now .. and one last thing is that I don't get the report coming to my mobile. I'm using the command:
MyNotify.NotifyString("info", "poller.report", buf.c_str());
Where the buffer string is just the same as the report output. Should I be using some other format or command?
I get "alert" types (like the ioniq5 door-open alert) fine to my mobile.
Michael.
On Sun, 19 May 2024, 12:51 Michael Balzer via OvmsDev, <ovmsdev@lists.openvehicles.com> wrote:
A builtin web UI for this seems a bit over the top. Builtin web config pages should focus on user features, this is clearly a feature only needed during/for the development/extension of a vehicle adapter. Development features in the web UI are confusing for end users.
If persistent enabling/disabling is done by a simple config command (e.g. "config set can poller.trace on"), that's also doable by users.
Regards, Michael
Am 19.05.24 um 02:06 schrieb Michael Geddes:
I was so focused on how I calculated the value that I totally missed that ‰ would be a better description. I could also use the system 'Ratio' unit... so % or ‰.
I'll make space to put 'Avg' on the row. Was trying to limit the width for output on a mobile. I agree it would make it easier to understand.
Totals also makes sense.
Should I make this a configuration that can be set on the web-page? I'd probably use a configuration change notification so that the very bit setting is sync'd with the 'configuration' value.
//.ichael
On Sat, 18 May 2024, 14:05 Michael Balzer, <dexter@expeedo.de> wrote:
I'm not sure whether the 'max' should be the maximum of the smoothed value.. or the maximum of the raw value.
It should normally be the maximum of the raw value I think, the maximum of the smoothed value cannot tell about how bad the processing of an ID can become.
The naming in the table is a bit confusing I think. (besides: I've never seen "ave" as the abbreviation for average)
If I understand you correctly, "time ms per s" is the time share in per mille, so something in that direction would be more clear, and "length ms" would then be "time [ms]".
The totals for all averages in the table foot would also be nice.
Maybe "Ave" (or avg?) also should be placed on the left, as the "peak" label now suggests being the peak of the average.
Btw, keep in mind, not all "edge" users / testers are developers (e.g. the Twizy driver I'm in contact with), collecting stats feedback for vehicles from testers should be straight forward. Maybe add a data/history record, sent automatically on every drive/charge stop when the poller tracing is on?
Regards, Michael
Am 18.05.24 um 02:28 schrieb Michael Geddes:
You did say max/pead value. I also halved the N for both.
I'm not sure whether the 'max' should be the maximum of the smoothed value.. or the maximum of the raw value.
This is currently the raw-value maximum.
The problem is that the middle column is the maximum of the {{sum over 10s} / (10*1000,000)
I could easily change the 'period' to 1s and see how that goes.. was just trying to reduce the larger calculations.
Usage: poller [pause|resume|status|times|trace]
OVMS# poller time status Poller timing is: on Type | Count | Ave time | Ave length | per s | ms per s | ms -------------+----------+-----------+----------- Poll:PRI | 1.00| 0.559| 0.543 peak | | 0.663| 1.528 -------------+----------+-----------+----------- Poll:SRX | 0.08| 0.009| 0.038 peak | | 0.068| 0.146 -------------+----------+-----------+----------- CAN1 RX[778] | 0.11| 0.061| 0.280 peak | | 0.458| 1.046 -------------+----------+-----------+----------- CAN1 RX[7a8] | 0.04| 0.024| 0.124 peak | | 0.160| 0.615 -------------+----------+-----------+----------- CAN1 TX[770] | 0.05| 0.004| 0.016 peak | | 0.022| 0.102 -------------+----------+-----------+----------- CAN1 TX[7a0] | 0.02| 0.002| 0.011 peak | | 0.010| 0.098 -------------+----------+-----------+----------- CAN1 TX[7b3] | 0.01| 0.001| 0.006 peak | | 0.000| 0.099 -------------+----------+-----------+----------- CAN1 TX[7e2] | 0.02| 0.002| 0.011 peak | | 0.010| 0.099 -------------+----------+-----------+----------- CAN1 TX[7e4] | 0.08| 0.008| 0.048 peak | | 0.049| 0.107 -------------+----------+-----------+----------- Cmd:State | 0.00| 0.000| 0.005 peak | | 0.000| 0.094
On Fri, 17 May 2024 at 15:26, Michael Geddes <frog@bunyip.wheelycreek.net> wrote:
This is what I have now.
The one on the end is the one MIchael B was after using an N of 32. (up for discussion).
The middle is the time spent in that even t per second. It accumulates times (in microseconds), and then every 10s it stores it as smoothed (N=16) value.
The Count is similar (except that we store a value of '100' as 1 event so it can be still integers and has 2 decimal places).
Every received poll does a 64bit difference to 32bit (for the elapsed time) and 64bit comparison (for end-of-period).
It also does 1x 32bit smoothing and 2x 32bit adds.
Then at the end of a 10s period, it will do a 64bit add to get the next end-of-period value, as well as the 2x 32bit smoothing calcs.
This is from the Ioniq 5 so not any big values yet. You can certainly see how insignificant the TX callbacks are.
I'll leave it on for when the car is moving and gets some faster polling.
OVMS# poll time status Poller timing is: on Type | Count | Ave time | Ave Length | per s | ms per s | ms -------------+----------+-----------+----------- Poll:PRI | 1.00| 0.540| 0.539 Poll:SRX | 0.03| 0.004| 0.017 CAN1 RX[778] | 0.06| 0.042| 0.175 CAN1 TX[770] | 0.04| 0.002| 0.008 Cmd:State | 0.01| 0.001| 0.005
----------------------8<--------------------------------
Nice smoothing class (forces N as a power of 2):
constexpr unsigned floorlog2(unsigned x) { return x == 1 ? 0 : 1+floorlog2(x >> 1); } /* Maintain a smoothed average using shifts for division. * T should be an integer type * N needs to be a power of 2 */ template <typename T, unsigned N> class average_util_t { private: T m_ave; public: average_util_t() : m_ave(0) {} static const uint8_t _BITS = floorlog2(N); void add( T val) { static_assert(N == (1 << _BITS), "N must be a power of 2"); m_ave = (((N-1) * m_ave) + val) >> _BITS; } T get() { return m_ave; } operator T() { return m_ave; } };
On Thu, 16 May 2024 at 10:29, Michael Geddes <frog@bunyip.wheelycreek.net> wrote:
Thanks Michael,
My calculations give me ((2^32)-1) / (1000*1000*3600) = only 1.2 hours of processing time in 32bit. The initial subtraction is 64bit anyway and I can't see a further 64bit addition being a problem. I have the calculations being performed in doubles at print-out where performance is not really an issue anyway. (Though apparently doing 64 bit division is worse than floating point).
In addition
* I currently have this being able to be turned on and off and reset manually (only do it when required).
* For the lower volume commands, the smoothed average is not going to be useful - the count is more interesting for different reasons.
* The total time is quite useful. Ie a high average time doesn't matter if the count is low. The things that are affecting performance are stuff with high total time. Stuff which is happening 100 times a second needs to be a much lower average than once a second.
* A measure like 'time per minute/second' and possibly count per minute/seconds as a smoothed average would potentially be more useful. (or in addition?)
I think we could do _that_ in a reasonably efficient manner using a 64 bit 'last measured time', a 32 bit accumulated value and the stored 32 bit rolling average.
It would boils down to some iterative (integer) sums and multiplications plus a divide by n ^ (time periods passed) - which is a shift - and which can be optimised to '0' if 'time-periods-passed' is more than 32/(bits-per-n) - effectively limiting the number of iterations.
The one issue I can see is that we need to calculate 'number of time-periods passed' which is a 64 bit subtraction followed by a 32 bit division (not optimisable to a simple shift).
* I'm also happy to keep a rolling (32bit) average time.
Even if you assume averages in the 100ms, 32bit is going to happily support an N of 64 or even 128.
Am I right in thinking that the choice of N is highly dependent on frequency. For things happening 100 times per second, you might want an N like 128.. where things happening once per
second, you might want an N of 4 or 8. The other things we keep track of in this manner we have a better idea of the frequency of the thing.
How about we have (per record type):
* total count (since last reset?) (32 bit)
* smoothed average of time per instance (32 bit)
* ?xx? total accumulated time since last reset (64bit) ?? <-- with the below stats this is much less useful
* last-measured-time (64 bit)
* accumulated count since last time-period (16bit - but maybe 32bit anyway for byte alignment?)
* smoothed average of count per time-period (32bit)
* accumulated time since last time-period (32bit)
* smoothed average of time per time-period (32bit)
It's possible to keep the
Is this going to be too much per record type? The number of 'records' we are keeping is quite low (so 10 to 20 maybe) - so it's not a huge memory burden.
Thoughts?
//.ichael
On Thu, 16 May 2024 at 03:09, Michael Balzer via OvmsDev <ovmsdev@lists.openvehicles.com> wrote:
esp_timer_get_time() is the right choice for precision timing.
I'd say uint32 is enough though, even if counting microseconds that can hold a total of more than 71 hours of actual processing time. uint64 has a significant performance penalty, although I don't recall the overhead for simple additions.
Also & more important, the average wouldn't be my main focus, but the maximum processing time seen per ID, which seems to be missing in your draft.
Second thought on the average… the exact overall average really has a minor meaning, I'd rather see the current average, adapting to the current mode of operation (drive/charge/…). I suggest feeding the measurements to a low pass filter to get the smoothed average of the last n measurements. Pattern:
runavg = ((N-1) * runavg + newval) / N
By using a low power of 2 for N (e.g. 8 or 16), you can replace the division by a simple bit shift, and have enough headroom to use 32 bit integers.
Regards, Michael
Am 15.05.24 um 06:51 schrieb Michael Geddes via OvmsDev:
Formatting aside, I have implemented what I think Michael B was suggesting. This is a sample run on the Ioniq 5 (which doesn't have unsolicited RX events).
This uses the call esp_timer_get_time() got get a 64bit *microseconds* since started value - and works out the time to execute that way. It's looking at absolute time and not time in the Task - so other things going on at the same time in other tasks will have an effect. (The normal tick count doesn't have nearly enough resolution to be useful - any other ideas on measurement?) I've got total accumulated time displaying in seconds and the average in milliseconds currently - but I can change that easy enough.
The cumulative time is stored as uint64_t which will be plenty, as 32bit wouldn't be nearly enough.
OVMS# *poller time on* Poller timing is now on
OVMS# *poller time status* Poller timing is: on Poll [PRI] : n=390 tot=0.2s ave=0.586ms Poll [SRX] : n=316 tot=0.1s ave=0.196ms CAN1 RX[0778] : n=382 tot=0.2s ave=0.615ms CAN1 RX[07a8] : n=48 tot=0.0s ave=0.510ms CAN1 RX[07bb] : n=162 tot=0.1s ave=0.519ms CAN1 RX[07ce] : n=33 tot=0.0s ave=0.469ms CAN1 RX[07ea] : n=408 tot=0.2s ave=0.467ms CAN1 RX[07ec] : n=486 tot=0.2s ave=0.477ms CAN3 RX[07df] : n=769 tot=0.2s ave=0.261ms CAN1 TX[0770] : n=191 tot=0.0s ave=0.054ms CAN1 TX[07a0] : n=16 tot=0.0s ave=0.047ms CAN1 TX[07b3] : n=31 tot=0.0s ave=0.069ms CAN1 TX[07c6] : n=11 tot=0.0s ave=0.044ms CAN1 TX[07e2] : n=82 tot=0.0s ave=0.067ms CAN1 TX[07e4] : n=54 tot=0.0s ave=0.044ms Set State :
-- Michael Balzer * Helkenberger Weg 9 * D-58256 Ennepetal Fon 02333 / 833 5735 * Handy 0176 / 206 989 26
_______________________________________________ OvmsDev mailing list OvmsDev@lists.openvehicles.com http://lists.openvehicles.com/mailman/listinfo/ovmsdev
-- Michael Balzer * Helkenberger Weg 9 * D-58256 Ennepetal Fon 02333 / 833 5735 * Handy 0176 / 206 989 26

Hi, I finally got around to merging my code with the current master (previous merge february 2024). I have rebuilt my code for a Ford Focus Electric so that it uses the new OvmsPoller class. However, I now see a lot of entries like this in my log: I (246448) vehicle-poll: Poller[Frame]: RX Task Queue Overflow Run 8 I (246448) vehicle-poll: Poller[Frame]: RX Task Queue Overflow Run 3 I (246448) vehicle-poll: Poller[Frame]: RX Task Queue Overflow Run 1 I (246448) vehicle-poll: Poller[Frame]: RX Task Queue Overflow Run 2 I (246448) vehicle-poll: Poller[Frame]: RX Task Queue Overflow Run 1 I (246448) vehicle-poll: Poller[Frame]: RX Task Queue Overflow Run 2 I (246448) vehicle-poll: Poller[Frame]: RX Task Queue Overflow Run 1 I (246448) vehicle-poll: Poller[Frame]: RX Task Queue Overflow Run 1 I (254448) vehicle-poll: Poller[Frame]: RX Task Queue Overflow Run 24 I (254448) vehicle-poll: Poller[Frame]: RX Task Queue Overflow Run 1 I (254448) vehicle-poll: Poller[Frame]: RX Task Queue Overflow Run 1 I (254448) vehicle-poll: Poller[Frame]: RX Task Queue Overflow Run 1 I (254448) vehicle-poll: Poller[Frame]: RX Task Queue Overflow Run 1 I (254448) vehicle-poll: Poller[Frame]: RX Task Queue Overflow Run 1 I (254448) vehicle-poll: Poller[Frame]: RX Task Queue Overflow Run 1 Was this message just hidden before or do I need to make further adjustments to my code? My code currently does not use active polling but reads on the busses (IncomingFrameCanX) on certain modules. When I look at poller times status, it looks very extensive to me... OVMS# poller times status Poller timing is: on Type | count | Utlztn | Time | per s | [%] | [ms] ---------------+--------+--------+--------- Poll:PRI Avg| 0.00| 0.0000| 0.003 Peak| | 0.0014| 0.041 ---------------+--------+--------+--------- RxCan1[010] Avg| 0.00| 0.0000| 0.020 Peak| | 1.2217| 1.089 ---------------+--------+--------+--------- RxCan1[030] Avg| 0.00| 0.0000| 0.024 Peak| | 1.2193| 1.241 ---------------+--------+--------+--------- RxCan1[041] Avg| 0.00| 0.0000| 0.023 Peak| | 0.6460| 1.508 ---------------+--------+--------+--------- RxCan1[049] Avg| 0.00| 0.0000| 0.024 Peak| | 0.6320| 0.630 ---------------+--------+--------+--------- RxCan1[04c] Avg| 0.00| 0.0000| 0.023 Peak| | 0.6430| 1.474 ---------------+--------+--------+--------- RxCan1[04d] Avg| 0.00| 0.0000| 0.022 Peak| | 1.2987| 1.359 ---------------+--------+--------+--------- RxCan1[076] Avg| 0.00| 0.0000| 0.072 Peak| | 0.7818| 15.221 ---------------+--------+--------+--------- RxCan1[077] Avg| 0.00| 0.0000| 0.022 Peak| | 0.6274| 0.955 ---------------+--------+--------+--------- RxCan1[07a] Avg| 0.00| 0.0000| 0.039 Peak| | 1.7602| 1.684 ---------------+--------+--------+--------- RxCan1[07d] Avg| 0.00| 0.0000| 0.023 Peak| | 0.6621| 1.913 ---------------+--------+--------+--------- RxCan1[0c8] Avg| 0.00| 0.0000| 0.026 Peak| | 0.6292| 1.412 ---------------+--------+--------+--------- RxCan1[11a] Avg| 0.00| 0.0000| 0.023 Peak| | 1.2635| 1.508 ---------------+--------+--------+--------- RxCan1[130] Avg| 0.00| 0.0000| 0.024 Peak| | 0.6548| 0.703 ---------------+--------+--------+--------- RxCan1[139] Avg| 0.00| 0.0000| 0.021 Peak| | 0.6002| 0.984 ---------------+--------+--------+--------- RxCan1[156] Avg| 0.00| 0.0000| 0.024 Peak| | 0.1225| 0.479 ---------------+--------+--------+--------- RxCan1[160] Avg| 0.00| 0.0000| 0.028 Peak| | 0.6586| 1.376 ---------------+--------+--------+--------- RxCan1[165] Avg| 0.00| 0.0000| 0.027 Peak| | 0.6368| 1.132 ---------------+--------+--------+--------- RxCan1[167] Avg| 0.00| 0.0000| 0.024 Peak| | 1.3009| 1.067 ---------------+--------+--------+--------- RxCan1[171] Avg| 0.00| 0.0000| 0.022 Peak| | 0.6590| 4.320 ---------------+--------+--------+--------- RxCan1[178] Avg| 0.00| 0.0000| 0.023 Peak| | 0.1161| 0.311 ---------------+--------+--------+--------- RxCan1[179] Avg| 0.00| 0.0000| 0.024 Peak| | 0.1236| 0.536 ---------------+--------+--------+--------- RxCan1[180] Avg| 0.00| 0.0000| 0.022 Peak| | 0.6472| 1.193 ---------------+--------+--------+--------- RxCan1[185] Avg| 0.00| 0.0000| 0.022 Peak| | 0.6777| 1.385 ---------------+--------+--------+--------- RxCan1[1a0] Avg| 0.00| 0.0000| 0.022 Peak| | 0.6486| 2.276 ---------------+--------+--------+--------- RxCan1[1e0] Avg| 0.00| 0.0000| 0.023 Peak| | 0.6725| 1.376 ---------------+--------+--------+--------- RxCan1[1e4] Avg| 0.00| 0.0000| 0.027 Peak| | 0.7370| 1.266 ---------------+--------+--------+--------- RxCan1[1f0] Avg| 0.00| 0.0000| 0.024 Peak| | 0.4253| 0.753 ---------------+--------+--------+--------- RxCan1[200] Avg| 0.00| 0.0000| 0.025 Peak| | 0.6262| 0.791 ---------------+--------+--------+--------- RxCan1[202] Avg| 0.00| 0.0000| 0.021 Peak| | 1.2915| 1.257 ---------------+--------+--------+--------- RxCan1[204] Avg| 0.00| 0.0000| 0.022 Peak| | 1.2620| 1.010 ---------------+--------+--------+--------- RxCan1[213] Avg| 0.00| 0.0000| 0.022 Peak| | 0.6331| 1.185 ---------------+--------+--------+--------- RxCan1[214] Avg| 0.00| 0.0000| 0.023 Peak| | 0.9977| 34.527 ---------------+--------+--------+--------- RxCan1[217] Avg| 0.00| 0.0000| 0.024 Peak| | 1.2825| 1.328 ---------------+--------+--------+--------- RxCan1[218] Avg| 0.00| 0.0000| 0.022 Peak| | 0.6328| 1.110 ---------------+--------+--------+--------- RxCan1[230] Avg| 0.00| 0.0000| 0.019 Peak| | 0.6742| 5.119 ---------------+--------+--------+--------- RxCan1[240] Avg| 0.00| 0.0000| 0.022 Peak| | 0.1163| 0.343 ---------------+--------+--------+--------- RxCan1[242] Avg| 0.00| 0.0000| 0.025 Peak| | 0.3501| 1.015 ---------------+--------+--------+--------- RxCan1[24a] Avg| 0.00| 0.0000| 0.022 Peak| | 0.1212| 0.338 ---------------+--------+--------+--------- RxCan1[24b] Avg| 0.00| 0.0000| 0.023 Peak| | 0.1289| 0.330 ---------------+--------+--------+--------- RxCan1[24c] Avg| 0.00| 0.0000| 0.033 Peak| | 0.1714| 1.189 ---------------+--------+--------+--------- RxCan1[25a] Avg| 0.00| 0.0000| 0.024 Peak| | 0.1289| 0.510 ---------------+--------+--------+--------- RxCan1[25b] Avg| 0.00| 0.0000| 0.022 Peak| | 0.6685| 0.930 ---------------+--------+--------+--------- RxCan1[25c] Avg| 0.00| 0.0000| 0.027 Peak| | 1.3298| 2.670 ---------------+--------+--------+--------- RxCan1[260] Avg| 0.00| 0.0000| 0.023 Peak| | 0.1271| 0.401 ---------------+--------+--------+--------- RxCan1[270] Avg| 0.00| 0.0000| 0.022 Peak| | 0.6439| 0.898 ---------------+--------+--------+--------- RxCan1[280] Avg| 0.00| 0.0000| 0.023 Peak| | 0.6502| 1.156 ---------------+--------+--------+--------- RxCan1[2e4] Avg| 0.00| 0.0000| 0.035 Peak| | 0.3389| 0.811 ---------------+--------+--------+--------- RxCan1[2ec] Avg| 0.00| 0.0000| 0.027 Peak| | 0.1417| 0.784 ---------------+--------+--------+--------- RxCan1[2ed] Avg| 0.00| 0.0000| 0.024 Peak| | 0.1364| 0.746 ---------------+--------+--------+--------- RxCan1[2ee] Avg| 0.00| 0.0000| 0.024 Peak| | 0.1406| 0.965 ---------------+--------+--------+--------- RxCan1[312] Avg| 0.00| 0.0000| 0.023 Peak| | 0.1293| 0.978 ---------------+--------+--------+--------- RxCan1[326] Avg| 0.00| 0.0000| 0.024 Peak| | 0.1298| 0.518 ---------------+--------+--------+--------- RxCan1[336] Avg| 0.00| 0.0000| 0.028 Peak| | 0.0106| 0.329 ---------------+--------+--------+--------- RxCan1[352] Avg| 0.00| 0.0000| 0.030 Peak| | 0.1054| 0.800 ---------------+--------+--------+--------- RxCan1[355] Avg| 0.00| 0.0000| 0.027 Peak| | 0.0270| 0.546 ---------------+--------+--------+--------- RxCan1[35e] Avg| 0.00| 0.0000| 0.023 Peak| | 0.1288| 0.573 ---------------+--------+--------+--------- RxCan1[365] Avg| 0.00| 0.0000| 0.024 Peak| | 0.1297| 0.358 ---------------+--------+--------+--------- RxCan1[366] Avg| 0.00| 0.0000| 0.026 Peak| | 0.1429| 1.001 ---------------+--------+--------+--------- RxCan1[367] Avg| 0.00| 0.0000| 0.026 Peak| | 0.1472| 0.828 ---------------+--------+--------+--------- RxCan1[368] Avg| 0.00| 0.0000| 0.024 Peak| | 0.1323| 0.931 ---------------+--------+--------+--------- RxCan1[369] Avg| 0.00| 0.0000| 0.026 Peak| | 0.1498| 1.072 ---------------+--------+--------+--------- RxCan1[380] Avg| 0.00| 0.0000| 0.022 Peak| | 0.1285| 0.348 ---------------+--------+--------+--------- RxCan1[38b] Avg| 0.00| 0.0000| 0.021 Peak| | 0.3298| 1.168 ---------------+--------+--------+--------- RxCan1[3b3] Avg| 0.00| 0.0000| 0.025 Peak| | 0.1348| 0.920 ---------------+--------+--------+--------- RxCan1[400] Avg| 0.00| 0.0000| 0.022 Peak| | 0.0481| 0.445 ---------------+--------+--------+--------- RxCan1[405] Avg| 0.00| 0.0000| 0.034 Peak| | 0.0723| 0.473 ---------------+--------+--------+--------- RxCan1[40a] Avg| 0.00| 0.0000| 0.025 Peak| | 0.1040| 0.543 ---------------+--------+--------+--------- RxCan1[410] Avg| 0.00| 0.0000| 0.024 Peak| | 0.1339| 0.678 ---------------+--------+--------+--------- RxCan1[411] Avg| 0.00| 0.0000| 0.025 Peak| | 0.1376| 0.573 ---------------+--------+--------+--------- RxCan1[416] Avg| 0.00| 0.0000| 0.023 Peak| | 0.1284| 0.346 ---------------+--------+--------+--------- RxCan1[421] Avg| 0.00| 0.0000| 0.024 Peak| | 0.1323| 0.643 ---------------+--------+--------+--------- RxCan1[42d] Avg| 0.00| 0.0000| 0.023 Peak| | 0.1362| 1.146 ---------------+--------+--------+--------- RxCan1[42f] Avg| 0.00| 0.0000| 0.027 Peak| | 0.1503| 1.762 ---------------+--------+--------+--------- RxCan1[430] Avg| 0.00| 0.0000| 0.023 Peak| | 0.1352| 0.347 ---------------+--------+--------+--------- RxCan1[434] Avg| 0.00| 0.0000| 0.024 Peak| | 0.1312| 0.580 ---------------+--------+--------+--------- RxCan1[435] Avg| 0.00| 0.0000| 0.029 Peak| | 0.1109| 1.133 ---------------+--------+--------+--------- RxCan1[43e] Avg| 0.00| 0.0000| 0.023 Peak| | 0.2776| 0.686 ---------------+--------+--------+--------- RxCan1[440] Avg| 0.00| 0.0000| 0.022 Peak| | 0.0118| 0.276 ---------------+--------+--------+--------- RxCan1[465] Avg| 0.00| 0.0000| 0.022 Peak| | 0.0118| 0.279 ---------------+--------+--------+--------- RxCan1[466] Avg| 0.00| 0.0000| 0.023 Peak| | 0.0123| 0.310 ---------------+--------+--------+--------- RxCan1[467] Avg| 0.00| 0.0000| 0.025 Peak| | 0.0132| 0.314 ---------------+--------+--------+--------- RxCan1[472] Avg| 0.00| 0.0000| 0.101 Peak| | 0.0307| 1.105 ---------------+--------+--------+--------- RxCan1[473] Avg| 0.00| 0.0000| 0.051 Peak| | 0.0107| 0.575 ---------------+--------+--------+--------- RxCan1[474] Avg| 0.00| 0.0000| 0.024 Peak| | 0.0097| 0.289 ---------------+--------+--------+--------- RxCan1[475] Avg| 0.00| 0.0000| 0.023 Peak| | 0.0220| 0.327 ---------------+--------+--------+--------- RxCan1[476] Avg| 0.00| 0.0000| 0.050 Peak| | 0.0762| 5.329 ---------------+--------+--------+--------- RxCan1[477] Avg| 0.00| 0.0000| 0.032 Peak| | 0.0283| 0.669 ---------------+--------+--------+--------- RxCan1[595] Avg| 0.00| 0.0000| 0.026 Peak| | 0.0103| 0.297 ---------------+--------+--------+--------- RxCan1[59e] Avg| 0.00| 0.0000| 0.022 Peak| | 0.0114| 0.263 ---------------+--------+--------+--------- RxCan1[5a2] Avg| 0.00| 0.0000| 0.026 Peak| | 0.0119| 0.505 ---------------+--------+--------+--------- RxCan1[5ba] Avg| 0.00| 0.0000| 0.025 Peak| | 0.0139| 0.549 ---------------+--------+--------+--------- RxCan2[020] Avg| 0.00| 0.0000| 0.026 Peak| | 0.4923| 1.133 ---------------+--------+--------+--------- RxCan2[030] Avg| 0.00| 0.0000| 0.023 Peak| | 0.3297| 1.136 ---------------+--------+--------+--------- RxCan2[03a] Avg| 0.00| 0.0000| 0.022 Peak| | 0.2792| 1.275 ---------------+--------+--------+--------- RxCan2[040] Avg| 0.00| 0.0000| 0.023 Peak| | 0.2834| 1.080 ---------------+--------+--------+--------- RxCan2[060] Avg| 0.00| 0.0000| 0.029 Peak| | 0.3037| 0.991 ---------------+--------+--------+--------- RxCan2[070] Avg| 0.00| 0.0000| 0.025 Peak| | 0.2291| 0.460 ---------------+--------+--------+--------- RxCan2[080] Avg| 0.00| 0.0000| 0.043 Peak| | 0.4015| 1.007 ---------------+--------+--------+--------- RxCan2[083] Avg| 0.00| 0.0000| 0.026 Peak| | 0.2957| 0.788 ---------------+--------+--------+--------- RxCan2[090] Avg| 0.00| 0.0000| 0.027 Peak| | 0.3951| 1.231 ---------------+--------+--------+--------- RxCan2[0a0] Avg| 0.00| 0.0000| 0.026 Peak| | 0.2560| 0.722 ---------------+--------+--------+--------- RxCan2[100] Avg| 0.00| 0.0000| 0.046 Peak| | 0.4506| 21.961 ---------------+--------+--------+--------- RxCan2[108] Avg| 0.00| 0.0000| 0.024 Peak| | 0.3713| 1.125 ---------------+--------+--------+--------- RxCan2[110] Avg| 0.00| 0.0000| 0.029 Peak| | 0.2443| 0.755 ---------------+--------+--------+--------- RxCan2[130] Avg| 0.00| 0.0000| 0.023 Peak| | 0.2052| 1.097 ---------------+--------+--------+--------- RxCan2[150] Avg| 0.00| 0.0000| 0.023 Peak| | 0.2246| 0.371 ---------------+--------+--------+--------- RxCan2[160] Avg| 0.00| 0.0000| 0.024 Peak| | 0.0755| 1.125 ---------------+--------+--------+--------- RxCan2[180] Avg| 0.00| 0.0000| 0.023 Peak| | 0.2350| 0.936 ---------------+--------+--------+--------- RxCan2[190] Avg| 0.00| 0.0000| 0.022 Peak| | 0.2275| 0.592 ---------------+--------+--------+--------- RxCan2[1a0] Avg| 0.00| 0.0000| 0.025 Peak| | 0.0125| 0.273 ---------------+--------+--------+--------- RxCan2[1a4] Avg| 0.00| 0.0000| 0.022 Peak| | 0.2806| 0.632 ---------------+--------+--------+--------- RxCan2[1a8] Avg| 0.00| 0.0000| 0.022 Peak| | 0.1683| 0.740 ---------------+--------+--------+--------- RxCan2[1b0] Avg| 0.00| 0.0000| 0.023 Peak| | 0.1360| 0.490 ---------------+--------+--------+--------- RxCan2[1b4] Avg| 0.00| 0.0000| 0.027 Peak| | 0.1556| 1.119 ---------------+--------+--------+--------- RxCan2[1b8] Avg| 0.00| 0.0000| 0.022 Peak| | 0.1704| 0.616 ---------------+--------+--------+--------- RxCan2[1c0] Avg| 0.00| 0.0000| 0.023 Peak| | 0.1317| 0.488 ---------------+--------+--------+--------- RxCan2[1e0] Avg| 0.00| 0.0000| 0.025 Peak| | 0.1460| 0.675 ---------------+--------+--------+--------- RxCan2[215] Avg| 0.00| 0.0000| 0.023 Peak| | 0.1191| 0.567 ---------------+--------+--------+--------- RxCan2[217] Avg| 0.00| 0.0000| 0.023 Peak| | 0.1167| 0.869 ---------------+--------+--------+--------- RxCan2[220] Avg| 0.00| 0.0000| 0.023 Peak| | 0.0918| 0.313 ---------------+--------+--------+--------- RxCan2[225] Avg| 0.00| 0.0000| 0.025 Peak| | 0.3635| 1.018 ---------------+--------+--------+--------- RxCan2[230] Avg| 0.00| 0.0000| 0.057 Peak| | 0.2192| 1.063 ---------------+--------+--------+--------- RxCan2[240] Avg| 0.00| 0.0000| 0.023 Peak| | 0.1173| 0.760 ---------------+--------+--------+--------- RxCan2[241] Avg| 0.00| 0.0000| 0.022 Peak| | 0.2830| 1.144 ---------------+--------+--------+--------- RxCan2[250] Avg| 0.00| 0.0000| 0.026 Peak| | 0.0701| 0.698 ---------------+--------+--------+--------- RxCan2[255] Avg| 0.00| 0.0000| 0.022 Peak| | 0.1755| 1.063 ---------------+--------+--------+--------- RxCan2[265] Avg| 0.00| 0.0000| 0.024 Peak| | 0.1771| 0.729 ---------------+--------+--------+--------- RxCan2[270] Avg| 0.00| 0.0000| 0.023 Peak| | 0.0667| 0.307 ---------------+--------+--------+--------- RxCan2[290] Avg| 0.00| 0.0000| 0.022 Peak| | 0.0410| 0.280 ---------------+--------+--------+--------- RxCan2[295] Avg| 0.00| 0.0000| 0.023 Peak| | 0.0881| 0.299 ---------------+--------+--------+--------- RxCan2[2a0] Avg| 0.00| 0.0000| 0.023 Peak| | 0.0420| 0.268 ---------------+--------+--------+--------- RxCan2[2a7] Avg| 0.00| 0.0000| 0.021 Peak| | 0.1716| 0.454 ---------------+--------+--------+--------- RxCan2[2b0] Avg| 0.00| 0.0000| 0.023 Peak| | 0.0424| 0.300 ---------------+--------+--------+--------- RxCan2[2c0] Avg| 0.00| 0.0000| 0.024 Peak| | 0.0470| 0.298 ---------------+--------+--------+--------- RxCan2[2e0] Avg| 0.00| 0.0000| 0.030 Peak| | 0.0324| 1.152 ---------------+--------+--------+--------- RxCan2[2f0] Avg| 0.00| 0.0000| 0.024 Peak| | 0.0229| 0.359 ---------------+--------+--------+--------- RxCan2[2f5] Avg| 0.00| 0.0000| 0.026 Peak| | 0.1882| 0.673 ---------------+--------+--------+--------- RxCan2[300] Avg| 0.00| 0.0000| 0.022 Peak| | 0.0186| 0.263 ---------------+--------+--------+--------- RxCan2[310] Avg| 0.00| 0.0000| 0.024 Peak| | 0.0210| 0.265 ---------------+--------+--------+--------- RxCan2[320] Avg| 0.00| 0.0000| 0.025 Peak| | 0.0207| 0.354 ---------------+--------+--------+--------- RxCan2[326] Avg| 0.00| 0.0000| 0.023 Peak| | 0.1466| 0.686 ---------------+--------+--------+--------- RxCan2[330] Avg| 0.00| 0.0000| 0.022 Peak| | 0.4580| 0.708 ---------------+--------+--------+--------- RxCan2[340] Avg| 0.00| 0.0000| 0.031 Peak| | 0.1621| 0.785 ---------------+--------+--------+--------- RxCan2[345] Avg| 0.00| 0.0000| 0.021 Peak| | 0.0199| 0.261 ---------------+--------+--------+--------- RxCan2[35e] Avg| 0.00| 0.0000| 0.023 Peak| | 0.0686| 0.449 ---------------+--------+--------+--------- RxCan2[360] Avg| 0.00| 0.0000| 0.025 Peak| | 0.0204| 0.289 ---------------+--------+--------+--------- RxCan2[361] Avg| 0.00| 0.0000| 0.022 Peak| | 0.1166| 0.316 ---------------+--------+--------+--------- RxCan2[363] Avg| 0.00| 0.0000| 0.023 Peak| | 0.0146| 0.304 ---------------+--------+--------+--------- RxCan2[370] Avg| 0.00| 0.0000| 0.024 Peak| | 0.0099| 0.278 ---------------+--------+--------+--------- RxCan2[381] Avg| 0.00| 0.0000| 0.025 Peak| | 0.0468| 0.459 ---------------+--------+--------+--------- RxCan2[3a0] Avg| 0.00| 0.0000| 0.021 Peak| | 0.2339| 0.617 ---------------+--------+--------+--------- RxCan2[3d0] Avg| 0.00| 0.0000| 0.022 Peak| | 0.1351| 0.351 ---------------+--------+--------+--------- RxCan2[3d5] Avg| 0.00| 0.0000| 0.023 Peak| | 0.0796| 0.692 ---------------+--------+--------+--------- RxCan2[400] Avg| 0.00| 0.0000| 0.023 Peak| | 0.0537| 0.307 ---------------+--------+--------+--------- RxCan2[405] Avg| 0.00| 0.0000| 0.021 Peak| | 0.0513| 0.303 ---------------+--------+--------+--------- RxCan2[40a] Avg| 0.00| 0.0000| 0.022 Peak| | 0.1099| 0.313 ---------------+--------+--------+--------- RxCan2[415] Avg| 0.00| 0.0000| 0.022 Peak| | 0.0204| 0.251 ---------------+--------+--------+--------- RxCan2[435] Avg| 0.00| 0.0000| 0.028 Peak| | 0.0113| 0.342 ---------------+--------+--------+--------- RxCan2[440] Avg| 0.00| 0.0000| 0.027 Peak| | 0.0110| 0.299 ---------------+--------+--------+--------- RxCan2[465] Avg| 0.00| 0.0000| 0.023 Peak| | 0.0122| 0.295 ---------------+--------+--------+--------- RxCan2[466] Avg| 0.00| 0.0000| 0.022 Peak| | 0.0117| 0.267 ---------------+--------+--------+--------- RxCan2[467] Avg| 0.00| 0.0000| 0.022 Peak| | 0.0164| 0.325 ---------------+--------+--------+--------- RxCan2[501] Avg| 0.00| 0.0000| 0.023 Peak| | 0.0236| 0.276 ---------------+--------+--------+--------- RxCan2[503] Avg| 0.00| 0.0000| 0.023 Peak| | 0.0248| 0.349 ---------------+--------+--------+--------- RxCan2[504] Avg| 0.00| 0.0000| 0.023 Peak| | 0.0230| 0.312 ---------------+--------+--------+--------- RxCan2[505] Avg| 0.00| 0.0000| 0.025 Peak| | 0.0256| 0.310 ---------------+--------+--------+--------- RxCan2[508] Avg| 0.00| 0.0000| 0.023 Peak| | 0.0281| 0.329 ---------------+--------+--------+--------- RxCan2[511] Avg| 0.00| 0.0000| 0.022 Peak| | 0.0232| 0.282 ---------------+--------+--------+--------- RxCan2[51e] Avg| 0.00| 0.0000| 0.023 Peak| | 0.0248| 0.298 ---------------+--------+--------+--------- RxCan2[581] Avg| 0.00| 0.0000| 0.025 Peak| | 0.0166| 0.286 ===============+========+========+========= Total Avg| 0.00| 0.0000| 43.563 At the same time, calling poller times on, poller times status causes the bus to crash, although no polls are actively being sent at all. Cheers, Simon
You may need to increase the queue size for the poll task queue. The poller still handles the bus to vehicle notifications even if it is off. Any poller logging on such an intensive load of can messages is likely to be a problem. This is part of the reason it is flagged off. The total % looks wrong :/ //.ichael On Wed, 15 Jan 2025, 03:17 Simon Ehlen via OvmsDev, < ovmsdev@lists.openvehicles.com> wrote:
Hi,
I finally got around to merging my code with the current master (previous merge february 2024). I have rebuilt my code for a Ford Focus Electric so that it uses the new OvmsPoller class.
However, I now see a lot of entries like this in my log:
I (246448) vehicle-poll: Poller[Frame]: RX Task Queue Overflow Run 8 I (246448) vehicle-poll: Poller[Frame]: RX Task Queue Overflow Run 3 I (246448) vehicle-poll: Poller[Frame]: RX Task Queue Overflow Run 1 I (246448) vehicle-poll: Poller[Frame]: RX Task Queue Overflow Run 2 I (246448) vehicle-poll: Poller[Frame]: RX Task Queue Overflow Run 1 I (246448) vehicle-poll: Poller[Frame]: RX Task Queue Overflow Run 2 I (246448) vehicle-poll: Poller[Frame]: RX Task Queue Overflow Run 1 I (246448) vehicle-poll: Poller[Frame]: RX Task Queue Overflow Run 1 I (254448) vehicle-poll: Poller[Frame]: RX Task Queue Overflow Run 24 I (254448) vehicle-poll: Poller[Frame]: RX Task Queue Overflow Run 1 I (254448) vehicle-poll: Poller[Frame]: RX Task Queue Overflow Run 1 I (254448) vehicle-poll: Poller[Frame]: RX Task Queue Overflow Run 1 I (254448) vehicle-poll: Poller[Frame]: RX Task Queue Overflow Run 1 I (254448) vehicle-poll: Poller[Frame]: RX Task Queue Overflow Run 1 I (254448) vehicle-poll: Poller[Frame]: RX Task Queue Overflow Run 1
Was this message just hidden before or do I need to make further adjustments to my code?
My code currently does not use active polling but reads on the busses (IncomingFrameCanX) on certain modules.
When I look at poller times status, it looks very extensive to me...
OVMS# poller times status Poller timing is: on Type | count | Utlztn | Time | per s | [%] | [ms] ---------------+--------+--------+--------- Poll:PRI Avg| 0.00| 0.0000| 0.003 Peak| | 0.0014| 0.041 ---------------+--------+--------+--------- RxCan1[010] Avg| 0.00| 0.0000| 0.020 Peak| | 1.2217| 1.089 ---------------+--------+--------+--------- RxCan1[030] Avg| 0.00| 0.0000| 0.024 Peak| | 1.2193| 1.241 ---------------+--------+--------+--------- RxCan1[041] Avg| 0.00| 0.0000| 0.023 Peak| | 0.6460| 1.508 ---------------+--------+--------+--------- RxCan1[049] Avg| 0.00| 0.0000| 0.024 Peak| | 0.6320| 0.630 ---------------+--------+--------+--------- RxCan1[04c] Avg| 0.00| 0.0000| 0.023 Peak| | 0.6430| 1.474 ---------------+--------+--------+--------- RxCan1[04d] Avg| 0.00| 0.0000| 0.022 Peak| | 1.2987| 1.359 ---------------+--------+--------+--------- RxCan1[076] Avg| 0.00| 0.0000| 0.072 Peak| | 0.7818| 15.221 ---------------+--------+--------+--------- RxCan1[077] Avg| 0.00| 0.0000| 0.022 Peak| | 0.6274| 0.955 ---------------+--------+--------+--------- RxCan1[07a] Avg| 0.00| 0.0000| 0.039 Peak| | 1.7602| 1.684 ---------------+--------+--------+--------- RxCan1[07d] Avg| 0.00| 0.0000| 0.023 Peak| | 0.6621| 1.913 ---------------+--------+--------+--------- RxCan1[0c8] Avg| 0.00| 0.0000| 0.026 Peak| | 0.6292| 1.412 ---------------+--------+--------+--------- RxCan1[11a] Avg| 0.00| 0.0000| 0.023 Peak| | 1.2635| 1.508 ---------------+--------+--------+--------- RxCan1[130] Avg| 0.00| 0.0000| 0.024 Peak| | 0.6548| 0.703 ---------------+--------+--------+--------- RxCan1[139] Avg| 0.00| 0.0000| 0.021 Peak| | 0.6002| 0.984 ---------------+--------+--------+--------- RxCan1[156] Avg| 0.00| 0.0000| 0.024 Peak| | 0.1225| 0.479 ---------------+--------+--------+--------- RxCan1[160] Avg| 0.00| 0.0000| 0.028 Peak| | 0.6586| 1.376 ---------------+--------+--------+--------- RxCan1[165] Avg| 0.00| 0.0000| 0.027 Peak| | 0.6368| 1.132 ---------------+--------+--------+--------- RxCan1[167] Avg| 0.00| 0.0000| 0.024 Peak| | 1.3009| 1.067 ---------------+--------+--------+--------- RxCan1[171] Avg| 0.00| 0.0000| 0.022 Peak| | 0.6590| 4.320 ---------------+--------+--------+--------- RxCan1[178] Avg| 0.00| 0.0000| 0.023 Peak| | 0.1161| 0.311 ---------------+--------+--------+--------- RxCan1[179] Avg| 0.00| 0.0000| 0.024 Peak| | 0.1236| 0.536 ---------------+--------+--------+--------- RxCan1[180] Avg| 0.00| 0.0000| 0.022 Peak| | 0.6472| 1.193 ---------------+--------+--------+--------- RxCan1[185] Avg| 0.00| 0.0000| 0.022 Peak| | 0.6777| 1.385 ---------------+--------+--------+--------- RxCan1[1a0] Avg| 0.00| 0.0000| 0.022 Peak| | 0.6486| 2.276 ---------------+--------+--------+--------- RxCan1[1e0] Avg| 0.00| 0.0000| 0.023 Peak| | 0.6725| 1.376 ---------------+--------+--------+--------- RxCan1[1e4] Avg| 0.00| 0.0000| 0.027 Peak| | 0.7370| 1.266 ---------------+--------+--------+--------- RxCan1[1f0] Avg| 0.00| 0.0000| 0.024 Peak| | 0.4253| 0.753 ---------------+--------+--------+--------- RxCan1[200] Avg| 0.00| 0.0000| 0.025 Peak| | 0.6262| 0.791 ---------------+--------+--------+--------- RxCan1[202] Avg| 0.00| 0.0000| 0.021 Peak| | 1.2915| 1.257 ---------------+--------+--------+--------- RxCan1[204] Avg| 0.00| 0.0000| 0.022 Peak| | 1.2620| 1.010 ---------------+--------+--------+--------- RxCan1[213] Avg| 0.00| 0.0000| 0.022 Peak| | 0.6331| 1.185 ---------------+--------+--------+--------- RxCan1[214] Avg| 0.00| 0.0000| 0.023 Peak| | 0.9977| 34.527 ---------------+--------+--------+--------- RxCan1[217] Avg| 0.00| 0.0000| 0.024 Peak| | 1.2825| 1.328 ---------------+--------+--------+--------- RxCan1[218] Avg| 0.00| 0.0000| 0.022 Peak| | 0.6328| 1.110 ---------------+--------+--------+--------- RxCan1[230] Avg| 0.00| 0.0000| 0.019 Peak| | 0.6742| 5.119 ---------------+--------+--------+--------- RxCan1[240] Avg| 0.00| 0.0000| 0.022 Peak| | 0.1163| 0.343 ---------------+--------+--------+--------- RxCan1[242] Avg| 0.00| 0.0000| 0.025 Peak| | 0.3501| 1.015 ---------------+--------+--------+--------- RxCan1[24a] Avg| 0.00| 0.0000| 0.022 Peak| | 0.1212| 0.338 ---------------+--------+--------+--------- RxCan1[24b] Avg| 0.00| 0.0000| 0.023 Peak| | 0.1289| 0.330 ---------------+--------+--------+--------- RxCan1[24c] Avg| 0.00| 0.0000| 0.033 Peak| | 0.1714| 1.189 ---------------+--------+--------+--------- RxCan1[25a] Avg| 0.00| 0.0000| 0.024 Peak| | 0.1289| 0.510 ---------------+--------+--------+--------- RxCan1[25b] Avg| 0.00| 0.0000| 0.022 Peak| | 0.6685| 0.930 ---------------+--------+--------+--------- RxCan1[25c] Avg| 0.00| 0.0000| 0.027 Peak| | 1.3298| 2.670 ---------------+--------+--------+--------- RxCan1[260] Avg| 0.00| 0.0000| 0.023 Peak| | 0.1271| 0.401 ---------------+--------+--------+--------- RxCan1[270] Avg| 0.00| 0.0000| 0.022 Peak| | 0.6439| 0.898 ---------------+--------+--------+--------- RxCan1[280] Avg| 0.00| 0.0000| 0.023 Peak| | 0.6502| 1.156 ---------------+--------+--------+--------- RxCan1[2e4] Avg| 0.00| 0.0000| 0.035 Peak| | 0.3389| 0.811 ---------------+--------+--------+--------- RxCan1[2ec] Avg| 0.00| 0.0000| 0.027 Peak| | 0.1417| 0.784 ---------------+--------+--------+--------- RxCan1[2ed] Avg| 0.00| 0.0000| 0.024 Peak| | 0.1364| 0.746 ---------------+--------+--------+--------- RxCan1[2ee] Avg| 0.00| 0.0000| 0.024 Peak| | 0.1406| 0.965 ---------------+--------+--------+--------- RxCan1[312] Avg| 0.00| 0.0000| 0.023 Peak| | 0.1293| 0.978 ---------------+--------+--------+--------- RxCan1[326] Avg| 0.00| 0.0000| 0.024 Peak| | 0.1298| 0.518 ---------------+--------+--------+--------- RxCan1[336] Avg| 0.00| 0.0000| 0.028 Peak| | 0.0106| 0.329 ---------------+--------+--------+--------- RxCan1[352] Avg| 0.00| 0.0000| 0.030 Peak| | 0.1054| 0.800 ---------------+--------+--------+--------- RxCan1[355] Avg| 0.00| 0.0000| 0.027 Peak| | 0.0270| 0.546 ---------------+--------+--------+--------- RxCan1[35e] Avg| 0.00| 0.0000| 0.023 Peak| | 0.1288| 0.573 ---------------+--------+--------+--------- RxCan1[365] Avg| 0.00| 0.0000| 0.024 Peak| | 0.1297| 0.358 ---------------+--------+--------+--------- RxCan1[366] Avg| 0.00| 0.0000| 0.026 Peak| | 0.1429| 1.001 ---------------+--------+--------+--------- RxCan1[367] Avg| 0.00| 0.0000| 0.026 Peak| | 0.1472| 0.828 ---------------+--------+--------+--------- RxCan1[368] Avg| 0.00| 0.0000| 0.024 Peak| | 0.1323| 0.931 ---------------+--------+--------+--------- RxCan1[369] Avg| 0.00| 0.0000| 0.026 Peak| | 0.1498| 1.072 ---------------+--------+--------+--------- RxCan1[380] Avg| 0.00| 0.0000| 0.022 Peak| | 0.1285| 0.348 ---------------+--------+--------+--------- RxCan1[38b] Avg| 0.00| 0.0000| 0.021 Peak| | 0.3298| 1.168 ---------------+--------+--------+--------- RxCan1[3b3] Avg| 0.00| 0.0000| 0.025 Peak| | 0.1348| 0.920 ---------------+--------+--------+--------- RxCan1[400] Avg| 0.00| 0.0000| 0.022 Peak| | 0.0481| 0.445 ---------------+--------+--------+--------- RxCan1[405] Avg| 0.00| 0.0000| 0.034 Peak| | 0.0723| 0.473 ---------------+--------+--------+--------- RxCan1[40a] Avg| 0.00| 0.0000| 0.025 Peak| | 0.1040| 0.543 ---------------+--------+--------+--------- RxCan1[410] Avg| 0.00| 0.0000| 0.024 Peak| | 0.1339| 0.678 ---------------+--------+--------+--------- RxCan1[411] Avg| 0.00| 0.0000| 0.025 Peak| | 0.1376| 0.573 ---------------+--------+--------+--------- RxCan1[416] Avg| 0.00| 0.0000| 0.023 Peak| | 0.1284| 0.346 ---------------+--------+--------+--------- RxCan1[421] Avg| 0.00| 0.0000| 0.024 Peak| | 0.1323| 0.643 ---------------+--------+--------+--------- RxCan1[42d] Avg| 0.00| 0.0000| 0.023 Peak| | 0.1362| 1.146 ---------------+--------+--------+--------- RxCan1[42f] Avg| 0.00| 0.0000| 0.027 Peak| | 0.1503| 1.762 ---------------+--------+--------+--------- RxCan1[430] Avg| 0.00| 0.0000| 0.023 Peak| | 0.1352| 0.347 ---------------+--------+--------+--------- RxCan1[434] Avg| 0.00| 0.0000| 0.024 Peak| | 0.1312| 0.580 ---------------+--------+--------+--------- RxCan1[435] Avg| 0.00| 0.0000| 0.029 Peak| | 0.1109| 1.133 ---------------+--------+--------+--------- RxCan1[43e] Avg| 0.00| 0.0000| 0.023 Peak| | 0.2776| 0.686 ---------------+--------+--------+--------- RxCan1[440] Avg| 0.00| 0.0000| 0.022 Peak| | 0.0118| 0.276 ---------------+--------+--------+--------- RxCan1[465] Avg| 0.00| 0.0000| 0.022 Peak| | 0.0118| 0.279 ---------------+--------+--------+--------- RxCan1[466] Avg| 0.00| 0.0000| 0.023 Peak| | 0.0123| 0.310 ---------------+--------+--------+--------- RxCan1[467] Avg| 0.00| 0.0000| 0.025 Peak| | 0.0132| 0.314 ---------------+--------+--------+--------- RxCan1[472] Avg| 0.00| 0.0000| 0.101 Peak| | 0.0307| 1.105 ---------------+--------+--------+--------- RxCan1[473] Avg| 0.00| 0.0000| 0.051 Peak| | 0.0107| 0.575 ---------------+--------+--------+--------- RxCan1[474] Avg| 0.00| 0.0000| 0.024 Peak| | 0.0097| 0.289 ---------------+--------+--------+--------- RxCan1[475] Avg| 0.00| 0.0000| 0.023 Peak| | 0.0220| 0.327 ---------------+--------+--------+--------- RxCan1[476] Avg| 0.00| 0.0000| 0.050 Peak| | 0.0762| 5.329 ---------------+--------+--------+--------- RxCan1[477] Avg| 0.00| 0.0000| 0.032 Peak| | 0.0283| 0.669 ---------------+--------+--------+--------- RxCan1[595] Avg| 0.00| 0.0000| 0.026 Peak| | 0.0103| 0.297 ---------------+--------+--------+--------- RxCan1[59e] Avg| 0.00| 0.0000| 0.022 Peak| | 0.0114| 0.263 ---------------+--------+--------+--------- RxCan1[5a2] Avg| 0.00| 0.0000| 0.026 Peak| | 0.0119| 0.505 ---------------+--------+--------+--------- RxCan1[5ba] Avg| 0.00| 0.0000| 0.025 Peak| | 0.0139| 0.549 ---------------+--------+--------+--------- RxCan2[020] Avg| 0.00| 0.0000| 0.026 Peak| | 0.4923| 1.133 ---------------+--------+--------+--------- RxCan2[030] Avg| 0.00| 0.0000| 0.023 Peak| | 0.3297| 1.136 ---------------+--------+--------+--------- RxCan2[03a] Avg| 0.00| 0.0000| 0.022 Peak| | 0.2792| 1.275 ---------------+--------+--------+--------- RxCan2[040] Avg| 0.00| 0.0000| 0.023 Peak| | 0.2834| 1.080 ---------------+--------+--------+--------- RxCan2[060] Avg| 0.00| 0.0000| 0.029 Peak| | 0.3037| 0.991 ---------------+--------+--------+--------- RxCan2[070] Avg| 0.00| 0.0000| 0.025 Peak| | 0.2291| 0.460 ---------------+--------+--------+--------- RxCan2[080] Avg| 0.00| 0.0000| 0.043 Peak| | 0.4015| 1.007 ---------------+--------+--------+--------- RxCan2[083] Avg| 0.00| 0.0000| 0.026 Peak| | 0.2957| 0.788 ---------------+--------+--------+--------- RxCan2[090] Avg| 0.00| 0.0000| 0.027 Peak| | 0.3951| 1.231 ---------------+--------+--------+--------- RxCan2[0a0] Avg| 0.00| 0.0000| 0.026 Peak| | 0.2560| 0.722 ---------------+--------+--------+--------- RxCan2[100] Avg| 0.00| 0.0000| 0.046 Peak| | 0.4506| 21.961 ---------------+--------+--------+--------- RxCan2[108] Avg| 0.00| 0.0000| 0.024 Peak| | 0.3713| 1.125 ---------------+--------+--------+--------- RxCan2[110] Avg| 0.00| 0.0000| 0.029 Peak| | 0.2443| 0.755 ---------------+--------+--------+--------- RxCan2[130] Avg| 0.00| 0.0000| 0.023 Peak| | 0.2052| 1.097 ---------------+--------+--------+--------- RxCan2[150] Avg| 0.00| 0.0000| 0.023 Peak| | 0.2246| 0.371 ---------------+--------+--------+--------- RxCan2[160] Avg| 0.00| 0.0000| 0.024 Peak| | 0.0755| 1.125 ---------------+--------+--------+--------- RxCan2[180] Avg| 0.00| 0.0000| 0.023 Peak| | 0.2350| 0.936 ---------------+--------+--------+--------- RxCan2[190] Avg| 0.00| 0.0000| 0.022 Peak| | 0.2275| 0.592 ---------------+--------+--------+--------- RxCan2[1a0] Avg| 0.00| 0.0000| 0.025 Peak| | 0.0125| 0.273 ---------------+--------+--------+--------- RxCan2[1a4] Avg| 0.00| 0.0000| 0.022 Peak| | 0.2806| 0.632 ---------------+--------+--------+--------- RxCan2[1a8] Avg| 0.00| 0.0000| 0.022 Peak| | 0.1683| 0.740 ---------------+--------+--------+--------- RxCan2[1b0] Avg| 0.00| 0.0000| 0.023 Peak| | 0.1360| 0.490 ---------------+--------+--------+--------- RxCan2[1b4] Avg| 0.00| 0.0000| 0.027 Peak| | 0.1556| 1.119 ---------------+--------+--------+--------- RxCan2[1b8] Avg| 0.00| 0.0000| 0.022 Peak| | 0.1704| 0.616 ---------------+--------+--------+--------- RxCan2[1c0] Avg| 0.00| 0.0000| 0.023 Peak| | 0.1317| 0.488 ---------------+--------+--------+--------- RxCan2[1e0] Avg| 0.00| 0.0000| 0.025 Peak| | 0.1460| 0.675 ---------------+--------+--------+--------- RxCan2[215] Avg| 0.00| 0.0000| 0.023 Peak| | 0.1191| 0.567 ---------------+--------+--------+--------- RxCan2[217] Avg| 0.00| 0.0000| 0.023 Peak| | 0.1167| 0.869 ---------------+--------+--------+--------- RxCan2[220] Avg| 0.00| 0.0000| 0.023 Peak| | 0.0918| 0.313 ---------------+--------+--------+--------- RxCan2[225] Avg| 0.00| 0.0000| 0.025 Peak| | 0.3635| 1.018 ---------------+--------+--------+--------- RxCan2[230] Avg| 0.00| 0.0000| 0.057 Peak| | 0.2192| 1.063 ---------------+--------+--------+--------- RxCan2[240] Avg| 0.00| 0.0000| 0.023 Peak| | 0.1173| 0.760 ---------------+--------+--------+--------- RxCan2[241] Avg| 0.00| 0.0000| 0.022 Peak| | 0.2830| 1.144 ---------------+--------+--------+--------- RxCan2[250] Avg| 0.00| 0.0000| 0.026 Peak| | 0.0701| 0.698 ---------------+--------+--------+--------- RxCan2[255] Avg| 0.00| 0.0000| 0.022 Peak| | 0.1755| 1.063 ---------------+--------+--------+--------- RxCan2[265] Avg| 0.00| 0.0000| 0.024 Peak| | 0.1771| 0.729 ---------------+--------+--------+--------- RxCan2[270] Avg| 0.00| 0.0000| 0.023 Peak| | 0.0667| 0.307 ---------------+--------+--------+--------- RxCan2[290] Avg| 0.00| 0.0000| 0.022 Peak| | 0.0410| 0.280 ---------------+--------+--------+--------- RxCan2[295] Avg| 0.00| 0.0000| 0.023 Peak| | 0.0881| 0.299 ---------------+--------+--------+--------- RxCan2[2a0] Avg| 0.00| 0.0000| 0.023 Peak| | 0.0420| 0.268 ---------------+--------+--------+--------- RxCan2[2a7] Avg| 0.00| 0.0000| 0.021 Peak| | 0.1716| 0.454 ---------------+--------+--------+--------- RxCan2[2b0] Avg| 0.00| 0.0000| 0.023 Peak| | 0.0424| 0.300 ---------------+--------+--------+--------- RxCan2[2c0] Avg| 0.00| 0.0000| 0.024 Peak| | 0.0470| 0.298 ---------------+--------+--------+--------- RxCan2[2e0] Avg| 0.00| 0.0000| 0.030 Peak| | 0.0324| 1.152 ---------------+--------+--------+--------- RxCan2[2f0] Avg| 0.00| 0.0000| 0.024 Peak| | 0.0229| 0.359 ---------------+--------+--------+--------- RxCan2[2f5] Avg| 0.00| 0.0000| 0.026 Peak| | 0.1882| 0.673 ---------------+--------+--------+--------- RxCan2[300] Avg| 0.00| 0.0000| 0.022 Peak| | 0.0186| 0.263 ---------------+--------+--------+--------- RxCan2[310] Avg| 0.00| 0.0000| 0.024 Peak| | 0.0210| 0.265 ---------------+--------+--------+--------- RxCan2[320] Avg| 0.00| 0.0000| 0.025 Peak| | 0.0207| 0.354 ---------------+--------+--------+--------- RxCan2[326] Avg| 0.00| 0.0000| 0.023 Peak| | 0.1466| 0.686 ---------------+--------+--------+--------- RxCan2[330] Avg| 0.00| 0.0000| 0.022 Peak| | 0.4580| 0.708 ---------------+--------+--------+--------- RxCan2[340] Avg| 0.00| 0.0000| 0.031 Peak| | 0.1621| 0.785 ---------------+--------+--------+--------- RxCan2[345] Avg| 0.00| 0.0000| 0.021 Peak| | 0.0199| 0.261 ---------------+--------+--------+--------- RxCan2[35e] Avg| 0.00| 0.0000| 0.023 Peak| | 0.0686| 0.449 ---------------+--------+--------+--------- RxCan2[360] Avg| 0.00| 0.0000| 0.025 Peak| | 0.0204| 0.289 ---------------+--------+--------+--------- RxCan2[361] Avg| 0.00| 0.0000| 0.022 Peak| | 0.1166| 0.316 ---------------+--------+--------+--------- RxCan2[363] Avg| 0.00| 0.0000| 0.023 Peak| | 0.0146| 0.304 ---------------+--------+--------+--------- RxCan2[370] Avg| 0.00| 0.0000| 0.024 Peak| | 0.0099| 0.278 ---------------+--------+--------+--------- RxCan2[381] Avg| 0.00| 0.0000| 0.025 Peak| | 0.0468| 0.459 ---------------+--------+--------+--------- RxCan2[3a0] Avg| 0.00| 0.0000| 0.021 Peak| | 0.2339| 0.617 ---------------+--------+--------+--------- RxCan2[3d0] Avg| 0.00| 0.0000| 0.022 Peak| | 0.1351| 0.351 ---------------+--------+--------+--------- RxCan2[3d5] Avg| 0.00| 0.0000| 0.023 Peak| | 0.0796| 0.692 ---------------+--------+--------+--------- RxCan2[400] Avg| 0.00| 0.0000| 0.023 Peak| | 0.0537| 0.307 ---------------+--------+--------+--------- RxCan2[405] Avg| 0.00| 0.0000| 0.021 Peak| | 0.0513| 0.303 ---------------+--------+--------+--------- RxCan2[40a] Avg| 0.00| 0.0000| 0.022 Peak| | 0.1099| 0.313 ---------------+--------+--------+--------- RxCan2[415] Avg| 0.00| 0.0000| 0.022 Peak| | 0.0204| 0.251 ---------------+--------+--------+--------- RxCan2[435] Avg| 0.00| 0.0000| 0.028 Peak| | 0.0113| 0.342 ---------------+--------+--------+--------- RxCan2[440] Avg| 0.00| 0.0000| 0.027 Peak| | 0.0110| 0.299 ---------------+--------+--------+--------- RxCan2[465] Avg| 0.00| 0.0000| 0.023 Peak| | 0.0122| 0.295 ---------------+--------+--------+--------- RxCan2[466] Avg| 0.00| 0.0000| 0.022 Peak| | 0.0117| 0.267 ---------------+--------+--------+--------- RxCan2[467] Avg| 0.00| 0.0000| 0.022 Peak| | 0.0164| 0.325 ---------------+--------+--------+--------- RxCan2[501] Avg| 0.00| 0.0000| 0.023 Peak| | 0.0236| 0.276 ---------------+--------+--------+--------- RxCan2[503] Avg| 0.00| 0.0000| 0.023 Peak| | 0.0248| 0.349 ---------------+--------+--------+--------- RxCan2[504] Avg| 0.00| 0.0000| 0.023 Peak| | 0.0230| 0.312 ---------------+--------+--------+--------- RxCan2[505] Avg| 0.00| 0.0000| 0.025 Peak| | 0.0256| 0.310 ---------------+--------+--------+--------- RxCan2[508] Avg| 0.00| 0.0000| 0.023 Peak| | 0.0281| 0.329 ---------------+--------+--------+--------- RxCan2[511] Avg| 0.00| 0.0000| 0.022 Peak| | 0.0232| 0.282 ---------------+--------+--------+--------- RxCan2[51e] Avg| 0.00| 0.0000| 0.023 Peak| | 0.0248| 0.298 ---------------+--------+--------+--------- RxCan2[581] Avg| 0.00| 0.0000| 0.025 Peak| | 0.0166| 0.286 ===============+========+========+========= Total Avg| 0.00| 0.0000| 43.563
At the same time, calling poller times on, poller times status causes the bus to crash, although no polls are actively being sent at all.
Cheers, Simon _______________________________________________ OvmsDev mailing list OvmsDev@lists.openvehicles.com http://lists.openvehicles.com/mailman/listinfo/ovmsdev
But what is the reason that a read access to the bus can cause the bus to crash? This is not critical during charging, it just aborts the charging process with an error. While driving, this results in a “stop safely now” error message on the dashboard and the engine is switched off immediately. Cheers, Simon Am 14.01.2025 um 23:22 schrieb Michael Geddes via OvmsDev:
You may need to increase the queue size for the poll task queue.
The poller still handles the bus to vehicle notifications even if it is off.
Any poller logging on such an intensive load of can messages is likely to be a problem. This is part of the reason it is flagged off.
The total % looks wrong :/
//.ichael
On Wed, 15 Jan 2025, 03:17 Simon Ehlen via OvmsDev, <ovmsdev@lists.openvehicles.com> wrote:
Hi,
I finally got around to merging my code with the current master (previous merge february 2024). I have rebuilt my code for a Ford Focus Electric so that it uses the new OvmsPoller class.
However, I now see a lot of entries like this in my log:
I (246448) vehicle-poll: Poller[Frame]: RX Task Queue Overflow Run 8 I (246448) vehicle-poll: Poller[Frame]: RX Task Queue Overflow Run 3 I (246448) vehicle-poll: Poller[Frame]: RX Task Queue Overflow Run 1 I (246448) vehicle-poll: Poller[Frame]: RX Task Queue Overflow Run 2 I (246448) vehicle-poll: Poller[Frame]: RX Task Queue Overflow Run 1 I (246448) vehicle-poll: Poller[Frame]: RX Task Queue Overflow Run 2 I (246448) vehicle-poll: Poller[Frame]: RX Task Queue Overflow Run 1 I (246448) vehicle-poll: Poller[Frame]: RX Task Queue Overflow Run 1 I (254448) vehicle-poll: Poller[Frame]: RX Task Queue Overflow Run 24 I (254448) vehicle-poll: Poller[Frame]: RX Task Queue Overflow Run 1 I (254448) vehicle-poll: Poller[Frame]: RX Task Queue Overflow Run 1 I (254448) vehicle-poll: Poller[Frame]: RX Task Queue Overflow Run 1 I (254448) vehicle-poll: Poller[Frame]: RX Task Queue Overflow Run 1 I (254448) vehicle-poll: Poller[Frame]: RX Task Queue Overflow Run 1 I (254448) vehicle-poll: Poller[Frame]: RX Task Queue Overflow Run 1
Was this message just hidden before or do I need to make further adjustments to my code?
My code currently does not use active polling but reads on the busses (IncomingFrameCanX) on certain modules.
When I look at poller times status, it looks very extensive to me...
OVMS# poller times status Poller timing is: on Type | count | Utlztn | Time | per s | [%] | [ms] ---------------+--------+--------+--------- Poll:PRI Avg| 0.00| 0.0000| 0.003 Peak| | 0.0014| 0.041 ---------------+--------+--------+--------- RxCan1[010] Avg| 0.00| 0.0000| 0.020 Peak| | 1.2217| 1.089 ---------------+--------+--------+--------- RxCan1[030] Avg| 0.00| 0.0000| 0.024 Peak| | 1.2193| 1.241 ---------------+--------+--------+--------- RxCan1[041] Avg| 0.00| 0.0000| 0.023 Peak| | 0.6460| 1.508 ---------------+--------+--------+--------- RxCan1[049] Avg| 0.00| 0.0000| 0.024 Peak| | 0.6320| 0.630 ---------------+--------+--------+--------- RxCan1[04c] Avg| 0.00| 0.0000| 0.023 Peak| | 0.6430| 1.474 ---------------+--------+--------+--------- RxCan1[04d] Avg| 0.00| 0.0000| 0.022 Peak| | 1.2987| 1.359 ---------------+--------+--------+--------- RxCan1[076] Avg| 0.00| 0.0000| 0.072 Peak| | 0.7818| 15.221 ---------------+--------+--------+--------- RxCan1[077] Avg| 0.00| 0.0000| 0.022 Peak| | 0.6274| 0.955 ---------------+--------+--------+--------- RxCan1[07a] Avg| 0.00| 0.0000| 0.039 Peak| | 1.7602| 1.684 ---------------+--------+--------+--------- RxCan1[07d] Avg| 0.00| 0.0000| 0.023 Peak| | 0.6621| 1.913 ---------------+--------+--------+--------- RxCan1[0c8] Avg| 0.00| 0.0000| 0.026 Peak| | 0.6292| 1.412 ---------------+--------+--------+--------- RxCan1[11a] Avg| 0.00| 0.0000| 0.023 Peak| | 1.2635| 1.508 ---------------+--------+--------+--------- RxCan1[130] Avg| 0.00| 0.0000| 0.024 Peak| | 0.6548| 0.703 ---------------+--------+--------+--------- RxCan1[139] Avg| 0.00| 0.0000| 0.021 Peak| | 0.6002| 0.984 ---------------+--------+--------+--------- RxCan1[156] Avg| 0.00| 0.0000| 0.024 Peak| | 0.1225| 0.479 ---------------+--------+--------+--------- RxCan1[160] Avg| 0.00| 0.0000| 0.028 Peak| | 0.6586| 1.376 ---------------+--------+--------+--------- RxCan1[165] Avg| 0.00| 0.0000| 0.027 Peak| | 0.6368| 1.132 ---------------+--------+--------+--------- RxCan1[167] Avg| 0.00| 0.0000| 0.024 Peak| | 1.3009| 1.067 ---------------+--------+--------+--------- RxCan1[171] Avg| 0.00| 0.0000| 0.022 Peak| | 0.6590| 4.320 ---------------+--------+--------+--------- RxCan1[178] Avg| 0.00| 0.0000| 0.023 Peak| | 0.1161| 0.311 ---------------+--------+--------+--------- RxCan1[179] Avg| 0.00| 0.0000| 0.024 Peak| | 0.1236| 0.536 ---------------+--------+--------+--------- RxCan1[180] Avg| 0.00| 0.0000| 0.022 Peak| | 0.6472| 1.193 ---------------+--------+--------+--------- RxCan1[185] Avg| 0.00| 0.0000| 0.022 Peak| | 0.6777| 1.385 ---------------+--------+--------+--------- RxCan1[1a0] Avg| 0.00| 0.0000| 0.022 Peak| | 0.6486| 2.276 ---------------+--------+--------+--------- RxCan1[1e0] Avg| 0.00| 0.0000| 0.023 Peak| | 0.6725| 1.376 ---------------+--------+--------+--------- RxCan1[1e4] Avg| 0.00| 0.0000| 0.027 Peak| | 0.7370| 1.266 ---------------+--------+--------+--------- RxCan1[1f0] Avg| 0.00| 0.0000| 0.024 Peak| | 0.4253| 0.753 ---------------+--------+--------+--------- RxCan1[200] Avg| 0.00| 0.0000| 0.025 Peak| | 0.6262| 0.791 ---------------+--------+--------+--------- RxCan1[202] Avg| 0.00| 0.0000| 0.021 Peak| | 1.2915| 1.257 ---------------+--------+--------+--------- RxCan1[204] Avg| 0.00| 0.0000| 0.022 Peak| | 1.2620| 1.010 ---------------+--------+--------+--------- RxCan1[213] Avg| 0.00| 0.0000| 0.022 Peak| | 0.6331| 1.185 ---------------+--------+--------+--------- RxCan1[214] Avg| 0.00| 0.0000| 0.023 Peak| | 0.9977| 34.527 ---------------+--------+--------+--------- RxCan1[217] Avg| 0.00| 0.0000| 0.024 Peak| | 1.2825| 1.328 ---------------+--------+--------+--------- RxCan1[218] Avg| 0.00| 0.0000| 0.022 Peak| | 0.6328| 1.110 ---------------+--------+--------+--------- RxCan1[230] Avg| 0.00| 0.0000| 0.019 Peak| | 0.6742| 5.119 ---------------+--------+--------+--------- RxCan1[240] Avg| 0.00| 0.0000| 0.022 Peak| | 0.1163| 0.343 ---------------+--------+--------+--------- RxCan1[242] Avg| 0.00| 0.0000| 0.025 Peak| | 0.3501| 1.015 ---------------+--------+--------+--------- RxCan1[24a] Avg| 0.00| 0.0000| 0.022 Peak| | 0.1212| 0.338 ---------------+--------+--------+--------- RxCan1[24b] Avg| 0.00| 0.0000| 0.023 Peak| | 0.1289| 0.330 ---------------+--------+--------+--------- RxCan1[24c] Avg| 0.00| 0.0000| 0.033 Peak| | 0.1714| 1.189 ---------------+--------+--------+--------- RxCan1[25a] Avg| 0.00| 0.0000| 0.024 Peak| | 0.1289| 0.510 ---------------+--------+--------+--------- RxCan1[25b] Avg| 0.00| 0.0000| 0.022 Peak| | 0.6685| 0.930 ---------------+--------+--------+--------- RxCan1[25c] Avg| 0.00| 0.0000| 0.027 Peak| | 1.3298| 2.670 ---------------+--------+--------+--------- RxCan1[260] Avg| 0.00| 0.0000| 0.023 Peak| | 0.1271| 0.401 ---------------+--------+--------+--------- RxCan1[270] Avg| 0.00| 0.0000| 0.022 Peak| | 0.6439| 0.898 ---------------+--------+--------+--------- RxCan1[280] Avg| 0.00| 0.0000| 0.023 Peak| | 0.6502| 1.156 ---------------+--------+--------+--------- RxCan1[2e4] Avg| 0.00| 0.0000| 0.035 Peak| | 0.3389| 0.811 ---------------+--------+--------+--------- RxCan1[2ec] Avg| 0.00| 0.0000| 0.027 Peak| | 0.1417| 0.784 ---------------+--------+--------+--------- RxCan1[2ed] Avg| 0.00| 0.0000| 0.024 Peak| | 0.1364| 0.746 ---------------+--------+--------+--------- RxCan1[2ee] Avg| 0.00| 0.0000| 0.024 Peak| | 0.1406| 0.965 ---------------+--------+--------+--------- RxCan1[312] Avg| 0.00| 0.0000| 0.023 Peak| | 0.1293| 0.978 ---------------+--------+--------+--------- RxCan1[326] Avg| 0.00| 0.0000| 0.024 Peak| | 0.1298| 0.518 ---------------+--------+--------+--------- RxCan1[336] Avg| 0.00| 0.0000| 0.028 Peak| | 0.0106| 0.329 ---------------+--------+--------+--------- RxCan1[352] Avg| 0.00| 0.0000| 0.030 Peak| | 0.1054| 0.800 ---------------+--------+--------+--------- RxCan1[355] Avg| 0.00| 0.0000| 0.027 Peak| | 0.0270| 0.546 ---------------+--------+--------+--------- RxCan1[35e] Avg| 0.00| 0.0000| 0.023 Peak| | 0.1288| 0.573 ---------------+--------+--------+--------- RxCan1[365] Avg| 0.00| 0.0000| 0.024 Peak| | 0.1297| 0.358 ---------------+--------+--------+--------- RxCan1[366] Avg| 0.00| 0.0000| 0.026 Peak| | 0.1429| 1.001 ---------------+--------+--------+--------- RxCan1[367] Avg| 0.00| 0.0000| 0.026 Peak| | 0.1472| 0.828 ---------------+--------+--------+--------- RxCan1[368] Avg| 0.00| 0.0000| 0.024 Peak| | 0.1323| 0.931 ---------------+--------+--------+--------- RxCan1[369] Avg| 0.00| 0.0000| 0.026 Peak| | 0.1498| 1.072 ---------------+--------+--------+--------- RxCan1[380] Avg| 0.00| 0.0000| 0.022 Peak| | 0.1285| 0.348 ---------------+--------+--------+--------- RxCan1[38b] Avg| 0.00| 0.0000| 0.021 Peak| | 0.3298| 1.168 ---------------+--------+--------+--------- RxCan1[3b3] Avg| 0.00| 0.0000| 0.025 Peak| | 0.1348| 0.920 ---------------+--------+--------+--------- RxCan1[400] Avg| 0.00| 0.0000| 0.022 Peak| | 0.0481| 0.445 ---------------+--------+--------+--------- RxCan1[405] Avg| 0.00| 0.0000| 0.034 Peak| | 0.0723| 0.473 ---------------+--------+--------+--------- RxCan1[40a] Avg| 0.00| 0.0000| 0.025 Peak| | 0.1040| 0.543 ---------------+--------+--------+--------- RxCan1[410] Avg| 0.00| 0.0000| 0.024 Peak| | 0.1339| 0.678 ---------------+--------+--------+--------- RxCan1[411] Avg| 0.00| 0.0000| 0.025 Peak| | 0.1376| 0.573 ---------------+--------+--------+--------- RxCan1[416] Avg| 0.00| 0.0000| 0.023 Peak| | 0.1284| 0.346 ---------------+--------+--------+--------- RxCan1[421] Avg| 0.00| 0.0000| 0.024 Peak| | 0.1323| 0.643 ---------------+--------+--------+--------- RxCan1[42d] Avg| 0.00| 0.0000| 0.023 Peak| | 0.1362| 1.146 ---------------+--------+--------+--------- RxCan1[42f] Avg| 0.00| 0.0000| 0.027 Peak| | 0.1503| 1.762 ---------------+--------+--------+--------- RxCan1[430] Avg| 0.00| 0.0000| 0.023 Peak| | 0.1352| 0.347 ---------------+--------+--------+--------- RxCan1[434] Avg| 0.00| 0.0000| 0.024 Peak| | 0.1312| 0.580 ---------------+--------+--------+--------- RxCan1[435] Avg| 0.00| 0.0000| 0.029 Peak| | 0.1109| 1.133 ---------------+--------+--------+--------- RxCan1[43e] Avg| 0.00| 0.0000| 0.023 Peak| | 0.2776| 0.686 ---------------+--------+--------+--------- RxCan1[440] Avg| 0.00| 0.0000| 0.022 Peak| | 0.0118| 0.276 ---------------+--------+--------+--------- RxCan1[465] Avg| 0.00| 0.0000| 0.022 Peak| | 0.0118| 0.279 ---------------+--------+--------+--------- RxCan1[466] Avg| 0.00| 0.0000| 0.023 Peak| | 0.0123| 0.310 ---------------+--------+--------+--------- RxCan1[467] Avg| 0.00| 0.0000| 0.025 Peak| | 0.0132| 0.314 ---------------+--------+--------+--------- RxCan1[472] Avg| 0.00| 0.0000| 0.101 Peak| | 0.0307| 1.105 ---------------+--------+--------+--------- RxCan1[473] Avg| 0.00| 0.0000| 0.051 Peak| | 0.0107| 0.575 ---------------+--------+--------+--------- RxCan1[474] Avg| 0.00| 0.0000| 0.024 Peak| | 0.0097| 0.289 ---------------+--------+--------+--------- RxCan1[475] Avg| 0.00| 0.0000| 0.023 Peak| | 0.0220| 0.327 ---------------+--------+--------+--------- RxCan1[476] Avg| 0.00| 0.0000| 0.050 Peak| | 0.0762| 5.329 ---------------+--------+--------+--------- RxCan1[477] Avg| 0.00| 0.0000| 0.032 Peak| | 0.0283| 0.669 ---------------+--------+--------+--------- RxCan1[595] Avg| 0.00| 0.0000| 0.026 Peak| | 0.0103| 0.297 ---------------+--------+--------+--------- RxCan1[59e] Avg| 0.00| 0.0000| 0.022 Peak| | 0.0114| 0.263 ---------------+--------+--------+--------- RxCan1[5a2] Avg| 0.00| 0.0000| 0.026 Peak| | 0.0119| 0.505 ---------------+--------+--------+--------- RxCan1[5ba] Avg| 0.00| 0.0000| 0.025 Peak| | 0.0139| 0.549 ---------------+--------+--------+--------- RxCan2[020] Avg| 0.00| 0.0000| 0.026 Peak| | 0.4923| 1.133 ---------------+--------+--------+--------- RxCan2[030] Avg| 0.00| 0.0000| 0.023 Peak| | 0.3297| 1.136 ---------------+--------+--------+--------- RxCan2[03a] Avg| 0.00| 0.0000| 0.022 Peak| | 0.2792| 1.275 ---------------+--------+--------+--------- RxCan2[040] Avg| 0.00| 0.0000| 0.023 Peak| | 0.2834| 1.080 ---------------+--------+--------+--------- RxCan2[060] Avg| 0.00| 0.0000| 0.029 Peak| | 0.3037| 0.991 ---------------+--------+--------+--------- RxCan2[070] Avg| 0.00| 0.0000| 0.025 Peak| | 0.2291| 0.460 ---------------+--------+--------+--------- RxCan2[080] Avg| 0.00| 0.0000| 0.043 Peak| | 0.4015| 1.007 ---------------+--------+--------+--------- RxCan2[083] Avg| 0.00| 0.0000| 0.026 Peak| | 0.2957| 0.788 ---------------+--------+--------+--------- RxCan2[090] Avg| 0.00| 0.0000| 0.027 Peak| | 0.3951| 1.231 ---------------+--------+--------+--------- RxCan2[0a0] Avg| 0.00| 0.0000| 0.026 Peak| | 0.2560| 0.722 ---------------+--------+--------+--------- RxCan2[100] Avg| 0.00| 0.0000| 0.046 Peak| | 0.4506| 21.961 ---------------+--------+--------+--------- RxCan2[108] Avg| 0.00| 0.0000| 0.024 Peak| | 0.3713| 1.125 ---------------+--------+--------+--------- RxCan2[110] Avg| 0.00| 0.0000| 0.029 Peak| | 0.2443| 0.755 ---------------+--------+--------+--------- RxCan2[130] Avg| 0.00| 0.0000| 0.023 Peak| | 0.2052| 1.097 ---------------+--------+--------+--------- RxCan2[150] Avg| 0.00| 0.0000| 0.023 Peak| | 0.2246| 0.371 ---------------+--------+--------+--------- RxCan2[160] Avg| 0.00| 0.0000| 0.024 Peak| | 0.0755| 1.125 ---------------+--------+--------+--------- RxCan2[180] Avg| 0.00| 0.0000| 0.023 Peak| | 0.2350| 0.936 ---------------+--------+--------+--------- RxCan2[190] Avg| 0.00| 0.0000| 0.022 Peak| | 0.2275| 0.592 ---------------+--------+--------+--------- RxCan2[1a0] Avg| 0.00| 0.0000| 0.025 Peak| | 0.0125| 0.273 ---------------+--------+--------+--------- RxCan2[1a4] Avg| 0.00| 0.0000| 0.022 Peak| | 0.2806| 0.632 ---------------+--------+--------+--------- RxCan2[1a8] Avg| 0.00| 0.0000| 0.022 Peak| | 0.1683| 0.740 ---------------+--------+--------+--------- RxCan2[1b0] Avg| 0.00| 0.0000| 0.023 Peak| | 0.1360| 0.490 ---------------+--------+--------+--------- RxCan2[1b4] Avg| 0.00| 0.0000| 0.027 Peak| | 0.1556| 1.119 ---------------+--------+--------+--------- RxCan2[1b8] Avg| 0.00| 0.0000| 0.022 Peak| | 0.1704| 0.616 ---------------+--------+--------+--------- RxCan2[1c0] Avg| 0.00| 0.0000| 0.023 Peak| | 0.1317| 0.488 ---------------+--------+--------+--------- RxCan2[1e0] Avg| 0.00| 0.0000| 0.025 Peak| | 0.1460| 0.675 ---------------+--------+--------+--------- RxCan2[215] Avg| 0.00| 0.0000| 0.023 Peak| | 0.1191| 0.567 ---------------+--------+--------+--------- RxCan2[217] Avg| 0.00| 0.0000| 0.023 Peak| | 0.1167| 0.869 ---------------+--------+--------+--------- RxCan2[220] Avg| 0.00| 0.0000| 0.023 Peak| | 0.0918| 0.313 ---------------+--------+--------+--------- RxCan2[225] Avg| 0.00| 0.0000| 0.025 Peak| | 0.3635| 1.018 ---------------+--------+--------+--------- RxCan2[230] Avg| 0.00| 0.0000| 0.057 Peak| | 0.2192| 1.063 ---------------+--------+--------+--------- RxCan2[240] Avg| 0.00| 0.0000| 0.023 Peak| | 0.1173| 0.760 ---------------+--------+--------+--------- RxCan2[241] Avg| 0.00| 0.0000| 0.022 Peak| | 0.2830| 1.144 ---------------+--------+--------+--------- RxCan2[250] Avg| 0.00| 0.0000| 0.026 Peak| | 0.0701| 0.698 ---------------+--------+--------+--------- RxCan2[255] Avg| 0.00| 0.0000| 0.022 Peak| | 0.1755| 1.063 ---------------+--------+--------+--------- RxCan2[265] Avg| 0.00| 0.0000| 0.024 Peak| | 0.1771| 0.729 ---------------+--------+--------+--------- RxCan2[270] Avg| 0.00| 0.0000| 0.023 Peak| | 0.0667| 0.307 ---------------+--------+--------+--------- RxCan2[290] Avg| 0.00| 0.0000| 0.022 Peak| | 0.0410| 0.280 ---------------+--------+--------+--------- RxCan2[295] Avg| 0.00| 0.0000| 0.023 Peak| | 0.0881| 0.299 ---------------+--------+--------+--------- RxCan2[2a0] Avg| 0.00| 0.0000| 0.023 Peak| | 0.0420| 0.268 ---------------+--------+--------+--------- RxCan2[2a7] Avg| 0.00| 0.0000| 0.021 Peak| | 0.1716| 0.454 ---------------+--------+--------+--------- RxCan2[2b0] Avg| 0.00| 0.0000| 0.023 Peak| | 0.0424| 0.300 ---------------+--------+--------+--------- RxCan2[2c0] Avg| 0.00| 0.0000| 0.024 Peak| | 0.0470| 0.298 ---------------+--------+--------+--------- RxCan2[2e0] Avg| 0.00| 0.0000| 0.030 Peak| | 0.0324| 1.152 ---------------+--------+--------+--------- RxCan2[2f0] Avg| 0.00| 0.0000| 0.024 Peak| | 0.0229| 0.359 ---------------+--------+--------+--------- RxCan2[2f5] Avg| 0.00| 0.0000| 0.026 Peak| | 0.1882| 0.673 ---------------+--------+--------+--------- RxCan2[300] Avg| 0.00| 0.0000| 0.022 Peak| | 0.0186| 0.263 ---------------+--------+--------+--------- RxCan2[310] Avg| 0.00| 0.0000| 0.024 Peak| | 0.0210| 0.265 ---------------+--------+--------+--------- RxCan2[320] Avg| 0.00| 0.0000| 0.025 Peak| | 0.0207| 0.354 ---------------+--------+--------+--------- RxCan2[326] Avg| 0.00| 0.0000| 0.023 Peak| | 0.1466| 0.686 ---------------+--------+--------+--------- RxCan2[330] Avg| 0.00| 0.0000| 0.022 Peak| | 0.4580| 0.708 ---------------+--------+--------+--------- RxCan2[340] Avg| 0.00| 0.0000| 0.031 Peak| | 0.1621| 0.785 ---------------+--------+--------+--------- RxCan2[345] Avg| 0.00| 0.0000| 0.021 Peak| | 0.0199| 0.261 ---------------+--------+--------+--------- RxCan2[35e] Avg| 0.00| 0.0000| 0.023 Peak| | 0.0686| 0.449 ---------------+--------+--------+--------- RxCan2[360] Avg| 0.00| 0.0000| 0.025 Peak| | 0.0204| 0.289 ---------------+--------+--------+--------- RxCan2[361] Avg| 0.00| 0.0000| 0.022 Peak| | 0.1166| 0.316 ---------------+--------+--------+--------- RxCan2[363] Avg| 0.00| 0.0000| 0.023 Peak| | 0.0146| 0.304 ---------------+--------+--------+--------- RxCan2[370] Avg| 0.00| 0.0000| 0.024 Peak| | 0.0099| 0.278 ---------------+--------+--------+--------- RxCan2[381] Avg| 0.00| 0.0000| 0.025 Peak| | 0.0468| 0.459 ---------------+--------+--------+--------- RxCan2[3a0] Avg| 0.00| 0.0000| 0.021 Peak| | 0.2339| 0.617 ---------------+--------+--------+--------- RxCan2[3d0] Avg| 0.00| 0.0000| 0.022 Peak| | 0.1351| 0.351 ---------------+--------+--------+--------- RxCan2[3d5] Avg| 0.00| 0.0000| 0.023 Peak| | 0.0796| 0.692 ---------------+--------+--------+--------- RxCan2[400] Avg| 0.00| 0.0000| 0.023 Peak| | 0.0537| 0.307 ---------------+--------+--------+--------- RxCan2[405] Avg| 0.00| 0.0000| 0.021 Peak| | 0.0513| 0.303 ---------------+--------+--------+--------- RxCan2[40a] Avg| 0.00| 0.0000| 0.022 Peak| | 0.1099| 0.313 ---------------+--------+--------+--------- RxCan2[415] Avg| 0.00| 0.0000| 0.022 Peak| | 0.0204| 0.251 ---------------+--------+--------+--------- RxCan2[435] Avg| 0.00| 0.0000| 0.028 Peak| | 0.0113| 0.342 ---------------+--------+--------+--------- RxCan2[440] Avg| 0.00| 0.0000| 0.027 Peak| | 0.0110| 0.299 ---------------+--------+--------+--------- RxCan2[465] Avg| 0.00| 0.0000| 0.023 Peak| | 0.0122| 0.295 ---------------+--------+--------+--------- RxCan2[466] Avg| 0.00| 0.0000| 0.022 Peak| | 0.0117| 0.267 ---------------+--------+--------+--------- RxCan2[467] Avg| 0.00| 0.0000| 0.022 Peak| | 0.0164| 0.325 ---------------+--------+--------+--------- RxCan2[501] Avg| 0.00| 0.0000| 0.023 Peak| | 0.0236| 0.276 ---------------+--------+--------+--------- RxCan2[503] Avg| 0.00| 0.0000| 0.023 Peak| | 0.0248| 0.349 ---------------+--------+--------+--------- RxCan2[504] Avg| 0.00| 0.0000| 0.023 Peak| | 0.0230| 0.312 ---------------+--------+--------+--------- RxCan2[505] Avg| 0.00| 0.0000| 0.025 Peak| | 0.0256| 0.310 ---------------+--------+--------+--------- RxCan2[508] Avg| 0.00| 0.0000| 0.023 Peak| | 0.0281| 0.329 ---------------+--------+--------+--------- RxCan2[511] Avg| 0.00| 0.0000| 0.022 Peak| | 0.0232| 0.282 ---------------+--------+--------+--------- RxCan2[51e] Avg| 0.00| 0.0000| 0.023 Peak| | 0.0248| 0.298 ---------------+--------+--------+--------- RxCan2[581] Avg| 0.00| 0.0000| 0.025 Peak| | 0.0166| 0.286 ===============+========+========+========= Total Avg| 0.00| 0.0000| 43.563
At the same time, calling poller times on, poller times status causes the bus to crash, although no polls are actively being sent at all.
Cheers, Simon _______________________________________________ OvmsDev mailing list OvmsDev@lists.openvehicles.com http://lists.openvehicles.com/mailman/listinfo/ovmsdev
_______________________________________________ OvmsDev mailing list OvmsDev@lists.openvehicles.com http://lists.openvehicles.com/mailman/listinfo/ovmsdev
Ohhh. That's bad. Are you seeing a bus reset coming through? Maybe someone else more familiar with the hardware and bus mechanisms might help. Michael. On Wed, 15 Jan 2025, 06:31 Simon Ehlen via OvmsDev, < ovmsdev@lists.openvehicles.com> wrote:
But what is the reason that a read access to the bus can cause the bus to crash? This is not critical during charging, it just aborts the charging process with an error. While driving, this results in a “stop safely now” error message on the dashboard and the engine is switched off immediately.
Cheers, Simon
Am 14.01.2025 um 23:22 schrieb Michael Geddes via OvmsDev:
You may need to increase the queue size for the poll task queue.
The poller still handles the bus to vehicle notifications even if it is off.
Any poller logging on such an intensive load of can messages is likely to be a problem. This is part of the reason it is flagged off.
The total % looks wrong :/
//.ichael
On Wed, 15 Jan 2025, 03:17 Simon Ehlen via OvmsDev, < ovmsdev@lists.openvehicles.com> wrote:
Hi,
I finally got around to merging my code with the current master (previous merge february 2024). I have rebuilt my code for a Ford Focus Electric so that it uses the new OvmsPoller class.
However, I now see a lot of entries like this in my log:
I (246448) vehicle-poll: Poller[Frame]: RX Task Queue Overflow Run 8 I (246448) vehicle-poll: Poller[Frame]: RX Task Queue Overflow Run 3 I (246448) vehicle-poll: Poller[Frame]: RX Task Queue Overflow Run 1 I (246448) vehicle-poll: Poller[Frame]: RX Task Queue Overflow Run 2 I (246448) vehicle-poll: Poller[Frame]: RX Task Queue Overflow Run 1 I (246448) vehicle-poll: Poller[Frame]: RX Task Queue Overflow Run 2 I (246448) vehicle-poll: Poller[Frame]: RX Task Queue Overflow Run 1 I (246448) vehicle-poll: Poller[Frame]: RX Task Queue Overflow Run 1 I (254448) vehicle-poll: Poller[Frame]: RX Task Queue Overflow Run 24 I (254448) vehicle-poll: Poller[Frame]: RX Task Queue Overflow Run 1 I (254448) vehicle-poll: Poller[Frame]: RX Task Queue Overflow Run 1 I (254448) vehicle-poll: Poller[Frame]: RX Task Queue Overflow Run 1 I (254448) vehicle-poll: Poller[Frame]: RX Task Queue Overflow Run 1 I (254448) vehicle-poll: Poller[Frame]: RX Task Queue Overflow Run 1 I (254448) vehicle-poll: Poller[Frame]: RX Task Queue Overflow Run 1
Was this message just hidden before or do I need to make further adjustments to my code?
My code currently does not use active polling but reads on the busses (IncomingFrameCanX) on certain modules.
When I look at poller times status, it looks very extensive to me...
OVMS# poller times status Poller timing is: on Type | count | Utlztn | Time | per s | [%] | [ms] ---------------+--------+--------+--------- Poll:PRI Avg| 0.00| 0.0000| 0.003 Peak| | 0.0014| 0.041 ---------------+--------+--------+--------- RxCan1[010] Avg| 0.00| 0.0000| 0.020 Peak| | 1.2217| 1.089 ---------------+--------+--------+--------- RxCan1[030] Avg| 0.00| 0.0000| 0.024 Peak| | 1.2193| 1.241 ---------------+--------+--------+--------- RxCan1[041] Avg| 0.00| 0.0000| 0.023 Peak| | 0.6460| 1.508 ---------------+--------+--------+--------- RxCan1[049] Avg| 0.00| 0.0000| 0.024 Peak| | 0.6320| 0.630 ---------------+--------+--------+--------- RxCan1[04c] Avg| 0.00| 0.0000| 0.023 Peak| | 0.6430| 1.474 ---------------+--------+--------+--------- RxCan1[04d] Avg| 0.00| 0.0000| 0.022 Peak| | 1.2987| 1.359 ---------------+--------+--------+--------- RxCan1[076] Avg| 0.00| 0.0000| 0.072 Peak| | 0.7818| 15.221 ---------------+--------+--------+--------- RxCan1[077] Avg| 0.00| 0.0000| 0.022 Peak| | 0.6274| 0.955 ---------------+--------+--------+--------- RxCan1[07a] Avg| 0.00| 0.0000| 0.039 Peak| | 1.7602| 1.684 ---------------+--------+--------+--------- RxCan1[07d] Avg| 0.00| 0.0000| 0.023 Peak| | 0.6621| 1.913 ---------------+--------+--------+--------- RxCan1[0c8] Avg| 0.00| 0.0000| 0.026 Peak| | 0.6292| 1.412 ---------------+--------+--------+--------- RxCan1[11a] Avg| 0.00| 0.0000| 0.023 Peak| | 1.2635| 1.508 ---------------+--------+--------+--------- RxCan1[130] Avg| 0.00| 0.0000| 0.024 Peak| | 0.6548| 0.703 ---------------+--------+--------+--------- RxCan1[139] Avg| 0.00| 0.0000| 0.021 Peak| | 0.6002| 0.984 ---------------+--------+--------+--------- RxCan1[156] Avg| 0.00| 0.0000| 0.024 Peak| | 0.1225| 0.479 ---------------+--------+--------+--------- RxCan1[160] Avg| 0.00| 0.0000| 0.028 Peak| | 0.6586| 1.376 ---------------+--------+--------+--------- RxCan1[165] Avg| 0.00| 0.0000| 0.027 Peak| | 0.6368| 1.132 ---------------+--------+--------+--------- RxCan1[167] Avg| 0.00| 0.0000| 0.024 Peak| | 1.3009| 1.067 ---------------+--------+--------+--------- RxCan1[171] Avg| 0.00| 0.0000| 0.022 Peak| | 0.6590| 4.320 ---------------+--------+--------+--------- RxCan1[178] Avg| 0.00| 0.0000| 0.023 Peak| | 0.1161| 0.311 ---------------+--------+--------+--------- RxCan1[179] Avg| 0.00| 0.0000| 0.024 Peak| | 0.1236| 0.536 ---------------+--------+--------+--------- RxCan1[180] Avg| 0.00| 0.0000| 0.022 Peak| | 0.6472| 1.193 ---------------+--------+--------+--------- RxCan1[185] Avg| 0.00| 0.0000| 0.022 Peak| | 0.6777| 1.385 ---------------+--------+--------+--------- RxCan1[1a0] Avg| 0.00| 0.0000| 0.022 Peak| | 0.6486| 2.276 ---------------+--------+--------+--------- RxCan1[1e0] Avg| 0.00| 0.0000| 0.023 Peak| | 0.6725| 1.376 ---------------+--------+--------+--------- RxCan1[1e4] Avg| 0.00| 0.0000| 0.027 Peak| | 0.7370| 1.266 ---------------+--------+--------+--------- RxCan1[1f0] Avg| 0.00| 0.0000| 0.024 Peak| | 0.4253| 0.753 ---------------+--------+--------+--------- RxCan1[200] Avg| 0.00| 0.0000| 0.025 Peak| | 0.6262| 0.791 ---------------+--------+--------+--------- RxCan1[202] Avg| 0.00| 0.0000| 0.021 Peak| | 1.2915| 1.257 ---------------+--------+--------+--------- RxCan1[204] Avg| 0.00| 0.0000| 0.022 Peak| | 1.2620| 1.010 ---------------+--------+--------+--------- RxCan1[213] Avg| 0.00| 0.0000| 0.022 Peak| | 0.6331| 1.185 ---------------+--------+--------+--------- RxCan1[214] Avg| 0.00| 0.0000| 0.023 Peak| | 0.9977| 34.527 ---------------+--------+--------+--------- RxCan1[217] Avg| 0.00| 0.0000| 0.024 Peak| | 1.2825| 1.328 ---------------+--------+--------+--------- RxCan1[218] Avg| 0.00| 0.0000| 0.022 Peak| | 0.6328| 1.110 ---------------+--------+--------+--------- RxCan1[230] Avg| 0.00| 0.0000| 0.019 Peak| | 0.6742| 5.119 ---------------+--------+--------+--------- RxCan1[240] Avg| 0.00| 0.0000| 0.022 Peak| | 0.1163| 0.343 ---------------+--------+--------+--------- RxCan1[242] Avg| 0.00| 0.0000| 0.025 Peak| | 0.3501| 1.015 ---------------+--------+--------+--------- RxCan1[24a] Avg| 0.00| 0.0000| 0.022 Peak| | 0.1212| 0.338 ---------------+--------+--------+--------- RxCan1[24b] Avg| 0.00| 0.0000| 0.023 Peak| | 0.1289| 0.330 ---------------+--------+--------+--------- RxCan1[24c] Avg| 0.00| 0.0000| 0.033 Peak| | 0.1714| 1.189 ---------------+--------+--------+--------- RxCan1[25a] Avg| 0.00| 0.0000| 0.024 Peak| | 0.1289| 0.510 ---------------+--------+--------+--------- RxCan1[25b] Avg| 0.00| 0.0000| 0.022 Peak| | 0.6685| 0.930 ---------------+--------+--------+--------- RxCan1[25c] Avg| 0.00| 0.0000| 0.027 Peak| | 1.3298| 2.670 ---------------+--------+--------+--------- RxCan1[260] Avg| 0.00| 0.0000| 0.023 Peak| | 0.1271| 0.401 ---------------+--------+--------+--------- RxCan1[270] Avg| 0.00| 0.0000| 0.022 Peak| | 0.6439| 0.898 ---------------+--------+--------+--------- RxCan1[280] Avg| 0.00| 0.0000| 0.023 Peak| | 0.6502| 1.156 ---------------+--------+--------+--------- RxCan1[2e4] Avg| 0.00| 0.0000| 0.035 Peak| | 0.3389| 0.811 ---------------+--------+--------+--------- RxCan1[2ec] Avg| 0.00| 0.0000| 0.027 Peak| | 0.1417| 0.784 ---------------+--------+--------+--------- RxCan1[2ed] Avg| 0.00| 0.0000| 0.024 Peak| | 0.1364| 0.746 ---------------+--------+--------+--------- RxCan1[2ee] Avg| 0.00| 0.0000| 0.024 Peak| | 0.1406| 0.965 ---------------+--------+--------+--------- RxCan1[312] Avg| 0.00| 0.0000| 0.023 Peak| | 0.1293| 0.978 ---------------+--------+--------+--------- RxCan1[326] Avg| 0.00| 0.0000| 0.024 Peak| | 0.1298| 0.518 ---------------+--------+--------+--------- RxCan1[336] Avg| 0.00| 0.0000| 0.028 Peak| | 0.0106| 0.329 ---------------+--------+--------+--------- RxCan1[352] Avg| 0.00| 0.0000| 0.030 Peak| | 0.1054| 0.800 ---------------+--------+--------+--------- RxCan1[355] Avg| 0.00| 0.0000| 0.027 Peak| | 0.0270| 0.546 ---------------+--------+--------+--------- RxCan1[35e] Avg| 0.00| 0.0000| 0.023 Peak| | 0.1288| 0.573 ---------------+--------+--------+--------- RxCan1[365] Avg| 0.00| 0.0000| 0.024 Peak| | 0.1297| 0.358 ---------------+--------+--------+--------- RxCan1[366] Avg| 0.00| 0.0000| 0.026 Peak| | 0.1429| 1.001 ---------------+--------+--------+--------- RxCan1[367] Avg| 0.00| 0.0000| 0.026 Peak| | 0.1472| 0.828 ---------------+--------+--------+--------- RxCan1[368] Avg| 0.00| 0.0000| 0.024 Peak| | 0.1323| 0.931 ---------------+--------+--------+--------- RxCan1[369] Avg| 0.00| 0.0000| 0.026 Peak| | 0.1498| 1.072 ---------------+--------+--------+--------- RxCan1[380] Avg| 0.00| 0.0000| 0.022 Peak| | 0.1285| 0.348 ---------------+--------+--------+--------- RxCan1[38b] Avg| 0.00| 0.0000| 0.021 Peak| | 0.3298| 1.168 ---------------+--------+--------+--------- RxCan1[3b3] Avg| 0.00| 0.0000| 0.025 Peak| | 0.1348| 0.920 ---------------+--------+--------+--------- RxCan1[400] Avg| 0.00| 0.0000| 0.022 Peak| | 0.0481| 0.445 ---------------+--------+--------+--------- RxCan1[405] Avg| 0.00| 0.0000| 0.034 Peak| | 0.0723| 0.473 ---------------+--------+--------+--------- RxCan1[40a] Avg| 0.00| 0.0000| 0.025 Peak| | 0.1040| 0.543 ---------------+--------+--------+--------- RxCan1[410] Avg| 0.00| 0.0000| 0.024 Peak| | 0.1339| 0.678 ---------------+--------+--------+--------- RxCan1[411] Avg| 0.00| 0.0000| 0.025 Peak| | 0.1376| 0.573 ---------------+--------+--------+--------- RxCan1[416] Avg| 0.00| 0.0000| 0.023 Peak| | 0.1284| 0.346 ---------------+--------+--------+--------- RxCan1[421] Avg| 0.00| 0.0000| 0.024 Peak| | 0.1323| 0.643 ---------------+--------+--------+--------- RxCan1[42d] Avg| 0.00| 0.0000| 0.023 Peak| | 0.1362| 1.146 ---------------+--------+--------+--------- RxCan1[42f] Avg| 0.00| 0.0000| 0.027 Peak| | 0.1503| 1.762 ---------------+--------+--------+--------- RxCan1[430] Avg| 0.00| 0.0000| 0.023 Peak| | 0.1352| 0.347 ---------------+--------+--------+--------- RxCan1[434] Avg| 0.00| 0.0000| 0.024 Peak| | 0.1312| 0.580 ---------------+--------+--------+--------- RxCan1[435] Avg| 0.00| 0.0000| 0.029 Peak| | 0.1109| 1.133 ---------------+--------+--------+--------- RxCan1[43e] Avg| 0.00| 0.0000| 0.023 Peak| | 0.2776| 0.686 ---------------+--------+--------+--------- RxCan1[440] Avg| 0.00| 0.0000| 0.022 Peak| | 0.0118| 0.276 ---------------+--------+--------+--------- RxCan1[465] Avg| 0.00| 0.0000| 0.022 Peak| | 0.0118| 0.279 ---------------+--------+--------+--------- RxCan1[466] Avg| 0.00| 0.0000| 0.023 Peak| | 0.0123| 0.310 ---------------+--------+--------+--------- RxCan1[467] Avg| 0.00| 0.0000| 0.025 Peak| | 0.0132| 0.314 ---------------+--------+--------+--------- RxCan1[472] Avg| 0.00| 0.0000| 0.101 Peak| | 0.0307| 1.105 ---------------+--------+--------+--------- RxCan1[473] Avg| 0.00| 0.0000| 0.051 Peak| | 0.0107| 0.575 ---------------+--------+--------+--------- RxCan1[474] Avg| 0.00| 0.0000| 0.024 Peak| | 0.0097| 0.289 ---------------+--------+--------+--------- RxCan1[475] Avg| 0.00| 0.0000| 0.023 Peak| | 0.0220| 0.327 ---------------+--------+--------+--------- RxCan1[476] Avg| 0.00| 0.0000| 0.050 Peak| | 0.0762| 5.329 ---------------+--------+--------+--------- RxCan1[477] Avg| 0.00| 0.0000| 0.032 Peak| | 0.0283| 0.669 ---------------+--------+--------+--------- RxCan1[595] Avg| 0.00| 0.0000| 0.026 Peak| | 0.0103| 0.297 ---------------+--------+--------+--------- RxCan1[59e] Avg| 0.00| 0.0000| 0.022 Peak| | 0.0114| 0.263 ---------------+--------+--------+--------- RxCan1[5a2] Avg| 0.00| 0.0000| 0.026 Peak| | 0.0119| 0.505 ---------------+--------+--------+--------- RxCan1[5ba] Avg| 0.00| 0.0000| 0.025 Peak| | 0.0139| 0.549 ---------------+--------+--------+--------- RxCan2[020] Avg| 0.00| 0.0000| 0.026 Peak| | 0.4923| 1.133 ---------------+--------+--------+--------- RxCan2[030] Avg| 0.00| 0.0000| 0.023 Peak| | 0.3297| 1.136 ---------------+--------+--------+--------- RxCan2[03a] Avg| 0.00| 0.0000| 0.022 Peak| | 0.2792| 1.275 ---------------+--------+--------+--------- RxCan2[040] Avg| 0.00| 0.0000| 0.023 Peak| | 0.2834| 1.080 ---------------+--------+--------+--------- RxCan2[060] Avg| 0.00| 0.0000| 0.029 Peak| | 0.3037| 0.991 ---------------+--------+--------+--------- RxCan2[070] Avg| 0.00| 0.0000| 0.025 Peak| | 0.2291| 0.460 ---------------+--------+--------+--------- RxCan2[080] Avg| 0.00| 0.0000| 0.043 Peak| | 0.4015| 1.007 ---------------+--------+--------+--------- RxCan2[083] Avg| 0.00| 0.0000| 0.026 Peak| | 0.2957| 0.788 ---------------+--------+--------+--------- RxCan2[090] Avg| 0.00| 0.0000| 0.027 Peak| | 0.3951| 1.231 ---------------+--------+--------+--------- RxCan2[0a0] Avg| 0.00| 0.0000| 0.026 Peak| | 0.2560| 0.722 ---------------+--------+--------+--------- RxCan2[100] Avg| 0.00| 0.0000| 0.046 Peak| | 0.4506| 21.961 ---------------+--------+--------+--------- RxCan2[108] Avg| 0.00| 0.0000| 0.024 Peak| | 0.3713| 1.125 ---------------+--------+--------+--------- RxCan2[110] Avg| 0.00| 0.0000| 0.029 Peak| | 0.2443| 0.755 ---------------+--------+--------+--------- RxCan2[130] Avg| 0.00| 0.0000| 0.023 Peak| | 0.2052| 1.097 ---------------+--------+--------+--------- RxCan2[150] Avg| 0.00| 0.0000| 0.023 Peak| | 0.2246| 0.371 ---------------+--------+--------+--------- RxCan2[160] Avg| 0.00| 0.0000| 0.024 Peak| | 0.0755| 1.125 ---------------+--------+--------+--------- RxCan2[180] Avg| 0.00| 0.0000| 0.023 Peak| | 0.2350| 0.936 ---------------+--------+--------+--------- RxCan2[190] Avg| 0.00| 0.0000| 0.022 Peak| | 0.2275| 0.592 ---------------+--------+--------+--------- RxCan2[1a0] Avg| 0.00| 0.0000| 0.025 Peak| | 0.0125| 0.273 ---------------+--------+--------+--------- RxCan2[1a4] Avg| 0.00| 0.0000| 0.022 Peak| | 0.2806| 0.632 ---------------+--------+--------+--------- RxCan2[1a8] Avg| 0.00| 0.0000| 0.022 Peak| | 0.1683| 0.740 ---------------+--------+--------+--------- RxCan2[1b0] Avg| 0.00| 0.0000| 0.023 Peak| | 0.1360| 0.490 ---------------+--------+--------+--------- RxCan2[1b4] Avg| 0.00| 0.0000| 0.027 Peak| | 0.1556| 1.119 ---------------+--------+--------+--------- RxCan2[1b8] Avg| 0.00| 0.0000| 0.022 Peak| | 0.1704| 0.616 ---------------+--------+--------+--------- RxCan2[1c0] Avg| 0.00| 0.0000| 0.023 Peak| | 0.1317| 0.488 ---------------+--------+--------+--------- RxCan2[1e0] Avg| 0.00| 0.0000| 0.025 Peak| | 0.1460| 0.675 ---------------+--------+--------+--------- RxCan2[215] Avg| 0.00| 0.0000| 0.023 Peak| | 0.1191| 0.567 ---------------+--------+--------+--------- RxCan2[217] Avg| 0.00| 0.0000| 0.023 Peak| | 0.1167| 0.869 ---------------+--------+--------+--------- RxCan2[220] Avg| 0.00| 0.0000| 0.023 Peak| | 0.0918| 0.313 ---------------+--------+--------+--------- RxCan2[225] Avg| 0.00| 0.0000| 0.025 Peak| | 0.3635| 1.018 ---------------+--------+--------+--------- RxCan2[230] Avg| 0.00| 0.0000| 0.057 Peak| | 0.2192| 1.063 ---------------+--------+--------+--------- RxCan2[240] Avg| 0.00| 0.0000| 0.023 Peak| | 0.1173| 0.760 ---------------+--------+--------+--------- RxCan2[241] Avg| 0.00| 0.0000| 0.022 Peak| | 0.2830| 1.144 ---------------+--------+--------+--------- RxCan2[250] Avg| 0.00| 0.0000| 0.026 Peak| | 0.0701| 0.698 ---------------+--------+--------+--------- RxCan2[255] Avg| 0.00| 0.0000| 0.022 Peak| | 0.1755| 1.063 ---------------+--------+--------+--------- RxCan2[265] Avg| 0.00| 0.0000| 0.024 Peak| | 0.1771| 0.729 ---------------+--------+--------+--------- RxCan2[270] Avg| 0.00| 0.0000| 0.023 Peak| | 0.0667| 0.307 ---------------+--------+--------+--------- RxCan2[290] Avg| 0.00| 0.0000| 0.022 Peak| | 0.0410| 0.280 ---------------+--------+--------+--------- RxCan2[295] Avg| 0.00| 0.0000| 0.023 Peak| | 0.0881| 0.299 ---------------+--------+--------+--------- RxCan2[2a0] Avg| 0.00| 0.0000| 0.023 Peak| | 0.0420| 0.268 ---------------+--------+--------+--------- RxCan2[2a7] Avg| 0.00| 0.0000| 0.021 Peak| | 0.1716| 0.454 ---------------+--------+--------+--------- RxCan2[2b0] Avg| 0.00| 0.0000| 0.023 Peak| | 0.0424| 0.300 ---------------+--------+--------+--------- RxCan2[2c0] Avg| 0.00| 0.0000| 0.024 Peak| | 0.0470| 0.298 ---------------+--------+--------+--------- RxCan2[2e0] Avg| 0.00| 0.0000| 0.030 Peak| | 0.0324| 1.152 ---------------+--------+--------+--------- RxCan2[2f0] Avg| 0.00| 0.0000| 0.024 Peak| | 0.0229| 0.359 ---------------+--------+--------+--------- RxCan2[2f5] Avg| 0.00| 0.0000| 0.026 Peak| | 0.1882| 0.673 ---------------+--------+--------+--------- RxCan2[300] Avg| 0.00| 0.0000| 0.022 Peak| | 0.0186| 0.263 ---------------+--------+--------+--------- RxCan2[310] Avg| 0.00| 0.0000| 0.024 Peak| | 0.0210| 0.265 ---------------+--------+--------+--------- RxCan2[320] Avg| 0.00| 0.0000| 0.025 Peak| | 0.0207| 0.354 ---------------+--------+--------+--------- RxCan2[326] Avg| 0.00| 0.0000| 0.023 Peak| | 0.1466| 0.686 ---------------+--------+--------+--------- RxCan2[330] Avg| 0.00| 0.0000| 0.022 Peak| | 0.4580| 0.708 ---------------+--------+--------+--------- RxCan2[340] Avg| 0.00| 0.0000| 0.031 Peak| | 0.1621| 0.785 ---------------+--------+--------+--------- RxCan2[345] Avg| 0.00| 0.0000| 0.021 Peak| | 0.0199| 0.261 ---------------+--------+--------+--------- RxCan2[35e] Avg| 0.00| 0.0000| 0.023 Peak| | 0.0686| 0.449 ---------------+--------+--------+--------- RxCan2[360] Avg| 0.00| 0.0000| 0.025 Peak| | 0.0204| 0.289 ---------------+--------+--------+--------- RxCan2[361] Avg| 0.00| 0.0000| 0.022 Peak| | 0.1166| 0.316 ---------------+--------+--------+--------- RxCan2[363] Avg| 0.00| 0.0000| 0.023 Peak| | 0.0146| 0.304 ---------------+--------+--------+--------- RxCan2[370] Avg| 0.00| 0.0000| 0.024 Peak| | 0.0099| 0.278 ---------------+--------+--------+--------- RxCan2[381] Avg| 0.00| 0.0000| 0.025 Peak| | 0.0468| 0.459 ---------------+--------+--------+--------- RxCan2[3a0] Avg| 0.00| 0.0000| 0.021 Peak| | 0.2339| 0.617 ---------------+--------+--------+--------- RxCan2[3d0] Avg| 0.00| 0.0000| 0.022 Peak| | 0.1351| 0.351 ---------------+--------+--------+--------- RxCan2[3d5] Avg| 0.00| 0.0000| 0.023 Peak| | 0.0796| 0.692 ---------------+--------+--------+--------- RxCan2[400] Avg| 0.00| 0.0000| 0.023 Peak| | 0.0537| 0.307 ---------------+--------+--------+--------- RxCan2[405] Avg| 0.00| 0.0000| 0.021 Peak| | 0.0513| 0.303 ---------------+--------+--------+--------- RxCan2[40a] Avg| 0.00| 0.0000| 0.022 Peak| | 0.1099| 0.313 ---------------+--------+--------+--------- RxCan2[415] Avg| 0.00| 0.0000| 0.022 Peak| | 0.0204| 0.251 ---------------+--------+--------+--------- RxCan2[435] Avg| 0.00| 0.0000| 0.028 Peak| | 0.0113| 0.342 ---------------+--------+--------+--------- RxCan2[440] Avg| 0.00| 0.0000| 0.027 Peak| | 0.0110| 0.299 ---------------+--------+--------+--------- RxCan2[465] Avg| 0.00| 0.0000| 0.023 Peak| | 0.0122| 0.295 ---------------+--------+--------+--------- RxCan2[466] Avg| 0.00| 0.0000| 0.022 Peak| | 0.0117| 0.267 ---------------+--------+--------+--------- RxCan2[467] Avg| 0.00| 0.0000| 0.022 Peak| | 0.0164| 0.325 ---------------+--------+--------+--------- RxCan2[501] Avg| 0.00| 0.0000| 0.023 Peak| | 0.0236| 0.276 ---------------+--------+--------+--------- RxCan2[503] Avg| 0.00| 0.0000| 0.023 Peak| | 0.0248| 0.349 ---------------+--------+--------+--------- RxCan2[504] Avg| 0.00| 0.0000| 0.023 Peak| | 0.0230| 0.312 ---------------+--------+--------+--------- RxCan2[505] Avg| 0.00| 0.0000| 0.025 Peak| | 0.0256| 0.310 ---------------+--------+--------+--------- RxCan2[508] Avg| 0.00| 0.0000| 0.023 Peak| | 0.0281| 0.329 ---------------+--------+--------+--------- RxCan2[511] Avg| 0.00| 0.0000| 0.022 Peak| | 0.0232| 0.282 ---------------+--------+--------+--------- RxCan2[51e] Avg| 0.00| 0.0000| 0.023 Peak| | 0.0248| 0.298 ---------------+--------+--------+--------- RxCan2[581] Avg| 0.00| 0.0000| 0.025 Peak| | 0.0166| 0.286 ===============+========+========+========= Total Avg| 0.00| 0.0000| 43.563
At the same time, calling poller times on, poller times status causes the bus to crash, although no polls are actively being sent at all.
Cheers, Simon _______________________________________________ OvmsDev mailing list OvmsDev@lists.openvehicles.com http://lists.openvehicles.com/mailman/listinfo/ovmsdev
_______________________________________________ OvmsDev mailing listOvmsDev@lists.openvehicles.comhttp://lists.openvehicles.com/mailman/listinfo/ovmsdev
_______________________________________________ OvmsDev mailing list OvmsDev@lists.openvehicles.com http://lists.openvehicles.com/mailman/listinfo/ovmsdev

Note sure if this helps, but some comments: Remember than CAN protocol in normal mode is an ‘active’ protocol. Nodes on the bus are actively acknowledging messages (and that includes OVMS), even if they never write messages. So in normal mode there is no absolute ‘read access’. For example, opening the CAN port at the wrong baud rate, even if not writing messages, will mess up the bus. However, if you open the CAN port in ‘listen’ mode, then it is truly read-only. In that mode it will not acknowledge messages, and cannot write on the bus at all. I’ve never seen an OVMS mess up a bus in listen mode, even if the baud rate is wrong. I think the only way for that to happen would be a hardware layer issue (cabling, termination, etc). Regards, Mark.
On 15 Jan 2025, at 6:30 AM, Simon Ehlen via OvmsDev <ovmsdev@lists.openvehicles.com> wrote:
But what is the reason that a read access to the bus can cause the bus to crash? This is not critical during charging, it just aborts the charging process with an error. While driving, this results in a “stop safely now” error message on the dashboard and the engine is switched off immediately.
Cheers, Simon
Am 14.01.2025 um 23:22 schrieb Michael Geddes via OvmsDev:
You may need to increase the queue size for the poll task queue.
The poller still handles the bus to vehicle notifications even if it is off.
Any poller logging on such an intensive load of can messages is likely to be a problem. This is part of the reason it is flagged off.
The total % looks wrong :/
//.ichael
On Wed, 15 Jan 2025, 03:17 Simon Ehlen via OvmsDev, <ovmsdev@lists.openvehicles.com <mailto:ovmsdev@lists.openvehicles.com>> wrote:
Hi,
I finally got around to merging my code with the current master (previous merge february 2024). I have rebuilt my code for a Ford Focus Electric so that it uses the new OvmsPoller class.
However, I now see a lot of entries like this in my log:
I (246448) vehicle-poll: Poller[Frame]: RX Task Queue Overflow Run 8 I (246448) vehicle-poll: Poller[Frame]: RX Task Queue Overflow Run 3 I (246448) vehicle-poll: Poller[Frame]: RX Task Queue Overflow Run 1 I (246448) vehicle-poll: Poller[Frame]: RX Task Queue Overflow Run 2 I (246448) vehicle-poll: Poller[Frame]: RX Task Queue Overflow Run 1 I (246448) vehicle-poll: Poller[Frame]: RX Task Queue Overflow Run 2 I (246448) vehicle-poll: Poller[Frame]: RX Task Queue Overflow Run 1 I (246448) vehicle-poll: Poller[Frame]: RX Task Queue Overflow Run 1 I (254448) vehicle-poll: Poller[Frame]: RX Task Queue Overflow Run 24 I (254448) vehicle-poll: Poller[Frame]: RX Task Queue Overflow Run 1 I (254448) vehicle-poll: Poller[Frame]: RX Task Queue Overflow Run 1 I (254448) vehicle-poll: Poller[Frame]: RX Task Queue Overflow Run 1 I (254448) vehicle-poll: Poller[Frame]: RX Task Queue Overflow Run 1 I (254448) vehicle-poll: Poller[Frame]: RX Task Queue Overflow Run 1 I (254448) vehicle-poll: Poller[Frame]: RX Task Queue Overflow Run 1
Was this message just hidden before or do I need to make further adjustments to my code?
My code currently does not use active polling but reads on the busses (IncomingFrameCanX) on certain modules.
When I look at poller times status, it looks very extensive to me...
OVMS# poller times status Poller timing is: on Type | count | Utlztn | Time | per s | [%] | [ms] ---------------+--------+--------+--------- Poll:PRI Avg| 0.00| 0.0000| 0.003 Peak| | 0.0014| 0.041 ---------------+--------+--------+--------- RxCan1[010] Avg| 0.00| 0.0000| 0.020 Peak| | 1.2217| 1.089 ---------------+--------+--------+--------- RxCan1[030] Avg| 0.00| 0.0000| 0.024 Peak| | 1.2193| 1.241 ---------------+--------+--------+--------- RxCan1[041] Avg| 0.00| 0.0000| 0.023 Peak| | 0.6460| 1.508 ---------------+--------+--------+--------- RxCan1[049] Avg| 0.00| 0.0000| 0.024 Peak| | 0.6320| 0.630 ---------------+--------+--------+--------- RxCan1[04c] Avg| 0.00| 0.0000| 0.023 Peak| | 0.6430| 1.474 ---------------+--------+--------+--------- RxCan1[04d] Avg| 0.00| 0.0000| 0.022 Peak| | 1.2987| 1.359 ---------------+--------+--------+--------- RxCan1[076] Avg| 0.00| 0.0000| 0.072 Peak| | 0.7818| 15.221 ---------------+--------+--------+--------- RxCan1[077] Avg| 0.00| 0.0000| 0.022 Peak| | 0.6274| 0.955 ---------------+--------+--------+--------- RxCan1[07a] Avg| 0.00| 0.0000| 0.039 Peak| | 1.7602| 1.684 ---------------+--------+--------+--------- RxCan1[07d] Avg| 0.00| 0.0000| 0.023 Peak| | 0.6621| 1.913 ---------------+--------+--------+--------- RxCan1[0c8] Avg| 0.00| 0.0000| 0.026 Peak| | 0.6292| 1.412 ---------------+--------+--------+--------- RxCan1[11a] Avg| 0.00| 0.0000| 0.023 Peak| | 1.2635| 1.508 ---------------+--------+--------+--------- RxCan1[130] Avg| 0.00| 0.0000| 0.024 Peak| | 0.6548| 0.703 ---------------+--------+--------+--------- RxCan1[139] Avg| 0.00| 0.0000| 0.021 Peak| | 0.6002| 0.984 ---------------+--------+--------+--------- RxCan1[156] Avg| 0.00| 0.0000| 0.024 Peak| | 0.1225| 0.479 ---------------+--------+--------+--------- RxCan1[160] Avg| 0.00| 0.0000| 0.028 Peak| | 0.6586| 1.376 ---------------+--------+--------+--------- RxCan1[165] Avg| 0.00| 0.0000| 0.027 Peak| | 0.6368| 1.132 ---------------+--------+--------+--------- RxCan1[167] Avg| 0.00| 0.0000| 0.024 Peak| | 1.3009| 1.067 ---------------+--------+--------+--------- RxCan1[171] Avg| 0.00| 0.0000| 0.022 Peak| | 0.6590| 4.320 ---------------+--------+--------+--------- RxCan1[178] Avg| 0.00| 0.0000| 0.023 Peak| | 0.1161| 0.311 ---------------+--------+--------+--------- RxCan1[179] Avg| 0.00| 0.0000| 0.024 Peak| | 0.1236| 0.536 ---------------+--------+--------+--------- RxCan1[180] Avg| 0.00| 0.0000| 0.022 Peak| | 0.6472| 1.193 ---------------+--------+--------+--------- RxCan1[185] Avg| 0.00| 0.0000| 0.022 Peak| | 0.6777| 1.385 ---------------+--------+--------+--------- RxCan1[1a0] Avg| 0.00| 0.0000| 0.022 Peak| | 0.6486| 2.276 ---------------+--------+--------+--------- RxCan1[1e0] Avg| 0.00| 0.0000| 0.023 Peak| | 0.6725| 1.376 ---------------+--------+--------+--------- RxCan1[1e4] Avg| 0.00| 0.0000| 0.027 Peak| | 0.7370| 1.266 ---------------+--------+--------+--------- RxCan1[1f0] Avg| 0.00| 0.0000| 0.024 Peak| | 0.4253| 0.753 ---------------+--------+--------+--------- RxCan1[200] Avg| 0.00| 0.0000| 0.025 Peak| | 0.6262| 0.791 ---------------+--------+--------+--------- RxCan1[202] Avg| 0.00| 0.0000| 0.021 Peak| | 1.2915| 1.257 ---------------+--------+--------+--------- RxCan1[204] Avg| 0.00| 0.0000| 0.022 Peak| | 1.2620| 1.010 ---------------+--------+--------+--------- RxCan1[213] Avg| 0.00| 0.0000| 0.022 Peak| | 0.6331| 1.185 ---------------+--------+--------+--------- RxCan1[214] Avg| 0.00| 0.0000| 0.023 Peak| | 0.9977| 34.527 ---------------+--------+--------+--------- RxCan1[217] Avg| 0.00| 0.0000| 0.024 Peak| | 1.2825| 1.328 ---------------+--------+--------+--------- RxCan1[218] Avg| 0.00| 0.0000| 0.022 Peak| | 0.6328| 1.110 ---------------+--------+--------+--------- RxCan1[230] Avg| 0.00| 0.0000| 0.019 Peak| | 0.6742| 5.119 ---------------+--------+--------+--------- RxCan1[240] Avg| 0.00| 0.0000| 0.022 Peak| | 0.1163| 0.343 ---------------+--------+--------+--------- RxCan1[242] Avg| 0.00| 0.0000| 0.025 Peak| | 0.3501| 1.015 ---------------+--------+--------+--------- RxCan1[24a] Avg| 0.00| 0.0000| 0.022 Peak| | 0.1212| 0.338 ---------------+--------+--------+--------- RxCan1[24b] Avg| 0.00| 0.0000| 0.023 Peak| | 0.1289| 0.330 ---------------+--------+--------+--------- RxCan1[24c] Avg| 0.00| 0.0000| 0.033 Peak| | 0.1714| 1.189 ---------------+--------+--------+--------- RxCan1[25a] Avg| 0.00| 0.0000| 0.024 Peak| | 0.1289| 0.510 ---------------+--------+--------+--------- RxCan1[25b] Avg| 0.00| 0.0000| 0.022 Peak| | 0.6685| 0.930 ---------------+--------+--------+--------- RxCan1[25c] Avg| 0.00| 0.0000| 0.027 Peak| | 1.3298| 2.670 ---------------+--------+--------+--------- RxCan1[260] Avg| 0.00| 0.0000| 0.023 Peak| | 0.1271| 0.401 ---------------+--------+--------+--------- RxCan1[270] Avg| 0.00| 0.0000| 0.022 Peak| | 0.6439| 0.898 ---------------+--------+--------+--------- RxCan1[280] Avg| 0.00| 0.0000| 0.023 Peak| | 0.6502| 1.156 ---------------+--------+--------+--------- RxCan1[2e4] Avg| 0.00| 0.0000| 0.035 Peak| | 0.3389| 0.811 ---------------+--------+--------+--------- RxCan1[2ec] Avg| 0.00| 0.0000| 0.027 Peak| | 0.1417| 0.784 ---------------+--------+--------+--------- RxCan1[2ed] Avg| 0.00| 0.0000| 0.024 Peak| | 0.1364| 0.746 ---------------+--------+--------+--------- RxCan1[2ee] Avg| 0.00| 0.0000| 0.024 Peak| | 0.1406| 0.965 ---------------+--------+--------+--------- RxCan1[312] Avg| 0.00| 0.0000| 0.023 Peak| | 0.1293| 0.978 ---------------+--------+--------+--------- RxCan1[326] Avg| 0.00| 0.0000| 0.024 Peak| | 0.1298| 0.518 ---------------+--------+--------+--------- RxCan1[336] Avg| 0.00| 0.0000| 0.028 Peak| | 0.0106| 0.329 ---------------+--------+--------+--------- RxCan1[352] Avg| 0.00| 0.0000| 0.030 Peak| | 0.1054| 0.800 ---------------+--------+--------+--------- RxCan1[355] Avg| 0.00| 0.0000| 0.027 Peak| | 0.0270| 0.546 ---------------+--------+--------+--------- RxCan1[35e] Avg| 0.00| 0.0000| 0.023 Peak| | 0.1288| 0.573 ---------------+--------+--------+--------- RxCan1[365] Avg| 0.00| 0.0000| 0.024 Peak| | 0.1297| 0.358 ---------------+--------+--------+--------- RxCan1[366] Avg| 0.00| 0.0000| 0.026 Peak| | 0.1429| 1.001 ---------------+--------+--------+--------- RxCan1[367] Avg| 0.00| 0.0000| 0.026 Peak| | 0.1472| 0.828 ---------------+--------+--------+--------- RxCan1[368] Avg| 0.00| 0.0000| 0.024 Peak| | 0.1323| 0.931 ---------------+--------+--------+--------- RxCan1[369] Avg| 0.00| 0.0000| 0.026 Peak| | 0.1498| 1.072 ---------------+--------+--------+--------- RxCan1[380] Avg| 0.00| 0.0000| 0.022 Peak| | 0.1285| 0.348 ---------------+--------+--------+--------- RxCan1[38b] Avg| 0.00| 0.0000| 0.021 Peak| | 0.3298| 1.168 ---------------+--------+--------+--------- RxCan1[3b3] Avg| 0.00| 0.0000| 0.025 Peak| | 0.1348| 0.920 ---------------+--------+--------+--------- RxCan1[400] Avg| 0.00| 0.0000| 0.022 Peak| | 0.0481| 0.445 ---------------+--------+--------+--------- RxCan1[405] Avg| 0.00| 0.0000| 0.034 Peak| | 0.0723| 0.473 ---------------+--------+--------+--------- RxCan1[40a] Avg| 0.00| 0.0000| 0.025 Peak| | 0.1040| 0.543 ---------------+--------+--------+--------- RxCan1[410] Avg| 0.00| 0.0000| 0.024 Peak| | 0.1339| 0.678 ---------------+--------+--------+--------- RxCan1[411] Avg| 0.00| 0.0000| 0.025 Peak| | 0.1376| 0.573 ---------------+--------+--------+--------- RxCan1[416] Avg| 0.00| 0.0000| 0.023 Peak| | 0.1284| 0.346 ---------------+--------+--------+--------- RxCan1[421] Avg| 0.00| 0.0000| 0.024 Peak| | 0.1323| 0.643 ---------------+--------+--------+--------- RxCan1[42d] Avg| 0.00| 0.0000| 0.023 Peak| | 0.1362| 1.146 ---------------+--------+--------+--------- RxCan1[42f] Avg| 0.00| 0.0000| 0.027 Peak| | 0.1503| 1.762 ---------------+--------+--------+--------- RxCan1[430] Avg| 0.00| 0.0000| 0.023 Peak| | 0.1352| 0.347 ---------------+--------+--------+--------- RxCan1[434] Avg| 0.00| 0.0000| 0.024 Peak| | 0.1312| 0.580 ---------------+--------+--------+--------- RxCan1[435] Avg| 0.00| 0.0000| 0.029 Peak| | 0.1109| 1.133 ---------------+--------+--------+--------- RxCan1[43e] Avg| 0.00| 0.0000| 0.023 Peak| | 0.2776| 0.686 ---------------+--------+--------+--------- RxCan1[440] Avg| 0.00| 0.0000| 0.022 Peak| | 0.0118| 0.276 ---------------+--------+--------+--------- RxCan1[465] Avg| 0.00| 0.0000| 0.022 Peak| | 0.0118| 0.279 ---------------+--------+--------+--------- RxCan1[466] Avg| 0.00| 0.0000| 0.023 Peak| | 0.0123| 0.310 ---------------+--------+--------+--------- RxCan1[467] Avg| 0.00| 0.0000| 0.025 Peak| | 0.0132| 0.314 ---------------+--------+--------+--------- RxCan1[472] Avg| 0.00| 0.0000| 0.101 Peak| | 0.0307| 1.105 ---------------+--------+--------+--------- RxCan1[473] Avg| 0.00| 0.0000| 0.051 Peak| | 0.0107| 0.575 ---------------+--------+--------+--------- RxCan1[474] Avg| 0.00| 0.0000| 0.024 Peak| | 0.0097| 0.289 ---------------+--------+--------+--------- RxCan1[475] Avg| 0.00| 0.0000| 0.023 Peak| | 0.0220| 0.327 ---------------+--------+--------+--------- RxCan1[476] Avg| 0.00| 0.0000| 0.050 Peak| | 0.0762| 5.329 ---------------+--------+--------+--------- RxCan1[477] Avg| 0.00| 0.0000| 0.032 Peak| | 0.0283| 0.669 ---------------+--------+--------+--------- RxCan1[595] Avg| 0.00| 0.0000| 0.026 Peak| | 0.0103| 0.297 ---------------+--------+--------+--------- RxCan1[59e] Avg| 0.00| 0.0000| 0.022 Peak| | 0.0114| 0.263 ---------------+--------+--------+--------- RxCan1[5a2] Avg| 0.00| 0.0000| 0.026 Peak| | 0.0119| 0.505 ---------------+--------+--------+--------- RxCan1[5ba] Avg| 0.00| 0.0000| 0.025 Peak| | 0.0139| 0.549 ---------------+--------+--------+--------- RxCan2[020] Avg| 0.00| 0.0000| 0.026 Peak| | 0.4923| 1.133 ---------------+--------+--------+--------- RxCan2[030] Avg| 0.00| 0.0000| 0.023 Peak| | 0.3297| 1.136 ---------------+--------+--------+--------- RxCan2[03a] Avg| 0.00| 0.0000| 0.022 Peak| | 0.2792| 1.275 ---------------+--------+--------+--------- RxCan2[040] Avg| 0.00| 0.0000| 0.023 Peak| | 0.2834| 1.080 ---------------+--------+--------+--------- RxCan2[060] Avg| 0.00| 0.0000| 0.029 Peak| | 0.3037| 0.991 ---------------+--------+--------+--------- RxCan2[070] Avg| 0.00| 0.0000| 0.025 Peak| | 0.2291| 0.460 ---------------+--------+--------+--------- RxCan2[080] Avg| 0.00| 0.0000| 0.043 Peak| | 0.4015| 1.007 ---------------+--------+--------+--------- RxCan2[083] Avg| 0.00| 0.0000| 0.026 Peak| | 0.2957| 0.788 ---------------+--------+--------+--------- RxCan2[090] Avg| 0.00| 0.0000| 0.027 Peak| | 0.3951| 1.231 ---------------+--------+--------+--------- RxCan2[0a0] Avg| 0.00| 0.0000| 0.026 Peak| | 0.2560| 0.722 ---------------+--------+--------+--------- RxCan2[100] Avg| 0.00| 0.0000| 0.046 Peak| | 0.4506| 21.961 ---------------+--------+--------+--------- RxCan2[108] Avg| 0.00| 0.0000| 0.024 Peak| | 0.3713| 1.125 ---------------+--------+--------+--------- RxCan2[110] Avg| 0.00| 0.0000| 0.029 Peak| | 0.2443| 0.755 ---------------+--------+--------+--------- RxCan2[130] Avg| 0.00| 0.0000| 0.023 Peak| | 0.2052| 1.097 ---------------+--------+--------+--------- RxCan2[150] Avg| 0.00| 0.0000| 0.023 Peak| | 0.2246| 0.371 ---------------+--------+--------+--------- RxCan2[160] Avg| 0.00| 0.0000| 0.024 Peak| | 0.0755| 1.125 ---------------+--------+--------+--------- RxCan2[180] Avg| 0.00| 0.0000| 0.023 Peak| | 0.2350| 0.936 ---------------+--------+--------+--------- RxCan2[190] Avg| 0.00| 0.0000| 0.022 Peak| | 0.2275| 0.592 ---------------+--------+--------+--------- RxCan2[1a0] Avg| 0.00| 0.0000| 0.025 Peak| | 0.0125| 0.273 ---------------+--------+--------+--------- RxCan2[1a4] Avg| 0.00| 0.0000| 0.022 Peak| | 0.2806| 0.632 ---------------+--------+--------+--------- RxCan2[1a8] Avg| 0.00| 0.0000| 0.022 Peak| | 0.1683| 0.740 ---------------+--------+--------+--------- RxCan2[1b0] Avg| 0.00| 0.0000| 0.023 Peak| | 0.1360| 0.490 ---------------+--------+--------+--------- RxCan2[1b4] Avg| 0.00| 0.0000| 0.027 Peak| | 0.1556| 1.119 ---------------+--------+--------+--------- RxCan2[1b8] Avg| 0.00| 0.0000| 0.022 Peak| | 0.1704| 0.616 ---------------+--------+--------+--------- RxCan2[1c0] Avg| 0.00| 0.0000| 0.023 Peak| | 0.1317| 0.488 ---------------+--------+--------+--------- RxCan2[1e0] Avg| 0.00| 0.0000| 0.025 Peak| | 0.1460| 0.675 ---------------+--------+--------+--------- RxCan2[215] Avg| 0.00| 0.0000| 0.023 Peak| | 0.1191| 0.567 ---------------+--------+--------+--------- RxCan2[217] Avg| 0.00| 0.0000| 0.023 Peak| | 0.1167| 0.869 ---------------+--------+--------+--------- RxCan2[220] Avg| 0.00| 0.0000| 0.023 Peak| | 0.0918| 0.313 ---------------+--------+--------+--------- RxCan2[225] Avg| 0.00| 0.0000| 0.025 Peak| | 0.3635| 1.018 ---------------+--------+--------+--------- RxCan2[230] Avg| 0.00| 0.0000| 0.057 Peak| | 0.2192| 1.063 ---------------+--------+--------+--------- RxCan2[240] Avg| 0.00| 0.0000| 0.023 Peak| | 0.1173| 0.760 ---------------+--------+--------+--------- RxCan2[241] Avg| 0.00| 0.0000| 0.022 Peak| | 0.2830| 1.144 ---------------+--------+--------+--------- RxCan2[250] Avg| 0.00| 0.0000| 0.026 Peak| | 0.0701| 0.698 ---------------+--------+--------+--------- RxCan2[255] Avg| 0.00| 0.0000| 0.022 Peak| | 0.1755| 1.063 ---------------+--------+--------+--------- RxCan2[265] Avg| 0.00| 0.0000| 0.024 Peak| | 0.1771| 0.729 ---------------+--------+--------+--------- RxCan2[270] Avg| 0.00| 0.0000| 0.023 Peak| | 0.0667| 0.307 ---------------+--------+--------+--------- RxCan2[290] Avg| 0.00| 0.0000| 0.022 Peak| | 0.0410| 0.280 ---------------+--------+--------+--------- RxCan2[295] Avg| 0.00| 0.0000| 0.023 Peak| | 0.0881| 0.299 ---------------+--------+--------+--------- RxCan2[2a0] Avg| 0.00| 0.0000| 0.023 Peak| | 0.0420| 0.268 ---------------+--------+--------+--------- RxCan2[2a7] Avg| 0.00| 0.0000| 0.021 Peak| | 0.1716| 0.454 ---------------+--------+--------+--------- RxCan2[2b0] Avg| 0.00| 0.0000| 0.023 Peak| | 0.0424| 0.300 ---------------+--------+--------+--------- RxCan2[2c0] Avg| 0.00| 0.0000| 0.024 Peak| | 0.0470| 0.298 ---------------+--------+--------+--------- RxCan2[2e0] Avg| 0.00| 0.0000| 0.030 Peak| | 0.0324| 1.152 ---------------+--------+--------+--------- RxCan2[2f0] Avg| 0.00| 0.0000| 0.024 Peak| | 0.0229| 0.359 ---------------+--------+--------+--------- RxCan2[2f5] Avg| 0.00| 0.0000| 0.026 Peak| | 0.1882| 0.673 ---------------+--------+--------+--------- RxCan2[300] Avg| 0.00| 0.0000| 0.022 Peak| | 0.0186| 0.263 ---------------+--------+--------+--------- RxCan2[310] Avg| 0.00| 0.0000| 0.024 Peak| | 0.0210| 0.265 ---------------+--------+--------+--------- RxCan2[320] Avg| 0.00| 0.0000| 0.025 Peak| | 0.0207| 0.354 ---------------+--------+--------+--------- RxCan2[326] Avg| 0.00| 0.0000| 0.023 Peak| | 0.1466| 0.686 ---------------+--------+--------+--------- RxCan2[330] Avg| 0.00| 0.0000| 0.022 Peak| | 0.4580| 0.708 ---------------+--------+--------+--------- RxCan2[340] Avg| 0.00| 0.0000| 0.031 Peak| | 0.1621| 0.785 ---------------+--------+--------+--------- RxCan2[345] Avg| 0.00| 0.0000| 0.021 Peak| | 0.0199| 0.261 ---------------+--------+--------+--------- RxCan2[35e] Avg| 0.00| 0.0000| 0.023 Peak| | 0.0686| 0.449 ---------------+--------+--------+--------- RxCan2[360] Avg| 0.00| 0.0000| 0.025 Peak| | 0.0204| 0.289 ---------------+--------+--------+--------- RxCan2[361] Avg| 0.00| 0.0000| 0.022 Peak| | 0.1166| 0.316 ---------------+--------+--------+--------- RxCan2[363] Avg| 0.00| 0.0000| 0.023 Peak| | 0.0146| 0.304 ---------------+--------+--------+--------- RxCan2[370] Avg| 0.00| 0.0000| 0.024 Peak| | 0.0099| 0.278 ---------------+--------+--------+--------- RxCan2[381] Avg| 0.00| 0.0000| 0.025 Peak| | 0.0468| 0.459 ---------------+--------+--------+--------- RxCan2[3a0] Avg| 0.00| 0.0000| 0.021 Peak| | 0.2339| 0.617 ---------------+--------+--------+--------- RxCan2[3d0] Avg| 0.00| 0.0000| 0.022 Peak| | 0.1351| 0.351 ---------------+--------+--------+--------- RxCan2[3d5] Avg| 0.00| 0.0000| 0.023 Peak| | 0.0796| 0.692 ---------------+--------+--------+--------- RxCan2[400] Avg| 0.00| 0.0000| 0.023 Peak| | 0.0537| 0.307 ---------------+--------+--------+--------- RxCan2[405] Avg| 0.00| 0.0000| 0.021 Peak| | 0.0513| 0.303 ---------------+--------+--------+--------- RxCan2[40a] Avg| 0.00| 0.0000| 0.022 Peak| | 0.1099| 0.313 ---------------+--------+--------+--------- RxCan2[415] Avg| 0.00| 0.0000| 0.022 Peak| | 0.0204| 0.251 ---------------+--------+--------+--------- RxCan2[435] Avg| 0.00| 0.0000| 0.028 Peak| | 0.0113| 0.342 ---------------+--------+--------+--------- RxCan2[440] Avg| 0.00| 0.0000| 0.027 Peak| | 0.0110| 0.299 ---------------+--------+--------+--------- RxCan2[465] Avg| 0.00| 0.0000| 0.023 Peak| | 0.0122| 0.295 ---------------+--------+--------+--------- RxCan2[466] Avg| 0.00| 0.0000| 0.022 Peak| | 0.0117| 0.267 ---------------+--------+--------+--------- RxCan2[467] Avg| 0.00| 0.0000| 0.022 Peak| | 0.0164| 0.325 ---------------+--------+--------+--------- RxCan2[501] Avg| 0.00| 0.0000| 0.023 Peak| | 0.0236| 0.276 ---------------+--------+--------+--------- RxCan2[503] Avg| 0.00| 0.0000| 0.023 Peak| | 0.0248| 0.349 ---------------+--------+--------+--------- RxCan2[504] Avg| 0.00| 0.0000| 0.023 Peak| | 0.0230| 0.312 ---------------+--------+--------+--------- RxCan2[505] Avg| 0.00| 0.0000| 0.025 Peak| | 0.0256| 0.310 ---------------+--------+--------+--------- RxCan2[508] Avg| 0.00| 0.0000| 0.023 Peak| | 0.0281| 0.329 ---------------+--------+--------+--------- RxCan2[511] Avg| 0.00| 0.0000| 0.022 Peak| | 0.0232| 0.282 ---------------+--------+--------+--------- RxCan2[51e] Avg| 0.00| 0.0000| 0.023 Peak| | 0.0248| 0.298 ---------------+--------+--------+--------- RxCan2[581] Avg| 0.00| 0.0000| 0.025 Peak| | 0.0166| 0.286 ===============+========+========+========= Total Avg| 0.00| 0.0000| 43.563
At the same time, calling poller times on, poller times status causes the bus to crash, although no polls are actively being sent at all.
Cheers, Simon _______________________________________________ OvmsDev mailing list OvmsDev@lists.openvehicles.com <mailto:OvmsDev@lists.openvehicles.com> http://lists.openvehicles.com/mailman/listinfo/ovmsdev
_______________________________________________ OvmsDev mailing list OvmsDev@lists.openvehicles.com <mailto:OvmsDev@lists.openvehicles.com> http://lists.openvehicles.com/mailman/listinfo/ovmsdev
_______________________________________________ OvmsDev mailing list OvmsDev@lists.openvehicles.com http://lists.openvehicles.com/mailman/listinfo/ovmsdev
Thanks Mark for the explanation. So does this mean that OVMS tries to acknowledge all incoming messages in active mode? This seems to me to clearly exceed the capacity of OVMS with the mass of incoming messages. In fact, I am currently opening the bus in active mode, as I was hoping to get my code to revive the BMS in OVMS to work. However, unlike the other data, I only get the cell voltages when I actively poll them. To be on the safe side, I will now open the bus in read mode again. However, I am still wondering what in the poller change has altered the OVMS in such a way that the bus is now crashing completely. Currently I have undone the changes since february 2024, this only concerns code from the public repository, there was no change from me in that period. Now the OVMS is running stable again and there are neither queue overflows nor bus crashes. I had also previously increased the following queue sizes, but unfortunately this was not successful: CONFIG_OVMS_HW_EVENT_QUEUE_SIZE=120 CONFIG_OVMS_HW_CAN_RX_QUEUE_SIZE=80 CONFIG_OVMS_VEHICLE_CAN_RX_QUEUE_SIZE=80 Cheers, Simon Am 15.01.2025 um 02:08 schrieb Mark Webb-Johnson:
Note sure if this helps, but some comments:
* Remember than CAN protocol in normal mode is an ‘active’ protocol. Nodes on the bus are actively acknowledging messages (and that includes OVMS), even if they never write messages. So in normal mode there is no absolute ‘read access’. For example, opening the CAN port at the wrong baud rate, even if not writing messages, will mess up the bus.
* However, if you open the CAN port in ‘listen’ mode, then it is truly read-only. In that mode it will not acknowledge messages, and cannot write on the bus at all. I’ve never seen an OVMS mess up a bus in listen mode, even if the baud rate is wrong. I think the only way for that to happen would be a hardware layer issue (cabling, termination, etc).
Regards, Mark.
On 15 Jan 2025, at 6:30 AM, Simon Ehlen via OvmsDev <ovmsdev@lists.openvehicles.com> wrote:
But what is the reason that a read access to the bus can cause the bus to crash? This is not critical during charging, it just aborts the charging process with an error. While driving, this results in a “stop safely now” error message on the dashboard and the engine is switched off immediately.
Cheers, Simon
Am 14.01.2025 um 23:22 schrieb Michael Geddes via OvmsDev:
You may need to increase the queue size for the poll task queue.
The poller still handles the bus to vehicle notifications even if it is off.
Any poller logging on such an intensive load of can messages is likely to be a problem. This is part of the reason it is flagged off.
The total % looks wrong :/
//.ichael
On Wed, 15 Jan 2025, 03:17 Simon Ehlen via OvmsDev, <ovmsdev@lists.openvehicles.com> wrote:
Hi,
I finally got around to merging my code with the current master (previous merge february 2024). I have rebuilt my code for a Ford Focus Electric so that it uses the new OvmsPoller class.
However, I now see a lot of entries like this in my log:
I (246448) vehicle-poll: Poller[Frame]: RX Task Queue Overflow Run 8 I (246448) vehicle-poll: Poller[Frame]: RX Task Queue Overflow Run 3 I (246448) vehicle-poll: Poller[Frame]: RX Task Queue Overflow Run 1 I (246448) vehicle-poll: Poller[Frame]: RX Task Queue Overflow Run 2 I (246448) vehicle-poll: Poller[Frame]: RX Task Queue Overflow Run 1 I (246448) vehicle-poll: Poller[Frame]: RX Task Queue Overflow Run 2 I (246448) vehicle-poll: Poller[Frame]: RX Task Queue Overflow Run 1 I (246448) vehicle-poll: Poller[Frame]: RX Task Queue Overflow Run 1 I (254448) vehicle-poll: Poller[Frame]: RX Task Queue Overflow Run 24 I (254448) vehicle-poll: Poller[Frame]: RX Task Queue Overflow Run 1 I (254448) vehicle-poll: Poller[Frame]: RX Task Queue Overflow Run 1 I (254448) vehicle-poll: Poller[Frame]: RX Task Queue Overflow Run 1 I (254448) vehicle-poll: Poller[Frame]: RX Task Queue Overflow Run 1 I (254448) vehicle-poll: Poller[Frame]: RX Task Queue Overflow Run 1 I (254448) vehicle-poll: Poller[Frame]: RX Task Queue Overflow Run 1
Was this message just hidden before or do I need to make further adjustments to my code?
My code currently does not use active polling but reads on the busses (IncomingFrameCanX) on certain modules.
When I look at poller times status, it looks very extensive to me...
OVMS# poller times status Poller timing is: on Type | count | Utlztn | Time | per s | [%] | [ms] ---------------+--------+--------+--------- Poll:PRI Avg| 0.00| 0.0000| 0.003 Peak| | 0.0014| 0.041 ---------------+--------+--------+--------- RxCan1[010] Avg| 0.00| 0.0000| 0.020 Peak| | 1.2217| 1.089 ---------------+--------+--------+--------- RxCan1[030] Avg| 0.00| 0.0000| 0.024 Peak| | 1.2193| 1.241 ---------------+--------+--------+--------- RxCan1[041] Avg| 0.00| 0.0000| 0.023 Peak| | 0.6460| 1.508 ---------------+--------+--------+--------- RxCan1[049] Avg| 0.00| 0.0000| 0.024 Peak| | 0.6320| 0.630 ---------------+--------+--------+--------- RxCan1[04c] Avg| 0.00| 0.0000| 0.023 Peak| | 0.6430| 1.474 ---------------+--------+--------+--------- RxCan1[04d] Avg| 0.00| 0.0000| 0.022 Peak| | 1.2987| 1.359 ---------------+--------+--------+--------- RxCan1[076] Avg| 0.00| 0.0000| 0.072 Peak| | 0.7818| 15.221 ---------------+--------+--------+--------- RxCan1[077] Avg| 0.00| 0.0000| 0.022 Peak| | 0.6274| 0.955 ---------------+--------+--------+--------- RxCan1[07a] Avg| 0.00| 0.0000| 0.039 Peak| | 1.7602| 1.684 ---------------+--------+--------+--------- RxCan1[07d] Avg| 0.00| 0.0000| 0.023 Peak| | 0.6621| 1.913 ---------------+--------+--------+--------- RxCan1[0c8] Avg| 0.00| 0.0000| 0.026 Peak| | 0.6292| 1.412 ---------------+--------+--------+--------- RxCan1[11a] Avg| 0.00| 0.0000| 0.023 Peak| | 1.2635| 1.508 ---------------+--------+--------+--------- RxCan1[130] Avg| 0.00| 0.0000| 0.024 Peak| | 0.6548| 0.703 ---------------+--------+--------+--------- RxCan1[139] Avg| 0.00| 0.0000| 0.021 Peak| | 0.6002| 0.984 ---------------+--------+--------+--------- RxCan1[156] Avg| 0.00| 0.0000| 0.024 Peak| | 0.1225| 0.479 ---------------+--------+--------+--------- RxCan1[160] Avg| 0.00| 0.0000| 0.028 Peak| | 0.6586| 1.376 ---------------+--------+--------+--------- RxCan1[165] Avg| 0.00| 0.0000| 0.027 Peak| | 0.6368| 1.132 ---------------+--------+--------+--------- RxCan1[167] Avg| 0.00| 0.0000| 0.024 Peak| | 1.3009| 1.067 ---------------+--------+--------+--------- RxCan1[171] Avg| 0.00| 0.0000| 0.022 Peak| | 0.6590| 4.320 ---------------+--------+--------+--------- RxCan1[178] Avg| 0.00| 0.0000| 0.023 Peak| | 0.1161| 0.311 ---------------+--------+--------+--------- RxCan1[179] Avg| 0.00| 0.0000| 0.024 Peak| | 0.1236| 0.536 ---------------+--------+--------+--------- RxCan1[180] Avg| 0.00| 0.0000| 0.022 Peak| | 0.6472| 1.193 ---------------+--------+--------+--------- RxCan1[185] Avg| 0.00| 0.0000| 0.022 Peak| | 0.6777| 1.385 ---------------+--------+--------+--------- RxCan1[1a0] Avg| 0.00| 0.0000| 0.022 Peak| | 0.6486| 2.276 ---------------+--------+--------+--------- RxCan1[1e0] Avg| 0.00| 0.0000| 0.023 Peak| | 0.6725| 1.376 ---------------+--------+--------+--------- RxCan1[1e4] Avg| 0.00| 0.0000| 0.027 Peak| | 0.7370| 1.266 ---------------+--------+--------+--------- RxCan1[1f0] Avg| 0.00| 0.0000| 0.024 Peak| | 0.4253| 0.753 ---------------+--------+--------+--------- RxCan1[200] Avg| 0.00| 0.0000| 0.025 Peak| | 0.6262| 0.791 ---------------+--------+--------+--------- RxCan1[202] Avg| 0.00| 0.0000| 0.021 Peak| | 1.2915| 1.257 ---------------+--------+--------+--------- RxCan1[204] Avg| 0.00| 0.0000| 0.022 Peak| | 1.2620| 1.010 ---------------+--------+--------+--------- RxCan1[213] Avg| 0.00| 0.0000| 0.022 Peak| | 0.6331| 1.185 ---------------+--------+--------+--------- RxCan1[214] Avg| 0.00| 0.0000| 0.023 Peak| | 0.9977| 34.527 ---------------+--------+--------+--------- RxCan1[217] Avg| 0.00| 0.0000| 0.024 Peak| | 1.2825| 1.328 ---------------+--------+--------+--------- RxCan1[218] Avg| 0.00| 0.0000| 0.022 Peak| | 0.6328| 1.110 ---------------+--------+--------+--------- RxCan1[230] Avg| 0.00| 0.0000| 0.019 Peak| | 0.6742| 5.119 ---------------+--------+--------+--------- RxCan1[240] Avg| 0.00| 0.0000| 0.022 Peak| | 0.1163| 0.343 ---------------+--------+--------+--------- RxCan1[242] Avg| 0.00| 0.0000| 0.025 Peak| | 0.3501| 1.015 ---------------+--------+--------+--------- RxCan1[24a] Avg| 0.00| 0.0000| 0.022 Peak| | 0.1212| 0.338 ---------------+--------+--------+--------- RxCan1[24b] Avg| 0.00| 0.0000| 0.023 Peak| | 0.1289| 0.330 ---------------+--------+--------+--------- RxCan1[24c] Avg| 0.00| 0.0000| 0.033 Peak| | 0.1714| 1.189 ---------------+--------+--------+--------- RxCan1[25a] Avg| 0.00| 0.0000| 0.024 Peak| | 0.1289| 0.510 ---------------+--------+--------+--------- RxCan1[25b] Avg| 0.00| 0.0000| 0.022 Peak| | 0.6685| 0.930 ---------------+--------+--------+--------- RxCan1[25c] Avg| 0.00| 0.0000| 0.027 Peak| | 1.3298| 2.670 ---------------+--------+--------+--------- RxCan1[260] Avg| 0.00| 0.0000| 0.023 Peak| | 0.1271| 0.401 ---------------+--------+--------+--------- RxCan1[270] Avg| 0.00| 0.0000| 0.022 Peak| | 0.6439| 0.898 ---------------+--------+--------+--------- RxCan1[280] Avg| 0.00| 0.0000| 0.023 Peak| | 0.6502| 1.156 ---------------+--------+--------+--------- RxCan1[2e4] Avg| 0.00| 0.0000| 0.035 Peak| | 0.3389| 0.811 ---------------+--------+--------+--------- RxCan1[2ec] Avg| 0.00| 0.0000| 0.027 Peak| | 0.1417| 0.784 ---------------+--------+--------+--------- RxCan1[2ed] Avg| 0.00| 0.0000| 0.024 Peak| | 0.1364| 0.746 ---------------+--------+--------+--------- RxCan1[2ee] Avg| 0.00| 0.0000| 0.024 Peak| | 0.1406| 0.965 ---------------+--------+--------+--------- RxCan1[312] Avg| 0.00| 0.0000| 0.023 Peak| | 0.1293| 0.978 ---------------+--------+--------+--------- RxCan1[326] Avg| 0.00| 0.0000| 0.024 Peak| | 0.1298| 0.518 ---------------+--------+--------+--------- RxCan1[336] Avg| 0.00| 0.0000| 0.028 Peak| | 0.0106| 0.329 ---------------+--------+--------+--------- RxCan1[352] Avg| 0.00| 0.0000| 0.030 Peak| | 0.1054| 0.800 ---------------+--------+--------+--------- RxCan1[355] Avg| 0.00| 0.0000| 0.027 Peak| | 0.0270| 0.546 ---------------+--------+--------+--------- RxCan1[35e] Avg| 0.00| 0.0000| 0.023 Peak| | 0.1288| 0.573 ---------------+--------+--------+--------- RxCan1[365] Avg| 0.00| 0.0000| 0.024 Peak| | 0.1297| 0.358 ---------------+--------+--------+--------- RxCan1[366] Avg| 0.00| 0.0000| 0.026 Peak| | 0.1429| 1.001 ---------------+--------+--------+--------- RxCan1[367] Avg| 0.00| 0.0000| 0.026 Peak| | 0.1472| 0.828 ---------------+--------+--------+--------- RxCan1[368] Avg| 0.00| 0.0000| 0.024 Peak| | 0.1323| 0.931 ---------------+--------+--------+--------- RxCan1[369] Avg| 0.00| 0.0000| 0.026 Peak| | 0.1498| 1.072 ---------------+--------+--------+--------- RxCan1[380] Avg| 0.00| 0.0000| 0.022 Peak| | 0.1285| 0.348 ---------------+--------+--------+--------- RxCan1[38b] Avg| 0.00| 0.0000| 0.021 Peak| | 0.3298| 1.168 ---------------+--------+--------+--------- RxCan1[3b3] Avg| 0.00| 0.0000| 0.025 Peak| | 0.1348| 0.920 ---------------+--------+--------+--------- RxCan1[400] Avg| 0.00| 0.0000| 0.022 Peak| | 0.0481| 0.445 ---------------+--------+--------+--------- RxCan1[405] Avg| 0.00| 0.0000| 0.034 Peak| | 0.0723| 0.473 ---------------+--------+--------+--------- RxCan1[40a] Avg| 0.00| 0.0000| 0.025 Peak| | 0.1040| 0.543 ---------------+--------+--------+--------- RxCan1[410] Avg| 0.00| 0.0000| 0.024 Peak| | 0.1339| 0.678 ---------------+--------+--------+--------- RxCan1[411] Avg| 0.00| 0.0000| 0.025 Peak| | 0.1376| 0.573 ---------------+--------+--------+--------- RxCan1[416] Avg| 0.00| 0.0000| 0.023 Peak| | 0.1284| 0.346 ---------------+--------+--------+--------- RxCan1[421] Avg| 0.00| 0.0000| 0.024 Peak| | 0.1323| 0.643 ---------------+--------+--------+--------- RxCan1[42d] Avg| 0.00| 0.0000| 0.023 Peak| | 0.1362| 1.146 ---------------+--------+--------+--------- RxCan1[42f] Avg| 0.00| 0.0000| 0.027 Peak| | 0.1503| 1.762 ---------------+--------+--------+--------- RxCan1[430] Avg| 0.00| 0.0000| 0.023 Peak| | 0.1352| 0.347 ---------------+--------+--------+--------- RxCan1[434] Avg| 0.00| 0.0000| 0.024 Peak| | 0.1312| 0.580 ---------------+--------+--------+--------- RxCan1[435] Avg| 0.00| 0.0000| 0.029 Peak| | 0.1109| 1.133 ---------------+--------+--------+--------- RxCan1[43e] Avg| 0.00| 0.0000| 0.023 Peak| | 0.2776| 0.686 ---------------+--------+--------+--------- RxCan1[440] Avg| 0.00| 0.0000| 0.022 Peak| | 0.0118| 0.276 ---------------+--------+--------+--------- RxCan1[465] Avg| 0.00| 0.0000| 0.022 Peak| | 0.0118| 0.279 ---------------+--------+--------+--------- RxCan1[466] Avg| 0.00| 0.0000| 0.023 Peak| | 0.0123| 0.310 ---------------+--------+--------+--------- RxCan1[467] Avg| 0.00| 0.0000| 0.025 Peak| | 0.0132| 0.314 ---------------+--------+--------+--------- RxCan1[472] Avg| 0.00| 0.0000| 0.101 Peak| | 0.0307| 1.105 ---------------+--------+--------+--------- RxCan1[473] Avg| 0.00| 0.0000| 0.051 Peak| | 0.0107| 0.575 ---------------+--------+--------+--------- RxCan1[474] Avg| 0.00| 0.0000| 0.024 Peak| | 0.0097| 0.289 ---------------+--------+--------+--------- RxCan1[475] Avg| 0.00| 0.0000| 0.023 Peak| | 0.0220| 0.327 ---------------+--------+--------+--------- RxCan1[476] Avg| 0.00| 0.0000| 0.050 Peak| | 0.0762| 5.329 ---------------+--------+--------+--------- RxCan1[477] Avg| 0.00| 0.0000| 0.032 Peak| | 0.0283| 0.669 ---------------+--------+--------+--------- RxCan1[595] Avg| 0.00| 0.0000| 0.026 Peak| | 0.0103| 0.297 ---------------+--------+--------+--------- RxCan1[59e] Avg| 0.00| 0.0000| 0.022 Peak| | 0.0114| 0.263 ---------------+--------+--------+--------- RxCan1[5a2] Avg| 0.00| 0.0000| 0.026 Peak| | 0.0119| 0.505 ---------------+--------+--------+--------- RxCan1[5ba] Avg| 0.00| 0.0000| 0.025 Peak| | 0.0139| 0.549 ---------------+--------+--------+--------- RxCan2[020] Avg| 0.00| 0.0000| 0.026 Peak| | 0.4923| 1.133 ---------------+--------+--------+--------- RxCan2[030] Avg| 0.00| 0.0000| 0.023 Peak| | 0.3297| 1.136 ---------------+--------+--------+--------- RxCan2[03a] Avg| 0.00| 0.0000| 0.022 Peak| | 0.2792| 1.275 ---------------+--------+--------+--------- RxCan2[040] Avg| 0.00| 0.0000| 0.023 Peak| | 0.2834| 1.080 ---------------+--------+--------+--------- RxCan2[060] Avg| 0.00| 0.0000| 0.029 Peak| | 0.3037| 0.991 ---------------+--------+--------+--------- RxCan2[070] Avg| 0.00| 0.0000| 0.025 Peak| | 0.2291| 0.460 ---------------+--------+--------+--------- RxCan2[080] Avg| 0.00| 0.0000| 0.043 Peak| | 0.4015| 1.007 ---------------+--------+--------+--------- RxCan2[083] Avg| 0.00| 0.0000| 0.026 Peak| | 0.2957| 0.788 ---------------+--------+--------+--------- RxCan2[090] Avg| 0.00| 0.0000| 0.027 Peak| | 0.3951| 1.231 ---------------+--------+--------+--------- RxCan2[0a0] Avg| 0.00| 0.0000| 0.026 Peak| | 0.2560| 0.722 ---------------+--------+--------+--------- RxCan2[100] Avg| 0.00| 0.0000| 0.046 Peak| | 0.4506| 21.961 ---------------+--------+--------+--------- RxCan2[108] Avg| 0.00| 0.0000| 0.024 Peak| | 0.3713| 1.125 ---------------+--------+--------+--------- RxCan2[110] Avg| 0.00| 0.0000| 0.029 Peak| | 0.2443| 0.755 ---------------+--------+--------+--------- RxCan2[130] Avg| 0.00| 0.0000| 0.023 Peak| | 0.2052| 1.097 ---------------+--------+--------+--------- RxCan2[150] Avg| 0.00| 0.0000| 0.023 Peak| | 0.2246| 0.371 ---------------+--------+--------+--------- RxCan2[160] Avg| 0.00| 0.0000| 0.024 Peak| | 0.0755| 1.125 ---------------+--------+--------+--------- RxCan2[180] Avg| 0.00| 0.0000| 0.023 Peak| | 0.2350| 0.936 ---------------+--------+--------+--------- RxCan2[190] Avg| 0.00| 0.0000| 0.022 Peak| | 0.2275| 0.592 ---------------+--------+--------+--------- RxCan2[1a0] Avg| 0.00| 0.0000| 0.025 Peak| | 0.0125| 0.273 ---------------+--------+--------+--------- RxCan2[1a4] Avg| 0.00| 0.0000| 0.022 Peak| | 0.2806| 0.632 ---------------+--------+--------+--------- RxCan2[1a8] Avg| 0.00| 0.0000| 0.022 Peak| | 0.1683| 0.740 ---------------+--------+--------+--------- RxCan2[1b0] Avg| 0.00| 0.0000| 0.023 Peak| | 0.1360| 0.490 ---------------+--------+--------+--------- RxCan2[1b4] Avg| 0.00| 0.0000| 0.027 Peak| | 0.1556| 1.119 ---------------+--------+--------+--------- RxCan2[1b8] Avg| 0.00| 0.0000| 0.022 Peak| | 0.1704| 0.616 ---------------+--------+--------+--------- RxCan2[1c0] Avg| 0.00| 0.0000| 0.023 Peak| | 0.1317| 0.488 ---------------+--------+--------+--------- RxCan2[1e0] Avg| 0.00| 0.0000| 0.025 Peak| | 0.1460| 0.675 ---------------+--------+--------+--------- RxCan2[215] Avg| 0.00| 0.0000| 0.023 Peak| | 0.1191| 0.567 ---------------+--------+--------+--------- RxCan2[217] Avg| 0.00| 0.0000| 0.023 Peak| | 0.1167| 0.869 ---------------+--------+--------+--------- RxCan2[220] Avg| 0.00| 0.0000| 0.023 Peak| | 0.0918| 0.313 ---------------+--------+--------+--------- RxCan2[225] Avg| 0.00| 0.0000| 0.025 Peak| | 0.3635| 1.018 ---------------+--------+--------+--------- RxCan2[230] Avg| 0.00| 0.0000| 0.057 Peak| | 0.2192| 1.063 ---------------+--------+--------+--------- RxCan2[240] Avg| 0.00| 0.0000| 0.023 Peak| | 0.1173| 0.760 ---------------+--------+--------+--------- RxCan2[241] Avg| 0.00| 0.0000| 0.022 Peak| | 0.2830| 1.144 ---------------+--------+--------+--------- RxCan2[250] Avg| 0.00| 0.0000| 0.026 Peak| | 0.0701| 0.698 ---------------+--------+--------+--------- RxCan2[255] Avg| 0.00| 0.0000| 0.022 Peak| | 0.1755| 1.063 ---------------+--------+--------+--------- RxCan2[265] Avg| 0.00| 0.0000| 0.024 Peak| | 0.1771| 0.729 ---------------+--------+--------+--------- RxCan2[270] Avg| 0.00| 0.0000| 0.023 Peak| | 0.0667| 0.307 ---------------+--------+--------+--------- RxCan2[290] Avg| 0.00| 0.0000| 0.022 Peak| | 0.0410| 0.280 ---------------+--------+--------+--------- RxCan2[295] Avg| 0.00| 0.0000| 0.023 Peak| | 0.0881| 0.299 ---------------+--------+--------+--------- RxCan2[2a0] Avg| 0.00| 0.0000| 0.023 Peak| | 0.0420| 0.268 ---------------+--------+--------+--------- RxCan2[2a7] Avg| 0.00| 0.0000| 0.021 Peak| | 0.1716| 0.454 ---------------+--------+--------+--------- RxCan2[2b0] Avg| 0.00| 0.0000| 0.023 Peak| | 0.0424| 0.300 ---------------+--------+--------+--------- RxCan2[2c0] Avg| 0.00| 0.0000| 0.024 Peak| | 0.0470| 0.298 ---------------+--------+--------+--------- RxCan2[2e0] Avg| 0.00| 0.0000| 0.030 Peak| | 0.0324| 1.152 ---------------+--------+--------+--------- RxCan2[2f0] Avg| 0.00| 0.0000| 0.024 Peak| | 0.0229| 0.359 ---------------+--------+--------+--------- RxCan2[2f5] Avg| 0.00| 0.0000| 0.026 Peak| | 0.1882| 0.673 ---------------+--------+--------+--------- RxCan2[300] Avg| 0.00| 0.0000| 0.022 Peak| | 0.0186| 0.263 ---------------+--------+--------+--------- RxCan2[310] Avg| 0.00| 0.0000| 0.024 Peak| | 0.0210| 0.265 ---------------+--------+--------+--------- RxCan2[320] Avg| 0.00| 0.0000| 0.025 Peak| | 0.0207| 0.354 ---------------+--------+--------+--------- RxCan2[326] Avg| 0.00| 0.0000| 0.023 Peak| | 0.1466| 0.686 ---------------+--------+--------+--------- RxCan2[330] Avg| 0.00| 0.0000| 0.022 Peak| | 0.4580| 0.708 ---------------+--------+--------+--------- RxCan2[340] Avg| 0.00| 0.0000| 0.031 Peak| | 0.1621| 0.785 ---------------+--------+--------+--------- RxCan2[345] Avg| 0.00| 0.0000| 0.021 Peak| | 0.0199| 0.261 ---------------+--------+--------+--------- RxCan2[35e] Avg| 0.00| 0.0000| 0.023 Peak| | 0.0686| 0.449 ---------------+--------+--------+--------- RxCan2[360] Avg| 0.00| 0.0000| 0.025 Peak| | 0.0204| 0.289 ---------------+--------+--------+--------- RxCan2[361] Avg| 0.00| 0.0000| 0.022 Peak| | 0.1166| 0.316 ---------------+--------+--------+--------- RxCan2[363] Avg| 0.00| 0.0000| 0.023 Peak| | 0.0146| 0.304 ---------------+--------+--------+--------- RxCan2[370] Avg| 0.00| 0.0000| 0.024 Peak| | 0.0099| 0.278 ---------------+--------+--------+--------- RxCan2[381] Avg| 0.00| 0.0000| 0.025 Peak| | 0.0468| 0.459 ---------------+--------+--------+--------- RxCan2[3a0] Avg| 0.00| 0.0000| 0.021 Peak| | 0.2339| 0.617 ---------------+--------+--------+--------- RxCan2[3d0] Avg| 0.00| 0.0000| 0.022 Peak| | 0.1351| 0.351 ---------------+--------+--------+--------- RxCan2[3d5] Avg| 0.00| 0.0000| 0.023 Peak| | 0.0796| 0.692 ---------------+--------+--------+--------- RxCan2[400] Avg| 0.00| 0.0000| 0.023 Peak| | 0.0537| 0.307 ---------------+--------+--------+--------- RxCan2[405] Avg| 0.00| 0.0000| 0.021 Peak| | 0.0513| 0.303 ---------------+--------+--------+--------- RxCan2[40a] Avg| 0.00| 0.0000| 0.022 Peak| | 0.1099| 0.313 ---------------+--------+--------+--------- RxCan2[415] Avg| 0.00| 0.0000| 0.022 Peak| | 0.0204| 0.251 ---------------+--------+--------+--------- RxCan2[435] Avg| 0.00| 0.0000| 0.028 Peak| | 0.0113| 0.342 ---------------+--------+--------+--------- RxCan2[440] Avg| 0.00| 0.0000| 0.027 Peak| | 0.0110| 0.299 ---------------+--------+--------+--------- RxCan2[465] Avg| 0.00| 0.0000| 0.023 Peak| | 0.0122| 0.295 ---------------+--------+--------+--------- RxCan2[466] Avg| 0.00| 0.0000| 0.022 Peak| | 0.0117| 0.267 ---------------+--------+--------+--------- RxCan2[467] Avg| 0.00| 0.0000| 0.022 Peak| | 0.0164| 0.325 ---------------+--------+--------+--------- RxCan2[501] Avg| 0.00| 0.0000| 0.023 Peak| | 0.0236| 0.276 ---------------+--------+--------+--------- RxCan2[503] Avg| 0.00| 0.0000| 0.023 Peak| | 0.0248| 0.349 ---------------+--------+--------+--------- RxCan2[504] Avg| 0.00| 0.0000| 0.023 Peak| | 0.0230| 0.312 ---------------+--------+--------+--------- RxCan2[505] Avg| 0.00| 0.0000| 0.025 Peak| | 0.0256| 0.310 ---------------+--------+--------+--------- RxCan2[508] Avg| 0.00| 0.0000| 0.023 Peak| | 0.0281| 0.329 ---------------+--------+--------+--------- RxCan2[511] Avg| 0.00| 0.0000| 0.022 Peak| | 0.0232| 0.282 ---------------+--------+--------+--------- RxCan2[51e] Avg| 0.00| 0.0000| 0.023 Peak| | 0.0248| 0.298 ---------------+--------+--------+--------- RxCan2[581] Avg| 0.00| 0.0000| 0.025 Peak| | 0.0166| 0.286 ===============+========+========+========= Total Avg| 0.00| 0.0000| 43.563
At the same time, calling poller times on, poller times status causes the bus to crash, although no polls are actively being sent at all.
Cheers, Simon _______________________________________________ OvmsDev mailing list OvmsDev@lists.openvehicles.com http://lists.openvehicles.com/mailman/listinfo/ovmsdev
_______________________________________________ OvmsDev mailing list OvmsDev@lists.openvehicles.com http://lists.openvehicles.com/mailman/listinfo/ovmsdev
_______________________________________________ OvmsDev mailing list OvmsDev@lists.openvehicles.com http://lists.openvehicles.com/mailman/listinfo/ovmsdev
The frame acknowledging is done automatically by the CAN transceiver when in active mode, this is part of the CAN protocol to indicate bit errors to the sender. So normally a failure of the system to process received frames fast enough cannot cause any issue on the bus. But the ESP32 has a range of known hardware issues, especially in the embedded CAN transceiver, I wouldn't be surprised if there are more, or if our driver lacks some workaround for these. Maybe the new poller has some bug that causes false transmissions from process data frames received. But many vehicles send process data frames, and we've had no issue reports like this on any of them, and ECUs also normally simply ignore out of sequence protocol frames. You could record a CAN trace to see if there are transmissions, and what kind. If you don't poll and don't send frames from your code, there should be none. If the bus still crashes, that would be an indicator for something going wrong in the transceiver. Regards, Michael Am 15.01.25 um 07:15 schrieb Simon Ehlen via OvmsDev:
Thanks Mark for the explanation. So does this mean that OVMS tries to acknowledge all incoming messages in active mode? This seems to me to clearly exceed the capacity of OVMS with the mass of incoming messages.
In fact, I am currently opening the bus in active mode, as I was hoping to get my code to revive the BMS in OVMS to work. However, unlike the other data, I only get the cell voltages when I actively poll them. To be on the safe side, I will now open the bus in read mode again.
However, I am still wondering what in the poller change has altered the OVMS in such a way that the bus is now crashing completely. Currently I have undone the changes since february 2024, this only concerns code from the public repository, there was no change from me in that period. Now the OVMS is running stable again and there are neither queue overflows nor bus crashes.
I had also previously increased the following queue sizes, but unfortunately this was not successful: CONFIG_OVMS_HW_EVENT_QUEUE_SIZE=120 CONFIG_OVMS_HW_CAN_RX_QUEUE_SIZE=80 CONFIG_OVMS_VEHICLE_CAN_RX_QUEUE_SIZE=80
Cheers, Simon
Am 15.01.2025 um 02:08 schrieb Mark Webb-Johnson:
Note sure if this helps, but some comments:
* Remember than CAN protocol in normal mode is an ‘active’ protocol. Nodes on the bus are actively acknowledging messages (and that includes OVMS), even if they never write messages. So in normal mode there is no absolute ‘read access’. For example, opening the CAN port at the wrong baud rate, even if not writing messages, will mess up the bus.
* However, if you open the CAN port in ‘listen’ mode, then it is truly read-only. In that mode it will not acknowledge messages, and cannot write on the bus at all. I’ve never seen an OVMS mess up a bus in listen mode, even if the baud rate is wrong. I think the only way for that to happen would be a hardware layer issue (cabling, termination, etc).
Regards, Mark.
On 15 Jan 2025, at 6:30 AM, Simon Ehlen via OvmsDev <ovmsdev@lists.openvehicles.com> wrote:
But what is the reason that a read access to the bus can cause the bus to crash? This is not critical during charging, it just aborts the charging process with an error. While driving, this results in a “stop safely now” error message on the dashboard and the engine is switched off immediately.
Cheers, Simon
Am 14.01.2025 um 23:22 schrieb Michael Geddes via OvmsDev:
You may need to increase the queue size for the poll task queue.
The poller still handles the bus to vehicle notifications even if it is off.
Any poller logging on such an intensive load of can messages is likely to be a problem. This is part of the reason it is flagged off.
The total % looks wrong :/
//.ichael
On Wed, 15 Jan 2025, 03:17 Simon Ehlen via OvmsDev, <ovmsdev@lists.openvehicles.com> wrote:
Hi,
I finally got around to merging my code with the current master (previous merge february 2024). I have rebuilt my code for a Ford Focus Electric so that it uses the new OvmsPoller class.
However, I now see a lot of entries like this in my log:
I (246448) vehicle-poll: Poller[Frame]: RX Task Queue Overflow Run 8 I (246448) vehicle-poll: Poller[Frame]: RX Task Queue Overflow Run 3 I (246448) vehicle-poll: Poller[Frame]: RX Task Queue Overflow Run 1 I (246448) vehicle-poll: Poller[Frame]: RX Task Queue Overflow Run 2 I (246448) vehicle-poll: Poller[Frame]: RX Task Queue Overflow Run 1 I (246448) vehicle-poll: Poller[Frame]: RX Task Queue Overflow Run 2 I (246448) vehicle-poll: Poller[Frame]: RX Task Queue Overflow Run 1 I (246448) vehicle-poll: Poller[Frame]: RX Task Queue Overflow Run 1 I (254448) vehicle-poll: Poller[Frame]: RX Task Queue Overflow Run 24 I (254448) vehicle-poll: Poller[Frame]: RX Task Queue Overflow Run 1 I (254448) vehicle-poll: Poller[Frame]: RX Task Queue Overflow Run 1 I (254448) vehicle-poll: Poller[Frame]: RX Task Queue Overflow Run 1 I (254448) vehicle-poll: Poller[Frame]: RX Task Queue Overflow Run 1 I (254448) vehicle-poll: Poller[Frame]: RX Task Queue Overflow Run 1 I (254448) vehicle-poll: Poller[Frame]: RX Task Queue Overflow Run 1
Was this message just hidden before or do I need to make further adjustments to my code?
My code currently does not use active polling but reads on the busses (IncomingFrameCanX) on certain modules.
When I look at poller times status, it looks very extensive to me...
OVMS# poller times status Poller timing is: on Type | count | Utlztn | Time | per s | [%] | [ms] ---------------+--------+--------+--------- Poll:PRI Avg| 0.00| 0.0000| 0.003 Peak| | 0.0014| 0.041 ---------------+--------+--------+--------- RxCan1[010] Avg| 0.00| 0.0000| 0.020 Peak| | 1.2217| 1.089 ---------------+--------+--------+--------- RxCan1[030] Avg| 0.00| 0.0000| 0.024 Peak| | 1.2193| 1.241 ---------------+--------+--------+--------- RxCan1[041] Avg| 0.00| 0.0000| 0.023 Peak| | 0.6460| 1.508 ---------------+--------+--------+--------- RxCan1[049] Avg| 0.00| 0.0000| 0.024 Peak| | 0.6320| 0.630 ---------------+--------+--------+--------- RxCan1[04c] Avg| 0.00| 0.0000| 0.023 Peak| | 0.6430| 1.474 ---------------+--------+--------+--------- RxCan1[04d] Avg| 0.00| 0.0000| 0.022 Peak| | 1.2987| 1.359 ---------------+--------+--------+--------- RxCan1[076] Avg| 0.00| 0.0000| 0.072 Peak| | 0.7818| 15.221 ---------------+--------+--------+--------- RxCan1[077] Avg| 0.00| 0.0000| 0.022 Peak| | 0.6274| 0.955 ---------------+--------+--------+--------- RxCan1[07a] Avg| 0.00| 0.0000| 0.039 Peak| | 1.7602| 1.684 ---------------+--------+--------+--------- RxCan1[07d] Avg| 0.00| 0.0000| 0.023 Peak| | 0.6621| 1.913 ---------------+--------+--------+--------- RxCan1[0c8] Avg| 0.00| 0.0000| 0.026 Peak| | 0.6292| 1.412 ---------------+--------+--------+--------- RxCan1[11a] Avg| 0.00| 0.0000| 0.023 Peak| | 1.2635| 1.508 ---------------+--------+--------+--------- RxCan1[130] Avg| 0.00| 0.0000| 0.024 Peak| | 0.6548| 0.703 ---------------+--------+--------+--------- RxCan1[139] Avg| 0.00| 0.0000| 0.021 Peak| | 0.6002| 0.984 ---------------+--------+--------+--------- RxCan1[156] Avg| 0.00| 0.0000| 0.024 Peak| | 0.1225| 0.479 ---------------+--------+--------+--------- RxCan1[160] Avg| 0.00| 0.0000| 0.028 Peak| | 0.6586| 1.376 ---------------+--------+--------+--------- RxCan1[165] Avg| 0.00| 0.0000| 0.027 Peak| | 0.6368| 1.132 ---------------+--------+--------+--------- RxCan1[167] Avg| 0.00| 0.0000| 0.024 Peak| | 1.3009| 1.067 ---------------+--------+--------+--------- RxCan1[171] Avg| 0.00| 0.0000| 0.022 Peak| | 0.6590| 4.320 ---------------+--------+--------+--------- RxCan1[178] Avg| 0.00| 0.0000| 0.023 Peak| | 0.1161| 0.311 ---------------+--------+--------+--------- RxCan1[179] Avg| 0.00| 0.0000| 0.024 Peak| | 0.1236| 0.536 ---------------+--------+--------+--------- RxCan1[180] Avg| 0.00| 0.0000| 0.022 Peak| | 0.6472| 1.193 ---------------+--------+--------+--------- RxCan1[185] Avg| 0.00| 0.0000| 0.022 Peak| | 0.6777| 1.385 ---------------+--------+--------+--------- RxCan1[1a0] Avg| 0.00| 0.0000| 0.022 Peak| | 0.6486| 2.276 ---------------+--------+--------+--------- RxCan1[1e0] Avg| 0.00| 0.0000| 0.023 Peak| | 0.6725| 1.376 ---------------+--------+--------+--------- RxCan1[1e4] Avg| 0.00| 0.0000| 0.027 Peak| | 0.7370| 1.266 ---------------+--------+--------+--------- RxCan1[1f0] Avg| 0.00| 0.0000| 0.024 Peak| | 0.4253| 0.753 ---------------+--------+--------+--------- RxCan1[200] Avg| 0.00| 0.0000| 0.025 Peak| | 0.6262| 0.791 ---------------+--------+--------+--------- RxCan1[202] Avg| 0.00| 0.0000| 0.021 Peak| | 1.2915| 1.257 ---------------+--------+--------+--------- RxCan1[204] Avg| 0.00| 0.0000| 0.022 Peak| | 1.2620| 1.010 ---------------+--------+--------+--------- RxCan1[213] Avg| 0.00| 0.0000| 0.022 Peak| | 0.6331| 1.185 ---------------+--------+--------+--------- RxCan1[214] Avg| 0.00| 0.0000| 0.023 Peak| | 0.9977| 34.527 ---------------+--------+--------+--------- RxCan1[217] Avg| 0.00| 0.0000| 0.024 Peak| | 1.2825| 1.328 ---------------+--------+--------+--------- RxCan1[218] Avg| 0.00| 0.0000| 0.022 Peak| | 0.6328| 1.110 ---------------+--------+--------+--------- RxCan1[230] Avg| 0.00| 0.0000| 0.019 Peak| | 0.6742| 5.119 ---------------+--------+--------+--------- RxCan1[240] Avg| 0.00| 0.0000| 0.022 Peak| | 0.1163| 0.343 ---------------+--------+--------+--------- RxCan1[242] Avg| 0.00| 0.0000| 0.025 Peak| | 0.3501| 1.015 ---------------+--------+--------+--------- RxCan1[24a] Avg| 0.00| 0.0000| 0.022 Peak| | 0.1212| 0.338 ---------------+--------+--------+--------- RxCan1[24b] Avg| 0.00| 0.0000| 0.023 Peak| | 0.1289| 0.330 ---------------+--------+--------+--------- RxCan1[24c] Avg| 0.00| 0.0000| 0.033 Peak| | 0.1714| 1.189 ---------------+--------+--------+--------- RxCan1[25a] Avg| 0.00| 0.0000| 0.024 Peak| | 0.1289| 0.510 ---------------+--------+--------+--------- RxCan1[25b] Avg| 0.00| 0.0000| 0.022 Peak| | 0.6685| 0.930 ---------------+--------+--------+--------- RxCan1[25c] Avg| 0.00| 0.0000| 0.027 Peak| | 1.3298| 2.670 ---------------+--------+--------+--------- RxCan1[260] Avg| 0.00| 0.0000| 0.023 Peak| | 0.1271| 0.401 ---------------+--------+--------+--------- RxCan1[270] Avg| 0.00| 0.0000| 0.022 Peak| | 0.6439| 0.898 ---------------+--------+--------+--------- RxCan1[280] Avg| 0.00| 0.0000| 0.023 Peak| | 0.6502| 1.156 ---------------+--------+--------+--------- RxCan1[2e4] Avg| 0.00| 0.0000| 0.035 Peak| | 0.3389| 0.811 ---------------+--------+--------+--------- RxCan1[2ec] Avg| 0.00| 0.0000| 0.027 Peak| | 0.1417| 0.784 ---------------+--------+--------+--------- RxCan1[2ed] Avg| 0.00| 0.0000| 0.024 Peak| | 0.1364| 0.746 ---------------+--------+--------+--------- RxCan1[2ee] Avg| 0.00| 0.0000| 0.024 Peak| | 0.1406| 0.965 ---------------+--------+--------+--------- RxCan1[312] Avg| 0.00| 0.0000| 0.023 Peak| | 0.1293| 0.978 ---------------+--------+--------+--------- RxCan1[326] Avg| 0.00| 0.0000| 0.024 Peak| | 0.1298| 0.518 ---------------+--------+--------+--------- RxCan1[336] Avg| 0.00| 0.0000| 0.028 Peak| | 0.0106| 0.329 ---------------+--------+--------+--------- RxCan1[352] Avg| 0.00| 0.0000| 0.030 Peak| | 0.1054| 0.800 ---------------+--------+--------+--------- RxCan1[355] Avg| 0.00| 0.0000| 0.027 Peak| | 0.0270| 0.546 ---------------+--------+--------+--------- RxCan1[35e] Avg| 0.00| 0.0000| 0.023 Peak| | 0.1288| 0.573 ---------------+--------+--------+--------- RxCan1[365] Avg| 0.00| 0.0000| 0.024 Peak| | 0.1297| 0.358 ---------------+--------+--------+--------- RxCan1[366] Avg| 0.00| 0.0000| 0.026 Peak| | 0.1429| 1.001 ---------------+--------+--------+--------- RxCan1[367] Avg| 0.00| 0.0000| 0.026 Peak| | 0.1472| 0.828 ---------------+--------+--------+--------- RxCan1[368] Avg| 0.00| 0.0000| 0.024 Peak| | 0.1323| 0.931 ---------------+--------+--------+--------- RxCan1[369] Avg| 0.00| 0.0000| 0.026 Peak| | 0.1498| 1.072 ---------------+--------+--------+--------- RxCan1[380] Avg| 0.00| 0.0000| 0.022 Peak| | 0.1285| 0.348 ---------------+--------+--------+--------- RxCan1[38b] Avg| 0.00| 0.0000| 0.021 Peak| | 0.3298| 1.168 ---------------+--------+--------+--------- RxCan1[3b3] Avg| 0.00| 0.0000| 0.025 Peak| | 0.1348| 0.920 ---------------+--------+--------+--------- RxCan1[400] Avg| 0.00| 0.0000| 0.022 Peak| | 0.0481| 0.445 ---------------+--------+--------+--------- RxCan1[405] Avg| 0.00| 0.0000| 0.034 Peak| | 0.0723| 0.473 ---------------+--------+--------+--------- RxCan1[40a] Avg| 0.00| 0.0000| 0.025 Peak| | 0.1040| 0.543 ---------------+--------+--------+--------- RxCan1[410] Avg| 0.00| 0.0000| 0.024 Peak| | 0.1339| 0.678 ---------------+--------+--------+--------- RxCan1[411] Avg| 0.00| 0.0000| 0.025 Peak| | 0.1376| 0.573 ---------------+--------+--------+--------- RxCan1[416] Avg| 0.00| 0.0000| 0.023 Peak| | 0.1284| 0.346 ---------------+--------+--------+--------- RxCan1[421] Avg| 0.00| 0.0000| 0.024 Peak| | 0.1323| 0.643 ---------------+--------+--------+--------- RxCan1[42d] Avg| 0.00| 0.0000| 0.023 Peak| | 0.1362| 1.146 ---------------+--------+--------+--------- RxCan1[42f] Avg| 0.00| 0.0000| 0.027 Peak| | 0.1503| 1.762 ---------------+--------+--------+--------- RxCan1[430] Avg| 0.00| 0.0000| 0.023 Peak| | 0.1352| 0.347 ---------------+--------+--------+--------- RxCan1[434] Avg| 0.00| 0.0000| 0.024 Peak| | 0.1312| 0.580 ---------------+--------+--------+--------- RxCan1[435] Avg| 0.00| 0.0000| 0.029 Peak| | 0.1109| 1.133 ---------------+--------+--------+--------- RxCan1[43e] Avg| 0.00| 0.0000| 0.023 Peak| | 0.2776| 0.686 ---------------+--------+--------+--------- RxCan1[440] Avg| 0.00| 0.0000| 0.022 Peak| | 0.0118| 0.276 ---------------+--------+--------+--------- RxCan1[465] Avg| 0.00| 0.0000| 0.022 Peak| | 0.0118| 0.279 ---------------+--------+--------+--------- RxCan1[466] Avg| 0.00| 0.0000| 0.023 Peak| | 0.0123| 0.310 ---------------+--------+--------+--------- RxCan1[467] Avg| 0.00| 0.0000| 0.025 Peak| | 0.0132| 0.314 ---------------+--------+--------+--------- RxCan1[472] Avg| 0.00| 0.0000| 0.101 Peak| | 0.0307| 1.105 ---------------+--------+--------+--------- RxCan1[473] Avg| 0.00| 0.0000| 0.051 Peak| | 0.0107| 0.575 ---------------+--------+--------+--------- RxCan1[474] Avg| 0.00| 0.0000| 0.024 Peak| | 0.0097| 0.289 ---------------+--------+--------+--------- RxCan1[475] Avg| 0.00| 0.0000| 0.023 Peak| | 0.0220| 0.327 ---------------+--------+--------+--------- RxCan1[476] Avg| 0.00| 0.0000| 0.050 Peak| | 0.0762| 5.329 ---------------+--------+--------+--------- RxCan1[477] Avg| 0.00| 0.0000| 0.032 Peak| | 0.0283| 0.669 ---------------+--------+--------+--------- RxCan1[595] Avg| 0.00| 0.0000| 0.026 Peak| | 0.0103| 0.297 ---------------+--------+--------+--------- RxCan1[59e] Avg| 0.00| 0.0000| 0.022 Peak| | 0.0114| 0.263 ---------------+--------+--------+--------- RxCan1[5a2] Avg| 0.00| 0.0000| 0.026 Peak| | 0.0119| 0.505 ---------------+--------+--------+--------- RxCan1[5ba] Avg| 0.00| 0.0000| 0.025 Peak| | 0.0139| 0.549 ---------------+--------+--------+--------- RxCan2[020] Avg| 0.00| 0.0000| 0.026 Peak| | 0.4923| 1.133 ---------------+--------+--------+--------- RxCan2[030] Avg| 0.00| 0.0000| 0.023 Peak| | 0.3297| 1.136 ---------------+--------+--------+--------- RxCan2[03a] Avg| 0.00| 0.0000| 0.022 Peak| | 0.2792| 1.275 ---------------+--------+--------+--------- RxCan2[040] Avg| 0.00| 0.0000| 0.023 Peak| | 0.2834| 1.080 ---------------+--------+--------+--------- RxCan2[060] Avg| 0.00| 0.0000| 0.029 Peak| | 0.3037| 0.991 ---------------+--------+--------+--------- RxCan2[070] Avg| 0.00| 0.0000| 0.025 Peak| | 0.2291| 0.460 ---------------+--------+--------+--------- RxCan2[080] Avg| 0.00| 0.0000| 0.043 Peak| | 0.4015| 1.007 ---------------+--------+--------+--------- RxCan2[083] Avg| 0.00| 0.0000| 0.026 Peak| | 0.2957| 0.788 ---------------+--------+--------+--------- RxCan2[090] Avg| 0.00| 0.0000| 0.027 Peak| | 0.3951| 1.231 ---------------+--------+--------+--------- RxCan2[0a0] Avg| 0.00| 0.0000| 0.026 Peak| | 0.2560| 0.722 ---------------+--------+--------+--------- RxCan2[100] Avg| 0.00| 0.0000| 0.046 Peak| | 0.4506| 21.961 ---------------+--------+--------+--------- RxCan2[108] Avg| 0.00| 0.0000| 0.024 Peak| | 0.3713| 1.125 ---------------+--------+--------+--------- RxCan2[110] Avg| 0.00| 0.0000| 0.029 Peak| | 0.2443| 0.755 ---------------+--------+--------+--------- RxCan2[130] Avg| 0.00| 0.0000| 0.023 Peak| | 0.2052| 1.097 ---------------+--------+--------+--------- RxCan2[150] Avg| 0.00| 0.0000| 0.023 Peak| | 0.2246| 0.371 ---------------+--------+--------+--------- RxCan2[160] Avg| 0.00| 0.0000| 0.024 Peak| | 0.0755| 1.125 ---------------+--------+--------+--------- RxCan2[180] Avg| 0.00| 0.0000| 0.023 Peak| | 0.2350| 0.936 ---------------+--------+--------+--------- RxCan2[190] Avg| 0.00| 0.0000| 0.022 Peak| | 0.2275| 0.592 ---------------+--------+--------+--------- RxCan2[1a0] Avg| 0.00| 0.0000| 0.025 Peak| | 0.0125| 0.273 ---------------+--------+--------+--------- RxCan2[1a4] Avg| 0.00| 0.0000| 0.022 Peak| | 0.2806| 0.632 ---------------+--------+--------+--------- RxCan2[1a8] Avg| 0.00| 0.0000| 0.022 Peak| | 0.1683| 0.740 ---------------+--------+--------+--------- RxCan2[1b0] Avg| 0.00| 0.0000| 0.023 Peak| | 0.1360| 0.490 ---------------+--------+--------+--------- RxCan2[1b4] Avg| 0.00| 0.0000| 0.027 Peak| | 0.1556| 1.119 ---------------+--------+--------+--------- RxCan2[1b8] Avg| 0.00| 0.0000| 0.022 Peak| | 0.1704| 0.616 ---------------+--------+--------+--------- RxCan2[1c0] Avg| 0.00| 0.0000| 0.023 Peak| | 0.1317| 0.488 ---------------+--------+--------+--------- RxCan2[1e0] Avg| 0.00| 0.0000| 0.025 Peak| | 0.1460| 0.675 ---------------+--------+--------+--------- RxCan2[215] Avg| 0.00| 0.0000| 0.023 Peak| | 0.1191| 0.567 ---------------+--------+--------+--------- RxCan2[217] Avg| 0.00| 0.0000| 0.023 Peak| | 0.1167| 0.869 ---------------+--------+--------+--------- RxCan2[220] Avg| 0.00| 0.0000| 0.023 Peak| | 0.0918| 0.313 ---------------+--------+--------+--------- RxCan2[225] Avg| 0.00| 0.0000| 0.025 Peak| | 0.3635| 1.018 ---------------+--------+--------+--------- RxCan2[230] Avg| 0.00| 0.0000| 0.057 Peak| | 0.2192| 1.063 ---------------+--------+--------+--------- RxCan2[240] Avg| 0.00| 0.0000| 0.023 Peak| | 0.1173| 0.760 ---------------+--------+--------+--------- RxCan2[241] Avg| 0.00| 0.0000| 0.022 Peak| | 0.2830| 1.144 ---------------+--------+--------+--------- RxCan2[250] Avg| 0.00| 0.0000| 0.026 Peak| | 0.0701| 0.698 ---------------+--------+--------+--------- RxCan2[255] Avg| 0.00| 0.0000| 0.022 Peak| | 0.1755| 1.063 ---------------+--------+--------+--------- RxCan2[265] Avg| 0.00| 0.0000| 0.024 Peak| | 0.1771| 0.729 ---------------+--------+--------+--------- RxCan2[270] Avg| 0.00| 0.0000| 0.023 Peak| | 0.0667| 0.307 ---------------+--------+--------+--------- RxCan2[290] Avg| 0.00| 0.0000| 0.022 Peak| | 0.0410| 0.280 ---------------+--------+--------+--------- RxCan2[295] Avg| 0.00| 0.0000| 0.023 Peak| | 0.0881| 0.299 ---------------+--------+--------+--------- RxCan2[2a0] Avg| 0.00| 0.0000| 0.023 Peak| | 0.0420| 0.268 ---------------+--------+--------+--------- RxCan2[2a7] Avg| 0.00| 0.0000| 0.021 Peak| | 0.1716| 0.454 ---------------+--------+--------+--------- RxCan2[2b0] Avg| 0.00| 0.0000| 0.023 Peak| | 0.0424| 0.300 ---------------+--------+--------+--------- RxCan2[2c0] Avg| 0.00| 0.0000| 0.024 Peak| | 0.0470| 0.298 ---------------+--------+--------+--------- RxCan2[2e0] Avg| 0.00| 0.0000| 0.030 Peak| | 0.0324| 1.152 ---------------+--------+--------+--------- RxCan2[2f0] Avg| 0.00| 0.0000| 0.024 Peak| | 0.0229| 0.359 ---------------+--------+--------+--------- RxCan2[2f5] Avg| 0.00| 0.0000| 0.026 Peak| | 0.1882| 0.673 ---------------+--------+--------+--------- RxCan2[300] Avg| 0.00| 0.0000| 0.022 Peak| | 0.0186| 0.263 ---------------+--------+--------+--------- RxCan2[310] Avg| 0.00| 0.0000| 0.024 Peak| | 0.0210| 0.265 ---------------+--------+--------+--------- RxCan2[320] Avg| 0.00| 0.0000| 0.025 Peak| | 0.0207| 0.354 ---------------+--------+--------+--------- RxCan2[326] Avg| 0.00| 0.0000| 0.023 Peak| | 0.1466| 0.686 ---------------+--------+--------+--------- RxCan2[330] Avg| 0.00| 0.0000| 0.022 Peak| | 0.4580| 0.708 ---------------+--------+--------+--------- RxCan2[340] Avg| 0.00| 0.0000| 0.031 Peak| | 0.1621| 0.785 ---------------+--------+--------+--------- RxCan2[345] Avg| 0.00| 0.0000| 0.021 Peak| | 0.0199| 0.261 ---------------+--------+--------+--------- RxCan2[35e] Avg| 0.00| 0.0000| 0.023 Peak| | 0.0686| 0.449 ---------------+--------+--------+--------- RxCan2[360] Avg| 0.00| 0.0000| 0.025 Peak| | 0.0204| 0.289 ---------------+--------+--------+--------- RxCan2[361] Avg| 0.00| 0.0000| 0.022 Peak| | 0.1166| 0.316 ---------------+--------+--------+--------- RxCan2[363] Avg| 0.00| 0.0000| 0.023 Peak| | 0.0146| 0.304 ---------------+--------+--------+--------- RxCan2[370] Avg| 0.00| 0.0000| 0.024 Peak| | 0.0099| 0.278 ---------------+--------+--------+--------- RxCan2[381] Avg| 0.00| 0.0000| 0.025 Peak| | 0.0468| 0.459 ---------------+--------+--------+--------- RxCan2[3a0] Avg| 0.00| 0.0000| 0.021 Peak| | 0.2339| 0.617 ---------------+--------+--------+--------- RxCan2[3d0] Avg| 0.00| 0.0000| 0.022 Peak| | 0.1351| 0.351 ---------------+--------+--------+--------- RxCan2[3d5] Avg| 0.00| 0.0000| 0.023 Peak| | 0.0796| 0.692 ---------------+--------+--------+--------- RxCan2[400] Avg| 0.00| 0.0000| 0.023 Peak| | 0.0537| 0.307 ---------------+--------+--------+--------- RxCan2[405] Avg| 0.00| 0.0000| 0.021 Peak| | 0.0513| 0.303 ---------------+--------+--------+--------- RxCan2[40a] Avg| 0.00| 0.0000| 0.022 Peak| | 0.1099| 0.313 ---------------+--------+--------+--------- RxCan2[415] Avg| 0.00| 0.0000| 0.022 Peak| | 0.0204| 0.251 ---------------+--------+--------+--------- RxCan2[435] Avg| 0.00| 0.0000| 0.028 Peak| | 0.0113| 0.342 ---------------+--------+--------+--------- RxCan2[440] Avg| 0.00| 0.0000| 0.027 Peak| | 0.0110| 0.299 ---------------+--------+--------+--------- RxCan2[465] Avg| 0.00| 0.0000| 0.023 Peak| | 0.0122| 0.295 ---------------+--------+--------+--------- RxCan2[466] Avg| 0.00| 0.0000| 0.022 Peak| | 0.0117| 0.267 ---------------+--------+--------+--------- RxCan2[467] Avg| 0.00| 0.0000| 0.022 Peak| | 0.0164| 0.325 ---------------+--------+--------+--------- RxCan2[501] Avg| 0.00| 0.0000| 0.023 Peak| | 0.0236| 0.276 ---------------+--------+--------+--------- RxCan2[503] Avg| 0.00| 0.0000| 0.023 Peak| | 0.0248| 0.349 ---------------+--------+--------+--------- RxCan2[504] Avg| 0.00| 0.0000| 0.023 Peak| | 0.0230| 0.312 ---------------+--------+--------+--------- RxCan2[505] Avg| 0.00| 0.0000| 0.025 Peak| | 0.0256| 0.310 ---------------+--------+--------+--------- RxCan2[508] Avg| 0.00| 0.0000| 0.023 Peak| | 0.0281| 0.329 ---------------+--------+--------+--------- RxCan2[511] Avg| 0.00| 0.0000| 0.022 Peak| | 0.0232| 0.282 ---------------+--------+--------+--------- RxCan2[51e] Avg| 0.00| 0.0000| 0.023 Peak| | 0.0248| 0.298 ---------------+--------+--------+--------- RxCan2[581] Avg| 0.00| 0.0000| 0.025 Peak| | 0.0166| 0.286 ===============+========+========+========= Total Avg| 0.00| 0.0000| 43.563
At the same time, calling poller times on, poller times status causes the bus to crash, although no polls are actively being sent at all.
Cheers, Simon _______________________________________________ OvmsDev mailing list OvmsDev@lists.openvehicles.com http://lists.openvehicles.com/mailman/listinfo/ovmsdev
_______________________________________________ OvmsDev mailing list OvmsDev@lists.openvehicles.com http://lists.openvehicles.com/mailman/listinfo/ovmsdev
_______________________________________________ OvmsDev mailing list OvmsDev@lists.openvehicles.com http://lists.openvehicles.com/mailman/listinfo/ovmsdev
_______________________________________________ OvmsDev mailing list OvmsDev@lists.openvehicles.com http://lists.openvehicles.com/mailman/listinfo/ovmsdev
-- Michael Balzer * Am Rahmen 5 * D-58313 Herdecke Fon 02330 9104094 * Handy 0176 20698926
There is at least one more Leaf from Derek that has also ended up in limp mode since the new poller. There, too, no polling was actually carried out while driving. I'm not familiar with the framework at all, but does this perhaps offer you enough of an approach to recognize a commonality? Unfortunately I do not have a tool to create a CAN trace. I can't use the OVMS for this, as it no longer responds after a bus crash until I have disconnected it from the OBD and plugged it back in. Cheers, Simon Am 15.01.2025 um 10:18 schrieb Michael Balzer via OvmsDev:
The frame acknowledging is done automatically by the CAN transceiver when in active mode, this is part of the CAN protocol to indicate bit errors to the sender.
So normally a failure of the system to process received frames fast enough cannot cause any issue on the bus. But the ESP32 has a range of known hardware issues, especially in the embedded CAN transceiver, I wouldn't be surprised if there are more, or if our driver lacks some workaround for these.
Maybe the new poller has some bug that causes false transmissions from process data frames received. But many vehicles send process data frames, and we've had no issue reports like this on any of them, and ECUs also normally simply ignore out of sequence protocol frames.
You could record a CAN trace to see if there are transmissions, and what kind. If you don't poll and don't send frames from your code, there should be none. If the bus still crashes, that would be an indicator for something going wrong in the transceiver.
Regards, Michael
Am 15.01.25 um 07:15 schrieb Simon Ehlen via OvmsDev:
Thanks Mark for the explanation. So does this mean that OVMS tries to acknowledge all incoming messages in active mode? This seems to me to clearly exceed the capacity of OVMS with the mass of incoming messages.
In fact, I am currently opening the bus in active mode, as I was hoping to get my code to revive the BMS in OVMS to work. However, unlike the other data, I only get the cell voltages when I actively poll them. To be on the safe side, I will now open the bus in read mode again.
However, I am still wondering what in the poller change has altered the OVMS in such a way that the bus is now crashing completely. Currently I have undone the changes since february 2024, this only concerns code from the public repository, there was no change from me in that period. Now the OVMS is running stable again and there are neither queue overflows nor bus crashes.
I had also previously increased the following queue sizes, but unfortunately this was not successful: CONFIG_OVMS_HW_EVENT_QUEUE_SIZE=120 CONFIG_OVMS_HW_CAN_RX_QUEUE_SIZE=80 CONFIG_OVMS_VEHICLE_CAN_RX_QUEUE_SIZE=80
Cheers, Simon
Am 15.01.2025 um 02:08 schrieb Mark Webb-Johnson:
Note sure if this helps, but some comments:
* Remember than CAN protocol in normal mode is an ‘active’ protocol. Nodes on the bus are actively acknowledging messages (and that includes OVMS), even if they never write messages. So in normal mode there is no absolute ‘read access’. For example, opening the CAN port at the wrong baud rate, even if not writing messages, will mess up the bus.
* However, if you open the CAN port in ‘listen’ mode, then it is truly read-only. In that mode it will not acknowledge messages, and cannot write on the bus at all. I’ve never seen an OVMS mess up a bus in listen mode, even if the baud rate is wrong. I think the only way for that to happen would be a hardware layer issue (cabling, termination, etc).
Regards, Mark.
On 15 Jan 2025, at 6:30 AM, Simon Ehlen via OvmsDev <ovmsdev@lists.openvehicles.com> wrote:
But what is the reason that a read access to the bus can cause the bus to crash? This is not critical during charging, it just aborts the charging process with an error. While driving, this results in a “stop safely now” error message on the dashboard and the engine is switched off immediately.
Cheers, Simon
Am 14.01.2025 um 23:22 schrieb Michael Geddes via OvmsDev:
You may need to increase the queue size for the poll task queue.
The poller still handles the bus to vehicle notifications even if it is off.
Any poller logging on such an intensive load of can messages is likely to be a problem. This is part of the reason it is flagged off.
The total % looks wrong :/
//.ichael
On Wed, 15 Jan 2025, 03:17 Simon Ehlen via OvmsDev, <ovmsdev@lists.openvehicles.com> wrote:
Hi,
I finally got around to merging my code with the current master (previous merge february 2024). I have rebuilt my code for a Ford Focus Electric so that it uses the new OvmsPoller class.
However, I now see a lot of entries like this in my log:
I (246448) vehicle-poll: Poller[Frame]: RX Task Queue Overflow Run 8 I (246448) vehicle-poll: Poller[Frame]: RX Task Queue Overflow Run 3 I (246448) vehicle-poll: Poller[Frame]: RX Task Queue Overflow Run 1 I (246448) vehicle-poll: Poller[Frame]: RX Task Queue Overflow Run 2 I (246448) vehicle-poll: Poller[Frame]: RX Task Queue Overflow Run 1 I (246448) vehicle-poll: Poller[Frame]: RX Task Queue Overflow Run 2 I (246448) vehicle-poll: Poller[Frame]: RX Task Queue Overflow Run 1 I (246448) vehicle-poll: Poller[Frame]: RX Task Queue Overflow Run 1 I (254448) vehicle-poll: Poller[Frame]: RX Task Queue Overflow Run 24 I (254448) vehicle-poll: Poller[Frame]: RX Task Queue Overflow Run 1 I (254448) vehicle-poll: Poller[Frame]: RX Task Queue Overflow Run 1 I (254448) vehicle-poll: Poller[Frame]: RX Task Queue Overflow Run 1 I (254448) vehicle-poll: Poller[Frame]: RX Task Queue Overflow Run 1 I (254448) vehicle-poll: Poller[Frame]: RX Task Queue Overflow Run 1 I (254448) vehicle-poll: Poller[Frame]: RX Task Queue Overflow Run 1
Was this message just hidden before or do I need to make further adjustments to my code?
My code currently does not use active polling but reads on the busses (IncomingFrameCanX) on certain modules.
When I look at poller times status, it looks very extensive to me...
OVMS# poller times status Poller timing is: on Type | count | Utlztn | Time | per s | [%] | [ms] ---------------+--------+--------+--------- Poll:PRI Avg| 0.00| 0.0000| 0.003 Peak| | 0.0014| 0.041 ---------------+--------+--------+--------- RxCan1[010] Avg| 0.00| 0.0000| 0.020 Peak| | 1.2217| 1.089 ---------------+--------+--------+--------- RxCan1[030] Avg| 0.00| 0.0000| 0.024 Peak| | 1.2193| 1.241 ---------------+--------+--------+--------- RxCan1[041] Avg| 0.00| 0.0000| 0.023 Peak| | 0.6460| 1.508 ---------------+--------+--------+--------- RxCan1[049] Avg| 0.00| 0.0000| 0.024 Peak| | 0.6320| 0.630 ---------------+--------+--------+--------- RxCan1[04c] Avg| 0.00| 0.0000| 0.023 Peak| | 0.6430| 1.474 ---------------+--------+--------+--------- RxCan1[04d] Avg| 0.00| 0.0000| 0.022 Peak| | 1.2987| 1.359 ---------------+--------+--------+--------- RxCan1[076] Avg| 0.00| 0.0000| 0.072 Peak| | 0.7818| 15.221 ---------------+--------+--------+--------- RxCan1[077] Avg| 0.00| 0.0000| 0.022 Peak| | 0.6274| 0.955 ---------------+--------+--------+--------- RxCan1[07a] Avg| 0.00| 0.0000| 0.039 Peak| | 1.7602| 1.684 ---------------+--------+--------+--------- RxCan1[07d] Avg| 0.00| 0.0000| 0.023 Peak| | 0.6621| 1.913 ---------------+--------+--------+--------- RxCan1[0c8] Avg| 0.00| 0.0000| 0.026 Peak| | 0.6292| 1.412 ---------------+--------+--------+--------- RxCan1[11a] Avg| 0.00| 0.0000| 0.023 Peak| | 1.2635| 1.508 ---------------+--------+--------+--------- RxCan1[130] Avg| 0.00| 0.0000| 0.024 Peak| | 0.6548| 0.703 ---------------+--------+--------+--------- RxCan1[139] Avg| 0.00| 0.0000| 0.021 Peak| | 0.6002| 0.984 ---------------+--------+--------+--------- RxCan1[156] Avg| 0.00| 0.0000| 0.024 Peak| | 0.1225| 0.479 ---------------+--------+--------+--------- RxCan1[160] Avg| 0.00| 0.0000| 0.028 Peak| | 0.6586| 1.376 ---------------+--------+--------+--------- RxCan1[165] Avg| 0.00| 0.0000| 0.027 Peak| | 0.6368| 1.132 ---------------+--------+--------+--------- RxCan1[167] Avg| 0.00| 0.0000| 0.024 Peak| | 1.3009| 1.067 ---------------+--------+--------+--------- RxCan1[171] Avg| 0.00| 0.0000| 0.022 Peak| | 0.6590| 4.320 ---------------+--------+--------+--------- RxCan1[178] Avg| 0.00| 0.0000| 0.023 Peak| | 0.1161| 0.311 ---------------+--------+--------+--------- RxCan1[179] Avg| 0.00| 0.0000| 0.024 Peak| | 0.1236| 0.536 ---------------+--------+--------+--------- RxCan1[180] Avg| 0.00| 0.0000| 0.022 Peak| | 0.6472| 1.193 ---------------+--------+--------+--------- RxCan1[185] Avg| 0.00| 0.0000| 0.022 Peak| | 0.6777| 1.385 ---------------+--------+--------+--------- RxCan1[1a0] Avg| 0.00| 0.0000| 0.022 Peak| | 0.6486| 2.276 ---------------+--------+--------+--------- RxCan1[1e0] Avg| 0.00| 0.0000| 0.023 Peak| | 0.6725| 1.376 ---------------+--------+--------+--------- RxCan1[1e4] Avg| 0.00| 0.0000| 0.027 Peak| | 0.7370| 1.266 ---------------+--------+--------+--------- RxCan1[1f0] Avg| 0.00| 0.0000| 0.024 Peak| | 0.4253| 0.753 ---------------+--------+--------+--------- RxCan1[200] Avg| 0.00| 0.0000| 0.025 Peak| | 0.6262| 0.791 ---------------+--------+--------+--------- RxCan1[202] Avg| 0.00| 0.0000| 0.021 Peak| | 1.2915| 1.257 ---------------+--------+--------+--------- RxCan1[204] Avg| 0.00| 0.0000| 0.022 Peak| | 1.2620| 1.010 ---------------+--------+--------+--------- RxCan1[213] Avg| 0.00| 0.0000| 0.022 Peak| | 0.6331| 1.185 ---------------+--------+--------+--------- RxCan1[214] Avg| 0.00| 0.0000| 0.023 Peak| | 0.9977| 34.527 ---------------+--------+--------+--------- RxCan1[217] Avg| 0.00| 0.0000| 0.024 Peak| | 1.2825| 1.328 ---------------+--------+--------+--------- RxCan1[218] Avg| 0.00| 0.0000| 0.022 Peak| | 0.6328| 1.110 ---------------+--------+--------+--------- RxCan1[230] Avg| 0.00| 0.0000| 0.019 Peak| | 0.6742| 5.119 ---------------+--------+--------+--------- RxCan1[240] Avg| 0.00| 0.0000| 0.022 Peak| | 0.1163| 0.343 ---------------+--------+--------+--------- RxCan1[242] Avg| 0.00| 0.0000| 0.025 Peak| | 0.3501| 1.015 ---------------+--------+--------+--------- RxCan1[24a] Avg| 0.00| 0.0000| 0.022 Peak| | 0.1212| 0.338 ---------------+--------+--------+--------- RxCan1[24b] Avg| 0.00| 0.0000| 0.023 Peak| | 0.1289| 0.330 ---------------+--------+--------+--------- RxCan1[24c] Avg| 0.00| 0.0000| 0.033 Peak| | 0.1714| 1.189 ---------------+--------+--------+--------- RxCan1[25a] Avg| 0.00| 0.0000| 0.024 Peak| | 0.1289| 0.510 ---------------+--------+--------+--------- RxCan1[25b] Avg| 0.00| 0.0000| 0.022 Peak| | 0.6685| 0.930 ---------------+--------+--------+--------- RxCan1[25c] Avg| 0.00| 0.0000| 0.027 Peak| | 1.3298| 2.670 ---------------+--------+--------+--------- RxCan1[260] Avg| 0.00| 0.0000| 0.023 Peak| | 0.1271| 0.401 ---------------+--------+--------+--------- RxCan1[270] Avg| 0.00| 0.0000| 0.022 Peak| | 0.6439| 0.898 ---------------+--------+--------+--------- RxCan1[280] Avg| 0.00| 0.0000| 0.023 Peak| | 0.6502| 1.156 ---------------+--------+--------+--------- RxCan1[2e4] Avg| 0.00| 0.0000| 0.035 Peak| | 0.3389| 0.811 ---------------+--------+--------+--------- RxCan1[2ec] Avg| 0.00| 0.0000| 0.027 Peak| | 0.1417| 0.784 ---------------+--------+--------+--------- RxCan1[2ed] Avg| 0.00| 0.0000| 0.024 Peak| | 0.1364| 0.746 ---------------+--------+--------+--------- RxCan1[2ee] Avg| 0.00| 0.0000| 0.024 Peak| | 0.1406| 0.965 ---------------+--------+--------+--------- RxCan1[312] Avg| 0.00| 0.0000| 0.023 Peak| | 0.1293| 0.978 ---------------+--------+--------+--------- RxCan1[326] Avg| 0.00| 0.0000| 0.024 Peak| | 0.1298| 0.518 ---------------+--------+--------+--------- RxCan1[336] Avg| 0.00| 0.0000| 0.028 Peak| | 0.0106| 0.329 ---------------+--------+--------+--------- RxCan1[352] Avg| 0.00| 0.0000| 0.030 Peak| | 0.1054| 0.800 ---------------+--------+--------+--------- RxCan1[355] Avg| 0.00| 0.0000| 0.027 Peak| | 0.0270| 0.546 ---------------+--------+--------+--------- RxCan1[35e] Avg| 0.00| 0.0000| 0.023 Peak| | 0.1288| 0.573 ---------------+--------+--------+--------- RxCan1[365] Avg| 0.00| 0.0000| 0.024 Peak| | 0.1297| 0.358 ---------------+--------+--------+--------- RxCan1[366] Avg| 0.00| 0.0000| 0.026 Peak| | 0.1429| 1.001 ---------------+--------+--------+--------- RxCan1[367] Avg| 0.00| 0.0000| 0.026 Peak| | 0.1472| 0.828 ---------------+--------+--------+--------- RxCan1[368] Avg| 0.00| 0.0000| 0.024 Peak| | 0.1323| 0.931 ---------------+--------+--------+--------- RxCan1[369] Avg| 0.00| 0.0000| 0.026 Peak| | 0.1498| 1.072 ---------------+--------+--------+--------- RxCan1[380] Avg| 0.00| 0.0000| 0.022 Peak| | 0.1285| 0.348 ---------------+--------+--------+--------- RxCan1[38b] Avg| 0.00| 0.0000| 0.021 Peak| | 0.3298| 1.168 ---------------+--------+--------+--------- RxCan1[3b3] Avg| 0.00| 0.0000| 0.025 Peak| | 0.1348| 0.920 ---------------+--------+--------+--------- RxCan1[400] Avg| 0.00| 0.0000| 0.022 Peak| | 0.0481| 0.445 ---------------+--------+--------+--------- RxCan1[405] Avg| 0.00| 0.0000| 0.034 Peak| | 0.0723| 0.473 ---------------+--------+--------+--------- RxCan1[40a] Avg| 0.00| 0.0000| 0.025 Peak| | 0.1040| 0.543 ---------------+--------+--------+--------- RxCan1[410] Avg| 0.00| 0.0000| 0.024 Peak| | 0.1339| 0.678 ---------------+--------+--------+--------- RxCan1[411] Avg| 0.00| 0.0000| 0.025 Peak| | 0.1376| 0.573 ---------------+--------+--------+--------- RxCan1[416] Avg| 0.00| 0.0000| 0.023 Peak| | 0.1284| 0.346 ---------------+--------+--------+--------- RxCan1[421] Avg| 0.00| 0.0000| 0.024 Peak| | 0.1323| 0.643 ---------------+--------+--------+--------- RxCan1[42d] Avg| 0.00| 0.0000| 0.023 Peak| | 0.1362| 1.146 ---------------+--------+--------+--------- RxCan1[42f] Avg| 0.00| 0.0000| 0.027 Peak| | 0.1503| 1.762 ---------------+--------+--------+--------- RxCan1[430] Avg| 0.00| 0.0000| 0.023 Peak| | 0.1352| 0.347 ---------------+--------+--------+--------- RxCan1[434] Avg| 0.00| 0.0000| 0.024 Peak| | 0.1312| 0.580 ---------------+--------+--------+--------- RxCan1[435] Avg| 0.00| 0.0000| 0.029 Peak| | 0.1109| 1.133 ---------------+--------+--------+--------- RxCan1[43e] Avg| 0.00| 0.0000| 0.023 Peak| | 0.2776| 0.686 ---------------+--------+--------+--------- RxCan1[440] Avg| 0.00| 0.0000| 0.022 Peak| | 0.0118| 0.276 ---------------+--------+--------+--------- RxCan1[465] Avg| 0.00| 0.0000| 0.022 Peak| | 0.0118| 0.279 ---------------+--------+--------+--------- RxCan1[466] Avg| 0.00| 0.0000| 0.023 Peak| | 0.0123| 0.310 ---------------+--------+--------+--------- RxCan1[467] Avg| 0.00| 0.0000| 0.025 Peak| | 0.0132| 0.314 ---------------+--------+--------+--------- RxCan1[472] Avg| 0.00| 0.0000| 0.101 Peak| | 0.0307| 1.105 ---------------+--------+--------+--------- RxCan1[473] Avg| 0.00| 0.0000| 0.051 Peak| | 0.0107| 0.575 ---------------+--------+--------+--------- RxCan1[474] Avg| 0.00| 0.0000| 0.024 Peak| | 0.0097| 0.289 ---------------+--------+--------+--------- RxCan1[475] Avg| 0.00| 0.0000| 0.023 Peak| | 0.0220| 0.327 ---------------+--------+--------+--------- RxCan1[476] Avg| 0.00| 0.0000| 0.050 Peak| | 0.0762| 5.329 ---------------+--------+--------+--------- RxCan1[477] Avg| 0.00| 0.0000| 0.032 Peak| | 0.0283| 0.669 ---------------+--------+--------+--------- RxCan1[595] Avg| 0.00| 0.0000| 0.026 Peak| | 0.0103| 0.297 ---------------+--------+--------+--------- RxCan1[59e] Avg| 0.00| 0.0000| 0.022 Peak| | 0.0114| 0.263 ---------------+--------+--------+--------- RxCan1[5a2] Avg| 0.00| 0.0000| 0.026 Peak| | 0.0119| 0.505 ---------------+--------+--------+--------- RxCan1[5ba] Avg| 0.00| 0.0000| 0.025 Peak| | 0.0139| 0.549 ---------------+--------+--------+--------- RxCan2[020] Avg| 0.00| 0.0000| 0.026 Peak| | 0.4923| 1.133 ---------------+--------+--------+--------- RxCan2[030] Avg| 0.00| 0.0000| 0.023 Peak| | 0.3297| 1.136 ---------------+--------+--------+--------- RxCan2[03a] Avg| 0.00| 0.0000| 0.022 Peak| | 0.2792| 1.275 ---------------+--------+--------+--------- RxCan2[040] Avg| 0.00| 0.0000| 0.023 Peak| | 0.2834| 1.080 ---------------+--------+--------+--------- RxCan2[060] Avg| 0.00| 0.0000| 0.029 Peak| | 0.3037| 0.991 ---------------+--------+--------+--------- RxCan2[070] Avg| 0.00| 0.0000| 0.025 Peak| | 0.2291| 0.460 ---------------+--------+--------+--------- RxCan2[080] Avg| 0.00| 0.0000| 0.043 Peak| | 0.4015| 1.007 ---------------+--------+--------+--------- RxCan2[083] Avg| 0.00| 0.0000| 0.026 Peak| | 0.2957| 0.788 ---------------+--------+--------+--------- RxCan2[090] Avg| 0.00| 0.0000| 0.027 Peak| | 0.3951| 1.231 ---------------+--------+--------+--------- RxCan2[0a0] Avg| 0.00| 0.0000| 0.026 Peak| | 0.2560| 0.722 ---------------+--------+--------+--------- RxCan2[100] Avg| 0.00| 0.0000| 0.046 Peak| | 0.4506| 21.961 ---------------+--------+--------+--------- RxCan2[108] Avg| 0.00| 0.0000| 0.024 Peak| | 0.3713| 1.125 ---------------+--------+--------+--------- RxCan2[110] Avg| 0.00| 0.0000| 0.029 Peak| | 0.2443| 0.755 ---------------+--------+--------+--------- RxCan2[130] Avg| 0.00| 0.0000| 0.023 Peak| | 0.2052| 1.097 ---------------+--------+--------+--------- RxCan2[150] Avg| 0.00| 0.0000| 0.023 Peak| | 0.2246| 0.371 ---------------+--------+--------+--------- RxCan2[160] Avg| 0.00| 0.0000| 0.024 Peak| | 0.0755| 1.125 ---------------+--------+--------+--------- RxCan2[180] Avg| 0.00| 0.0000| 0.023 Peak| | 0.2350| 0.936 ---------------+--------+--------+--------- RxCan2[190] Avg| 0.00| 0.0000| 0.022 Peak| | 0.2275| 0.592 ---------------+--------+--------+--------- RxCan2[1a0] Avg| 0.00| 0.0000| 0.025 Peak| | 0.0125| 0.273 ---------------+--------+--------+--------- RxCan2[1a4] Avg| 0.00| 0.0000| 0.022 Peak| | 0.2806| 0.632 ---------------+--------+--------+--------- RxCan2[1a8] Avg| 0.00| 0.0000| 0.022 Peak| | 0.1683| 0.740 ---------------+--------+--------+--------- RxCan2[1b0] Avg| 0.00| 0.0000| 0.023 Peak| | 0.1360| 0.490 ---------------+--------+--------+--------- RxCan2[1b4] Avg| 0.00| 0.0000| 0.027 Peak| | 0.1556| 1.119 ---------------+--------+--------+--------- RxCan2[1b8] Avg| 0.00| 0.0000| 0.022 Peak| | 0.1704| 0.616 ---------------+--------+--------+--------- RxCan2[1c0] Avg| 0.00| 0.0000| 0.023 Peak| | 0.1317| 0.488 ---------------+--------+--------+--------- RxCan2[1e0] Avg| 0.00| 0.0000| 0.025 Peak| | 0.1460| 0.675 ---------------+--------+--------+--------- RxCan2[215] Avg| 0.00| 0.0000| 0.023 Peak| | 0.1191| 0.567 ---------------+--------+--------+--------- RxCan2[217] Avg| 0.00| 0.0000| 0.023 Peak| | 0.1167| 0.869 ---------------+--------+--------+--------- RxCan2[220] Avg| 0.00| 0.0000| 0.023 Peak| | 0.0918| 0.313 ---------------+--------+--------+--------- RxCan2[225] Avg| 0.00| 0.0000| 0.025 Peak| | 0.3635| 1.018 ---------------+--------+--------+--------- RxCan2[230] Avg| 0.00| 0.0000| 0.057 Peak| | 0.2192| 1.063 ---------------+--------+--------+--------- RxCan2[240] Avg| 0.00| 0.0000| 0.023 Peak| | 0.1173| 0.760 ---------------+--------+--------+--------- RxCan2[241] Avg| 0.00| 0.0000| 0.022 Peak| | 0.2830| 1.144 ---------------+--------+--------+--------- RxCan2[250] Avg| 0.00| 0.0000| 0.026 Peak| | 0.0701| 0.698 ---------------+--------+--------+--------- RxCan2[255] Avg| 0.00| 0.0000| 0.022 Peak| | 0.1755| 1.063 ---------------+--------+--------+--------- RxCan2[265] Avg| 0.00| 0.0000| 0.024 Peak| | 0.1771| 0.729 ---------------+--------+--------+--------- RxCan2[270] Avg| 0.00| 0.0000| 0.023 Peak| | 0.0667| 0.307 ---------------+--------+--------+--------- RxCan2[290] Avg| 0.00| 0.0000| 0.022 Peak| | 0.0410| 0.280 ---------------+--------+--------+--------- RxCan2[295] Avg| 0.00| 0.0000| 0.023 Peak| | 0.0881| 0.299 ---------------+--------+--------+--------- RxCan2[2a0] Avg| 0.00| 0.0000| 0.023 Peak| | 0.0420| 0.268 ---------------+--------+--------+--------- RxCan2[2a7] Avg| 0.00| 0.0000| 0.021 Peak| | 0.1716| 0.454 ---------------+--------+--------+--------- RxCan2[2b0] Avg| 0.00| 0.0000| 0.023 Peak| | 0.0424| 0.300 ---------------+--------+--------+--------- RxCan2[2c0] Avg| 0.00| 0.0000| 0.024 Peak| | 0.0470| 0.298 ---------------+--------+--------+--------- RxCan2[2e0] Avg| 0.00| 0.0000| 0.030 Peak| | 0.0324| 1.152 ---------------+--------+--------+--------- RxCan2[2f0] Avg| 0.00| 0.0000| 0.024 Peak| | 0.0229| 0.359 ---------------+--------+--------+--------- RxCan2[2f5] Avg| 0.00| 0.0000| 0.026 Peak| | 0.1882| 0.673 ---------------+--------+--------+--------- RxCan2[300] Avg| 0.00| 0.0000| 0.022 Peak| | 0.0186| 0.263 ---------------+--------+--------+--------- RxCan2[310] Avg| 0.00| 0.0000| 0.024 Peak| | 0.0210| 0.265 ---------------+--------+--------+--------- RxCan2[320] Avg| 0.00| 0.0000| 0.025 Peak| | 0.0207| 0.354 ---------------+--------+--------+--------- RxCan2[326] Avg| 0.00| 0.0000| 0.023 Peak| | 0.1466| 0.686 ---------------+--------+--------+--------- RxCan2[330] Avg| 0.00| 0.0000| 0.022 Peak| | 0.4580| 0.708 ---------------+--------+--------+--------- RxCan2[340] Avg| 0.00| 0.0000| 0.031 Peak| | 0.1621| 0.785 ---------------+--------+--------+--------- RxCan2[345] Avg| 0.00| 0.0000| 0.021 Peak| | 0.0199| 0.261 ---------------+--------+--------+--------- RxCan2[35e] Avg| 0.00| 0.0000| 0.023 Peak| | 0.0686| 0.449 ---------------+--------+--------+--------- RxCan2[360] Avg| 0.00| 0.0000| 0.025 Peak| | 0.0204| 0.289 ---------------+--------+--------+--------- RxCan2[361] Avg| 0.00| 0.0000| 0.022 Peak| | 0.1166| 0.316 ---------------+--------+--------+--------- RxCan2[363] Avg| 0.00| 0.0000| 0.023 Peak| | 0.0146| 0.304 ---------------+--------+--------+--------- RxCan2[370] Avg| 0.00| 0.0000| 0.024 Peak| | 0.0099| 0.278 ---------------+--------+--------+--------- RxCan2[381] Avg| 0.00| 0.0000| 0.025 Peak| | 0.0468| 0.459 ---------------+--------+--------+--------- RxCan2[3a0] Avg| 0.00| 0.0000| 0.021 Peak| | 0.2339| 0.617 ---------------+--------+--------+--------- RxCan2[3d0] Avg| 0.00| 0.0000| 0.022 Peak| | 0.1351| 0.351 ---------------+--------+--------+--------- RxCan2[3d5] Avg| 0.00| 0.0000| 0.023 Peak| | 0.0796| 0.692 ---------------+--------+--------+--------- RxCan2[400] Avg| 0.00| 0.0000| 0.023 Peak| | 0.0537| 0.307 ---------------+--------+--------+--------- RxCan2[405] Avg| 0.00| 0.0000| 0.021 Peak| | 0.0513| 0.303 ---------------+--------+--------+--------- RxCan2[40a] Avg| 0.00| 0.0000| 0.022 Peak| | 0.1099| 0.313 ---------------+--------+--------+--------- RxCan2[415] Avg| 0.00| 0.0000| 0.022 Peak| | 0.0204| 0.251 ---------------+--------+--------+--------- RxCan2[435] Avg| 0.00| 0.0000| 0.028 Peak| | 0.0113| 0.342 ---------------+--------+--------+--------- RxCan2[440] Avg| 0.00| 0.0000| 0.027 Peak| | 0.0110| 0.299 ---------------+--------+--------+--------- RxCan2[465] Avg| 0.00| 0.0000| 0.023 Peak| | 0.0122| 0.295 ---------------+--------+--------+--------- RxCan2[466] Avg| 0.00| 0.0000| 0.022 Peak| | 0.0117| 0.267 ---------------+--------+--------+--------- RxCan2[467] Avg| 0.00| 0.0000| 0.022 Peak| | 0.0164| 0.325 ---------------+--------+--------+--------- RxCan2[501] Avg| 0.00| 0.0000| 0.023 Peak| | 0.0236| 0.276 ---------------+--------+--------+--------- RxCan2[503] Avg| 0.00| 0.0000| 0.023 Peak| | 0.0248| 0.349 ---------------+--------+--------+--------- RxCan2[504] Avg| 0.00| 0.0000| 0.023 Peak| | 0.0230| 0.312 ---------------+--------+--------+--------- RxCan2[505] Avg| 0.00| 0.0000| 0.025 Peak| | 0.0256| 0.310 ---------------+--------+--------+--------- RxCan2[508] Avg| 0.00| 0.0000| 0.023 Peak| | 0.0281| 0.329 ---------------+--------+--------+--------- RxCan2[511] Avg| 0.00| 0.0000| 0.022 Peak| | 0.0232| 0.282 ---------------+--------+--------+--------- RxCan2[51e] Avg| 0.00| 0.0000| 0.023 Peak| | 0.0248| 0.298 ---------------+--------+--------+--------- RxCan2[581] Avg| 0.00| 0.0000| 0.025 Peak| | 0.0166| 0.286 ===============+========+========+========= Total Avg| 0.00| 0.0000| 43.563
At the same time, calling poller times on, poller times status causes the bus to crash, although no polls are actively being sent at all.
Cheers, Simon _______________________________________________ OvmsDev mailing list OvmsDev@lists.openvehicles.com http://lists.openvehicles.com/mailman/listinfo/ovmsdev
_______________________________________________ OvmsDev mailing list OvmsDev@lists.openvehicles.com http://lists.openvehicles.com/mailman/listinfo/ovmsdev
_______________________________________________ OvmsDev mailing list OvmsDev@lists.openvehicles.com http://lists.openvehicles.com/mailman/listinfo/ovmsdev
_______________________________________________ OvmsDev mailing list OvmsDev@lists.openvehicles.com http://lists.openvehicles.com/mailman/listinfo/ovmsdev
-- Michael Balzer * Am Rahmen 5 * D-58313 Herdecke Fon 02330 9104094 * Handy 0176 20698926
_______________________________________________ OvmsDev mailing list OvmsDev@lists.openvehicles.com http://lists.openvehicles.com/mailman/listinfo/ovmsdev
Derek, can you comment on this? Do you still have the issue mentioned? Speaking of the Leaf, the code there actually does something fishy in `CommandWakeup()`: unsigned char data = 0; … m_can1->WriteStandard(0x5C0, *_8_*, &data); //Wakes up the VCM (by spoofing empty battery request heating) And there are CAN transmissions from command execution in the Leaf code, so to be sure there is no TX, listen mode is needed there as well. Regarding CAN trace, you can try with the monitor channel and use the USB console to record the log output. That way you should be able to at least rule out there are regular transmissions -- assuming not every TX will cause an immediate crash. Another / probably better option: when in listen mode, the log will also tell you about TX attempts, as the driver will issue a warning on each. The CAN monitor log may also tell you about bus errors detected. Regards, Michael Am 15.01.25 um 10:44 schrieb Simon Ehlen via OvmsDev:
There is at least one more Leaf from Derek that has also ended up in limp mode since the new poller. There, too, no polling was actually carried out while driving. I'm not familiar with the framework at all, but does this perhaps offer you enough of an approach to recognize a commonality?
Unfortunately I do not have a tool to create a CAN trace. I can't use the OVMS for this, as it no longer responds after a bus crash until I have disconnected it from the OBD and plugged it back in.
Cheers, Simon
Am 15.01.2025 um 10:18 schrieb Michael Balzer via OvmsDev:
The frame acknowledging is done automatically by the CAN transceiver when in active mode, this is part of the CAN protocol to indicate bit errors to the sender.
So normally a failure of the system to process received frames fast enough cannot cause any issue on the bus. But the ESP32 has a range of known hardware issues, especially in the embedded CAN transceiver, I wouldn't be surprised if there are more, or if our driver lacks some workaround for these.
Maybe the new poller has some bug that causes false transmissions from process data frames received. But many vehicles send process data frames, and we've had no issue reports like this on any of them, and ECUs also normally simply ignore out of sequence protocol frames.
You could record a CAN trace to see if there are transmissions, and what kind. If you don't poll and don't send frames from your code, there should be none. If the bus still crashes, that would be an indicator for something going wrong in the transceiver.
Regards, Michael
Am 15.01.25 um 07:15 schrieb Simon Ehlen via OvmsDev:
Thanks Mark for the explanation. So does this mean that OVMS tries to acknowledge all incoming messages in active mode? This seems to me to clearly exceed the capacity of OVMS with the mass of incoming messages.
In fact, I am currently opening the bus in active mode, as I was hoping to get my code to revive the BMS in OVMS to work. However, unlike the other data, I only get the cell voltages when I actively poll them. To be on the safe side, I will now open the bus in read mode again.
However, I am still wondering what in the poller change has altered the OVMS in such a way that the bus is now crashing completely. Currently I have undone the changes since february 2024, this only concerns code from the public repository, there was no change from me in that period. Now the OVMS is running stable again and there are neither queue overflows nor bus crashes.
I had also previously increased the following queue sizes, but unfortunately this was not successful: CONFIG_OVMS_HW_EVENT_QUEUE_SIZE=120 CONFIG_OVMS_HW_CAN_RX_QUEUE_SIZE=80 CONFIG_OVMS_VEHICLE_CAN_RX_QUEUE_SIZE=80
Cheers, Simon
Am 15.01.2025 um 02:08 schrieb Mark Webb-Johnson:
Note sure if this helps, but some comments:
* Remember than CAN protocol in normal mode is an ‘active’ protocol. Nodes on the bus are actively acknowledging messages (and that includes OVMS), even if they never write messages. So in normal mode there is no absolute ‘read access’. For example, opening the CAN port at the wrong baud rate, even if not writing messages, will mess up the bus.
* However, if you open the CAN port in ‘listen’ mode, then it is truly read-only. In that mode it will not acknowledge messages, and cannot write on the bus at all. I’ve never seen an OVMS mess up a bus in listen mode, even if the baud rate is wrong. I think the only way for that to happen would be a hardware layer issue (cabling, termination, etc).
Regards, Mark.
On 15 Jan 2025, at 6:30 AM, Simon Ehlen via OvmsDev <ovmsdev@lists.openvehicles.com> wrote:
But what is the reason that a read access to the bus can cause the bus to crash? This is not critical during charging, it just aborts the charging process with an error. While driving, this results in a “stop safely now” error message on the dashboard and the engine is switched off immediately.
Cheers, Simon
Am 14.01.2025 um 23:22 schrieb Michael Geddes via OvmsDev:
You may need to increase the queue size for the poll task queue.
The poller still handles the bus to vehicle notifications even if it is off.
Any poller logging on such an intensive load of can messages is likely to be a problem. This is part of the reason it is flagged off.
The total % looks wrong :/
//.ichael
On Wed, 15 Jan 2025, 03:17 Simon Ehlen via OvmsDev, <ovmsdev@lists.openvehicles.com> wrote:
Hi,
I finally got around to merging my code with the current master (previous merge february 2024). I have rebuilt my code for a Ford Focus Electric so that it uses the new OvmsPoller class.
However, I now see a lot of entries like this in my log:
I (246448) vehicle-poll: Poller[Frame]: RX Task Queue Overflow Run 8 I (246448) vehicle-poll: Poller[Frame]: RX Task Queue Overflow Run 3 I (246448) vehicle-poll: Poller[Frame]: RX Task Queue Overflow Run 1 I (246448) vehicle-poll: Poller[Frame]: RX Task Queue Overflow Run 2 I (246448) vehicle-poll: Poller[Frame]: RX Task Queue Overflow Run 1 I (246448) vehicle-poll: Poller[Frame]: RX Task Queue Overflow Run 2 I (246448) vehicle-poll: Poller[Frame]: RX Task Queue Overflow Run 1 I (246448) vehicle-poll: Poller[Frame]: RX Task Queue Overflow Run 1 I (254448) vehicle-poll: Poller[Frame]: RX Task Queue Overflow Run 24 I (254448) vehicle-poll: Poller[Frame]: RX Task Queue Overflow Run 1 I (254448) vehicle-poll: Poller[Frame]: RX Task Queue Overflow Run 1 I (254448) vehicle-poll: Poller[Frame]: RX Task Queue Overflow Run 1 I (254448) vehicle-poll: Poller[Frame]: RX Task Queue Overflow Run 1 I (254448) vehicle-poll: Poller[Frame]: RX Task Queue Overflow Run 1 I (254448) vehicle-poll: Poller[Frame]: RX Task Queue Overflow Run 1
Was this message just hidden before or do I need to make further adjustments to my code?
My code currently does not use active polling but reads on the busses (IncomingFrameCanX) on certain modules.
When I look at poller times status, it looks very extensive to me...
OVMS# poller times status Poller timing is: on Type | count | Utlztn | Time | per s | [%] | [ms] ---------------+--------+--------+--------- Poll:PRI Avg| 0.00| 0.0000| 0.003 Peak| | 0.0014| 0.041 ---------------+--------+--------+--------- RxCan1[010] Avg| 0.00| 0.0000| 0.020 Peak| | 1.2217| 1.089 ---------------+--------+--------+--------- RxCan1[030] Avg| 0.00| 0.0000| 0.024 Peak| | 1.2193| 1.241 ---------------+--------+--------+--------- RxCan1[041] Avg| 0.00| 0.0000| 0.023 Peak| | 0.6460| 1.508 ---------------+--------+--------+--------- RxCan1[049] Avg| 0.00| 0.0000| 0.024 Peak| | 0.6320| 0.630 ---------------+--------+--------+--------- RxCan1[04c] Avg| 0.00| 0.0000| 0.023 Peak| | 0.6430| 1.474 ---------------+--------+--------+--------- RxCan1[04d] Avg| 0.00| 0.0000| 0.022 Peak| | 1.2987| 1.359 ---------------+--------+--------+--------- RxCan1[076] Avg| 0.00| 0.0000| 0.072 Peak| | 0.7818| 15.221 ---------------+--------+--------+--------- RxCan1[077] Avg| 0.00| 0.0000| 0.022 Peak| | 0.6274| 0.955 ---------------+--------+--------+--------- RxCan1[07a] Avg| 0.00| 0.0000| 0.039 Peak| | 1.7602| 1.684 ---------------+--------+--------+--------- RxCan1[07d] Avg| 0.00| 0.0000| 0.023 Peak| | 0.6621| 1.913 ---------------+--------+--------+--------- RxCan1[0c8] Avg| 0.00| 0.0000| 0.026 Peak| | 0.6292| 1.412 ---------------+--------+--------+--------- RxCan1[11a] Avg| 0.00| 0.0000| 0.023 Peak| | 1.2635| 1.508 ---------------+--------+--------+--------- RxCan1[130] Avg| 0.00| 0.0000| 0.024 Peak| | 0.6548| 0.703 ---------------+--------+--------+--------- RxCan1[139] Avg| 0.00| 0.0000| 0.021 Peak| | 0.6002| 0.984 ---------------+--------+--------+--------- RxCan1[156] Avg| 0.00| 0.0000| 0.024 Peak| | 0.1225| 0.479 ---------------+--------+--------+--------- RxCan1[160] Avg| 0.00| 0.0000| 0.028 Peak| | 0.6586| 1.376 ---------------+--------+--------+--------- RxCan1[165] Avg| 0.00| 0.0000| 0.027 Peak| | 0.6368| 1.132 ---------------+--------+--------+--------- RxCan1[167] Avg| 0.00| 0.0000| 0.024 Peak| | 1.3009| 1.067 ---------------+--------+--------+--------- RxCan1[171] Avg| 0.00| 0.0000| 0.022 Peak| | 0.6590| 4.320 ---------------+--------+--------+--------- RxCan1[178] Avg| 0.00| 0.0000| 0.023 Peak| | 0.1161| 0.311 ---------------+--------+--------+--------- RxCan1[179] Avg| 0.00| 0.0000| 0.024 Peak| | 0.1236| 0.536 ---------------+--------+--------+--------- RxCan1[180] Avg| 0.00| 0.0000| 0.022 Peak| | 0.6472| 1.193 ---------------+--------+--------+--------- RxCan1[185] Avg| 0.00| 0.0000| 0.022 Peak| | 0.6777| 1.385 ---------------+--------+--------+--------- RxCan1[1a0] Avg| 0.00| 0.0000| 0.022 Peak| | 0.6486| 2.276 ---------------+--------+--------+--------- RxCan1[1e0] Avg| 0.00| 0.0000| 0.023 Peak| | 0.6725| 1.376 ---------------+--------+--------+--------- RxCan1[1e4] Avg| 0.00| 0.0000| 0.027 Peak| | 0.7370| 1.266 ---------------+--------+--------+--------- RxCan1[1f0] Avg| 0.00| 0.0000| 0.024 Peak| | 0.4253| 0.753 ---------------+--------+--------+--------- RxCan1[200] Avg| 0.00| 0.0000| 0.025 Peak| | 0.6262| 0.791 ---------------+--------+--------+--------- RxCan1[202] Avg| 0.00| 0.0000| 0.021 Peak| | 1.2915| 1.257 ---------------+--------+--------+--------- RxCan1[204] Avg| 0.00| 0.0000| 0.022 Peak| | 1.2620| 1.010 ---------------+--------+--------+--------- RxCan1[213] Avg| 0.00| 0.0000| 0.022 Peak| | 0.6331| 1.185 ---------------+--------+--------+--------- RxCan1[214] Avg| 0.00| 0.0000| 0.023 Peak| | 0.9977| 34.527 ---------------+--------+--------+--------- RxCan1[217] Avg| 0.00| 0.0000| 0.024 Peak| | 1.2825| 1.328 ---------------+--------+--------+--------- RxCan1[218] Avg| 0.00| 0.0000| 0.022 Peak| | 0.6328| 1.110 ---------------+--------+--------+--------- RxCan1[230] Avg| 0.00| 0.0000| 0.019 Peak| | 0.6742| 5.119 ---------------+--------+--------+--------- RxCan1[240] Avg| 0.00| 0.0000| 0.022 Peak| | 0.1163| 0.343 ---------------+--------+--------+--------- RxCan1[242] Avg| 0.00| 0.0000| 0.025 Peak| | 0.3501| 1.015 ---------------+--------+--------+--------- RxCan1[24a] Avg| 0.00| 0.0000| 0.022 Peak| | 0.1212| 0.338 ---------------+--------+--------+--------- RxCan1[24b] Avg| 0.00| 0.0000| 0.023 Peak| | 0.1289| 0.330 ---------------+--------+--------+--------- RxCan1[24c] Avg| 0.00| 0.0000| 0.033 Peak| | 0.1714| 1.189 ---------------+--------+--------+--------- RxCan1[25a] Avg| 0.00| 0.0000| 0.024 Peak| | 0.1289| 0.510 ---------------+--------+--------+--------- RxCan1[25b] Avg| 0.00| 0.0000| 0.022 Peak| | 0.6685| 0.930 ---------------+--------+--------+--------- RxCan1[25c] Avg| 0.00| 0.0000| 0.027 Peak| | 1.3298| 2.670 ---------------+--------+--------+--------- RxCan1[260] Avg| 0.00| 0.0000| 0.023 Peak| | 0.1271| 0.401 ---------------+--------+--------+--------- RxCan1[270] Avg| 0.00| 0.0000| 0.022 Peak| | 0.6439| 0.898 ---------------+--------+--------+--------- RxCan1[280] Avg| 0.00| 0.0000| 0.023 Peak| | 0.6502| 1.156 ---------------+--------+--------+--------- RxCan1[2e4] Avg| 0.00| 0.0000| 0.035 Peak| | 0.3389| 0.811 ---------------+--------+--------+--------- RxCan1[2ec] Avg| 0.00| 0.0000| 0.027 Peak| | 0.1417| 0.784 ---------------+--------+--------+--------- RxCan1[2ed] Avg| 0.00| 0.0000| 0.024 Peak| | 0.1364| 0.746 ---------------+--------+--------+--------- RxCan1[2ee] Avg| 0.00| 0.0000| 0.024 Peak| | 0.1406| 0.965 ---------------+--------+--------+--------- RxCan1[312] Avg| 0.00| 0.0000| 0.023 Peak| | 0.1293| 0.978 ---------------+--------+--------+--------- RxCan1[326] Avg| 0.00| 0.0000| 0.024 Peak| | 0.1298| 0.518 ---------------+--------+--------+--------- RxCan1[336] Avg| 0.00| 0.0000| 0.028 Peak| | 0.0106| 0.329 ---------------+--------+--------+--------- RxCan1[352] Avg| 0.00| 0.0000| 0.030 Peak| | 0.1054| 0.800 ---------------+--------+--------+--------- RxCan1[355] Avg| 0.00| 0.0000| 0.027 Peak| | 0.0270| 0.546 ---------------+--------+--------+--------- RxCan1[35e] Avg| 0.00| 0.0000| 0.023 Peak| | 0.1288| 0.573 ---------------+--------+--------+--------- RxCan1[365] Avg| 0.00| 0.0000| 0.024 Peak| | 0.1297| 0.358 ---------------+--------+--------+--------- RxCan1[366] Avg| 0.00| 0.0000| 0.026 Peak| | 0.1429| 1.001 ---------------+--------+--------+--------- RxCan1[367] Avg| 0.00| 0.0000| 0.026 Peak| | 0.1472| 0.828 ---------------+--------+--------+--------- RxCan1[368] Avg| 0.00| 0.0000| 0.024 Peak| | 0.1323| 0.931 ---------------+--------+--------+--------- RxCan1[369] Avg| 0.00| 0.0000| 0.026 Peak| | 0.1498| 1.072 ---------------+--------+--------+--------- RxCan1[380] Avg| 0.00| 0.0000| 0.022 Peak| | 0.1285| 0.348 ---------------+--------+--------+--------- RxCan1[38b] Avg| 0.00| 0.0000| 0.021 Peak| | 0.3298| 1.168 ---------------+--------+--------+--------- RxCan1[3b3] Avg| 0.00| 0.0000| 0.025 Peak| | 0.1348| 0.920 ---------------+--------+--------+--------- RxCan1[400] Avg| 0.00| 0.0000| 0.022 Peak| | 0.0481| 0.445 ---------------+--------+--------+--------- RxCan1[405] Avg| 0.00| 0.0000| 0.034 Peak| | 0.0723| 0.473 ---------------+--------+--------+--------- RxCan1[40a] Avg| 0.00| 0.0000| 0.025 Peak| | 0.1040| 0.543 ---------------+--------+--------+--------- RxCan1[410] Avg| 0.00| 0.0000| 0.024 Peak| | 0.1339| 0.678 ---------------+--------+--------+--------- RxCan1[411] Avg| 0.00| 0.0000| 0.025 Peak| | 0.1376| 0.573 ---------------+--------+--------+--------- RxCan1[416] Avg| 0.00| 0.0000| 0.023 Peak| | 0.1284| 0.346 ---------------+--------+--------+--------- RxCan1[421] Avg| 0.00| 0.0000| 0.024 Peak| | 0.1323| 0.643 ---------------+--------+--------+--------- RxCan1[42d] Avg| 0.00| 0.0000| 0.023 Peak| | 0.1362| 1.146 ---------------+--------+--------+--------- RxCan1[42f] Avg| 0.00| 0.0000| 0.027 Peak| | 0.1503| 1.762 ---------------+--------+--------+--------- RxCan1[430] Avg| 0.00| 0.0000| 0.023 Peak| | 0.1352| 0.347 ---------------+--------+--------+--------- RxCan1[434] Avg| 0.00| 0.0000| 0.024 Peak| | 0.1312| 0.580 ---------------+--------+--------+--------- RxCan1[435] Avg| 0.00| 0.0000| 0.029 Peak| | 0.1109| 1.133 ---------------+--------+--------+--------- RxCan1[43e] Avg| 0.00| 0.0000| 0.023 Peak| | 0.2776| 0.686 ---------------+--------+--------+--------- RxCan1[440] Avg| 0.00| 0.0000| 0.022 Peak| | 0.0118| 0.276 ---------------+--------+--------+--------- RxCan1[465] Avg| 0.00| 0.0000| 0.022 Peak| | 0.0118| 0.279 ---------------+--------+--------+--------- RxCan1[466] Avg| 0.00| 0.0000| 0.023 Peak| | 0.0123| 0.310 ---------------+--------+--------+--------- RxCan1[467] Avg| 0.00| 0.0000| 0.025 Peak| | 0.0132| 0.314 ---------------+--------+--------+--------- RxCan1[472] Avg| 0.00| 0.0000| 0.101 Peak| | 0.0307| 1.105 ---------------+--------+--------+--------- RxCan1[473] Avg| 0.00| 0.0000| 0.051 Peak| | 0.0107| 0.575 ---------------+--------+--------+--------- RxCan1[474] Avg| 0.00| 0.0000| 0.024 Peak| | 0.0097| 0.289 ---------------+--------+--------+--------- RxCan1[475] Avg| 0.00| 0.0000| 0.023 Peak| | 0.0220| 0.327 ---------------+--------+--------+--------- RxCan1[476] Avg| 0.00| 0.0000| 0.050 Peak| | 0.0762| 5.329 ---------------+--------+--------+--------- RxCan1[477] Avg| 0.00| 0.0000| 0.032 Peak| | 0.0283| 0.669 ---------------+--------+--------+--------- RxCan1[595] Avg| 0.00| 0.0000| 0.026 Peak| | 0.0103| 0.297 ---------------+--------+--------+--------- RxCan1[59e] Avg| 0.00| 0.0000| 0.022 Peak| | 0.0114| 0.263 ---------------+--------+--------+--------- RxCan1[5a2] Avg| 0.00| 0.0000| 0.026 Peak| | 0.0119| 0.505 ---------------+--------+--------+--------- RxCan1[5ba] Avg| 0.00| 0.0000| 0.025 Peak| | 0.0139| 0.549 ---------------+--------+--------+--------- RxCan2[020] Avg| 0.00| 0.0000| 0.026 Peak| | 0.4923| 1.133 ---------------+--------+--------+--------- RxCan2[030] Avg| 0.00| 0.0000| 0.023 Peak| | 0.3297| 1.136 ---------------+--------+--------+--------- RxCan2[03a] Avg| 0.00| 0.0000| 0.022 Peak| | 0.2792| 1.275 ---------------+--------+--------+--------- RxCan2[040] Avg| 0.00| 0.0000| 0.023 Peak| | 0.2834| 1.080 ---------------+--------+--------+--------- RxCan2[060] Avg| 0.00| 0.0000| 0.029 Peak| | 0.3037| 0.991 ---------------+--------+--------+--------- RxCan2[070] Avg| 0.00| 0.0000| 0.025 Peak| | 0.2291| 0.460 ---------------+--------+--------+--------- RxCan2[080] Avg| 0.00| 0.0000| 0.043 Peak| | 0.4015| 1.007 ---------------+--------+--------+--------- RxCan2[083] Avg| 0.00| 0.0000| 0.026 Peak| | 0.2957| 0.788 ---------------+--------+--------+--------- RxCan2[090] Avg| 0.00| 0.0000| 0.027 Peak| | 0.3951| 1.231 ---------------+--------+--------+--------- RxCan2[0a0] Avg| 0.00| 0.0000| 0.026 Peak| | 0.2560| 0.722 ---------------+--------+--------+--------- RxCan2[100] Avg| 0.00| 0.0000| 0.046 Peak| | 0.4506| 21.961 ---------------+--------+--------+--------- RxCan2[108] Avg| 0.00| 0.0000| 0.024 Peak| | 0.3713| 1.125 ---------------+--------+--------+--------- RxCan2[110] Avg| 0.00| 0.0000| 0.029 Peak| | 0.2443| 0.755 ---------------+--------+--------+--------- RxCan2[130] Avg| 0.00| 0.0000| 0.023 Peak| | 0.2052| 1.097 ---------------+--------+--------+--------- RxCan2[150] Avg| 0.00| 0.0000| 0.023 Peak| | 0.2246| 0.371 ---------------+--------+--------+--------- RxCan2[160] Avg| 0.00| 0.0000| 0.024 Peak| | 0.0755| 1.125 ---------------+--------+--------+--------- RxCan2[180] Avg| 0.00| 0.0000| 0.023 Peak| | 0.2350| 0.936 ---------------+--------+--------+--------- RxCan2[190] Avg| 0.00| 0.0000| 0.022 Peak| | 0.2275| 0.592 ---------------+--------+--------+--------- RxCan2[1a0] Avg| 0.00| 0.0000| 0.025 Peak| | 0.0125| 0.273 ---------------+--------+--------+--------- RxCan2[1a4] Avg| 0.00| 0.0000| 0.022 Peak| | 0.2806| 0.632 ---------------+--------+--------+--------- RxCan2[1a8] Avg| 0.00| 0.0000| 0.022 Peak| | 0.1683| 0.740 ---------------+--------+--------+--------- RxCan2[1b0] Avg| 0.00| 0.0000| 0.023 Peak| | 0.1360| 0.490 ---------------+--------+--------+--------- RxCan2[1b4] Avg| 0.00| 0.0000| 0.027 Peak| | 0.1556| 1.119 ---------------+--------+--------+--------- RxCan2[1b8] Avg| 0.00| 0.0000| 0.022 Peak| | 0.1704| 0.616 ---------------+--------+--------+--------- RxCan2[1c0] Avg| 0.00| 0.0000| 0.023 Peak| | 0.1317| 0.488 ---------------+--------+--------+--------- RxCan2[1e0] Avg| 0.00| 0.0000| 0.025 Peak| | 0.1460| 0.675 ---------------+--------+--------+--------- RxCan2[215] Avg| 0.00| 0.0000| 0.023 Peak| | 0.1191| 0.567 ---------------+--------+--------+--------- RxCan2[217] Avg| 0.00| 0.0000| 0.023 Peak| | 0.1167| 0.869 ---------------+--------+--------+--------- RxCan2[220] Avg| 0.00| 0.0000| 0.023 Peak| | 0.0918| 0.313 ---------------+--------+--------+--------- RxCan2[225] Avg| 0.00| 0.0000| 0.025 Peak| | 0.3635| 1.018 ---------------+--------+--------+--------- RxCan2[230] Avg| 0.00| 0.0000| 0.057 Peak| | 0.2192| 1.063 ---------------+--------+--------+--------- RxCan2[240] Avg| 0.00| 0.0000| 0.023 Peak| | 0.1173| 0.760 ---------------+--------+--------+--------- RxCan2[241] Avg| 0.00| 0.0000| 0.022 Peak| | 0.2830| 1.144 ---------------+--------+--------+--------- RxCan2[250] Avg| 0.00| 0.0000| 0.026 Peak| | 0.0701| 0.698 ---------------+--------+--------+--------- RxCan2[255] Avg| 0.00| 0.0000| 0.022 Peak| | 0.1755| 1.063 ---------------+--------+--------+--------- RxCan2[265] Avg| 0.00| 0.0000| 0.024 Peak| | 0.1771| 0.729 ---------------+--------+--------+--------- RxCan2[270] Avg| 0.00| 0.0000| 0.023 Peak| | 0.0667| 0.307 ---------------+--------+--------+--------- RxCan2[290] Avg| 0.00| 0.0000| 0.022 Peak| | 0.0410| 0.280 ---------------+--------+--------+--------- RxCan2[295] Avg| 0.00| 0.0000| 0.023 Peak| | 0.0881| 0.299 ---------------+--------+--------+--------- RxCan2[2a0] Avg| 0.00| 0.0000| 0.023 Peak| | 0.0420| 0.268 ---------------+--------+--------+--------- RxCan2[2a7] Avg| 0.00| 0.0000| 0.021 Peak| | 0.1716| 0.454 ---------------+--------+--------+--------- RxCan2[2b0] Avg| 0.00| 0.0000| 0.023 Peak| | 0.0424| 0.300 ---------------+--------+--------+--------- RxCan2[2c0] Avg| 0.00| 0.0000| 0.024 Peak| | 0.0470| 0.298 ---------------+--------+--------+--------- RxCan2[2e0] Avg| 0.00| 0.0000| 0.030 Peak| | 0.0324| 1.152 ---------------+--------+--------+--------- RxCan2[2f0] Avg| 0.00| 0.0000| 0.024 Peak| | 0.0229| 0.359 ---------------+--------+--------+--------- RxCan2[2f5] Avg| 0.00| 0.0000| 0.026 Peak| | 0.1882| 0.673 ---------------+--------+--------+--------- RxCan2[300] Avg| 0.00| 0.0000| 0.022 Peak| | 0.0186| 0.263 ---------------+--------+--------+--------- RxCan2[310] Avg| 0.00| 0.0000| 0.024 Peak| | 0.0210| 0.265 ---------------+--------+--------+--------- RxCan2[320] Avg| 0.00| 0.0000| 0.025 Peak| | 0.0207| 0.354 ---------------+--------+--------+--------- RxCan2[326] Avg| 0.00| 0.0000| 0.023 Peak| | 0.1466| 0.686 ---------------+--------+--------+--------- RxCan2[330] Avg| 0.00| 0.0000| 0.022 Peak| | 0.4580| 0.708 ---------------+--------+--------+--------- RxCan2[340] Avg| 0.00| 0.0000| 0.031 Peak| | 0.1621| 0.785 ---------------+--------+--------+--------- RxCan2[345] Avg| 0.00| 0.0000| 0.021 Peak| | 0.0199| 0.261 ---------------+--------+--------+--------- RxCan2[35e] Avg| 0.00| 0.0000| 0.023 Peak| | 0.0686| 0.449 ---------------+--------+--------+--------- RxCan2[360] Avg| 0.00| 0.0000| 0.025 Peak| | 0.0204| 0.289 ---------------+--------+--------+--------- RxCan2[361] Avg| 0.00| 0.0000| 0.022 Peak| | 0.1166| 0.316 ---------------+--------+--------+--------- RxCan2[363] Avg| 0.00| 0.0000| 0.023 Peak| | 0.0146| 0.304 ---------------+--------+--------+--------- RxCan2[370] Avg| 0.00| 0.0000| 0.024 Peak| | 0.0099| 0.278 ---------------+--------+--------+--------- RxCan2[381] Avg| 0.00| 0.0000| 0.025 Peak| | 0.0468| 0.459 ---------------+--------+--------+--------- RxCan2[3a0] Avg| 0.00| 0.0000| 0.021 Peak| | 0.2339| 0.617 ---------------+--------+--------+--------- RxCan2[3d0] Avg| 0.00| 0.0000| 0.022 Peak| | 0.1351| 0.351 ---------------+--------+--------+--------- RxCan2[3d5] Avg| 0.00| 0.0000| 0.023 Peak| | 0.0796| 0.692 ---------------+--------+--------+--------- RxCan2[400] Avg| 0.00| 0.0000| 0.023 Peak| | 0.0537| 0.307 ---------------+--------+--------+--------- RxCan2[405] Avg| 0.00| 0.0000| 0.021 Peak| | 0.0513| 0.303 ---------------+--------+--------+--------- RxCan2[40a] Avg| 0.00| 0.0000| 0.022 Peak| | 0.1099| 0.313 ---------------+--------+--------+--------- RxCan2[415] Avg| 0.00| 0.0000| 0.022 Peak| | 0.0204| 0.251 ---------------+--------+--------+--------- RxCan2[435] Avg| 0.00| 0.0000| 0.028 Peak| | 0.0113| 0.342 ---------------+--------+--------+--------- RxCan2[440] Avg| 0.00| 0.0000| 0.027 Peak| | 0.0110| 0.299 ---------------+--------+--------+--------- RxCan2[465] Avg| 0.00| 0.0000| 0.023 Peak| | 0.0122| 0.295 ---------------+--------+--------+--------- RxCan2[466] Avg| 0.00| 0.0000| 0.022 Peak| | 0.0117| 0.267 ---------------+--------+--------+--------- RxCan2[467] Avg| 0.00| 0.0000| 0.022 Peak| | 0.0164| 0.325 ---------------+--------+--------+--------- RxCan2[501] Avg| 0.00| 0.0000| 0.023 Peak| | 0.0236| 0.276 ---------------+--------+--------+--------- RxCan2[503] Avg| 0.00| 0.0000| 0.023 Peak| | 0.0248| 0.349 ---------------+--------+--------+--------- RxCan2[504] Avg| 0.00| 0.0000| 0.023 Peak| | 0.0230| 0.312 ---------------+--------+--------+--------- RxCan2[505] Avg| 0.00| 0.0000| 0.025 Peak| | 0.0256| 0.310 ---------------+--------+--------+--------- RxCan2[508] Avg| 0.00| 0.0000| 0.023 Peak| | 0.0281| 0.329 ---------------+--------+--------+--------- RxCan2[511] Avg| 0.00| 0.0000| 0.022 Peak| | 0.0232| 0.282 ---------------+--------+--------+--------- RxCan2[51e] Avg| 0.00| 0.0000| 0.023 Peak| | 0.0248| 0.298 ---------------+--------+--------+--------- RxCan2[581] Avg| 0.00| 0.0000| 0.025 Peak| | 0.0166| 0.286 ===============+========+========+========= Total Avg| 0.00| 0.0000| 43.563
At the same time, calling poller times on, poller times status causes the bus to crash, although no polls are actively being sent at all.
Cheers, Simon _______________________________________________ OvmsDev mailing list OvmsDev@lists.openvehicles.com http://lists.openvehicles.com/mailman/listinfo/ovmsdev
_______________________________________________ OvmsDev mailing list OvmsDev@lists.openvehicles.com http://lists.openvehicles.com/mailman/listinfo/ovmsdev
_______________________________________________ OvmsDev mailing list OvmsDev@lists.openvehicles.com http://lists.openvehicles.com/mailman/listinfo/ovmsdev
_______________________________________________ OvmsDev mailing list OvmsDev@lists.openvehicles.com http://lists.openvehicles.com/mailman/listinfo/ovmsdev
-- Michael Balzer * Am Rahmen 5 * D-58313 Herdecke Fon 02330 9104094 * Handy 0176 20698926
_______________________________________________ OvmsDev mailing list OvmsDev@lists.openvehicles.com http://lists.openvehicles.com/mailman/listinfo/ovmsdev
_______________________________________________ OvmsDev mailing list OvmsDev@lists.openvehicles.com http://lists.openvehicles.com/mailman/listinfo/ovmsdev
-- Michael Balzer * Am Rahmen 5 * D-58313 Herdecke Fon 02330 9104094 * Handy 0176 20698926
Since the following email I have high confidence the issue on the Leaf is related/caused by the poller as there has been no further occurrence and Chris has also experienced the car going to neutral on the new poller firmware. .... I haven't ruled out it being a fault with my car yet. Shortly after it faulted the car was run into so has been off the road for sometime, my first step was to replace 12V battery. The ovms unit is now unplugged and if it does not fault over the next month while driving I'll be reasonably confident it's ovms related. Not sure which firmware version the poller updates were included in but it was only after upgrading to it that the errors occurred (which could be coincidental however it has faulted twice more both on version 3.3.004-141-gf729d82c). For periods where I reverted to 3.3.003 it was fine. It might be useful to have an extra option on the enable can write to only enable it when the car is parked/charging. On Wed, 15 Jan 2025, 11:11 pm Michael Balzer via OvmsDev, < ovmsdev@lists.openvehicles.com> wrote:
Derek, can you comment on this? Do you still have the issue mentioned?
Speaking of the Leaf, the code there actually does something fishy in `CommandWakeup()`:
unsigned char data = 0; … m_can1->WriteStandard(0x5C0, *8*, &data); //Wakes up the VCM (by spoofing empty battery request heating)
And there are CAN transmissions from command execution in the Leaf code, so to be sure there is no TX, listen mode is needed there as well.
Regarding CAN trace, you can try with the monitor channel and use the USB console to record the log output. That way you should be able to at least rule out there are regular transmissions -- assuming not every TX will cause an immediate crash.
Another / probably better option: when in listen mode, the log will also tell you about TX attempts, as the driver will issue a warning on each.
The CAN monitor log may also tell you about bus errors detected.
Regards, Michael
Am 15.01.25 um 10:44 schrieb Simon Ehlen via OvmsDev:
There is at least one more Leaf from Derek that has also ended up in limp mode since the new poller. There, too, no polling was actually carried out while driving. I'm not familiar with the framework at all, but does this perhaps offer you enough of an approach to recognize a commonality?
Unfortunately I do not have a tool to create a CAN trace. I can't use the OVMS for this, as it no longer responds after a bus crash until I have disconnected it from the OBD and plugged it back in.
Cheers, Simon
Am 15.01.2025 um 10:18 schrieb Michael Balzer via OvmsDev:
The frame acknowledging is done automatically by the CAN transceiver when in active mode, this is part of the CAN protocol to indicate bit errors to the sender.
So normally a failure of the system to process received frames fast enough cannot cause any issue on the bus. But the ESP32 has a range of known hardware issues, especially in the embedded CAN transceiver, I wouldn't be surprised if there are more, or if our driver lacks some workaround for these.
Maybe the new poller has some bug that causes false transmissions from process data frames received. But many vehicles send process data frames, and we've had no issue reports like this on any of them, and ECUs also normally simply ignore out of sequence protocol frames.
You could record a CAN trace to see if there are transmissions, and what kind. If you don't poll and don't send frames from your code, there should be none. If the bus still crashes, that would be an indicator for something going wrong in the transceiver.
Regards, Michael
Am 15.01.25 um 07:15 schrieb Simon Ehlen via OvmsDev:
Thanks Mark for the explanation. So does this mean that OVMS tries to acknowledge all incoming messages in active mode? This seems to me to clearly exceed the capacity of OVMS with the mass of incoming messages.
In fact, I am currently opening the bus in active mode, as I was hoping to get my code to revive the BMS in OVMS to work. However, unlike the other data, I only get the cell voltages when I actively poll them. To be on the safe side, I will now open the bus in read mode again.
However, I am still wondering what in the poller change has altered the OVMS in such a way that the bus is now crashing completely. Currently I have undone the changes since february 2024, this only concerns code from the public repository, there was no change from me in that period. Now the OVMS is running stable again and there are neither queue overflows nor bus crashes.
I had also previously increased the following queue sizes, but unfortunately this was not successful: CONFIG_OVMS_HW_EVENT_QUEUE_SIZE=120 CONFIG_OVMS_HW_CAN_RX_QUEUE_SIZE=80 CONFIG_OVMS_VEHICLE_CAN_RX_QUEUE_SIZE=80
Cheers, Simon
Am 15.01.2025 um 02:08 schrieb Mark Webb-Johnson:
Note sure if this helps, but some comments:
- Remember than CAN protocol in normal mode is an ‘active’ protocol. Nodes on the bus are actively acknowledging messages (and that includes OVMS), even if they never write messages. So in normal mode there is no absolute ‘read access’. For example, opening the CAN port at the wrong baud rate, even if not writing messages, will mess up the bus.
- However, if you open the CAN port in ‘listen’ mode, then it is truly read-only. In that mode it will not acknowledge messages, and cannot write on the bus at all. I’ve never seen an OVMS mess up a bus in listen mode, even if the baud rate is wrong. I think the only way for that to happen would be a hardware layer issue (cabling, termination, etc).
Regards, Mark.
On 15 Jan 2025, at 6:30 AM, Simon Ehlen via OvmsDev <ovmsdev@lists.openvehicles.com> <ovmsdev@lists.openvehicles.com> wrote:
But what is the reason that a read access to the bus can cause the bus to crash? This is not critical during charging, it just aborts the charging process with an error. While driving, this results in a “stop safely now” error message on the dashboard and the engine is switched off immediately.
Cheers, Simon
Am 14.01.2025 um 23:22 schrieb Michael Geddes via OvmsDev:
You may need to increase the queue size for the poll task queue.
The poller still handles the bus to vehicle notifications even if it is off.
Any poller logging on such an intensive load of can messages is likely to be a problem. This is part of the reason it is flagged off.
The total % looks wrong :/
//.ichael
On Wed, 15 Jan 2025, 03:17 Simon Ehlen via OvmsDev, < ovmsdev@lists.openvehicles.com> wrote:
Hi,
I finally got around to merging my code with the current master (previous merge february 2024). I have rebuilt my code for a Ford Focus Electric so that it uses the new OvmsPoller class.
However, I now see a lot of entries like this in my log:
I (246448) vehicle-poll: Poller[Frame]: RX Task Queue Overflow Run 8 I (246448) vehicle-poll: Poller[Frame]: RX Task Queue Overflow Run 3 I (246448) vehicle-poll: Poller[Frame]: RX Task Queue Overflow Run 1 I (246448) vehicle-poll: Poller[Frame]: RX Task Queue Overflow Run 2 I (246448) vehicle-poll: Poller[Frame]: RX Task Queue Overflow Run 1 I (246448) vehicle-poll: Poller[Frame]: RX Task Queue Overflow Run 2 I (246448) vehicle-poll: Poller[Frame]: RX Task Queue Overflow Run 1 I (246448) vehicle-poll: Poller[Frame]: RX Task Queue Overflow Run 1 I (254448) vehicle-poll: Poller[Frame]: RX Task Queue Overflow Run 24 I (254448) vehicle-poll: Poller[Frame]: RX Task Queue Overflow Run 1 I (254448) vehicle-poll: Poller[Frame]: RX Task Queue Overflow Run 1 I (254448) vehicle-poll: Poller[Frame]: RX Task Queue Overflow Run 1 I (254448) vehicle-poll: Poller[Frame]: RX Task Queue Overflow Run 1 I (254448) vehicle-poll: Poller[Frame]: RX Task Queue Overflow Run 1 I (254448) vehicle-poll: Poller[Frame]: RX Task Queue Overflow Run 1
Was this message just hidden before or do I need to make further adjustments to my code?
My code currently does not use active polling but reads on the busses (IncomingFrameCanX) on certain modules.
When I look at poller times status, it looks very extensive to me...
OVMS# poller times status Poller timing is: on Type | count | Utlztn | Time | per s | [%] | [ms] ---------------+--------+--------+--------- Poll:PRI Avg| 0.00| 0.0000| 0.003 Peak| | 0.0014| 0.041 ---------------+--------+--------+--------- RxCan1[010] Avg| 0.00| 0.0000| 0.020 Peak| | 1.2217| 1.089 ---------------+--------+--------+--------- RxCan1[030] Avg| 0.00| 0.0000| 0.024 Peak| | 1.2193| 1.241 ---------------+--------+--------+--------- RxCan1[041] Avg| 0.00| 0.0000| 0.023 Peak| | 0.6460| 1.508 ---------------+--------+--------+--------- RxCan1[049] Avg| 0.00| 0.0000| 0.024 Peak| | 0.6320| 0.630 ---------------+--------+--------+--------- RxCan1[04c] Avg| 0.00| 0.0000| 0.023 Peak| | 0.6430| 1.474 ---------------+--------+--------+--------- RxCan1[04d] Avg| 0.00| 0.0000| 0.022 Peak| | 1.2987| 1.359 ---------------+--------+--------+--------- RxCan1[076] Avg| 0.00| 0.0000| 0.072 Peak| | 0.7818| 15.221 ---------------+--------+--------+--------- RxCan1[077] Avg| 0.00| 0.0000| 0.022 Peak| | 0.6274| 0.955 ---------------+--------+--------+--------- RxCan1[07a] Avg| 0.00| 0.0000| 0.039 Peak| | 1.7602| 1.684 ---------------+--------+--------+--------- RxCan1[07d] Avg| 0.00| 0.0000| 0.023 Peak| | 0.6621| 1.913 ---------------+--------+--------+--------- RxCan1[0c8] Avg| 0.00| 0.0000| 0.026 Peak| | 0.6292| 1.412 ---------------+--------+--------+--------- RxCan1[11a] Avg| 0.00| 0.0000| 0.023 Peak| | 1.2635| 1.508 ---------------+--------+--------+--------- RxCan1[130] Avg| 0.00| 0.0000| 0.024 Peak| | 0.6548| 0.703 ---------------+--------+--------+--------- RxCan1[139] Avg| 0.00| 0.0000| 0.021 Peak| | 0.6002| 0.984 ---------------+--------+--------+--------- RxCan1[156] Avg| 0.00| 0.0000| 0.024 Peak| | 0.1225| 0.479 ---------------+--------+--------+--------- RxCan1[160] Avg| 0.00| 0.0000| 0.028 Peak| | 0.6586| 1.376 ---------------+--------+--------+--------- RxCan1[165] Avg| 0.00| 0.0000| 0.027 Peak| | 0.6368| 1.132 ---------------+--------+--------+--------- RxCan1[167] Avg| 0.00| 0.0000| 0.024 Peak| | 1.3009| 1.067 ---------------+--------+--------+--------- RxCan1[171] Avg| 0.00| 0.0000| 0.022 Peak| | 0.6590| 4.320 ---------------+--------+--------+--------- RxCan1[178] Avg| 0.00| 0.0000| 0.023 Peak| | 0.1161| 0.311 ---------------+--------+--------+--------- RxCan1[179] Avg| 0.00| 0.0000| 0.024 Peak| | 0.1236| 0.536 ---------------+--------+--------+--------- RxCan1[180] Avg| 0.00| 0.0000| 0.022 Peak| | 0.6472| 1.193 ---------------+--------+--------+--------- RxCan1[185] Avg| 0.00| 0.0000| 0.022 Peak| | 0.6777| 1.385 ---------------+--------+--------+--------- RxCan1[1a0] Avg| 0.00| 0.0000| 0.022 Peak| | 0.6486| 2.276 ---------------+--------+--------+--------- RxCan1[1e0] Avg| 0.00| 0.0000| 0.023 Peak| | 0.6725| 1.376 ---------------+--------+--------+--------- RxCan1[1e4] Avg| 0.00| 0.0000| 0.027 Peak| | 0.7370| 1.266 ---------------+--------+--------+--------- RxCan1[1f0] Avg| 0.00| 0.0000| 0.024 Peak| | 0.4253| 0.753 ---------------+--------+--------+--------- RxCan1[200] Avg| 0.00| 0.0000| 0.025 Peak| | 0.6262| 0.791 ---------------+--------+--------+--------- RxCan1[202] Avg| 0.00| 0.0000| 0.021 Peak| | 1.2915| 1.257 ---------------+--------+--------+--------- RxCan1[204] Avg| 0.00| 0.0000| 0.022 Peak| | 1.2620| 1.010 ---------------+--------+--------+--------- RxCan1[213] Avg| 0.00| 0.0000| 0.022 Peak| | 0.6331| 1.185 ---------------+--------+--------+--------- RxCan1[214] Avg| 0.00| 0.0000| 0.023 Peak| | 0.9977| 34.527 ---------------+--------+--------+--------- RxCan1[217] Avg| 0.00| 0.0000| 0.024 Peak| | 1.2825| 1.328 ---------------+--------+--------+--------- RxCan1[218] Avg| 0.00| 0.0000| 0.022 Peak| | 0.6328| 1.110 ---------------+--------+--------+--------- RxCan1[230] Avg| 0.00| 0.0000| 0.019 Peak| | 0.6742| 5.119 ---------------+--------+--------+--------- RxCan1[240] Avg| 0.00| 0.0000| 0.022 Peak| | 0.1163| 0.343 ---------------+--------+--------+--------- RxCan1[242] Avg| 0.00| 0.0000| 0.025 Peak| | 0.3501| 1.015 ---------------+--------+--------+--------- RxCan1[24a] Avg| 0.00| 0.0000| 0.022 Peak| | 0.1212| 0.338 ---------------+--------+--------+--------- RxCan1[24b] Avg| 0.00| 0.0000| 0.023 Peak| | 0.1289| 0.330 ---------------+--------+--------+--------- RxCan1[24c] Avg| 0.00| 0.0000| 0.033 Peak| | 0.1714| 1.189 ---------------+--------+--------+--------- RxCan1[25a] Avg| 0.00| 0.0000| 0.024 Peak| | 0.1289| 0.510 ---------------+--------+--------+--------- RxCan1[25b] Avg| 0.00| 0.0000| 0.022 Peak| | 0.6685| 0.930 ---------------+--------+--------+--------- RxCan1[25c] Avg| 0.00| 0.0000| 0.027 Peak| | 1.3298| 2.670 ---------------+--------+--------+--------- RxCan1[260] Avg| 0.00| 0.0000| 0.023 Peak| | 0.1271| 0.401 ---------------+--------+--------+--------- RxCan1[270] Avg| 0.00| 0.0000| 0.022 Peak| | 0.6439| 0.898 ---------------+--------+--------+--------- RxCan1[280] Avg| 0.00| 0.0000| 0.023 Peak| | 0.6502| 1.156 ---------------+--------+--------+--------- RxCan1[2e4] Avg| 0.00| 0.0000| 0.035 Peak| | 0.3389| 0.811 ---------------+--------+--------+--------- RxCan1[2ec] Avg| 0.00| 0.0000| 0.027 Peak| | 0.1417| 0.784 ---------------+--------+--------+--------- RxCan1[2ed] Avg| 0.00| 0.0000| 0.024 Peak| | 0.1364| 0.746 ---------------+--------+--------+--------- RxCan1[2ee] Avg| 0.00| 0.0000| 0.024 Peak| | 0.1406| 0.965 ---------------+--------+--------+--------- RxCan1[312] Avg| 0.00| 0.0000| 0.023 Peak| | 0.1293| 0.978 ---------------+--------+--------+--------- RxCan1[326] Avg| 0.00| 0.0000| 0.024 Peak| | 0.1298| 0.518 ---------------+--------+--------+--------- RxCan1[336] Avg| 0.00| 0.0000| 0.028 Peak| | 0.0106| 0.329 ---------------+--------+--------+--------- RxCan1[352] Avg| 0.00| 0.0000| 0.030 Peak| | 0.1054| 0.800 ---------------+--------+--------+--------- RxCan1[355] Avg| 0.00| 0.0000| 0.027 Peak| | 0.0270| 0.546 ---------------+--------+--------+--------- RxCan1[35e] Avg| 0.00| 0.0000| 0.023 Peak| | 0.1288| 0.573 ---------------+--------+--------+--------- RxCan1[365] Avg| 0.00| 0.0000| 0.024 Peak| | 0.1297| 0.358 ---------------+--------+--------+--------- RxCan1[366] Avg| 0.00| 0.0000| 0.026 Peak| | 0.1429| 1.001 ---------------+--------+--------+--------- RxCan1[367] Avg| 0.00| 0.0000| 0.026 Peak| | 0.1472| 0.828 ---------------+--------+--------+--------- RxCan1[368] Avg| 0.00| 0.0000| 0.024 Peak| | 0.1323| 0.931 ---------------+--------+--------+--------- RxCan1[369] Avg| 0.00| 0.0000| 0.026 Peak| | 0.1498| 1.072 ---------------+--------+--------+--------- RxCan1[380] Avg| 0.00| 0.0000| 0.022 Peak| | 0.1285| 0.348 ---------------+--------+--------+--------- RxCan1[38b] Avg| 0.00| 0.0000| 0.021 Peak| | 0.3298| 1.168 ---------------+--------+--------+--------- RxCan1[3b3] Avg| 0.00| 0.0000| 0.025 Peak| | 0.1348| 0.920 ---------------+--------+--------+--------- RxCan1[400] Avg| 0.00| 0.0000| 0.022 Peak| | 0.0481| 0.445 ---------------+--------+--------+--------- RxCan1[405] Avg| 0.00| 0.0000| 0.034 Peak| | 0.0723| 0.473 ---------------+--------+--------+--------- RxCan1[40a] Avg| 0.00| 0.0000| 0.025 Peak| | 0.1040| 0.543 ---------------+--------+--------+--------- RxCan1[410] Avg| 0.00| 0.0000| 0.024 Peak| | 0.1339| 0.678 ---------------+--------+--------+--------- RxCan1[411] Avg| 0.00| 0.0000| 0.025 Peak| | 0.1376| 0.573 ---------------+--------+--------+--------- RxCan1[416] Avg| 0.00| 0.0000| 0.023 Peak| | 0.1284| 0.346 ---------------+--------+--------+--------- RxCan1[421] Avg| 0.00| 0.0000| 0.024 Peak| | 0.1323| 0.643 ---------------+--------+--------+--------- RxCan1[42d] Avg| 0.00| 0.0000| 0.023 Peak| | 0.1362| 1.146 ---------------+--------+--------+--------- RxCan1[42f] Avg| 0.00| 0.0000| 0.027 Peak| | 0.1503| 1.762 ---------------+--------+--------+--------- RxCan1[430] Avg| 0.00| 0.0000| 0.023 Peak| | 0.1352| 0.347 ---------------+--------+--------+--------- RxCan1[434] Avg| 0.00| 0.0000| 0.024 Peak| | 0.1312| 0.580 ---------------+--------+--------+--------- RxCan1[435] Avg| 0.00| 0.0000| 0.029 Peak| | 0.1109| 1.133 ---------------+--------+--------+--------- RxCan1[43e] Avg| 0.00| 0.0000| 0.023 Peak| | 0.2776| 0.686 ---------------+--------+--------+--------- RxCan1[440] Avg| 0.00| 0.0000| 0.022 Peak| | 0.0118| 0.276 ---------------+--------+--------+--------- RxCan1[465] Avg| 0.00| 0.0000| 0.022 Peak| | 0.0118| 0.279 ---------------+--------+--------+--------- RxCan1[466] Avg| 0.00| 0.0000| 0.023 Peak| | 0.0123| 0.310 ---------------+--------+--------+--------- RxCan1[467] Avg| 0.00| 0.0000| 0.025 Peak| | 0.0132| 0.314 ---------------+--------+--------+--------- RxCan1[472] Avg| 0.00| 0.0000| 0.101 Peak| | 0.0307| 1.105 ---------------+--------+--------+--------- RxCan1[473] Avg| 0.00| 0.0000| 0.051 Peak| | 0.0107| 0.575 ---------------+--------+--------+--------- RxCan1[474] Avg| 0.00| 0.0000| 0.024 Peak| | 0.0097| 0.289 ---------------+--------+--------+--------- RxCan1[475] Avg| 0.00| 0.0000| 0.023 Peak| | 0.0220| 0.327 ---------------+--------+--------+--------- RxCan1[476] Avg| 0.00| 0.0000| 0.050 Peak| | 0.0762| 5.329 ---------------+--------+--------+--------- RxCan1[477] Avg| 0.00| 0.0000| 0.032 Peak| | 0.0283| 0.669 ---------------+--------+--------+--------- RxCan1[595] Avg| 0.00| 0.0000| 0.026 Peak| | 0.0103| 0.297 ---------------+--------+--------+--------- RxCan1[59e] Avg| 0.00| 0.0000| 0.022 Peak| | 0.0114| 0.263 ---------------+--------+--------+--------- RxCan1[5a2] Avg| 0.00| 0.0000| 0.026 Peak| | 0.0119| 0.505 ---------------+--------+--------+--------- RxCan1[5ba] Avg| 0.00| 0.0000| 0.025 Peak| | 0.0139| 0.549 ---------------+--------+--------+--------- RxCan2[020] Avg| 0.00| 0.0000| 0.026 Peak| | 0.4923| 1.133 ---------------+--------+--------+--------- RxCan2[030] Avg| 0.00| 0.0000| 0.023 Peak| | 0.3297| 1.136 ---------------+--------+--------+--------- RxCan2[03a] Avg| 0.00| 0.0000| 0.022 Peak| | 0.2792| 1.275 ---------------+--------+--------+--------- RxCan2[040] Avg| 0.00| 0.0000| 0.023 Peak| | 0.2834| 1.080 ---------------+--------+--------+--------- RxCan2[060] Avg| 0.00| 0.0000| 0.029 Peak| | 0.3037| 0.991 ---------------+--------+--------+--------- RxCan2[070] Avg| 0.00| 0.0000| 0.025 Peak| | 0.2291| 0.460 ---------------+--------+--------+--------- RxCan2[080] Avg| 0.00| 0.0000| 0.043 Peak| | 0.4015| 1.007 ---------------+--------+--------+--------- RxCan2[083] Avg| 0.00| 0.0000| 0.026 Peak| | 0.2957| 0.788 ---------------+--------+--------+--------- RxCan2[090] Avg| 0.00| 0.0000| 0.027 Peak| | 0.3951| 1.231 ---------------+--------+--------+--------- RxCan2[0a0] Avg| 0.00| 0.0000| 0.026 Peak| | 0.2560| 0.722 ---------------+--------+--------+--------- RxCan2[100] Avg| 0.00| 0.0000| 0.046 Peak| | 0.4506| 21.961 ---------------+--------+--------+--------- RxCan2[108] Avg| 0.00| 0.0000| 0.024 Peak| | 0.3713| 1.125 ---------------+--------+--------+--------- RxCan2[110] Avg| 0.00| 0.0000| 0.029 Peak| | 0.2443| 0.755 ---------------+--------+--------+--------- RxCan2[130] Avg| 0.00| 0.0000| 0.023 Peak| | 0.2052| 1.097 ---------------+--------+--------+--------- RxCan2[150] Avg| 0.00| 0.0000| 0.023 Peak| | 0.2246| 0.371 ---------------+--------+--------+--------- RxCan2[160] Avg| 0.00| 0.0000| 0.024 Peak| | 0.0755| 1.125 ---------------+--------+--------+--------- RxCan2[180] Avg| 0.00| 0.0000| 0.023 Peak| | 0.2350| 0.936 ---------------+--------+--------+--------- RxCan2[190] Avg| 0.00| 0.0000| 0.022 Peak| | 0.2275| 0.592 ---------------+--------+--------+--------- RxCan2[1a0] Avg| 0.00| 0.0000| 0.025 Peak| | 0.0125| 0.273 ---------------+--------+--------+--------- RxCan2[1a4] Avg| 0.00| 0.0000| 0.022 Peak| | 0.2806| 0.632 ---------------+--------+--------+--------- RxCan2[1a8] Avg| 0.00| 0.0000| 0.022 Peak| | 0.1683| 0.740 ---------------+--------+--------+--------- RxCan2[1b0] Avg| 0.00| 0.0000| 0.023 Peak| | 0.1360| 0.490 ---------------+--------+--------+--------- RxCan2[1b4] Avg| 0.00| 0.0000| 0.027 Peak| | 0.1556| 1.119 ---------------+--------+--------+--------- RxCan2[1b8] Avg| 0.00| 0.0000| 0.022 Peak| | 0.1704| 0.616 ---------------+--------+--------+--------- RxCan2[1c0] Avg| 0.00| 0.0000| 0.023 Peak| | 0.1317| 0.488 ---------------+--------+--------+--------- RxCan2[1e0] Avg| 0.00| 0.0000| 0.025 Peak| | 0.1460| 0.675 ---------------+--------+--------+--------- RxCan2[215] Avg| 0.00| 0.0000| 0.023 Peak| | 0.1191| 0.567 ---------------+--------+--------+--------- RxCan2[217] Avg| 0.00| 0.0000| 0.023 Peak| | 0.1167| 0.869 ---------------+--------+--------+--------- RxCan2[220] Avg| 0.00| 0.0000| 0.023 Peak| | 0.0918| 0.313 ---------------+--------+--------+--------- RxCan2[225] Avg| 0.00| 0.0000| 0.025 Peak| | 0.3635| 1.018 ---------------+--------+--------+--------- RxCan2[230] Avg| 0.00| 0.0000| 0.057 Peak| | 0.2192| 1.063 ---------------+--------+--------+--------- RxCan2[240] Avg| 0.00| 0.0000| 0.023 Peak| | 0.1173| 0.760 ---------------+--------+--------+--------- RxCan2[241] Avg| 0.00| 0.0000| 0.022 Peak| | 0.2830| 1.144 ---------------+--------+--------+--------- RxCan2[250] Avg| 0.00| 0.0000| 0.026 Peak| | 0.0701| 0.698 ---------------+--------+--------+--------- RxCan2[255] Avg| 0.00| 0.0000| 0.022 Peak| | 0.1755| 1.063 ---------------+--------+--------+--------- RxCan2[265] Avg| 0.00| 0.0000| 0.024 Peak| | 0.1771| 0.729 ---------------+--------+--------+--------- RxCan2[270] Avg| 0.00| 0.0000| 0.023 Peak| | 0.0667| 0.307 ---------------+--------+--------+--------- RxCan2[290] Avg| 0.00| 0.0000| 0.022 Peak| | 0.0410| 0.280 ---------------+--------+--------+--------- RxCan2[295] Avg| 0.00| 0.0000| 0.023 Peak| | 0.0881| 0.299 ---------------+--------+--------+--------- RxCan2[2a0] Avg| 0.00| 0.0000| 0.023 Peak| | 0.0420| 0.268 ---------------+--------+--------+--------- RxCan2[2a7] Avg| 0.00| 0.0000| 0.021 Peak| | 0.1716| 0.454 ---------------+--------+--------+--------- RxCan2[2b0] Avg| 0.00| 0.0000| 0.023 Peak| | 0.0424| 0.300 ---------------+--------+--------+--------- RxCan2[2c0] Avg| 0.00| 0.0000| 0.024 Peak| | 0.0470| 0.298 ---------------+--------+--------+--------- RxCan2[2e0] Avg| 0.00| 0.0000| 0.030 Peak| | 0.0324| 1.152 ---------------+--------+--------+--------- RxCan2[2f0] Avg| 0.00| 0.0000| 0.024 Peak| | 0.0229| 0.359 ---------------+--------+--------+--------- RxCan2[2f5] Avg| 0.00| 0.0000| 0.026 Peak| | 0.1882| 0.673 ---------------+--------+--------+--------- RxCan2[300] Avg| 0.00| 0.0000| 0.022 Peak| | 0.0186| 0.263 ---------------+--------+--------+--------- RxCan2[310] Avg| 0.00| 0.0000| 0.024 Peak| | 0.0210| 0.265 ---------------+--------+--------+--------- RxCan2[320] Avg| 0.00| 0.0000| 0.025 Peak| | 0.0207| 0.354 ---------------+--------+--------+--------- RxCan2[326] Avg| 0.00| 0.0000| 0.023 Peak| | 0.1466| 0.686 ---------------+--------+--------+--------- RxCan2[330] Avg| 0.00| 0.0000| 0.022 Peak| | 0.4580| 0.708 ---------------+--------+--------+--------- RxCan2[340] Avg| 0.00| 0.0000| 0.031 Peak| | 0.1621| 0.785 ---------------+--------+--------+--------- RxCan2[345] Avg| 0.00| 0.0000| 0.021 Peak| | 0.0199| 0.261 ---------------+--------+--------+--------- RxCan2[35e] Avg| 0.00| 0.0000| 0.023 Peak| | 0.0686| 0.449 ---------------+--------+--------+--------- RxCan2[360] Avg| 0.00| 0.0000| 0.025 Peak| | 0.0204| 0.289 ---------------+--------+--------+--------- RxCan2[361] Avg| 0.00| 0.0000| 0.022 Peak| | 0.1166| 0.316 ---------------+--------+--------+--------- RxCan2[363] Avg| 0.00| 0.0000| 0.023 Peak| | 0.0146| 0.304 ---------------+--------+--------+--------- RxCan2[370] Avg| 0.00| 0.0000| 0.024 Peak| | 0.0099| 0.278 ---------------+--------+--------+--------- RxCan2[381] Avg| 0.00| 0.0000| 0.025 Peak| | 0.0468| 0.459 ---------------+--------+--------+--------- RxCan2[3a0] Avg| 0.00| 0.0000| 0.021 Peak| | 0.2339| 0.617 ---------------+--------+--------+--------- RxCan2[3d0] Avg| 0.00| 0.0000| 0.022 Peak| | 0.1351| 0.351 ---------------+--------+--------+--------- RxCan2[3d5] Avg| 0.00| 0.0000| 0.023 Peak| | 0.0796| 0.692 ---------------+--------+--------+--------- RxCan2[400] Avg| 0.00| 0.0000| 0.023 Peak| | 0.0537| 0.307 ---------------+--------+--------+--------- RxCan2[405] Avg| 0.00| 0.0000| 0.021 Peak| | 0.0513| 0.303 ---------------+--------+--------+--------- RxCan2[40a] Avg| 0.00| 0.0000| 0.022 Peak| | 0.1099| 0.313 ---------------+--------+--------+--------- RxCan2[415] Avg| 0.00| 0.0000| 0.022 Peak| | 0.0204| 0.251 ---------------+--------+--------+--------- RxCan2[435] Avg| 0.00| 0.0000| 0.028 Peak| | 0.0113| 0.342 ---------------+--------+--------+--------- RxCan2[440] Avg| 0.00| 0.0000| 0.027 Peak| | 0.0110| 0.299 ---------------+--------+--------+--------- RxCan2[465] Avg| 0.00| 0.0000| 0.023 Peak| | 0.0122| 0.295 ---------------+--------+--------+--------- RxCan2[466] Avg| 0.00| 0.0000| 0.022 Peak| | 0.0117| 0.267 ---------------+--------+--------+--------- RxCan2[467] Avg| 0.00| 0.0000| 0.022 Peak| | 0.0164| 0.325 ---------------+--------+--------+--------- RxCan2[501] Avg| 0.00| 0.0000| 0.023 Peak| | 0.0236| 0.276 ---------------+--------+--------+--------- RxCan2[503] Avg| 0.00| 0.0000| 0.023 Peak| | 0.0248| 0.349 ---------------+--------+--------+--------- RxCan2[504] Avg| 0.00| 0.0000| 0.023 Peak| | 0.0230| 0.312 ---------------+--------+--------+--------- RxCan2[505] Avg| 0.00| 0.0000| 0.025 Peak| | 0.0256| 0.310 ---------------+--------+--------+--------- RxCan2[508] Avg| 0.00| 0.0000| 0.023 Peak| | 0.0281| 0.329 ---------------+--------+--------+--------- RxCan2[511] Avg| 0.00| 0.0000| 0.022 Peak| | 0.0232| 0.282 ---------------+--------+--------+--------- RxCan2[51e] Avg| 0.00| 0.0000| 0.023 Peak| | 0.0248| 0.298 ---------------+--------+--------+--------- RxCan2[581] Avg| 0.00| 0.0000| 0.025 Peak| | 0.0166| 0.286 ===============+========+========+========= Total Avg| 0.00| 0.0000| 43.563
At the same time, calling poller times on, poller times status causes the bus to crash, although no polls are actively being sent at all.
Cheers, Simon _______________________________________________ OvmsDev mailing list OvmsDev@lists.openvehicles.com http://lists.openvehicles.com/mailman/listinfo/ovmsdev
_______________________________________________ OvmsDev mailing listOvmsDev@lists.openvehicles.comhttp://lists.openvehicles.com/mailman/listinfo/ovmsdev
_______________________________________________ OvmsDev mailing list OvmsDev@lists.openvehicles.com http://lists.openvehicles.com/mailman/listinfo/ovmsdev
_______________________________________________ OvmsDev mailing listOvmsDev@lists.openvehicles.comhttp://lists.openvehicles.com/mailman/listinfo/ovmsdev
-- Michael Balzer * Am Rahmen 5 * D-58313 Herdecke <https://www.google.com/maps/search/Am+Rahmen+5+*+D-58313+Herdecke?entry=gmail&source=g> Fon 02330 9104094 * Handy 0176 20698926
_______________________________________________ OvmsDev mailing listOvmsDev@lists.openvehicles.comhttp://lists.openvehicles.com/mailman/listinfo/ovmsdev
_______________________________________________ OvmsDev mailing listOvmsDev@lists.openvehicles.comhttp://lists.openvehicles.com/mailman/listinfo/ovmsdev
-- Michael Balzer * Am Rahmen 5 * D-58313 Herdecke <https://www.google.com/maps/search/Am+Rahmen+5+*+D-58313+Herdecke?entry=gmail&source=g> Fon 02330 9104094 * Handy 0176 20698926
_______________________________________________ OvmsDev mailing list OvmsDev@lists.openvehicles.com http://lists.openvehicles.com/mailman/listinfo/ovmsdev
I should have added I've been running on 3.3.003 for 6 months now with no issues. On Thu, 16 Jan 2025, 7:18 am Derek Caudwell, <d.caudwell@gmail.com> wrote:
Since the following email I have high confidence the issue on the Leaf is related/caused by the poller as there has been no further occurrence and Chris has also experienced the car going to neutral on the new poller firmware.
.... I haven't ruled out it being a fault with my car yet. Shortly after it faulted the car was run into so has been off the road for sometime, my first step was to replace 12V battery. The ovms unit is now unplugged and if it does not fault over the next month while driving I'll be reasonably confident it's ovms related.
Not sure which firmware version the poller updates were included in but it was only after upgrading to it that the errors occurred (which could be coincidental however it has faulted twice more both on version 3.3.004-141-gf729d82c). For periods where I reverted to 3.3.003 it was fine.
It might be useful to have an extra option on the enable can write to only enable it when the car is parked/charging.
On Wed, 15 Jan 2025, 11:11 pm Michael Balzer via OvmsDev, < ovmsdev@lists.openvehicles.com> wrote:
Derek, can you comment on this? Do you still have the issue mentioned?
Speaking of the Leaf, the code there actually does something fishy in `CommandWakeup()`:
unsigned char data = 0; … m_can1->WriteStandard(0x5C0, *8*, &data); //Wakes up the VCM (by spoofing empty battery request heating)
And there are CAN transmissions from command execution in the Leaf code, so to be sure there is no TX, listen mode is needed there as well.
Regarding CAN trace, you can try with the monitor channel and use the USB console to record the log output. That way you should be able to at least rule out there are regular transmissions -- assuming not every TX will cause an immediate crash.
Another / probably better option: when in listen mode, the log will also tell you about TX attempts, as the driver will issue a warning on each.
The CAN monitor log may also tell you about bus errors detected.
Regards, Michael
Am 15.01.25 um 10:44 schrieb Simon Ehlen via OvmsDev:
There is at least one more Leaf from Derek that has also ended up in limp mode since the new poller. There, too, no polling was actually carried out while driving. I'm not familiar with the framework at all, but does this perhaps offer you enough of an approach to recognize a commonality?
Unfortunately I do not have a tool to create a CAN trace. I can't use the OVMS for this, as it no longer responds after a bus crash until I have disconnected it from the OBD and plugged it back in.
Cheers, Simon
Am 15.01.2025 um 10:18 schrieb Michael Balzer via OvmsDev:
The frame acknowledging is done automatically by the CAN transceiver when in active mode, this is part of the CAN protocol to indicate bit errors to the sender.
So normally a failure of the system to process received frames fast enough cannot cause any issue on the bus. But the ESP32 has a range of known hardware issues, especially in the embedded CAN transceiver, I wouldn't be surprised if there are more, or if our driver lacks some workaround for these.
Maybe the new poller has some bug that causes false transmissions from process data frames received. But many vehicles send process data frames, and we've had no issue reports like this on any of them, and ECUs also normally simply ignore out of sequence protocol frames.
You could record a CAN trace to see if there are transmissions, and what kind. If you don't poll and don't send frames from your code, there should be none. If the bus still crashes, that would be an indicator for something going wrong in the transceiver.
Regards, Michael
Am 15.01.25 um 07:15 schrieb Simon Ehlen via OvmsDev:
Thanks Mark for the explanation. So does this mean that OVMS tries to acknowledge all incoming messages in active mode? This seems to me to clearly exceed the capacity of OVMS with the mass of incoming messages.
In fact, I am currently opening the bus in active mode, as I was hoping to get my code to revive the BMS in OVMS to work. However, unlike the other data, I only get the cell voltages when I actively poll them. To be on the safe side, I will now open the bus in read mode again.
However, I am still wondering what in the poller change has altered the OVMS in such a way that the bus is now crashing completely. Currently I have undone the changes since february 2024, this only concerns code from the public repository, there was no change from me in that period. Now the OVMS is running stable again and there are neither queue overflows nor bus crashes.
I had also previously increased the following queue sizes, but unfortunately this was not successful: CONFIG_OVMS_HW_EVENT_QUEUE_SIZE=120 CONFIG_OVMS_HW_CAN_RX_QUEUE_SIZE=80 CONFIG_OVMS_VEHICLE_CAN_RX_QUEUE_SIZE=80
Cheers, Simon
Am 15.01.2025 um 02:08 schrieb Mark Webb-Johnson:
Note sure if this helps, but some comments:
- Remember than CAN protocol in normal mode is an ‘active’ protocol. Nodes on the bus are actively acknowledging messages (and that includes OVMS), even if they never write messages. So in normal mode there is no absolute ‘read access’. For example, opening the CAN port at the wrong baud rate, even if not writing messages, will mess up the bus.
- However, if you open the CAN port in ‘listen’ mode, then it is truly read-only. In that mode it will not acknowledge messages, and cannot write on the bus at all. I’ve never seen an OVMS mess up a bus in listen mode, even if the baud rate is wrong. I think the only way for that to happen would be a hardware layer issue (cabling, termination, etc).
Regards, Mark.
On 15 Jan 2025, at 6:30 AM, Simon Ehlen via OvmsDev <ovmsdev@lists.openvehicles.com> <ovmsdev@lists.openvehicles.com> wrote:
But what is the reason that a read access to the bus can cause the bus to crash? This is not critical during charging, it just aborts the charging process with an error. While driving, this results in a “stop safely now” error message on the dashboard and the engine is switched off immediately.
Cheers, Simon
Am 14.01.2025 um 23:22 schrieb Michael Geddes via OvmsDev:
You may need to increase the queue size for the poll task queue.
The poller still handles the bus to vehicle notifications even if it is off.
Any poller logging on such an intensive load of can messages is likely to be a problem. This is part of the reason it is flagged off.
The total % looks wrong :/
//.ichael
On Wed, 15 Jan 2025, 03:17 Simon Ehlen via OvmsDev, < ovmsdev@lists.openvehicles.com> wrote:
Hi,
I finally got around to merging my code with the current master (previous merge february 2024). I have rebuilt my code for a Ford Focus Electric so that it uses the new OvmsPoller class.
However, I now see a lot of entries like this in my log:
I (246448) vehicle-poll: Poller[Frame]: RX Task Queue Overflow Run 8 I (246448) vehicle-poll: Poller[Frame]: RX Task Queue Overflow Run 3 I (246448) vehicle-poll: Poller[Frame]: RX Task Queue Overflow Run 1 I (246448) vehicle-poll: Poller[Frame]: RX Task Queue Overflow Run 2 I (246448) vehicle-poll: Poller[Frame]: RX Task Queue Overflow Run 1 I (246448) vehicle-poll: Poller[Frame]: RX Task Queue Overflow Run 2 I (246448) vehicle-poll: Poller[Frame]: RX Task Queue Overflow Run 1 I (246448) vehicle-poll: Poller[Frame]: RX Task Queue Overflow Run 1 I (254448) vehicle-poll: Poller[Frame]: RX Task Queue Overflow Run 24 I (254448) vehicle-poll: Poller[Frame]: RX Task Queue Overflow Run 1 I (254448) vehicle-poll: Poller[Frame]: RX Task Queue Overflow Run 1 I (254448) vehicle-poll: Poller[Frame]: RX Task Queue Overflow Run 1 I (254448) vehicle-poll: Poller[Frame]: RX Task Queue Overflow Run 1 I (254448) vehicle-poll: Poller[Frame]: RX Task Queue Overflow Run 1 I (254448) vehicle-poll: Poller[Frame]: RX Task Queue Overflow Run 1
Was this message just hidden before or do I need to make further adjustments to my code?
My code currently does not use active polling but reads on the busses (IncomingFrameCanX) on certain modules.
When I look at poller times status, it looks very extensive to me...
OVMS# poller times status Poller timing is: on Type | count | Utlztn | Time | per s | [%] | [ms] ---------------+--------+--------+--------- Poll:PRI Avg| 0.00| 0.0000| 0.003 Peak| | 0.0014| 0.041 ---------------+--------+--------+--------- RxCan1[010] Avg| 0.00| 0.0000| 0.020 Peak| | 1.2217| 1.089 ---------------+--------+--------+--------- RxCan1[030] Avg| 0.00| 0.0000| 0.024 Peak| | 1.2193| 1.241 ---------------+--------+--------+--------- RxCan1[041] Avg| 0.00| 0.0000| 0.023 Peak| | 0.6460| 1.508 ---------------+--------+--------+--------- RxCan1[049] Avg| 0.00| 0.0000| 0.024 Peak| | 0.6320| 0.630 ---------------+--------+--------+--------- RxCan1[04c] Avg| 0.00| 0.0000| 0.023 Peak| | 0.6430| 1.474 ---------------+--------+--------+--------- RxCan1[04d] Avg| 0.00| 0.0000| 0.022 Peak| | 1.2987| 1.359 ---------------+--------+--------+--------- RxCan1[076] Avg| 0.00| 0.0000| 0.072 Peak| | 0.7818| 15.221 ---------------+--------+--------+--------- RxCan1[077] Avg| 0.00| 0.0000| 0.022 Peak| | 0.6274| 0.955 ---------------+--------+--------+--------- RxCan1[07a] Avg| 0.00| 0.0000| 0.039 Peak| | 1.7602| 1.684 ---------------+--------+--------+--------- RxCan1[07d] Avg| 0.00| 0.0000| 0.023 Peak| | 0.6621| 1.913 ---------------+--------+--------+--------- RxCan1[0c8] Avg| 0.00| 0.0000| 0.026 Peak| | 0.6292| 1.412 ---------------+--------+--------+--------- RxCan1[11a] Avg| 0.00| 0.0000| 0.023 Peak| | 1.2635| 1.508 ---------------+--------+--------+--------- RxCan1[130] Avg| 0.00| 0.0000| 0.024 Peak| | 0.6548| 0.703 ---------------+--------+--------+--------- RxCan1[139] Avg| 0.00| 0.0000| 0.021 Peak| | 0.6002| 0.984 ---------------+--------+--------+--------- RxCan1[156] Avg| 0.00| 0.0000| 0.024 Peak| | 0.1225| 0.479 ---------------+--------+--------+--------- RxCan1[160] Avg| 0.00| 0.0000| 0.028 Peak| | 0.6586| 1.376 ---------------+--------+--------+--------- RxCan1[165] Avg| 0.00| 0.0000| 0.027 Peak| | 0.6368| 1.132 ---------------+--------+--------+--------- RxCan1[167] Avg| 0.00| 0.0000| 0.024 Peak| | 1.3009| 1.067 ---------------+--------+--------+--------- RxCan1[171] Avg| 0.00| 0.0000| 0.022 Peak| | 0.6590| 4.320 ---------------+--------+--------+--------- RxCan1[178] Avg| 0.00| 0.0000| 0.023 Peak| | 0.1161| 0.311 ---------------+--------+--------+--------- RxCan1[179] Avg| 0.00| 0.0000| 0.024 Peak| | 0.1236| 0.536 ---------------+--------+--------+--------- RxCan1[180] Avg| 0.00| 0.0000| 0.022 Peak| | 0.6472| 1.193 ---------------+--------+--------+--------- RxCan1[185] Avg| 0.00| 0.0000| 0.022 Peak| | 0.6777| 1.385 ---------------+--------+--------+--------- RxCan1[1a0] Avg| 0.00| 0.0000| 0.022 Peak| | 0.6486| 2.276 ---------------+--------+--------+--------- RxCan1[1e0] Avg| 0.00| 0.0000| 0.023 Peak| | 0.6725| 1.376 ---------------+--------+--------+--------- RxCan1[1e4] Avg| 0.00| 0.0000| 0.027 Peak| | 0.7370| 1.266 ---------------+--------+--------+--------- RxCan1[1f0] Avg| 0.00| 0.0000| 0.024 Peak| | 0.4253| 0.753 ---------------+--------+--------+--------- RxCan1[200] Avg| 0.00| 0.0000| 0.025 Peak| | 0.6262| 0.791 ---------------+--------+--------+--------- RxCan1[202] Avg| 0.00| 0.0000| 0.021 Peak| | 1.2915| 1.257 ---------------+--------+--------+--------- RxCan1[204] Avg| 0.00| 0.0000| 0.022 Peak| | 1.2620| 1.010 ---------------+--------+--------+--------- RxCan1[213] Avg| 0.00| 0.0000| 0.022 Peak| | 0.6331| 1.185 ---------------+--------+--------+--------- RxCan1[214] Avg| 0.00| 0.0000| 0.023 Peak| | 0.9977| 34.527 ---------------+--------+--------+--------- RxCan1[217] Avg| 0.00| 0.0000| 0.024 Peak| | 1.2825| 1.328 ---------------+--------+--------+--------- RxCan1[218] Avg| 0.00| 0.0000| 0.022 Peak| | 0.6328| 1.110 ---------------+--------+--------+--------- RxCan1[230] Avg| 0.00| 0.0000| 0.019 Peak| | 0.6742| 5.119 ---------------+--------+--------+--------- RxCan1[240] Avg| 0.00| 0.0000| 0.022 Peak| | 0.1163| 0.343 ---------------+--------+--------+--------- RxCan1[242] Avg| 0.00| 0.0000| 0.025 Peak| | 0.3501| 1.015 ---------------+--------+--------+--------- RxCan1[24a] Avg| 0.00| 0.0000| 0.022 Peak| | 0.1212| 0.338 ---------------+--------+--------+--------- RxCan1[24b] Avg| 0.00| 0.0000| 0.023 Peak| | 0.1289| 0.330 ---------------+--------+--------+--------- RxCan1[24c] Avg| 0.00| 0.0000| 0.033 Peak| | 0.1714| 1.189 ---------------+--------+--------+--------- RxCan1[25a] Avg| 0.00| 0.0000| 0.024 Peak| | 0.1289| 0.510 ---------------+--------+--------+--------- RxCan1[25b] Avg| 0.00| 0.0000| 0.022 Peak| | 0.6685| 0.930 ---------------+--------+--------+--------- RxCan1[25c] Avg| 0.00| 0.0000| 0.027 Peak| | 1.3298| 2.670 ---------------+--------+--------+--------- RxCan1[260] Avg| 0.00| 0.0000| 0.023 Peak| | 0.1271| 0.401 ---------------+--------+--------+--------- RxCan1[270] Avg| 0.00| 0.0000| 0.022 Peak| | 0.6439| 0.898 ---------------+--------+--------+--------- RxCan1[280] Avg| 0.00| 0.0000| 0.023 Peak| | 0.6502| 1.156 ---------------+--------+--------+--------- RxCan1[2e4] Avg| 0.00| 0.0000| 0.035 Peak| | 0.3389| 0.811 ---------------+--------+--------+--------- RxCan1[2ec] Avg| 0.00| 0.0000| 0.027 Peak| | 0.1417| 0.784 ---------------+--------+--------+--------- RxCan1[2ed] Avg| 0.00| 0.0000| 0.024 Peak| | 0.1364| 0.746 ---------------+--------+--------+--------- RxCan1[2ee] Avg| 0.00| 0.0000| 0.024 Peak| | 0.1406| 0.965 ---------------+--------+--------+--------- RxCan1[312] Avg| 0.00| 0.0000| 0.023 Peak| | 0.1293| 0.978 ---------------+--------+--------+--------- RxCan1[326] Avg| 0.00| 0.0000| 0.024 Peak| | 0.1298| 0.518 ---------------+--------+--------+--------- RxCan1[336] Avg| 0.00| 0.0000| 0.028 Peak| | 0.0106| 0.329 ---------------+--------+--------+--------- RxCan1[352] Avg| 0.00| 0.0000| 0.030 Peak| | 0.1054| 0.800 ---------------+--------+--------+--------- RxCan1[355] Avg| 0.00| 0.0000| 0.027 Peak| | 0.0270| 0.546 ---------------+--------+--------+--------- RxCan1[35e] Avg| 0.00| 0.0000| 0.023 Peak| | 0.1288| 0.573 ---------------+--------+--------+--------- RxCan1[365] Avg| 0.00| 0.0000| 0.024 Peak| | 0.1297| 0.358 ---------------+--------+--------+--------- RxCan1[366] Avg| 0.00| 0.0000| 0.026 Peak| | 0.1429| 1.001 ---------------+--------+--------+--------- RxCan1[367] Avg| 0.00| 0.0000| 0.026 Peak| | 0.1472| 0.828 ---------------+--------+--------+--------- RxCan1[368] Avg| 0.00| 0.0000| 0.024 Peak| | 0.1323| 0.931 ---------------+--------+--------+--------- RxCan1[369] Avg| 0.00| 0.0000| 0.026 Peak| | 0.1498| 1.072 ---------------+--------+--------+--------- RxCan1[380] Avg| 0.00| 0.0000| 0.022 Peak| | 0.1285| 0.348 ---------------+--------+--------+--------- RxCan1[38b] Avg| 0.00| 0.0000| 0.021 Peak| | 0.3298| 1.168 ---------------+--------+--------+--------- RxCan1[3b3] Avg| 0.00| 0.0000| 0.025 Peak| | 0.1348| 0.920 ---------------+--------+--------+--------- RxCan1[400] Avg| 0.00| 0.0000| 0.022 Peak| | 0.0481| 0.445 ---------------+--------+--------+--------- RxCan1[405] Avg| 0.00| 0.0000| 0.034 Peak| | 0.0723| 0.473 ---------------+--------+--------+--------- RxCan1[40a] Avg| 0.00| 0.0000| 0.025 Peak| | 0.1040| 0.543 ---------------+--------+--------+--------- RxCan1[410] Avg| 0.00| 0.0000| 0.024 Peak| | 0.1339| 0.678 ---------------+--------+--------+--------- RxCan1[411] Avg| 0.00| 0.0000| 0.025 Peak| | 0.1376| 0.573 ---------------+--------+--------+--------- RxCan1[416] Avg| 0.00| 0.0000| 0.023 Peak| | 0.1284| 0.346 ---------------+--------+--------+--------- RxCan1[421] Avg| 0.00| 0.0000| 0.024 Peak| | 0.1323| 0.643 ---------------+--------+--------+--------- RxCan1[42d] Avg| 0.00| 0.0000| 0.023 Peak| | 0.1362| 1.146 ---------------+--------+--------+--------- RxCan1[42f] Avg| 0.00| 0.0000| 0.027 Peak| | 0.1503| 1.762 ---------------+--------+--------+--------- RxCan1[430] Avg| 0.00| 0.0000| 0.023 Peak| | 0.1352| 0.347 ---------------+--------+--------+--------- RxCan1[434] Avg| 0.00| 0.0000| 0.024 Peak| | 0.1312| 0.580 ---------------+--------+--------+--------- RxCan1[435] Avg| 0.00| 0.0000| 0.029 Peak| | 0.1109| 1.133 ---------------+--------+--------+--------- RxCan1[43e] Avg| 0.00| 0.0000| 0.023 Peak| | 0.2776| 0.686 ---------------+--------+--------+--------- RxCan1[440] Avg| 0.00| 0.0000| 0.022 Peak| | 0.0118| 0.276 ---------------+--------+--------+--------- RxCan1[465] Avg| 0.00| 0.0000| 0.022 Peak| | 0.0118| 0.279 ---------------+--------+--------+--------- RxCan1[466] Avg| 0.00| 0.0000| 0.023 Peak| | 0.0123| 0.310 ---------------+--------+--------+--------- RxCan1[467] Avg| 0.00| 0.0000| 0.025 Peak| | 0.0132| 0.314 ---------------+--------+--------+--------- RxCan1[472] Avg| 0.00| 0.0000| 0.101 Peak| | 0.0307| 1.105 ---------------+--------+--------+--------- RxCan1[473] Avg| 0.00| 0.0000| 0.051 Peak| | 0.0107| 0.575 ---------------+--------+--------+--------- RxCan1[474] Avg| 0.00| 0.0000| 0.024 Peak| | 0.0097| 0.289 ---------------+--------+--------+--------- RxCan1[475] Avg| 0.00| 0.0000| 0.023 Peak| | 0.0220| 0.327 ---------------+--------+--------+--------- RxCan1[476] Avg| 0.00| 0.0000| 0.050 Peak| | 0.0762| 5.329 ---------------+--------+--------+--------- RxCan1[477] Avg| 0.00| 0.0000| 0.032 Peak| | 0.0283| 0.669 ---------------+--------+--------+--------- RxCan1[595] Avg| 0.00| 0.0000| 0.026 Peak| | 0.0103| 0.297 ---------------+--------+--------+--------- RxCan1[59e] Avg| 0.00| 0.0000| 0.022 Peak| | 0.0114| 0.263 ---------------+--------+--------+--------- RxCan1[5a2] Avg| 0.00| 0.0000| 0.026 Peak| | 0.0119| 0.505 ---------------+--------+--------+--------- RxCan1[5ba] Avg| 0.00| 0.0000| 0.025 Peak| | 0.0139| 0.549 ---------------+--------+--------+--------- RxCan2[020] Avg| 0.00| 0.0000| 0.026 Peak| | 0.4923| 1.133 ---------------+--------+--------+--------- RxCan2[030] Avg| 0.00| 0.0000| 0.023 Peak| | 0.3297| 1.136 ---------------+--------+--------+--------- RxCan2[03a] Avg| 0.00| 0.0000| 0.022 Peak| | 0.2792| 1.275 ---------------+--------+--------+--------- RxCan2[040] Avg| 0.00| 0.0000| 0.023 Peak| | 0.2834| 1.080 ---------------+--------+--------+--------- RxCan2[060] Avg| 0.00| 0.0000| 0.029 Peak| | 0.3037| 0.991 ---------------+--------+--------+--------- RxCan2[070] Avg| 0.00| 0.0000| 0.025 Peak| | 0.2291| 0.460 ---------------+--------+--------+--------- RxCan2[080] Avg| 0.00| 0.0000| 0.043 Peak| | 0.4015| 1.007 ---------------+--------+--------+--------- RxCan2[083] Avg| 0.00| 0.0000| 0.026 Peak| | 0.2957| 0.788 ---------------+--------+--------+--------- RxCan2[090] Avg| 0.00| 0.0000| 0.027 Peak| | 0.3951| 1.231 ---------------+--------+--------+--------- RxCan2[0a0] Avg| 0.00| 0.0000| 0.026 Peak| | 0.2560| 0.722 ---------------+--------+--------+--------- RxCan2[100] Avg| 0.00| 0.0000| 0.046 Peak| | 0.4506| 21.961 ---------------+--------+--------+--------- RxCan2[108] Avg| 0.00| 0.0000| 0.024 Peak| | 0.3713| 1.125 ---------------+--------+--------+--------- RxCan2[110] Avg| 0.00| 0.0000| 0.029 Peak| | 0.2443| 0.755 ---------------+--------+--------+--------- RxCan2[130] Avg| 0.00| 0.0000| 0.023 Peak| | 0.2052| 1.097 ---------------+--------+--------+--------- RxCan2[150] Avg| 0.00| 0.0000| 0.023 Peak| | 0.2246| 0.371 ---------------+--------+--------+--------- RxCan2[160] Avg| 0.00| 0.0000| 0.024 Peak| | 0.0755| 1.125 ---------------+--------+--------+--------- RxCan2[180] Avg| 0.00| 0.0000| 0.023 Peak| | 0.2350| 0.936 ---------------+--------+--------+--------- RxCan2[190] Avg| 0.00| 0.0000| 0.022 Peak| | 0.2275| 0.592 ---------------+--------+--------+--------- RxCan2[1a0] Avg| 0.00| 0.0000| 0.025 Peak| | 0.0125| 0.273 ---------------+--------+--------+--------- RxCan2[1a4] Avg| 0.00| 0.0000| 0.022 Peak| | 0.2806| 0.632 ---------------+--------+--------+--------- RxCan2[1a8] Avg| 0.00| 0.0000| 0.022 Peak| | 0.1683| 0.740 ---------------+--------+--------+--------- RxCan2[1b0] Avg| 0.00| 0.0000| 0.023 Peak| | 0.1360| 0.490 ---------------+--------+--------+--------- RxCan2[1b4] Avg| 0.00| 0.0000| 0.027 Peak| | 0.1556| 1.119 ---------------+--------+--------+--------- RxCan2[1b8] Avg| 0.00| 0.0000| 0.022 Peak| | 0.1704| 0.616 ---------------+--------+--------+--------- RxCan2[1c0] Avg| 0.00| 0.0000| 0.023 Peak| | 0.1317| 0.488 ---------------+--------+--------+--------- RxCan2[1e0] Avg| 0.00| 0.0000| 0.025 Peak| | 0.1460| 0.675 ---------------+--------+--------+--------- RxCan2[215] Avg| 0.00| 0.0000| 0.023 Peak| | 0.1191| 0.567 ---------------+--------+--------+--------- RxCan2[217] Avg| 0.00| 0.0000| 0.023 Peak| | 0.1167| 0.869 ---------------+--------+--------+--------- RxCan2[220] Avg| 0.00| 0.0000| 0.023 Peak| | 0.0918| 0.313 ---------------+--------+--------+--------- RxCan2[225] Avg| 0.00| 0.0000| 0.025 Peak| | 0.3635| 1.018 ---------------+--------+--------+--------- RxCan2[230] Avg| 0.00| 0.0000| 0.057 Peak| | 0.2192| 1.063 ---------------+--------+--------+--------- RxCan2[240] Avg| 0.00| 0.0000| 0.023 Peak| | 0.1173| 0.760 ---------------+--------+--------+--------- RxCan2[241] Avg| 0.00| 0.0000| 0.022 Peak| | 0.2830| 1.144 ---------------+--------+--------+--------- RxCan2[250] Avg| 0.00| 0.0000| 0.026 Peak| | 0.0701| 0.698 ---------------+--------+--------+--------- RxCan2[255] Avg| 0.00| 0.0000| 0.022 Peak| | 0.1755| 1.063 ---------------+--------+--------+--------- RxCan2[265] Avg| 0.00| 0.0000| 0.024 Peak| | 0.1771| 0.729 ---------------+--------+--------+--------- RxCan2[270] Avg| 0.00| 0.0000| 0.023 Peak| | 0.0667| 0.307 ---------------+--------+--------+--------- RxCan2[290] Avg| 0.00| 0.0000| 0.022 Peak| | 0.0410| 0.280 ---------------+--------+--------+--------- RxCan2[295] Avg| 0.00| 0.0000| 0.023 Peak| | 0.0881| 0.299 ---------------+--------+--------+--------- RxCan2[2a0] Avg| 0.00| 0.0000| 0.023 Peak| | 0.0420| 0.268 ---------------+--------+--------+--------- RxCan2[2a7] Avg| 0.00| 0.0000| 0.021 Peak| | 0.1716| 0.454 ---------------+--------+--------+--------- RxCan2[2b0] Avg| 0.00| 0.0000| 0.023 Peak| | 0.0424| 0.300 ---------------+--------+--------+--------- RxCan2[2c0] Avg| 0.00| 0.0000| 0.024 Peak| | 0.0470| 0.298 ---------------+--------+--------+--------- RxCan2[2e0] Avg| 0.00| 0.0000| 0.030 Peak| | 0.0324| 1.152 ---------------+--------+--------+--------- RxCan2[2f0] Avg| 0.00| 0.0000| 0.024 Peak| | 0.0229| 0.359 ---------------+--------+--------+--------- RxCan2[2f5] Avg| 0.00| 0.0000| 0.026 Peak| | 0.1882| 0.673 ---------------+--------+--------+--------- RxCan2[300] Avg| 0.00| 0.0000| 0.022 Peak| | 0.0186| 0.263 ---------------+--------+--------+--------- RxCan2[310] Avg| 0.00| 0.0000| 0.024 Peak| | 0.0210| 0.265 ---------------+--------+--------+--------- RxCan2[320] Avg| 0.00| 0.0000| 0.025 Peak| | 0.0207| 0.354 ---------------+--------+--------+--------- RxCan2[326] Avg| 0.00| 0.0000| 0.023 Peak| | 0.1466| 0.686 ---------------+--------+--------+--------- RxCan2[330] Avg| 0.00| 0.0000| 0.022 Peak| | 0.4580| 0.708 ---------------+--------+--------+--------- RxCan2[340] Avg| 0.00| 0.0000| 0.031 Peak| | 0.1621| 0.785 ---------------+--------+--------+--------- RxCan2[345] Avg| 0.00| 0.0000| 0.021 Peak| | 0.0199| 0.261 ---------------+--------+--------+--------- RxCan2[35e] Avg| 0.00| 0.0000| 0.023 Peak| | 0.0686| 0.449 ---------------+--------+--------+--------- RxCan2[360] Avg| 0.00| 0.0000| 0.025 Peak| | 0.0204| 0.289 ---------------+--------+--------+--------- RxCan2[361] Avg| 0.00| 0.0000| 0.022 Peak| | 0.1166| 0.316 ---------------+--------+--------+--------- RxCan2[363] Avg| 0.00| 0.0000| 0.023 Peak| | 0.0146| 0.304 ---------------+--------+--------+--------- RxCan2[370] Avg| 0.00| 0.0000| 0.024 Peak| | 0.0099| 0.278 ---------------+--------+--------+--------- RxCan2[381] Avg| 0.00| 0.0000| 0.025 Peak| | 0.0468| 0.459 ---------------+--------+--------+--------- RxCan2[3a0] Avg| 0.00| 0.0000| 0.021 Peak| | 0.2339| 0.617 ---------------+--------+--------+--------- RxCan2[3d0] Avg| 0.00| 0.0000| 0.022 Peak| | 0.1351| 0.351 ---------------+--------+--------+--------- RxCan2[3d5] Avg| 0.00| 0.0000| 0.023 Peak| | 0.0796| 0.692 ---------------+--------+--------+--------- RxCan2[400] Avg| 0.00| 0.0000| 0.023 Peak| | 0.0537| 0.307 ---------------+--------+--------+--------- RxCan2[405] Avg| 0.00| 0.0000| 0.021 Peak| | 0.0513| 0.303 ---------------+--------+--------+--------- RxCan2[40a] Avg| 0.00| 0.0000| 0.022 Peak| | 0.1099| 0.313 ---------------+--------+--------+--------- RxCan2[415] Avg| 0.00| 0.0000| 0.022 Peak| | 0.0204| 0.251 ---------------+--------+--------+--------- RxCan2[435] Avg| 0.00| 0.0000| 0.028 Peak| | 0.0113| 0.342 ---------------+--------+--------+--------- RxCan2[440] Avg| 0.00| 0.0000| 0.027 Peak| | 0.0110| 0.299 ---------------+--------+--------+--------- RxCan2[465] Avg| 0.00| 0.0000| 0.023 Peak| | 0.0122| 0.295 ---------------+--------+--------+--------- RxCan2[466] Avg| 0.00| 0.0000| 0.022 Peak| | 0.0117| 0.267 ---------------+--------+--------+--------- RxCan2[467] Avg| 0.00| 0.0000| 0.022 Peak| | 0.0164| 0.325 ---------------+--------+--------+--------- RxCan2[501] Avg| 0.00| 0.0000| 0.023 Peak| | 0.0236| 0.276 ---------------+--------+--------+--------- RxCan2[503] Avg| 0.00| 0.0000| 0.023 Peak| | 0.0248| 0.349 ---------------+--------+--------+--------- RxCan2[504] Avg| 0.00| 0.0000| 0.023 Peak| | 0.0230| 0.312 ---------------+--------+--------+--------- RxCan2[505] Avg| 0.00| 0.0000| 0.025 Peak| | 0.0256| 0.310 ---------------+--------+--------+--------- RxCan2[508] Avg| 0.00| 0.0000| 0.023 Peak| | 0.0281| 0.329 ---------------+--------+--------+--------- RxCan2[511] Avg| 0.00| 0.0000| 0.022 Peak| | 0.0232| 0.282 ---------------+--------+--------+--------- RxCan2[51e] Avg| 0.00| 0.0000| 0.023 Peak| | 0.0248| 0.298 ---------------+--------+--------+--------- RxCan2[581] Avg| 0.00| 0.0000| 0.025 Peak| | 0.0166| 0.286 ===============+========+========+========= Total Avg| 0.00| 0.0000| 43.563
At the same time, calling poller times on, poller times status causes the bus to crash, although no polls are actively being sent at all.
Cheers, Simon _______________________________________________ OvmsDev mailing list OvmsDev@lists.openvehicles.com http://lists.openvehicles.com/mailman/listinfo/ovmsdev
_______________________________________________ OvmsDev mailing listOvmsDev@lists.openvehicles.comhttp://lists.openvehicles.com/mailman/listinfo/ovmsdev
_______________________________________________ OvmsDev mailing list OvmsDev@lists.openvehicles.com http://lists.openvehicles.com/mailman/listinfo/ovmsdev
_______________________________________________ OvmsDev mailing listOvmsDev@lists.openvehicles.comhttp://lists.openvehicles.com/mailman/listinfo/ovmsdev
-- Michael Balzer * Am Rahmen 5 * D-58313 Herdecke <https://www.google.com/maps/search/Am+Rahmen+5+*+D-58313+Herdecke?entry=gmail&source=g> Fon 02330 9104094 * Handy 0176 20698926
_______________________________________________ OvmsDev mailing listOvmsDev@lists.openvehicles.comhttp://lists.openvehicles.com/mailman/listinfo/ovmsdev
_______________________________________________ OvmsDev mailing listOvmsDev@lists.openvehicles.comhttp://lists.openvehicles.com/mailman/listinfo/ovmsdev
-- Michael Balzer * Am Rahmen 5 * D-58313 Herdecke <https://www.google.com/maps/search/Am+Rahmen+5+*+D-58313+Herdecke?entry=gmail&source=g> Fon 02330 9104094 * Handy 0176 20698926
_______________________________________________ OvmsDev mailing list OvmsDev@lists.openvehicles.com http://lists.openvehicles.com/mailman/listinfo/ovmsdev
I put the two buses back into listen mode and drove a short distance and charged the car. As I said, there is no active polling in my code. As expected, there is therefore no indication of a failed TX attempt in the console log. I only continue to see a lot of RX Task Queue Overflow messages in the log, which I did not have before. I also see a Pollers[Send]: Task Queue Overflow entry, but since I don't see any indication of “cannot write” on that, I'm not assuming that's a “real” send. I (19760210) vehicle-poll: Poller[Frame]: RX Task Queue Overflow Run 5 I (19764420) vehicle-poll: Poller[Frame]: RX Task Queue Overflow Run 1 I (19764420) vehicle-poll: Poller[Frame]: RX Task Queue Overflow Run 3 I (19764420) vehicle-poll: Poller[Frame]: RX Task Queue Overflow Run 1 I (19764740) vehicle-poll: Poller[Frame]: RX Task Queue Overflow Run 1 I (19764740) vehicle-poll: Poller[Frame]: RX Task Queue Overflow Run 1 I (19764740) vehicle-poll: Poller[Frame]: RX Task Queue Overflow Run 1 I (19764740) vehicle-poll: Poller[Frame]: RX Task Queue Overflow Run 1 I (19764740) vehicle-poll: Poller[Frame]: RX Task Queue Overflow Run 1 I (19764750) vehicle-poll: Poller[Frame]: RX Task Queue Overflow Run 2 I (19764750) vehicle-poll: Poller[Frame]: RX Task Queue Overflow Run 1 I (19764750) vehicle-poll: Poller[Frame]: RX Task Queue Overflow Run 2 I (19764870) vehicle-poll: Poller[Frame]: RX Task Queue Overflow Run 1 I (19764870) vehicle-poll: Poller[Frame]: RX Task Queue Overflow Run 2 I (19765270) vehicle-poll: Poller[Frame]: RX Task Queue Overflow Run 4 I (19765270) vehicle-poll: Poller[Frame]: RX Task Queue Overflow Run 6 I (19765610) vehicle-poll: Poller[Frame]: RX Task Queue Overflow Run 3 I (19765930) vehicle-poll: Poller[Frame]: RX Task Queue Overflow Run 1 I (19765930) vehicle-poll: Poller[Frame]: RX Task Queue Overflow Run 3 I (19765930) vehicle-poll: Poller[Frame]: RX Task Queue Overflow Run 1 I (19766260) vehicle-poll: Poller[Frame]: RX Task Queue Overflow Run 50 I (19766260) vehicle-poll: Poller[Frame]: RX Task Queue Overflow Run 48 I (19766260) vehicle-poll: Poller[Frame]: RX Task Queue Overflow Run 27 I (19766270) vehicle-poll: Poller[Frame]: RX Task Queue Overflow Run 6 I (19766270) vehicle-poll: Poller[Frame]: RX Task Queue Overflow Run 4 E (19766280) can: can2: intr=4754831 rxpkt=4757493 txpkt=0 errflags=0x22401c02 rxerr=0 txerr=0 rxinval=0 rxovr=0 txovr=0 txdelay=0 txfail=0 wdgreset=1 errreset=0 E (19766300) can: can2: intr=4754831 rxpkt=4757494 txpkt=0 errflags=0x23401c01 rxerr=0 txerr=0 rxinval=0 rxovr=0 txovr=0 txdelay=0 txfail=0 wdgreset=1 errreset=0 I (19766300) vehicle-poll: Poller[Frame]: RX Task Queue Overflow Run 7 I (19766340) vehicle-poll: Poller[Frame]: RX Task Queue Overflow Run 39 I (19766350) vehicle-poll: Poller[Frame]: RX Task Queue Overflow Run 32 I (19766350) vehicle-poll: Poller[Frame]: RX Task Queue Overflow Run 17 I (19766350) vehicle-poll: Poller[Frame]: RX Task Queue Overflow Run 3 I (19766350) vehicle-poll: Pollers[Send]: Task Queue Overflow I (19766350) vehicle-poll: Poller[Frame]: RX Task Queue Overflow Run 1 I (19766350) vehicle-poll: Poller[Frame]: RX Task Queue Overflow Run 1 E (19766360) can: can2: intr=4754840 rxpkt=4757509 txpkt=0 errflags=0x22401c02 rxerr=0 txerr=0 rxinval=0 rxovr=0 txovr=0 txdelay=0 txfail=0 wdgreset=1 errreset=0 I (19766370) vehicle-poll: Poller[Frame]: RX Task Queue Overflow Run 4 E (19766370) can: can2: intr=4754840 rxpkt=4757510 txpkt=0 errflags=0x23401c01 rxerr=0 txerr=0 rxinval=0 rxovr=0 txovr=0 txdelay=0 txfail=0 wdgreset=1 errreset=0 I (19766430) vehicle-poll: Poller[Frame]: RX Task Queue Overflow Run 30 I (19766430) vehicle-poll: Poller[Frame]: RX Task Queue Overflow Run 36 I (19766430) vehicle-poll: Poller[Frame]: RX Task Queue Overflow Run 26 I (19766430) vehicle-poll: Poller[Frame]: RX Task Queue Overflow Run 4 I (19766430) vehicle-poll: Poller[Frame]: RX Task Queue Overflow Run 3 I (19766430) vehicle-poll: Poller[Frame]: RX Task Queue Overflow Run 2 I (19766430) vehicle-poll: Poller[Frame]: RX Task Queue Overflow Run 1 E (19766450) can: can2: intr=4754855 rxpkt=4757535 txpkt=0 errflags=0x23001001 rxerr=0 txerr=0 rxinval=0 rxovr=0 txovr=0 txdelay=0 txfail=0 wdgreset=1 errreset=0 E (19766460) can: can2: intr=4754855 rxpkt=4757536 txpkt=0 errflags=0x23401c01 rxerr=0 txerr=0 rxinval=0 rxovr=0 txovr=0 txdelay=0 txfail=0 wdgreset=1 errreset=0 E (19766520) can: can2: intr=4754855 rxpkt=4757539 txpkt=0 errflags=0x22001002 rxerr=0 txerr=0 rxinval=0 rxovr=0 txovr=0 txdelay=0 txfail=0 wdgreset=1 errreset=0 I (19766520) vehicle-poll: Poller[Frame]: RX Task Queue Overflow Run 9 I (19766520) vehicle-poll: Poller[Frame]: RX Task Queue Overflow Run 37 I (19766520) vehicle-poll: Poller[Frame]: RX Task Queue Overflow Run 30 I (19766520) vehicle-poll: Poller[Frame]: RX Task Queue Overflow Run 6 I (19766520) vehicle-poll: Poller[Frame]: RX Task Queue Overflow Run 2 I (19766520) vehicle-poll: Poller[Frame]: RX Task Queue Overflow Run 1 I (19766520) vehicle-poll: Poller[Frame]: RX Task Queue Overflow Run 1 I (19766520) vehicle-poll: Poller[Frame]: RX Task Queue Overflow Run 3 I (19766530) vehicle-poll: Poller[Frame]: RX Task Queue Overflow Run 1 I (19766530) vehicle-poll: Poller[Frame]: RX Task Queue Overflow Run 1 I (19766530) vehicle-poll: Poller[Frame]: RX Task Queue Overflow Run 1 E (19766540) can: can2: intr=4754861 rxpkt=4757548 txpkt=0 errflags=0x23401c01 rxerr=0 txerr=0 rxinval=0 rxovr=0 txovr=0 txdelay=0 txfail=0 wdgreset=1 errreset=0 I (19766550) vehicle-poll: Poller[Frame]: RX Task Queue Overflow Run 3 E (19766560) can: can2: intr=4754861 rxpkt=4757552 txpkt=0 errflags=0x23001001 rxerr=0 txerr=0 rxinval=0 rxovr=0 txovr=0 txdelay=0 txfail=0 wdgreset=1 errreset=0 E (19766610) can: can2: intr=4754861 rxpkt=4757553 txpkt=0 errflags=0x23401c01 rxerr=0 txerr=0 rxinval=0 rxovr=0 txovr=0 txdelay=0 txfail=0 wdgreset=1 errreset=0 I (19766610) vehicle-poll: Poller[Frame]: RX Task Queue Overflow Run 4 I (19766610) vehicle-poll: Poller[Frame]: RX Task Queue Overflow Run 5 I (19766610) vehicle-poll: Poller[Frame]: RX Task Queue Overflow Run 33 I (19766610) vehicle-poll: Poller[Frame]: RX Task Queue Overflow Run 34 I (19766610) vehicle-poll: Poller[Frame]: RX Task Queue Overflow Run 12 W (19767070) websocket: WebSocketHandler[0x3f8d79d8]: job queue overflow detected W (19767140) websocket: WebSocketHandler[0x3f8d79d8]: job queue overflow detected W (19767180) websocket: WebSocketHandler[0x3f8d79d8]: job queue overflow resolved, 1 drops W (19767260) websocket: WebSocketHandler[0x3f8d79d8]: job queue overflow detected W (19767310) websocket: WebSocketHandler[0x3f8d79d8]: job queue overflow resolved, 1 drops Cheers Simon Am 15.01.2025 um 19:18 schrieb Derek Caudwell via OvmsDev:
Since the following email I have high confidence the issue on the Leaf is related/caused by the poller as there has been no further occurrence and Chris has also experienced the car going to neutral on the new poller firmware.
.... I haven't ruled out it being a fault with my car yet. Shortly after it faulted the car was run into so has been off the road for sometime, my first step was to replace 12V battery. The ovms unit is now unplugged and if it does not fault over the next month while driving I'll be reasonably confident it's ovms related.
Not sure which firmware version the poller updates were included in but it was only after upgrading to it that the errors occurred (which could be coincidental however it has faulted twice more both on version 3.3.004-141-gf729d82c). For periods where I reverted to 3.3.003 it was fine.
It might be useful to have an extra option on the enable can write to only enable it when the car is parked/charging.
On Wed, 15 Jan 2025, 11:11 pm Michael Balzer via OvmsDev, <ovmsdev@lists.openvehicles.com> wrote:
Derek, can you comment on this? Do you still have the issue mentioned?
Speaking of the Leaf, the code there actually does something fishy in `CommandWakeup()`:
unsigned char data = 0; … m_can1->WriteStandard(0x5C0, *_8_*, &data); //Wakes up the VCM (by spoofing empty battery request heating)
And there are CAN transmissions from command execution in the Leaf code, so to be sure there is no TX, listen mode is needed there as well.
Regarding CAN trace, you can try with the monitor channel and use the USB console to record the log output. That way you should be able to at least rule out there are regular transmissions -- assuming not every TX will cause an immediate crash.
Another / probably better option: when in listen mode, the log will also tell you about TX attempts, as the driver will issue a warning on each.
The CAN monitor log may also tell you about bus errors detected.
Regards, Michael
Am 15.01.25 um 10:44 schrieb Simon Ehlen via OvmsDev:
There is at least one more Leaf from Derek that has also ended up in limp mode since the new poller. There, too, no polling was actually carried out while driving. I'm not familiar with the framework at all, but does this perhaps offer you enough of an approach to recognize a commonality?
Unfortunately I do not have a tool to create a CAN trace. I can't use the OVMS for this, as it no longer responds after a bus crash until I have disconnected it from the OBD and plugged it back in.
Cheers, Simon
Am 15.01.2025 um 10:18 schrieb Michael Balzer via OvmsDev:
The frame acknowledging is done automatically by the CAN transceiver when in active mode, this is part of the CAN protocol to indicate bit errors to the sender.
So normally a failure of the system to process received frames fast enough cannot cause any issue on the bus. But the ESP32 has a range of known hardware issues, especially in the embedded CAN transceiver, I wouldn't be surprised if there are more, or if our driver lacks some workaround for these.
Maybe the new poller has some bug that causes false transmissions from process data frames received. But many vehicles send process data frames, and we've had no issue reports like this on any of them, and ECUs also normally simply ignore out of sequence protocol frames.
You could record a CAN trace to see if there are transmissions, and what kind. If you don't poll and don't send frames from your code, there should be none. If the bus still crashes, that would be an indicator for something going wrong in the transceiver.
Regards, Michael
Am 15.01.25 um 07:15 schrieb Simon Ehlen via OvmsDev:
Thanks Mark for the explanation. So does this mean that OVMS tries to acknowledge all incoming messages in active mode? This seems to me to clearly exceed the capacity of OVMS with the mass of incoming messages.
In fact, I am currently opening the bus in active mode, as I was hoping to get my code to revive the BMS in OVMS to work. However, unlike the other data, I only get the cell voltages when I actively poll them. To be on the safe side, I will now open the bus in read mode again.
However, I am still wondering what in the poller change has altered the OVMS in such a way that the bus is now crashing completely. Currently I have undone the changes since february 2024, this only concerns code from the public repository, there was no change from me in that period. Now the OVMS is running stable again and there are neither queue overflows nor bus crashes.
I had also previously increased the following queue sizes, but unfortunately this was not successful: CONFIG_OVMS_HW_EVENT_QUEUE_SIZE=120 CONFIG_OVMS_HW_CAN_RX_QUEUE_SIZE=80 CONFIG_OVMS_VEHICLE_CAN_RX_QUEUE_SIZE=80
Cheers, Simon
Am 15.01.2025 um 02:08 schrieb Mark Webb-Johnson:
Note sure if this helps, but some comments:
* Remember than CAN protocol in normal mode is an ‘active’ protocol. Nodes on the bus are actively acknowledging messages (and that includes OVMS), even if they never write messages. So in normal mode there is no absolute ‘read access’. For example, opening the CAN port at the wrong baud rate, even if not writing messages, will mess up the bus.
* However, if you open the CAN port in ‘listen’ mode, then it is truly read-only. In that mode it will not acknowledge messages, and cannot write on the bus at all. I’ve never seen an OVMS mess up a bus in listen mode, even if the baud rate is wrong. I think the only way for that to happen would be a hardware layer issue (cabling, termination, etc).
Regards, Mark.
On 15 Jan 2025, at 6:30 AM, Simon Ehlen via OvmsDev <ovmsdev@lists.openvehicles.com> <mailto:ovmsdev@lists.openvehicles.com> wrote:
But what is the reason that a read access to the bus can cause the bus to crash? This is not critical during charging, it just aborts the charging process with an error. While driving, this results in a “stop safely now” error message on the dashboard and the engine is switched off immediately.
Cheers, Simon
Am 14.01.2025 um 23:22 schrieb Michael Geddes via OvmsDev: > You may need to increase the queue size for the poll task queue. > > The poller still handles the bus to vehicle notifications even if it is off. > > Any poller logging on such an intensive load of can messages is likely to be a problem. This is part of the reason it is flagged off. > > The total % looks wrong :/ > > //.ichael > > > > > On Wed, 15 Jan 2025, 03:17 Simon Ehlen via OvmsDev, <ovmsdev@lists.openvehicles.com> wrote: > > Hi, > > I finally got around to merging my code with the current master (previous merge february 2024). > I have rebuilt my code for a Ford Focus Electric so that it uses the new OvmsPoller class. > > However, I now see a lot of entries like this in my log: > > I (246448) vehicle-poll: Poller[Frame]: RX Task Queue Overflow Run 8 > I (246448) vehicle-poll: Poller[Frame]: RX Task Queue Overflow Run 3 > I (246448) vehicle-poll: Poller[Frame]: RX Task Queue Overflow Run 1 > I (246448) vehicle-poll: Poller[Frame]: RX Task Queue Overflow Run 2 > I (246448) vehicle-poll: Poller[Frame]: RX Task Queue Overflow Run 1 > I (246448) vehicle-poll: Poller[Frame]: RX Task Queue Overflow Run 2 > I (246448) vehicle-poll: Poller[Frame]: RX Task Queue Overflow Run 1 > I (246448) vehicle-poll: Poller[Frame]: RX Task Queue Overflow Run 1 > I (254448) vehicle-poll: Poller[Frame]: RX Task Queue Overflow Run 24 > I (254448) vehicle-poll: Poller[Frame]: RX Task Queue Overflow Run 1 > I (254448) vehicle-poll: Poller[Frame]: RX Task Queue Overflow Run 1 > I (254448) vehicle-poll: Poller[Frame]: RX Task Queue Overflow Run 1 > I (254448) vehicle-poll: Poller[Frame]: RX Task Queue Overflow Run 1 > I (254448) vehicle-poll: Poller[Frame]: RX Task Queue Overflow Run 1 > I (254448) vehicle-poll: Poller[Frame]: RX Task Queue Overflow Run 1 > > Was this message just hidden before or do I need to make further adjustments to my code? > > My code currently does not use active polling but reads on the busses (IncomingFrameCanX) on certain modules. > > When I look at poller times status, it looks very extensive to me... > > OVMS# poller times status > Poller timing is: on > Type | count | Utlztn | Time > | per s | [%] | [ms] > ---------------+--------+--------+--------- > Poll:PRI Avg| 0.00| 0.0000| 0.003 > Peak| | 0.0014| 0.041 > ---------------+--------+--------+--------- > RxCan1[010] Avg| 0.00| 0.0000| 0.020 > Peak| | 1.2217| 1.089 > ---------------+--------+--------+--------- > RxCan1[030] Avg| 0.00| 0.0000| 0.024 > Peak| | 1.2193| 1.241 > ---------------+--------+--------+--------- > RxCan1[041] Avg| 0.00| 0.0000| 0.023 > Peak| | 0.6460| 1.508 > ---------------+--------+--------+--------- > RxCan1[049] Avg| 0.00| 0.0000| 0.024 > Peak| | 0.6320| 0.630 > ---------------+--------+--------+--------- > RxCan1[04c] Avg| 0.00| 0.0000| 0.023 > Peak| | 0.6430| 1.474 > ---------------+--------+--------+--------- > RxCan1[04d] Avg| 0.00| 0.0000| 0.022 > Peak| | 1.2987| 1.359 > ---------------+--------+--------+--------- > RxCan1[076] Avg| 0.00| 0.0000| 0.072 > Peak| | 0.7818| 15.221 > ---------------+--------+--------+--------- > RxCan1[077] Avg| 0.00| 0.0000| 0.022 > Peak| | 0.6274| 0.955 > ---------------+--------+--------+--------- > RxCan1[07a] Avg| 0.00| 0.0000| 0.039 > Peak| | 1.7602| 1.684 > ---------------+--------+--------+--------- > RxCan1[07d] Avg| 0.00| 0.0000| 0.023 > Peak| | 0.6621| 1.913 > ---------------+--------+--------+--------- > RxCan1[0c8] Avg| 0.00| 0.0000| 0.026 > Peak| | 0.6292| 1.412 > ---------------+--------+--------+--------- > RxCan1[11a] Avg| 0.00| 0.0000| 0.023 > Peak| | 1.2635| 1.508 > ---------------+--------+--------+--------- > RxCan1[130] Avg| 0.00| 0.0000| 0.024 > Peak| | 0.6548| 0.703 > ---------------+--------+--------+--------- > RxCan1[139] Avg| 0.00| 0.0000| 0.021 > Peak| | 0.6002| 0.984 > ---------------+--------+--------+--------- > RxCan1[156] Avg| 0.00| 0.0000| 0.024 > Peak| | 0.1225| 0.479 > ---------------+--------+--------+--------- > RxCan1[160] Avg| 0.00| 0.0000| 0.028 > Peak| | 0.6586| 1.376 > ---------------+--------+--------+--------- > RxCan1[165] Avg| 0.00| 0.0000| 0.027 > Peak| | 0.6368| 1.132 > ---------------+--------+--------+--------- > RxCan1[167] Avg| 0.00| 0.0000| 0.024 > Peak| | 1.3009| 1.067 > ---------------+--------+--------+--------- > RxCan1[171] Avg| 0.00| 0.0000| 0.022 > Peak| | 0.6590| 4.320 > ---------------+--------+--------+--------- > RxCan1[178] Avg| 0.00| 0.0000| 0.023 > Peak| | 0.1161| 0.311 > ---------------+--------+--------+--------- > RxCan1[179] Avg| 0.00| 0.0000| 0.024 > Peak| | 0.1236| 0.536 > ---------------+--------+--------+--------- > RxCan1[180] Avg| 0.00| 0.0000| 0.022 > Peak| | 0.6472| 1.193 > ---------------+--------+--------+--------- > RxCan1[185] Avg| 0.00| 0.0000| 0.022 > Peak| | 0.6777| 1.385 > ---------------+--------+--------+--------- > RxCan1[1a0] Avg| 0.00| 0.0000| 0.022 > Peak| | 0.6486| 2.276 > ---------------+--------+--------+--------- > RxCan1[1e0] Avg| 0.00| 0.0000| 0.023 > Peak| | 0.6725| 1.376 > ---------------+--------+--------+--------- > RxCan1[1e4] Avg| 0.00| 0.0000| 0.027 > Peak| | 0.7370| 1.266 > ---------------+--------+--------+--------- > RxCan1[1f0] Avg| 0.00| 0.0000| 0.024 > Peak| | 0.4253| 0.753 > ---------------+--------+--------+--------- > RxCan1[200] Avg| 0.00| 0.0000| 0.025 > Peak| | 0.6262| 0.791 > ---------------+--------+--------+--------- > RxCan1[202] Avg| 0.00| 0.0000| 0.021 > Peak| | 1.2915| 1.257 > ---------------+--------+--------+--------- > RxCan1[204] Avg| 0.00| 0.0000| 0.022 > Peak| | 1.2620| 1.010 > ---------------+--------+--------+--------- > RxCan1[213] Avg| 0.00| 0.0000| 0.022 > Peak| | 0.6331| 1.185 > ---------------+--------+--------+--------- > RxCan1[214] Avg| 0.00| 0.0000| 0.023 > Peak| | 0.9977| 34.527 > ---------------+--------+--------+--------- > RxCan1[217] Avg| 0.00| 0.0000| 0.024 > Peak| | 1.2825| 1.328 > ---------------+--------+--------+--------- > RxCan1[218] Avg| 0.00| 0.0000| 0.022 > Peak| | 0.6328| 1.110 > ---------------+--------+--------+--------- > RxCan1[230] Avg| 0.00| 0.0000| 0.019 > Peak| | 0.6742| 5.119 > ---------------+--------+--------+--------- > RxCan1[240] Avg| 0.00| 0.0000| 0.022 > Peak| | 0.1163| 0.343 > ---------------+--------+--------+--------- > RxCan1[242] Avg| 0.00| 0.0000| 0.025 > Peak| | 0.3501| 1.015 > ---------------+--------+--------+--------- > RxCan1[24a] Avg| 0.00| 0.0000| 0.022 > Peak| | 0.1212| 0.338 > ---------------+--------+--------+--------- > RxCan1[24b] Avg| 0.00| 0.0000| 0.023 > Peak| | 0.1289| 0.330 > ---------------+--------+--------+--------- > RxCan1[24c] Avg| 0.00| 0.0000| 0.033 > Peak| | 0.1714| 1.189 > ---------------+--------+--------+--------- > RxCan1[25a] Avg| 0.00| 0.0000| 0.024 > Peak| | 0.1289| 0.510 > ---------------+--------+--------+--------- > RxCan1[25b] Avg| 0.00| 0.0000| 0.022 > Peak| | 0.6685| 0.930 > ---------------+--------+--------+--------- > RxCan1[25c] Avg| 0.00| 0.0000| 0.027 > Peak| | 1.3298| 2.670 > ---------------+--------+--------+--------- > RxCan1[260] Avg| 0.00| 0.0000| 0.023 > Peak| | 0.1271| 0.401 > ---------------+--------+--------+--------- > RxCan1[270] Avg| 0.00| 0.0000| 0.022 > Peak| | 0.6439| 0.898 > ---------------+--------+--------+--------- > RxCan1[280] Avg| 0.00| 0.0000| 0.023 > Peak| | 0.6502| 1.156 > ---------------+--------+--------+--------- > RxCan1[2e4] Avg| 0.00| 0.0000| 0.035 > Peak| | 0.3389| 0.811 > ---------------+--------+--------+--------- > RxCan1[2ec] Avg| 0.00| 0.0000| 0.027 > Peak| | 0.1417| 0.784 > ---------------+--------+--------+--------- > RxCan1[2ed] Avg| 0.00| 0.0000| 0.024 > Peak| | 0.1364| 0.746 > ---------------+--------+--------+--------- > RxCan1[2ee] Avg| 0.00| 0.0000| 0.024 > Peak| | 0.1406| 0.965 > ---------------+--------+--------+--------- > RxCan1[312] Avg| 0.00| 0.0000| 0.023 > Peak| | 0.1293| 0.978 > ---------------+--------+--------+--------- > RxCan1[326] Avg| 0.00| 0.0000| 0.024 > Peak| | 0.1298| 0.518 > ---------------+--------+--------+--------- > RxCan1[336] Avg| 0.00| 0.0000| 0.028 > Peak| | 0.0106| 0.329 > ---------------+--------+--------+--------- > RxCan1[352] Avg| 0.00| 0.0000| 0.030 > Peak| | 0.1054| 0.800 > ---------------+--------+--------+--------- > RxCan1[355] Avg| 0.00| 0.0000| 0.027 > Peak| | 0.0270| 0.546 > ---------------+--------+--------+--------- > RxCan1[35e] Avg| 0.00| 0.0000| 0.023 > Peak| | 0.1288| 0.573 > ---------------+--------+--------+--------- > RxCan1[365] Avg| 0.00| 0.0000| 0.024 > Peak| | 0.1297| 0.358 > ---------------+--------+--------+--------- > RxCan1[366] Avg| 0.00| 0.0000| 0.026 > Peak| | 0.1429| 1.001 > ---------------+--------+--------+--------- > RxCan1[367] Avg| 0.00| 0.0000| 0.026 > Peak| | 0.1472| 0.828 > ---------------+--------+--------+--------- > RxCan1[368] Avg| 0.00| 0.0000| 0.024 > Peak| | 0.1323| 0.931 > ---------------+--------+--------+--------- > RxCan1[369] Avg| 0.00| 0.0000| 0.026 > Peak| | 0.1498| 1.072 > ---------------+--------+--------+--------- > RxCan1[380] Avg| 0.00| 0.0000| 0.022 > Peak| | 0.1285| 0.348 > ---------------+--------+--------+--------- > RxCan1[38b] Avg| 0.00| 0.0000| 0.021 > Peak| | 0.3298| 1.168 > ---------------+--------+--------+--------- > RxCan1[3b3] Avg| 0.00| 0.0000| 0.025 > Peak| | 0.1348| 0.920 > ---------------+--------+--------+--------- > RxCan1[400] Avg| 0.00| 0.0000| 0.022 > Peak| | 0.0481| 0.445 > ---------------+--------+--------+--------- > RxCan1[405] Avg| 0.00| 0.0000| 0.034 > Peak| | 0.0723| 0.473 > ---------------+--------+--------+--------- > RxCan1[40a] Avg| 0.00| 0.0000| 0.025 > Peak| | 0.1040| 0.543 > ---------------+--------+--------+--------- > RxCan1[410] Avg| 0.00| 0.0000| 0.024 > Peak| | 0.1339| 0.678 > ---------------+--------+--------+--------- > RxCan1[411] Avg| 0.00| 0.0000| 0.025 > Peak| | 0.1376| 0.573 > ---------------+--------+--------+--------- > RxCan1[416] Avg| 0.00| 0.0000| 0.023 > Peak| | 0.1284| 0.346 > ---------------+--------+--------+--------- > RxCan1[421] Avg| 0.00| 0.0000| 0.024 > Peak| | 0.1323| 0.643 > ---------------+--------+--------+--------- > RxCan1[42d] Avg| 0.00| 0.0000| 0.023 > Peak| | 0.1362| 1.146 > ---------------+--------+--------+--------- > RxCan1[42f] Avg| 0.00| 0.0000| 0.027 > Peak| | 0.1503| 1.762 > ---------------+--------+--------+--------- > RxCan1[430] Avg| 0.00| 0.0000| 0.023 > Peak| | 0.1352| 0.347 > ---------------+--------+--------+--------- > RxCan1[434] Avg| 0.00| 0.0000| 0.024 > Peak| | 0.1312| 0.580 > ---------------+--------+--------+--------- > RxCan1[435] Avg| 0.00| 0.0000| 0.029 > Peak| | 0.1109| 1.133 > ---------------+--------+--------+--------- > RxCan1[43e] Avg| 0.00| 0.0000| 0.023 > Peak| | 0.2776| 0.686 > ---------------+--------+--------+--------- > RxCan1[440] Avg| 0.00| 0.0000| 0.022 > Peak| | 0.0118| 0.276 > ---------------+--------+--------+--------- > RxCan1[465] Avg| 0.00| 0.0000| 0.022 > Peak| | 0.0118| 0.279 > ---------------+--------+--------+--------- > RxCan1[466] Avg| 0.00| 0.0000| 0.023 > Peak| | 0.0123| 0.310 > ---------------+--------+--------+--------- > RxCan1[467] Avg| 0.00| 0.0000| 0.025 > Peak| | 0.0132| 0.314 > ---------------+--------+--------+--------- > RxCan1[472] Avg| 0.00| 0.0000| 0.101 > Peak| | 0.0307| 1.105 > ---------------+--------+--------+--------- > RxCan1[473] Avg| 0.00| 0.0000| 0.051 > Peak| | 0.0107| 0.575 > ---------------+--------+--------+--------- > RxCan1[474] Avg| 0.00| 0.0000| 0.024 > Peak| | 0.0097| 0.289 > ---------------+--------+--------+--------- > RxCan1[475] Avg| 0.00| 0.0000| 0.023 > Peak| | 0.0220| 0.327 > ---------------+--------+--------+--------- > RxCan1[476] Avg| 0.00| 0.0000| 0.050 > Peak| | 0.0762| 5.329 > ---------------+--------+--------+--------- > RxCan1[477] Avg| 0.00| 0.0000| 0.032 > Peak| | 0.0283| 0.669 > ---------------+--------+--------+--------- > RxCan1[595] Avg| 0.00| 0.0000| 0.026 > Peak| | 0.0103| 0.297 > ---------------+--------+--------+--------- > RxCan1[59e] Avg| 0.00| 0.0000| 0.022 > Peak| | 0.0114| 0.263 > ---------------+--------+--------+--------- > RxCan1[5a2] Avg| 0.00| 0.0000| 0.026 > Peak| | 0.0119| 0.505 > ---------------+--------+--------+--------- > RxCan1[5ba] Avg| 0.00| 0.0000| 0.025 > Peak| | 0.0139| 0.549 > ---------------+--------+--------+--------- > RxCan2[020] Avg| 0.00| 0.0000| 0.026 > Peak| | 0.4923| 1.133 > ---------------+--------+--------+--------- > RxCan2[030] Avg| 0.00| 0.0000| 0.023 > Peak| | 0.3297| 1.136 > ---------------+--------+--------+--------- > RxCan2[03a] Avg| 0.00| 0.0000| 0.022 > Peak| | 0.2792| 1.275 > ---------------+--------+--------+--------- > RxCan2[040] Avg| 0.00| 0.0000| 0.023 > Peak| | 0.2834| 1.080 > ---------------+--------+--------+--------- > RxCan2[060] Avg| 0.00| 0.0000| 0.029 > Peak| | 0.3037| 0.991 > ---------------+--------+--------+--------- > RxCan2[070] Avg| 0.00| 0.0000| 0.025 > Peak| | 0.2291| 0.460 > ---------------+--------+--------+--------- > RxCan2[080] Avg| 0.00| 0.0000| 0.043 > Peak| | 0.4015| 1.007 > ---------------+--------+--------+--------- > RxCan2[083] Avg| 0.00| 0.0000| 0.026 > Peak| | 0.2957| 0.788 > ---------------+--------+--------+--------- > RxCan2[090] Avg| 0.00| 0.0000| 0.027 > Peak| | 0.3951| 1.231 > ---------------+--------+--------+--------- > RxCan2[0a0] Avg| 0.00| 0.0000| 0.026 > Peak| | 0.2560| 0.722 > ---------------+--------+--------+--------- > RxCan2[100] Avg| 0.00| 0.0000| 0.046 > Peak| | 0.4506| 21.961 > ---------------+--------+--------+--------- > RxCan2[108] Avg| 0.00| 0.0000| 0.024 > Peak| | 0.3713| 1.125 > ---------------+--------+--------+--------- > RxCan2[110] Avg| 0.00| 0.0000| 0.029 > Peak| | 0.2443| 0.755 > ---------------+--------+--------+--------- > RxCan2[130] Avg| 0.00| 0.0000| 0.023 > Peak| | 0.2052| 1.097 > ---------------+--------+--------+--------- > RxCan2[150] Avg| 0.00| 0.0000| 0.023 > Peak| | 0.2246| 0.371 > ---------------+--------+--------+--------- > RxCan2[160] Avg| 0.00| 0.0000| 0.024 > Peak| | 0.0755| 1.125 > ---------------+--------+--------+--------- > RxCan2[180] Avg| 0.00| 0.0000| 0.023 > Peak| | 0.2350| 0.936 > ---------------+--------+--------+--------- > RxCan2[190] Avg| 0.00| 0.0000| 0.022 > Peak| | 0.2275| 0.592 > ---------------+--------+--------+--------- > RxCan2[1a0] Avg| 0.00| 0.0000| 0.025 > Peak| | 0.0125| 0.273 > ---------------+--------+--------+--------- > RxCan2[1a4] Avg| 0.00| 0.0000| 0.022 > Peak| | 0.2806| 0.632 > ---------------+--------+--------+--------- > RxCan2[1a8] Avg| 0.00| 0.0000| 0.022 > Peak| | 0.1683| 0.740 > ---------------+--------+--------+--------- > RxCan2[1b0] Avg| 0.00| 0.0000| 0.023 > Peak| | 0.1360| 0.490 > ---------------+--------+--------+--------- > RxCan2[1b4] Avg| 0.00| 0.0000| 0.027 > Peak| | 0.1556| 1.119 > ---------------+--------+--------+--------- > RxCan2[1b8] Avg| 0.00| 0.0000| 0.022 > Peak| | 0.1704| 0.616 > ---------------+--------+--------+--------- > RxCan2[1c0] Avg| 0.00| 0.0000| 0.023 > Peak| | 0.1317| 0.488 > ---------------+--------+--------+--------- > RxCan2[1e0] Avg| 0.00| 0.0000| 0.025 > Peak| | 0.1460| 0.675 > ---------------+--------+--------+--------- > RxCan2[215] Avg| 0.00| 0.0000| 0.023 > Peak| | 0.1191| 0.567 > ---------------+--------+--------+--------- > RxCan2[217] Avg| 0.00| 0.0000| 0.023 > Peak| | 0.1167| 0.869 > ---------------+--------+--------+--------- > RxCan2[220] Avg| 0.00| 0.0000| 0.023 > Peak| | 0.0918| 0.313 > ---------------+--------+--------+--------- > RxCan2[225] Avg| 0.00| 0.0000| 0.025 > Peak| | 0.3635| 1.018 > ---------------+--------+--------+--------- > RxCan2[230] Avg| 0.00| 0.0000| 0.057 > Peak| | 0.2192| 1.063 > ---------------+--------+--------+--------- > RxCan2[240] Avg| 0.00| 0.0000| 0.023 > Peak| | 0.1173| 0.760 > ---------------+--------+--------+--------- > RxCan2[241] Avg| 0.00| 0.0000| 0.022 > Peak| | 0.2830| 1.144 > ---------------+--------+--------+--------- > RxCan2[250] Avg| 0.00| 0.0000| 0.026 > Peak| | 0.0701| 0.698 > ---------------+--------+--------+--------- > RxCan2[255] Avg| 0.00| 0.0000| 0.022 > Peak| | 0.1755| 1.063 > ---------------+--------+--------+--------- > RxCan2[265] Avg| 0.00| 0.0000| 0.024 > Peak| | 0.1771| 0.729 > ---------------+--------+--------+--------- > RxCan2[270] Avg| 0.00| 0.0000| 0.023 > Peak| | 0.0667| 0.307 > ---------------+--------+--------+--------- > RxCan2[290] Avg| 0.00| 0.0000| 0.022 > Peak| | 0.0410| 0.280 > ---------------+--------+--------+--------- > RxCan2[295] Avg| 0.00| 0.0000| 0.023 > Peak| | 0.0881| 0.299 > ---------------+--------+--------+--------- > RxCan2[2a0] Avg| 0.00| 0.0000| 0.023 > Peak| | 0.0420| 0.268 > ---------------+--------+--------+--------- > RxCan2[2a7] Avg| 0.00| 0.0000| 0.021 > Peak| | 0.1716| 0.454 > ---------------+--------+--------+--------- > RxCan2[2b0] Avg| 0.00| 0.0000| 0.023 > Peak| | 0.0424| 0.300 > ---------------+--------+--------+--------- > RxCan2[2c0] Avg| 0.00| 0.0000| 0.024 > Peak| | 0.0470| 0.298 > ---------------+--------+--------+--------- > RxCan2[2e0] Avg| 0.00| 0.0000| 0.030 > Peak| | 0.0324| 1.152 > ---------------+--------+--------+--------- > RxCan2[2f0] Avg| 0.00| 0.0000| 0.024 > Peak| | 0.0229| 0.359 > ---------------+--------+--------+--------- > RxCan2[2f5] Avg| 0.00| 0.0000| 0.026 > Peak| | 0.1882| 0.673 > ---------------+--------+--------+--------- > RxCan2[300] Avg| 0.00| 0.0000| 0.022 > Peak| | 0.0186| 0.263 > ---------------+--------+--------+--------- > RxCan2[310] Avg| 0.00| 0.0000| 0.024 > Peak| | 0.0210| 0.265 > ---------------+--------+--------+--------- > RxCan2[320] Avg| 0.00| 0.0000| 0.025 > Peak| | 0.0207| 0.354 > ---------------+--------+--------+--------- > RxCan2[326] Avg| 0.00| 0.0000| 0.023 > Peak| | 0.1466| 0.686 > ---------------+--------+--------+--------- > RxCan2[330] Avg| 0.00| 0.0000| 0.022 > Peak| | 0.4580| 0.708 > ---------------+--------+--------+--------- > RxCan2[340] Avg| 0.00| 0.0000| 0.031 > Peak| | 0.1621| 0.785 > ---------------+--------+--------+--------- > RxCan2[345] Avg| 0.00| 0.0000| 0.021 > Peak| | 0.0199| 0.261 > ---------------+--------+--------+--------- > RxCan2[35e] Avg| 0.00| 0.0000| 0.023 > Peak| | 0.0686| 0.449 > ---------------+--------+--------+--------- > RxCan2[360] Avg| 0.00| 0.0000| 0.025 > Peak| | 0.0204| 0.289 > ---------------+--------+--------+--------- > RxCan2[361] Avg| 0.00| 0.0000| 0.022 > Peak| | 0.1166| 0.316 > ---------------+--------+--------+--------- > RxCan2[363] Avg| 0.00| 0.0000| 0.023 > Peak| | 0.0146| 0.304 > ---------------+--------+--------+--------- > RxCan2[370] Avg| 0.00| 0.0000| 0.024 > Peak| | 0.0099| 0.278 > ---------------+--------+--------+--------- > RxCan2[381] Avg| 0.00| 0.0000| 0.025 > Peak| | 0.0468| 0.459 > ---------------+--------+--------+--------- > RxCan2[3a0] Avg| 0.00| 0.0000| 0.021 > Peak| | 0.2339| 0.617 > ---------------+--------+--------+--------- > RxCan2[3d0] Avg| 0.00| 0.0000| 0.022 > Peak| | 0.1351| 0.351 > ---------------+--------+--------+--------- > RxCan2[3d5] Avg| 0.00| 0.0000| 0.023 > Peak| | 0.0796| 0.692 > ---------------+--------+--------+--------- > RxCan2[400] Avg| 0.00| 0.0000| 0.023 > Peak| | 0.0537| 0.307 > ---------------+--------+--------+--------- > RxCan2[405] Avg| 0.00| 0.0000| 0.021 > Peak| | 0.0513| 0.303 > ---------------+--------+--------+--------- > RxCan2[40a] Avg| 0.00| 0.0000| 0.022 > Peak| | 0.1099| 0.313 > ---------------+--------+--------+--------- > RxCan2[415] Avg| 0.00| 0.0000| 0.022 > Peak| | 0.0204| 0.251 > ---------------+--------+--------+--------- > RxCan2[435] Avg| 0.00| 0.0000| 0.028 > Peak| | 0.0113| 0.342 > ---------------+--------+--------+--------- > RxCan2[440] Avg| 0.00| 0.0000| 0.027 > Peak| | 0.0110| 0.299 > ---------------+--------+--------+--------- > RxCan2[465] Avg| 0.00| 0.0000| 0.023 > Peak| | 0.0122| 0.295 > ---------------+--------+--------+--------- > RxCan2[466] Avg| 0.00| 0.0000| 0.022 > Peak| | 0.0117| 0.267 > ---------------+--------+--------+--------- > RxCan2[467] Avg| 0.00| 0.0000| 0.022 > Peak| | 0.0164| 0.325 > ---------------+--------+--------+--------- > RxCan2[501] Avg| 0.00| 0.0000| 0.023 > Peak| | 0.0236| 0.276 > ---------------+--------+--------+--------- > RxCan2[503] Avg| 0.00| 0.0000| 0.023 > Peak| | 0.0248| 0.349 > ---------------+--------+--------+--------- > RxCan2[504] Avg| 0.00| 0.0000| 0.023 > Peak| | 0.0230| 0.312 > ---------------+--------+--------+--------- > RxCan2[505] Avg| 0.00| 0.0000| 0.025 > Peak| | 0.0256| 0.310 > ---------------+--------+--------+--------- > RxCan2[508] Avg| 0.00| 0.0000| 0.023 > Peak| | 0.0281| 0.329 > ---------------+--------+--------+--------- > RxCan2[511] Avg| 0.00| 0.0000| 0.022 > Peak| | 0.0232| 0.282 > ---------------+--------+--------+--------- > RxCan2[51e] Avg| 0.00| 0.0000| 0.023 > Peak| | 0.0248| 0.298 > ---------------+--------+--------+--------- > RxCan2[581] Avg| 0.00| 0.0000| 0.025 > Peak| | 0.0166| 0.286 > ===============+========+========+========= > Total Avg| 0.00| 0.0000| 43.563 > > At the same time, calling poller times on, poller times status causes the bus to crash, although no polls are actively being sent at all. > > Cheers, > Simon > _______________________________________________ > OvmsDev mailing list > OvmsDev@lists.openvehicles.com > http://lists.openvehicles.com/mailman/listinfo/ovmsdev > > > _______________________________________________ > OvmsDev mailing list > OvmsDev@lists.openvehicles.com > http://lists.openvehicles.com/mailman/listinfo/ovmsdev
_______________________________________________ OvmsDev mailing list OvmsDev@lists.openvehicles.com http://lists.openvehicles.com/mailman/listinfo/ovmsdev
_______________________________________________ OvmsDev mailing list OvmsDev@lists.openvehicles.com http://lists.openvehicles.com/mailman/listinfo/ovmsdev
-- Michael Balzer *Am Rahmen 5 * D-58313 Herdecke <https://www.google.com/maps/search/Am+Rahmen+5+*+D-58313+Herdecke?entry=gmail&source=g> Fon 02330 9104094 * Handy 0176 20698926
_______________________________________________ OvmsDev mailing list OvmsDev@lists.openvehicles.com http://lists.openvehicles.com/mailman/listinfo/ovmsdev
_______________________________________________ OvmsDev mailing list OvmsDev@lists.openvehicles.com http://lists.openvehicles.com/mailman/listinfo/ovmsdev
Simon, AFAIK "Pollers[Send]" is the regular "next round" request for the polling task, not a frame transmission. A TX attempt in listen mode would produce a warn level log entry "Cannot write <busname> when not in ACTIVE mode" for tag "esp32can" or "mcp2515". With the old poller, you wouldn't have had any indication of a queue overflow, so the new poller may help you to identify an issue in your code. You need to understand the new poller not only does polls, it's now the main CAN receiver for the vehicle module. That's why your poller time stats include all process data frames as well, not only protocol frames. The overflow means either your CAN processing is too slow to keep up with the packets received, or some other task is hogging the CPU. That would need to be a task with an equal or higher priority as the vehicle task, which has priority level 10 -- only system & networking tasks are above, so that's not likely. (You can check the CPU usage with the "module tasks" command.) That means you should check your standard frame processing (`IncomingFrameCanX` callbacks) for potential delays and processing complexity issues. The poller statistics can help you track this down, but you need to have at least 10 seconds of statistics, the more the better. Rule of thumb: PRI average at 0.0/second means you don't have enough data yet. (-- //.ichael, correct me if I'm wrong)
At the same time, calling poller times on, poller times status causes the bus to crash
In any case that still doesn't explain how the poller could possibly cause a CAN bus (!) crash without actually doing any transmissions. How does the CAN bus crash manifest? Regards, Michael Am 15.01.25 um 19:54 schrieb Simon Ehlen via OvmsDev:
I put the two buses back into listen mode and drove a short distance and charged the car. As I said, there is no active polling in my code. As expected, there is therefore no indication of a failed TX attempt in the console log. I only continue to see a lot of RX Task Queue Overflow messages in the log, which I did not have before. I also see a Pollers[Send]: Task Queue Overflow entry, but since I don't see any indication of “cannot write” on that, I'm not assuming that's a “real” send.
I (19760210) vehicle-poll: Poller[Frame]: RX Task Queue Overflow Run 5 I (19764420) vehicle-poll: Poller[Frame]: RX Task Queue Overflow Run 1 I (19764420) vehicle-poll: Poller[Frame]: RX Task Queue Overflow Run 3 I (19764420) vehicle-poll: Poller[Frame]: RX Task Queue Overflow Run 1 I (19764740) vehicle-poll: Poller[Frame]: RX Task Queue Overflow Run 1 I (19764740) vehicle-poll: Poller[Frame]: RX Task Queue Overflow Run 1 I (19764740) vehicle-poll: Poller[Frame]: RX Task Queue Overflow Run 1 I (19764740) vehicle-poll: Poller[Frame]: RX Task Queue Overflow Run 1 I (19764740) vehicle-poll: Poller[Frame]: RX Task Queue Overflow Run 1 I (19764750) vehicle-poll: Poller[Frame]: RX Task Queue Overflow Run 2 I (19764750) vehicle-poll: Poller[Frame]: RX Task Queue Overflow Run 1 I (19764750) vehicle-poll: Poller[Frame]: RX Task Queue Overflow Run 2 I (19764870) vehicle-poll: Poller[Frame]: RX Task Queue Overflow Run 1 I (19764870) vehicle-poll: Poller[Frame]: RX Task Queue Overflow Run 2 I (19765270) vehicle-poll: Poller[Frame]: RX Task Queue Overflow Run 4 I (19765270) vehicle-poll: Poller[Frame]: RX Task Queue Overflow Run 6 I (19765610) vehicle-poll: Poller[Frame]: RX Task Queue Overflow Run 3 I (19765930) vehicle-poll: Poller[Frame]: RX Task Queue Overflow Run 1 I (19765930) vehicle-poll: Poller[Frame]: RX Task Queue Overflow Run 3 I (19765930) vehicle-poll: Poller[Frame]: RX Task Queue Overflow Run 1 I (19766260) vehicle-poll: Poller[Frame]: RX Task Queue Overflow Run 50 I (19766260) vehicle-poll: Poller[Frame]: RX Task Queue Overflow Run 48 I (19766260) vehicle-poll: Poller[Frame]: RX Task Queue Overflow Run 27 I (19766270) vehicle-poll: Poller[Frame]: RX Task Queue Overflow Run 6 I (19766270) vehicle-poll: Poller[Frame]: RX Task Queue Overflow Run 4 E (19766280) can: can2: intr=4754831 rxpkt=4757493 txpkt=0 errflags=0x22401c02 rxerr=0 txerr=0 rxinval=0 rxovr=0 txovr=0 txdelay=0 txfail=0 wdgreset=1 errreset=0 E (19766300) can: can2: intr=4754831 rxpkt=4757494 txpkt=0 errflags=0x23401c01 rxerr=0 txerr=0 rxinval=0 rxovr=0 txovr=0 txdelay=0 txfail=0 wdgreset=1 errreset=0 I (19766300) vehicle-poll: Poller[Frame]: RX Task Queue Overflow Run 7 I (19766340) vehicle-poll: Poller[Frame]: RX Task Queue Overflow Run 39 I (19766350) vehicle-poll: Poller[Frame]: RX Task Queue Overflow Run 32 I (19766350) vehicle-poll: Poller[Frame]: RX Task Queue Overflow Run 17 I (19766350) vehicle-poll: Poller[Frame]: RX Task Queue Overflow Run 3 I (19766350) vehicle-poll: Pollers[Send]: Task Queue Overflow I (19766350) vehicle-poll: Poller[Frame]: RX Task Queue Overflow Run 1 I (19766350) vehicle-poll: Poller[Frame]: RX Task Queue Overflow Run 1 E (19766360) can: can2: intr=4754840 rxpkt=4757509 txpkt=0 errflags=0x22401c02 rxerr=0 txerr=0 rxinval=0 rxovr=0 txovr=0 txdelay=0 txfail=0 wdgreset=1 errreset=0 I (19766370) vehicle-poll: Poller[Frame]: RX Task Queue Overflow Run 4 E (19766370) can: can2: intr=4754840 rxpkt=4757510 txpkt=0 errflags=0x23401c01 rxerr=0 txerr=0 rxinval=0 rxovr=0 txovr=0 txdelay=0 txfail=0 wdgreset=1 errreset=0 I (19766430) vehicle-poll: Poller[Frame]: RX Task Queue Overflow Run 30 I (19766430) vehicle-poll: Poller[Frame]: RX Task Queue Overflow Run 36 I (19766430) vehicle-poll: Poller[Frame]: RX Task Queue Overflow Run 26 I (19766430) vehicle-poll: Poller[Frame]: RX Task Queue Overflow Run 4 I (19766430) vehicle-poll: Poller[Frame]: RX Task Queue Overflow Run 3 I (19766430) vehicle-poll: Poller[Frame]: RX Task Queue Overflow Run 2 I (19766430) vehicle-poll: Poller[Frame]: RX Task Queue Overflow Run 1 E (19766450) can: can2: intr=4754855 rxpkt=4757535 txpkt=0 errflags=0x23001001 rxerr=0 txerr=0 rxinval=0 rxovr=0 txovr=0 txdelay=0 txfail=0 wdgreset=1 errreset=0 E (19766460) can: can2: intr=4754855 rxpkt=4757536 txpkt=0 errflags=0x23401c01 rxerr=0 txerr=0 rxinval=0 rxovr=0 txovr=0 txdelay=0 txfail=0 wdgreset=1 errreset=0 E (19766520) can: can2: intr=4754855 rxpkt=4757539 txpkt=0 errflags=0x22001002 rxerr=0 txerr=0 rxinval=0 rxovr=0 txovr=0 txdelay=0 txfail=0 wdgreset=1 errreset=0 I (19766520) vehicle-poll: Poller[Frame]: RX Task Queue Overflow Run 9 I (19766520) vehicle-poll: Poller[Frame]: RX Task Queue Overflow Run 37 I (19766520) vehicle-poll: Poller[Frame]: RX Task Queue Overflow Run 30 I (19766520) vehicle-poll: Poller[Frame]: RX Task Queue Overflow Run 6 I (19766520) vehicle-poll: Poller[Frame]: RX Task Queue Overflow Run 2 I (19766520) vehicle-poll: Poller[Frame]: RX Task Queue Overflow Run 1 I (19766520) vehicle-poll: Poller[Frame]: RX Task Queue Overflow Run 1 I (19766520) vehicle-poll: Poller[Frame]: RX Task Queue Overflow Run 3 I (19766530) vehicle-poll: Poller[Frame]: RX Task Queue Overflow Run 1 I (19766530) vehicle-poll: Poller[Frame]: RX Task Queue Overflow Run 1 I (19766530) vehicle-poll: Poller[Frame]: RX Task Queue Overflow Run 1 E (19766540) can: can2: intr=4754861 rxpkt=4757548 txpkt=0 errflags=0x23401c01 rxerr=0 txerr=0 rxinval=0 rxovr=0 txovr=0 txdelay=0 txfail=0 wdgreset=1 errreset=0 I (19766550) vehicle-poll: Poller[Frame]: RX Task Queue Overflow Run 3 E (19766560) can: can2: intr=4754861 rxpkt=4757552 txpkt=0 errflags=0x23001001 rxerr=0 txerr=0 rxinval=0 rxovr=0 txovr=0 txdelay=0 txfail=0 wdgreset=1 errreset=0 E (19766610) can: can2: intr=4754861 rxpkt=4757553 txpkt=0 errflags=0x23401c01 rxerr=0 txerr=0 rxinval=0 rxovr=0 txovr=0 txdelay=0 txfail=0 wdgreset=1 errreset=0 I (19766610) vehicle-poll: Poller[Frame]: RX Task Queue Overflow Run 4 I (19766610) vehicle-poll: Poller[Frame]: RX Task Queue Overflow Run 5 I (19766610) vehicle-poll: Poller[Frame]: RX Task Queue Overflow Run 33 I (19766610) vehicle-poll: Poller[Frame]: RX Task Queue Overflow Run 34 I (19766610) vehicle-poll: Poller[Frame]: RX Task Queue Overflow Run 12 W (19767070) websocket: WebSocketHandler[0x3f8d79d8]: job queue overflow detected W (19767140) websocket: WebSocketHandler[0x3f8d79d8]: job queue overflow detected W (19767180) websocket: WebSocketHandler[0x3f8d79d8]: job queue overflow resolved, 1 drops W (19767260) websocket: WebSocketHandler[0x3f8d79d8]: job queue overflow detected W (19767310) websocket: WebSocketHandler[0x3f8d79d8]: job queue overflow resolved, 1 drops
Cheers Simon
Am 15.01.2025 um 19:18 schrieb Derek Caudwell via OvmsDev:
Since the following email I have high confidence the issue on the Leaf is related/caused by the poller as there has been no further occurrence and Chris has also experienced the car going to neutral on the new poller firmware.
.... I haven't ruled out it being a fault with my car yet. Shortly after it faulted the car was run into so has been off the road for sometime, my first step was to replace 12V battery. The ovms unit is now unplugged and if it does not fault over the next month while driving I'll be reasonably confident it's ovms related.
Not sure which firmware version the poller updates were included in but it was only after upgrading to it that the errors occurred (which could be coincidental however it has faulted twice more both on version 3.3.004-141-gf729d82c). For periods where I reverted to 3.3.003 it was fine.
It might be useful to have an extra option on the enable can write to only enable it when the car is parked/charging.
On Wed, 15 Jan 2025, 11:11 pm Michael Balzer via OvmsDev, <ovmsdev@lists.openvehicles.com> wrote:
Derek, can you comment on this? Do you still have the issue mentioned?
Speaking of the Leaf, the code there actually does something fishy in `CommandWakeup()`:
unsigned char data = 0; … m_can1->WriteStandard(0x5C0, *_8_*, &data); //Wakes up the VCM (by spoofing empty battery request heating)
And there are CAN transmissions from command execution in the Leaf code, so to be sure there is no TX, listen mode is needed there as well.
Regarding CAN trace, you can try with the monitor channel and use the USB console to record the log output. That way you should be able to at least rule out there are regular transmissions -- assuming not every TX will cause an immediate crash.
Another / probably better option: when in listen mode, the log will also tell you about TX attempts, as the driver will issue a warning on each.
The CAN monitor log may also tell you about bus errors detected.
Regards, Michael
Am 15.01.25 um 10:44 schrieb Simon Ehlen via OvmsDev:
There is at least one more Leaf from Derek that has also ended up in limp mode since the new poller. There, too, no polling was actually carried out while driving. I'm not familiar with the framework at all, but does this perhaps offer you enough of an approach to recognize a commonality?
Unfortunately I do not have a tool to create a CAN trace. I can't use the OVMS for this, as it no longer responds after a bus crash until I have disconnected it from the OBD and plugged it back in.
Cheers, Simon
Am 15.01.2025 um 10:18 schrieb Michael Balzer via OvmsDev:
The frame acknowledging is done automatically by the CAN transceiver when in active mode, this is part of the CAN protocol to indicate bit errors to the sender.
So normally a failure of the system to process received frames fast enough cannot cause any issue on the bus. But the ESP32 has a range of known hardware issues, especially in the embedded CAN transceiver, I wouldn't be surprised if there are more, or if our driver lacks some workaround for these.
Maybe the new poller has some bug that causes false transmissions from process data frames received. But many vehicles send process data frames, and we've had no issue reports like this on any of them, and ECUs also normally simply ignore out of sequence protocol frames.
You could record a CAN trace to see if there are transmissions, and what kind. If you don't poll and don't send frames from your code, there should be none. If the bus still crashes, that would be an indicator for something going wrong in the transceiver.
Regards, Michael
Am 15.01.25 um 07:15 schrieb Simon Ehlen via OvmsDev:
Thanks Mark for the explanation. So does this mean that OVMS tries to acknowledge all incoming messages in active mode? This seems to me to clearly exceed the capacity of OVMS with the mass of incoming messages.
In fact, I am currently opening the bus in active mode, as I was hoping to get my code to revive the BMS in OVMS to work. However, unlike the other data, I only get the cell voltages when I actively poll them. To be on the safe side, I will now open the bus in read mode again.
However, I am still wondering what in the poller change has altered the OVMS in such a way that the bus is now crashing completely. Currently I have undone the changes since february 2024, this only concerns code from the public repository, there was no change from me in that period. Now the OVMS is running stable again and there are neither queue overflows nor bus crashes.
I had also previously increased the following queue sizes, but unfortunately this was not successful: CONFIG_OVMS_HW_EVENT_QUEUE_SIZE=120 CONFIG_OVMS_HW_CAN_RX_QUEUE_SIZE=80 CONFIG_OVMS_VEHICLE_CAN_RX_QUEUE_SIZE=80
Cheers, Simon
Am 15.01.2025 um 02:08 schrieb Mark Webb-Johnson:
Note sure if this helps, but some comments:
* Remember than CAN protocol in normal mode is an ‘active’ protocol. Nodes on the bus are actively acknowledging messages (and that includes OVMS), even if they never write messages. So in normal mode there is no absolute ‘read access’. For example, opening the CAN port at the wrong baud rate, even if not writing messages, will mess up the bus.
* However, if you open the CAN port in ‘listen’ mode, then it is truly read-only. In that mode it will not acknowledge messages, and cannot write on the bus at all. I’ve never seen an OVMS mess up a bus in listen mode, even if the baud rate is wrong. I think the only way for that to happen would be a hardware layer issue (cabling, termination, etc).
Regards, Mark.
> On 15 Jan 2025, at 6:30 AM, Simon Ehlen via OvmsDev > <ovmsdev@lists.openvehicles.com> > <mailto:ovmsdev@lists.openvehicles.com> wrote: > > But what is the reason that a read access to the bus can > cause the bus to crash? > This is not critical during charging, it just aborts the > charging process with an error. > While driving, this results in a “stop safely now” error > message on the dashboard and the engine is switched off > immediately. > > Cheers, > Simon > > Am 14.01.2025 um 23:22 schrieb Michael Geddes via OvmsDev: >> You may need to increase the queue size for the poll task >> queue. >> >> The poller still handles the bus to vehicle notifications >> even if it is off. >> >> Any poller logging on such an intensive load of can >> messages is likely to be a problem. This is part of the >> reason it is flagged off. >> >> The total % looks wrong :/ >> >> //.ichael >> >> >> >> >> On Wed, 15 Jan 2025, 03:17 Simon Ehlen via OvmsDev, >> <ovmsdev@lists.openvehicles.com> wrote: >> >> Hi, >> >> I finally got around to merging my code with the >> current master (previous merge february 2024). >> I have rebuilt my code for a Ford Focus Electric so >> that it uses the new OvmsPoller class. >> >> However, I now see a lot of entries like this in my log: >> >> I (246448) vehicle-poll: Poller[Frame]: RX Task Queue >> Overflow Run 8 >> I (246448) vehicle-poll: Poller[Frame]: RX Task Queue >> Overflow Run 3 >> I (246448) vehicle-poll: Poller[Frame]: RX Task Queue >> Overflow Run 1 >> I (246448) vehicle-poll: Poller[Frame]: RX Task Queue >> Overflow Run 2 >> I (246448) vehicle-poll: Poller[Frame]: RX Task Queue >> Overflow Run 1 >> I (246448) vehicle-poll: Poller[Frame]: RX Task Queue >> Overflow Run 2 >> I (246448) vehicle-poll: Poller[Frame]: RX Task Queue >> Overflow Run 1 >> I (246448) vehicle-poll: Poller[Frame]: RX Task Queue >> Overflow Run 1 >> I (254448) vehicle-poll: Poller[Frame]: RX Task Queue >> Overflow Run 24 >> I (254448) vehicle-poll: Poller[Frame]: RX Task Queue >> Overflow Run 1 >> I (254448) vehicle-poll: Poller[Frame]: RX Task Queue >> Overflow Run 1 >> I (254448) vehicle-poll: Poller[Frame]: RX Task Queue >> Overflow Run 1 >> I (254448) vehicle-poll: Poller[Frame]: RX Task Queue >> Overflow Run 1 >> I (254448) vehicle-poll: Poller[Frame]: RX Task Queue >> Overflow Run 1 >> I (254448) vehicle-poll: Poller[Frame]: RX Task >> Queue Overflow Run 1 >> >> Was this message just hidden before or do I need to >> make further adjustments to my code? >> >> My code currently does not use active polling but reads >> on the busses (IncomingFrameCanX) on certain modules. >> >> When I look at poller times status, it looks very >> extensive to me... >> >> OVMS# poller times status >> Poller timing is: on >> Type | count | Utlztn | Time >> | per s | [%] | [ms] >> ---------------+--------+--------+--------- >> Poll:PRI Avg| 0.00| 0.0000| 0.003 >> Peak| | 0.0014| 0.041 >> ---------------+--------+--------+--------- >> RxCan1[010] Avg| 0.00| 0.0000| 0.020 >> Peak| | 1.2217| 1.089 >> ---------------+--------+--------+--------- >> RxCan1[030] Avg| 0.00| 0.0000| 0.024 >> Peak| | 1.2193| 1.241 >> ---------------+--------+--------+--------- >> RxCan1[041] Avg| 0.00| 0.0000| 0.023 >> Peak| | 0.6460| 1.508 >> ---------------+--------+--------+--------- >> RxCan1[049] Avg| 0.00| 0.0000| 0.024 >> Peak| | 0.6320| 0.630 >> ---------------+--------+--------+--------- >> RxCan1[04c] Avg| 0.00| 0.0000| 0.023 >> Peak| | 0.6430| 1.474 >> ---------------+--------+--------+--------- >> RxCan1[04d] Avg| 0.00| 0.0000| 0.022 >> Peak| | 1.2987| 1.359 >> ---------------+--------+--------+--------- >> RxCan1[076] Avg| 0.00| 0.0000| 0.072 >> Peak| | 0.7818| 15.221 >> ---------------+--------+--------+--------- >> RxCan1[077] Avg| 0.00| 0.0000| 0.022 >> Peak| | 0.6274| 0.955 >> ---------------+--------+--------+--------- >> RxCan1[07a] Avg| 0.00| 0.0000| 0.039 >> Peak| | 1.7602| 1.684 >> ---------------+--------+--------+--------- >> RxCan1[07d] Avg| 0.00| 0.0000| 0.023 >> Peak| | 0.6621| 1.913 >> ---------------+--------+--------+--------- >> RxCan1[0c8] Avg| 0.00| 0.0000| 0.026 >> Peak| | 0.6292| 1.412 >> ---------------+--------+--------+--------- >> RxCan1[11a] Avg| 0.00| 0.0000| 0.023 >> Peak| | 1.2635| 1.508 >> ---------------+--------+--------+--------- >> RxCan1[130] Avg| 0.00| 0.0000| 0.024 >> Peak| | 0.6548| 0.703 >> ---------------+--------+--------+--------- >> RxCan1[139] Avg| 0.00| 0.0000| 0.021 >> Peak| | 0.6002| 0.984 >> ---------------+--------+--------+--------- >> RxCan1[156] Avg| 0.00| 0.0000| 0.024 >> Peak| | 0.1225| 0.479 >> ---------------+--------+--------+--------- >> RxCan1[160] Avg| 0.00| 0.0000| 0.028 >> Peak| | 0.6586| 1.376 >> ---------------+--------+--------+--------- >> RxCan1[165] Avg| 0.00| 0.0000| 0.027 >> Peak| | 0.6368| 1.132 >> ---------------+--------+--------+--------- >> RxCan1[167] Avg| 0.00| 0.0000| 0.024 >> Peak| | 1.3009| 1.067 >> ---------------+--------+--------+--------- >> RxCan1[171] Avg| 0.00| 0.0000| 0.022 >> Peak| | 0.6590| 4.320 >> ---------------+--------+--------+--------- >> RxCan1[178] Avg| 0.00| 0.0000| 0.023 >> Peak| | 0.1161| 0.311 >> ---------------+--------+--------+--------- >> RxCan1[179] Avg| 0.00| 0.0000| 0.024 >> Peak| | 0.1236| 0.536 >> ---------------+--------+--------+--------- >> RxCan1[180] Avg| 0.00| 0.0000| 0.022 >> Peak| | 0.6472| 1.193 >> ---------------+--------+--------+--------- >> RxCan1[185] Avg| 0.00| 0.0000| 0.022 >> Peak| | 0.6777| 1.385 >> ---------------+--------+--------+--------- >> RxCan1[1a0] Avg| 0.00| 0.0000| 0.022 >> Peak| | 0.6486| 2.276 >> ---------------+--------+--------+--------- >> RxCan1[1e0] Avg| 0.00| 0.0000| 0.023 >> Peak| | 0.6725| 1.376 >> ---------------+--------+--------+--------- >> RxCan1[1e4] Avg| 0.00| 0.0000| 0.027 >> Peak| | 0.7370| 1.266 >> ---------------+--------+--------+--------- >> RxCan1[1f0] Avg| 0.00| 0.0000| 0.024 >> Peak| | 0.4253| 0.753 >> ---------------+--------+--------+--------- >> RxCan1[200] Avg| 0.00| 0.0000| 0.025 >> Peak| | 0.6262| 0.791 >> ---------------+--------+--------+--------- >> RxCan1[202] Avg| 0.00| 0.0000| 0.021 >> Peak| | 1.2915| 1.257 >> ---------------+--------+--------+--------- >> RxCan1[204] Avg| 0.00| 0.0000| 0.022 >> Peak| | 1.2620| 1.010 >> ---------------+--------+--------+--------- >> RxCan1[213] Avg| 0.00| 0.0000| 0.022 >> Peak| | 0.6331| 1.185 >> ---------------+--------+--------+--------- >> RxCan1[214] Avg| 0.00| 0.0000| 0.023 >> Peak| | 0.9977| 34.527 >> ---------------+--------+--------+--------- >> RxCan1[217] Avg| 0.00| 0.0000| 0.024 >> Peak| | 1.2825| 1.328 >> ---------------+--------+--------+--------- >> RxCan1[218] Avg| 0.00| 0.0000| 0.022 >> Peak| | 0.6328| 1.110 >> ---------------+--------+--------+--------- >> RxCan1[230] Avg| 0.00| 0.0000| 0.019 >> Peak| | 0.6742| 5.119 >> ---------------+--------+--------+--------- >> RxCan1[240] Avg| 0.00| 0.0000| 0.022 >> Peak| | 0.1163| 0.343 >> ---------------+--------+--------+--------- >> RxCan1[242] Avg| 0.00| 0.0000| 0.025 >> Peak| | 0.3501| 1.015 >> ---------------+--------+--------+--------- >> RxCan1[24a] Avg| 0.00| 0.0000| 0.022 >> Peak| | 0.1212| 0.338 >> ---------------+--------+--------+--------- >> RxCan1[24b] Avg| 0.00| 0.0000| 0.023 >> Peak| | 0.1289| 0.330 >> ---------------+--------+--------+--------- >> RxCan1[24c] Avg| 0.00| 0.0000| 0.033 >> Peak| | 0.1714| 1.189 >> ---------------+--------+--------+--------- >> RxCan1[25a] Avg| 0.00| 0.0000| 0.024 >> Peak| | 0.1289| 0.510 >> ---------------+--------+--------+--------- >> RxCan1[25b] Avg| 0.00| 0.0000| 0.022 >> Peak| | 0.6685| 0.930 >> ---------------+--------+--------+--------- >> RxCan1[25c] Avg| 0.00| 0.0000| 0.027 >> Peak| | 1.3298| 2.670 >> ---------------+--------+--------+--------- >> RxCan1[260] Avg| 0.00| 0.0000| 0.023 >> Peak| | 0.1271| 0.401 >> ---------------+--------+--------+--------- >> RxCan1[270] Avg| 0.00| 0.0000| 0.022 >> Peak| | 0.6439| 0.898 >> ---------------+--------+--------+--------- >> RxCan1[280] Avg| 0.00| 0.0000| 0.023 >> Peak| | 0.6502| 1.156 >> ---------------+--------+--------+--------- >> RxCan1[2e4] Avg| 0.00| 0.0000| 0.035 >> Peak| | 0.3389| 0.811 >> ---------------+--------+--------+--------- >> RxCan1[2ec] Avg| 0.00| 0.0000| 0.027 >> Peak| | 0.1417| 0.784 >> ---------------+--------+--------+--------- >> RxCan1[2ed] Avg| 0.00| 0.0000| 0.024 >> Peak| | 0.1364| 0.746 >> ---------------+--------+--------+--------- >> RxCan1[2ee] Avg| 0.00| 0.0000| 0.024 >> Peak| | 0.1406| 0.965 >> ---------------+--------+--------+--------- >> RxCan1[312] Avg| 0.00| 0.0000| 0.023 >> Peak| | 0.1293| 0.978 >> ---------------+--------+--------+--------- >> RxCan1[326] Avg| 0.00| 0.0000| 0.024 >> Peak| | 0.1298| 0.518 >> ---------------+--------+--------+--------- >> RxCan1[336] Avg| 0.00| 0.0000| 0.028 >> Peak| | 0.0106| 0.329 >> ---------------+--------+--------+--------- >> RxCan1[352] Avg| 0.00| 0.0000| 0.030 >> Peak| | 0.1054| 0.800 >> ---------------+--------+--------+--------- >> RxCan1[355] Avg| 0.00| 0.0000| 0.027 >> Peak| | 0.0270| 0.546 >> ---------------+--------+--------+--------- >> RxCan1[35e] Avg| 0.00| 0.0000| 0.023 >> Peak| | 0.1288| 0.573 >> ---------------+--------+--------+--------- >> RxCan1[365] Avg| 0.00| 0.0000| 0.024 >> Peak| | 0.1297| 0.358 >> ---------------+--------+--------+--------- >> RxCan1[366] Avg| 0.00| 0.0000| 0.026 >> Peak| | 0.1429| 1.001 >> ---------------+--------+--------+--------- >> RxCan1[367] Avg| 0.00| 0.0000| 0.026 >> Peak| | 0.1472| 0.828 >> ---------------+--------+--------+--------- >> RxCan1[368] Avg| 0.00| 0.0000| 0.024 >> Peak| | 0.1323| 0.931 >> ---------------+--------+--------+--------- >> RxCan1[369] Avg| 0.00| 0.0000| 0.026 >> Peak| | 0.1498| 1.072 >> ---------------+--------+--------+--------- >> RxCan1[380] Avg| 0.00| 0.0000| 0.022 >> Peak| | 0.1285| 0.348 >> ---------------+--------+--------+--------- >> RxCan1[38b] Avg| 0.00| 0.0000| 0.021 >> Peak| | 0.3298| 1.168 >> ---------------+--------+--------+--------- >> RxCan1[3b3] Avg| 0.00| 0.0000| 0.025 >> Peak| | 0.1348| 0.920 >> ---------------+--------+--------+--------- >> RxCan1[400] Avg| 0.00| 0.0000| 0.022 >> Peak| | 0.0481| 0.445 >> ---------------+--------+--------+--------- >> RxCan1[405] Avg| 0.00| 0.0000| 0.034 >> Peak| | 0.0723| 0.473 >> ---------------+--------+--------+--------- >> RxCan1[40a] Avg| 0.00| 0.0000| 0.025 >> Peak| | 0.1040| 0.543 >> ---------------+--------+--------+--------- >> RxCan1[410] Avg| 0.00| 0.0000| 0.024 >> Peak| | 0.1339| 0.678 >> ---------------+--------+--------+--------- >> RxCan1[411] Avg| 0.00| 0.0000| 0.025 >> Peak| | 0.1376| 0.573 >> ---------------+--------+--------+--------- >> RxCan1[416] Avg| 0.00| 0.0000| 0.023 >> Peak| | 0.1284| 0.346 >> ---------------+--------+--------+--------- >> RxCan1[421] Avg| 0.00| 0.0000| 0.024 >> Peak| | 0.1323| 0.643 >> ---------------+--------+--------+--------- >> RxCan1[42d] Avg| 0.00| 0.0000| 0.023 >> Peak| | 0.1362| 1.146 >> ---------------+--------+--------+--------- >> RxCan1[42f] Avg| 0.00| 0.0000| 0.027 >> Peak| | 0.1503| 1.762 >> ---------------+--------+--------+--------- >> RxCan1[430] Avg| 0.00| 0.0000| 0.023 >> Peak| | 0.1352| 0.347 >> ---------------+--------+--------+--------- >> RxCan1[434] Avg| 0.00| 0.0000| 0.024 >> Peak| | 0.1312| 0.580 >> ---------------+--------+--------+--------- >> RxCan1[435] Avg| 0.00| 0.0000| 0.029 >> Peak| | 0.1109| 1.133 >> ---------------+--------+--------+--------- >> RxCan1[43e] Avg| 0.00| 0.0000| 0.023 >> Peak| | 0.2776| 0.686 >> ---------------+--------+--------+--------- >> RxCan1[440] Avg| 0.00| 0.0000| 0.022 >> Peak| | 0.0118| 0.276 >> ---------------+--------+--------+--------- >> RxCan1[465] Avg| 0.00| 0.0000| 0.022 >> Peak| | 0.0118| 0.279 >> ---------------+--------+--------+--------- >> RxCan1[466] Avg| 0.00| 0.0000| 0.023 >> Peak| | 0.0123| 0.310 >> ---------------+--------+--------+--------- >> RxCan1[467] Avg| 0.00| 0.0000| 0.025 >> Peak| | 0.0132| 0.314 >> ---------------+--------+--------+--------- >> RxCan1[472] Avg| 0.00| 0.0000| 0.101 >> Peak| | 0.0307| 1.105 >> ---------------+--------+--------+--------- >> RxCan1[473] Avg| 0.00| 0.0000| 0.051 >> Peak| | 0.0107| 0.575 >> ---------------+--------+--------+--------- >> RxCan1[474] Avg| 0.00| 0.0000| 0.024 >> Peak| | 0.0097| 0.289 >> ---------------+--------+--------+--------- >> RxCan1[475] Avg| 0.00| 0.0000| 0.023 >> Peak| | 0.0220| 0.327 >> ---------------+--------+--------+--------- >> RxCan1[476] Avg| 0.00| 0.0000| 0.050 >> Peak| | 0.0762| 5.329 >> ---------------+--------+--------+--------- >> RxCan1[477] Avg| 0.00| 0.0000| 0.032 >> Peak| | 0.0283| 0.669 >> ---------------+--------+--------+--------- >> RxCan1[595] Avg| 0.00| 0.0000| 0.026 >> Peak| | 0.0103| 0.297 >> ---------------+--------+--------+--------- >> RxCan1[59e] Avg| 0.00| 0.0000| 0.022 >> Peak| | 0.0114| 0.263 >> ---------------+--------+--------+--------- >> RxCan1[5a2] Avg| 0.00| 0.0000| 0.026 >> Peak| | 0.0119| 0.505 >> ---------------+--------+--------+--------- >> RxCan1[5ba] Avg| 0.00| 0.0000| 0.025 >> Peak| | 0.0139| 0.549 >> ---------------+--------+--------+--------- >> RxCan2[020] Avg| 0.00| 0.0000| 0.026 >> Peak| | 0.4923| 1.133 >> ---------------+--------+--------+--------- >> RxCan2[030] Avg| 0.00| 0.0000| 0.023 >> Peak| | 0.3297| 1.136 >> ---------------+--------+--------+--------- >> RxCan2[03a] Avg| 0.00| 0.0000| 0.022 >> Peak| | 0.2792| 1.275 >> ---------------+--------+--------+--------- >> RxCan2[040] Avg| 0.00| 0.0000| 0.023 >> Peak| | 0.2834| 1.080 >> ---------------+--------+--------+--------- >> RxCan2[060] Avg| 0.00| 0.0000| 0.029 >> Peak| | 0.3037| 0.991 >> ---------------+--------+--------+--------- >> RxCan2[070] Avg| 0.00| 0.0000| 0.025 >> Peak| | 0.2291| 0.460 >> ---------------+--------+--------+--------- >> RxCan2[080] Avg| 0.00| 0.0000| 0.043 >> Peak| | 0.4015| 1.007 >> ---------------+--------+--------+--------- >> RxCan2[083] Avg| 0.00| 0.0000| 0.026 >> Peak| | 0.2957| 0.788 >> ---------------+--------+--------+--------- >> RxCan2[090] Avg| 0.00| 0.0000| 0.027 >> Peak| | 0.3951| 1.231 >> ---------------+--------+--------+--------- >> RxCan2[0a0] Avg| 0.00| 0.0000| 0.026 >> Peak| | 0.2560| 0.722 >> ---------------+--------+--------+--------- >> RxCan2[100] Avg| 0.00| 0.0000| 0.046 >> Peak| | 0.4506| 21.961 >> ---------------+--------+--------+--------- >> RxCan2[108] Avg| 0.00| 0.0000| 0.024 >> Peak| | 0.3713| 1.125 >> ---------------+--------+--------+--------- >> RxCan2[110] Avg| 0.00| 0.0000| 0.029 >> Peak| | 0.2443| 0.755 >> ---------------+--------+--------+--------- >> RxCan2[130] Avg| 0.00| 0.0000| 0.023 >> Peak| | 0.2052| 1.097 >> ---------------+--------+--------+--------- >> RxCan2[150] Avg| 0.00| 0.0000| 0.023 >> Peak| | 0.2246| 0.371 >> ---------------+--------+--------+--------- >> RxCan2[160] Avg| 0.00| 0.0000| 0.024 >> Peak| | 0.0755| 1.125 >> ---------------+--------+--------+--------- >> RxCan2[180] Avg| 0.00| 0.0000| 0.023 >> Peak| | 0.2350| 0.936 >> ---------------+--------+--------+--------- >> RxCan2[190] Avg| 0.00| 0.0000| 0.022 >> Peak| | 0.2275| 0.592 >> ---------------+--------+--------+--------- >> RxCan2[1a0] Avg| 0.00| 0.0000| 0.025 >> Peak| | 0.0125| 0.273 >> ---------------+--------+--------+--------- >> RxCan2[1a4] Avg| 0.00| 0.0000| 0.022 >> Peak| | 0.2806| 0.632 >> ---------------+--------+--------+--------- >> RxCan2[1a8] Avg| 0.00| 0.0000| 0.022 >> Peak| | 0.1683| 0.740 >> ---------------+--------+--------+--------- >> RxCan2[1b0] Avg| 0.00| 0.0000| 0.023 >> Peak| | 0.1360| 0.490 >> ---------------+--------+--------+--------- >> RxCan2[1b4] Avg| 0.00| 0.0000| 0.027 >> Peak| | 0.1556| 1.119 >> ---------------+--------+--------+--------- >> RxCan2[1b8] Avg| 0.00| 0.0000| 0.022 >> Peak| | 0.1704| 0.616 >> ---------------+--------+--------+--------- >> RxCan2[1c0] Avg| 0.00| 0.0000| 0.023 >> Peak| | 0.1317| 0.488 >> ---------------+--------+--------+--------- >> RxCan2[1e0] Avg| 0.00| 0.0000| 0.025 >> Peak| | 0.1460| 0.675 >> ---------------+--------+--------+--------- >> RxCan2[215] Avg| 0.00| 0.0000| 0.023 >> Peak| | 0.1191| 0.567 >> ---------------+--------+--------+--------- >> RxCan2[217] Avg| 0.00| 0.0000| 0.023 >> Peak| | 0.1167| 0.869 >> ---------------+--------+--------+--------- >> RxCan2[220] Avg| 0.00| 0.0000| 0.023 >> Peak| | 0.0918| 0.313 >> ---------------+--------+--------+--------- >> RxCan2[225] Avg| 0.00| 0.0000| 0.025 >> Peak| | 0.3635| 1.018 >> ---------------+--------+--------+--------- >> RxCan2[230] Avg| 0.00| 0.0000| 0.057 >> Peak| | 0.2192| 1.063 >> ---------------+--------+--------+--------- >> RxCan2[240] Avg| 0.00| 0.0000| 0.023 >> Peak| | 0.1173| 0.760 >> ---------------+--------+--------+--------- >> RxCan2[241] Avg| 0.00| 0.0000| 0.022 >> Peak| | 0.2830| 1.144 >> ---------------+--------+--------+--------- >> RxCan2[250] Avg| 0.00| 0.0000| 0.026 >> Peak| | 0.0701| 0.698 >> ---------------+--------+--------+--------- >> RxCan2[255] Avg| 0.00| 0.0000| 0.022 >> Peak| | 0.1755| 1.063 >> ---------------+--------+--------+--------- >> RxCan2[265] Avg| 0.00| 0.0000| 0.024 >> Peak| | 0.1771| 0.729 >> ---------------+--------+--------+--------- >> RxCan2[270] Avg| 0.00| 0.0000| 0.023 >> Peak| | 0.0667| 0.307 >> ---------------+--------+--------+--------- >> RxCan2[290] Avg| 0.00| 0.0000| 0.022 >> Peak| | 0.0410| 0.280 >> ---------------+--------+--------+--------- >> RxCan2[295] Avg| 0.00| 0.0000| 0.023 >> Peak| | 0.0881| 0.299 >> ---------------+--------+--------+--------- >> RxCan2[2a0] Avg| 0.00| 0.0000| 0.023 >> Peak| | 0.0420| 0.268 >> ---------------+--------+--------+--------- >> RxCan2[2a7] Avg| 0.00| 0.0000| 0.021 >> Peak| | 0.1716| 0.454 >> ---------------+--------+--------+--------- >> RxCan2[2b0] Avg| 0.00| 0.0000| 0.023 >> Peak| | 0.0424| 0.300 >> ---------------+--------+--------+--------- >> RxCan2[2c0] Avg| 0.00| 0.0000| 0.024 >> Peak| | 0.0470| 0.298 >> ---------------+--------+--------+--------- >> RxCan2[2e0] Avg| 0.00| 0.0000| 0.030 >> Peak| | 0.0324| 1.152 >> ---------------+--------+--------+--------- >> RxCan2[2f0] Avg| 0.00| 0.0000| 0.024 >> Peak| | 0.0229| 0.359 >> ---------------+--------+--------+--------- >> RxCan2[2f5] Avg| 0.00| 0.0000| 0.026 >> Peak| | 0.1882| 0.673 >> ---------------+--------+--------+--------- >> RxCan2[300] Avg| 0.00| 0.0000| 0.022 >> Peak| | 0.0186| 0.263 >> ---------------+--------+--------+--------- >> RxCan2[310] Avg| 0.00| 0.0000| 0.024 >> Peak| | 0.0210| 0.265 >> ---------------+--------+--------+--------- >> RxCan2[320] Avg| 0.00| 0.0000| 0.025 >> Peak| | 0.0207| 0.354 >> ---------------+--------+--------+--------- >> RxCan2[326] Avg| 0.00| 0.0000| 0.023 >> Peak| | 0.1466| 0.686 >> ---------------+--------+--------+--------- >> RxCan2[330] Avg| 0.00| 0.0000| 0.022 >> Peak| | 0.4580| 0.708 >> ---------------+--------+--------+--------- >> RxCan2[340] Avg| 0.00| 0.0000| 0.031 >> Peak| | 0.1621| 0.785 >> ---------------+--------+--------+--------- >> RxCan2[345] Avg| 0.00| 0.0000| 0.021 >> Peak| | 0.0199| 0.261 >> ---------------+--------+--------+--------- >> RxCan2[35e] Avg| 0.00| 0.0000| 0.023 >> Peak| | 0.0686| 0.449 >> ---------------+--------+--------+--------- >> RxCan2[360] Avg| 0.00| 0.0000| 0.025 >> Peak| | 0.0204| 0.289 >> ---------------+--------+--------+--------- >> RxCan2[361] Avg| 0.00| 0.0000| 0.022 >> Peak| | 0.1166| 0.316 >> ---------------+--------+--------+--------- >> RxCan2[363] Avg| 0.00| 0.0000| 0.023 >> Peak| | 0.0146| 0.304 >> ---------------+--------+--------+--------- >> RxCan2[370] Avg| 0.00| 0.0000| 0.024 >> Peak| | 0.0099| 0.278 >> ---------------+--------+--------+--------- >> RxCan2[381] Avg| 0.00| 0.0000| 0.025 >> Peak| | 0.0468| 0.459 >> ---------------+--------+--------+--------- >> RxCan2[3a0] Avg| 0.00| 0.0000| 0.021 >> Peak| | 0.2339| 0.617 >> ---------------+--------+--------+--------- >> RxCan2[3d0] Avg| 0.00| 0.0000| 0.022 >> Peak| | 0.1351| 0.351 >> ---------------+--------+--------+--------- >> RxCan2[3d5] Avg| 0.00| 0.0000| 0.023 >> Peak| | 0.0796| 0.692 >> ---------------+--------+--------+--------- >> RxCan2[400] Avg| 0.00| 0.0000| 0.023 >> Peak| | 0.0537| 0.307 >> ---------------+--------+--------+--------- >> RxCan2[405] Avg| 0.00| 0.0000| 0.021 >> Peak| | 0.0513| 0.303 >> ---------------+--------+--------+--------- >> RxCan2[40a] Avg| 0.00| 0.0000| 0.022 >> Peak| | 0.1099| 0.313 >> ---------------+--------+--------+--------- >> RxCan2[415] Avg| 0.00| 0.0000| 0.022 >> Peak| | 0.0204| 0.251 >> ---------------+--------+--------+--------- >> RxCan2[435] Avg| 0.00| 0.0000| 0.028 >> Peak| | 0.0113| 0.342 >> ---------------+--------+--------+--------- >> RxCan2[440] Avg| 0.00| 0.0000| 0.027 >> Peak| | 0.0110| 0.299 >> ---------------+--------+--------+--------- >> RxCan2[465] Avg| 0.00| 0.0000| 0.023 >> Peak| | 0.0122| 0.295 >> ---------------+--------+--------+--------- >> RxCan2[466] Avg| 0.00| 0.0000| 0.022 >> Peak| | 0.0117| 0.267 >> ---------------+--------+--------+--------- >> RxCan2[467] Avg| 0.00| 0.0000| 0.022 >> Peak| | 0.0164| 0.325 >> ---------------+--------+--------+--------- >> RxCan2[501] Avg| 0.00| 0.0000| 0.023 >> Peak| | 0.0236| 0.276 >> ---------------+--------+--------+--------- >> RxCan2[503] Avg| 0.00| 0.0000| 0.023 >> Peak| | 0.0248| 0.349 >> ---------------+--------+--------+--------- >> RxCan2[504] Avg| 0.00| 0.0000| 0.023 >> Peak| | 0.0230| 0.312 >> ---------------+--------+--------+--------- >> RxCan2[505] Avg| 0.00| 0.0000| 0.025 >> Peak| | 0.0256| 0.310 >> ---------------+--------+--------+--------- >> RxCan2[508] Avg| 0.00| 0.0000| 0.023 >> Peak| | 0.0281| 0.329 >> ---------------+--------+--------+--------- >> RxCan2[511] Avg| 0.00| 0.0000| 0.022 >> Peak| | 0.0232| 0.282 >> ---------------+--------+--------+--------- >> RxCan2[51e] Avg| 0.00| 0.0000| 0.023 >> Peak| | 0.0248| 0.298 >> ---------------+--------+--------+--------- >> RxCan2[581] Avg| 0.00| 0.0000| 0.025 >> Peak| | 0.0166| 0.286 >> ===============+========+========+========= >> Total Avg| 0.00| 0.0000| 43.563 >> >> At the same time, calling poller times on, poller times >> status causes the bus to crash, although no polls are >> actively being sent at all. >> >> Cheers, >> Simon >> _______________________________________________ >> OvmsDev mailing list >> OvmsDev@lists.openvehicles.com >> http://lists.openvehicles.com/mailman/listinfo/ovmsdev >> >> >> _______________________________________________ >> OvmsDev mailing list >> OvmsDev@lists.openvehicles.com >> http://lists.openvehicles.com/mailman/listinfo/ovmsdev > > _______________________________________________ > OvmsDev mailing list > OvmsDev@lists.openvehicles.com > http://lists.openvehicles.com/mailman/listinfo/ovmsdev
_______________________________________________ OvmsDev mailing list OvmsDev@lists.openvehicles.com http://lists.openvehicles.com/mailman/listinfo/ovmsdev
-- Michael Balzer *Am Rahmen 5 * D-58313 Herdecke <https://www.google.com/maps/search/Am+Rahmen+5+*+D-58313+Herdecke?entry=gmail&source=g> Fon 02330 9104094 * Handy 0176 20698926
_______________________________________________ OvmsDev mailing list OvmsDev@lists.openvehicles.com http://lists.openvehicles.com/mailman/listinfo/ovmsdev
_______________________________________________ OvmsDev mailing list OvmsDev@lists.openvehicles.com http://lists.openvehicles.com/mailman/listinfo/ovmsdev
_______________________________________________ OvmsDev mailing list OvmsDev@lists.openvehicles.com http://lists.openvehicles.com/mailman/listinfo/ovmsdev
-- Michael Balzer * Am Rahmen 5 * D-58313 Herdecke Fon 02330 9104094 * Handy 0176 20698926
Hi,
How does the CAN bus crash manifest? Charging stops during a charging process, the LEDs on the typ 2 socket flash. OVMS cannot be reached via WLAN or WAN. While driving, the crash of the bus means that the car switches to limp mode. In the Focus Electric, this means that the powertrain is _immediately_ switched off completely and “stop safely now” is displayed on the dashboard. OVMS cannot be reached via WLAN or WAN.
Since the problem does not occur in listen mode, I have to assume that the poller thread somewhere is no longer able to keep up with the acknowledgement and is therefore causing the bus to get out of step. For the statistics alone, the poller seems to evaluate every frame and therefore has a certain workload or do I have the option of restricting this to certain modules before calling IncomingFrameCan? Cheers, Simon Am 17.01.2025 um 11:08 schrieb Michael Balzer via OvmsDev:
Simon,
AFAIK "Pollers[Send]" is the regular "next round" request for the polling task, not a frame transmission. A TX attempt in listen mode would produce a warn level log entry "Cannot write <busname> when not in ACTIVE mode" for tag "esp32can" or "mcp2515".
With the old poller, you wouldn't have had any indication of a queue overflow, so the new poller may help you to identify an issue in your code.
You need to understand the new poller not only does polls, it's now the main CAN receiver for the vehicle module. That's why your poller time stats include all process data frames as well, not only protocol frames.
The overflow means either your CAN processing is too slow to keep up with the packets received, or some other task is hogging the CPU. That would need to be a task with an equal or higher priority as the vehicle task, which has priority level 10 -- only system & networking tasks are above, so that's not likely. (You can check the CPU usage with the "module tasks" command.)
That means you should check your standard frame processing (`IncomingFrameCanX` callbacks) for potential delays and processing complexity issues.
The poller statistics can help you track this down, but you need to have at least 10 seconds of statistics, the more the better. Rule of thumb: PRI average at 0.0/second means you don't have enough data yet. (-- //.ichael, correct me if I'm wrong)
At the same time, calling poller times on, poller times status causes the bus to crash
In any case that still doesn't explain how the poller could possibly cause a CAN bus (!) crash without actually doing any transmissions.
How does the CAN bus crash manifest?
Regards, Michael
Am 15.01.25 um 19:54 schrieb Simon Ehlen via OvmsDev:
I put the two buses back into listen mode and drove a short distance and charged the car. As I said, there is no active polling in my code. As expected, there is therefore no indication of a failed TX attempt in the console log. I only continue to see a lot of RX Task Queue Overflow messages in the log, which I did not have before. I also see a Pollers[Send]: Task Queue Overflow entry, but since I don't see any indication of “cannot write” on that, I'm not assuming that's a “real” send.
I (19760210) vehicle-poll: Poller[Frame]: RX Task Queue Overflow Run 5 I (19764420) vehicle-poll: Poller[Frame]: RX Task Queue Overflow Run 1 I (19764420) vehicle-poll: Poller[Frame]: RX Task Queue Overflow Run 3 I (19764420) vehicle-poll: Poller[Frame]: RX Task Queue Overflow Run 1 I (19764740) vehicle-poll: Poller[Frame]: RX Task Queue Overflow Run 1 I (19764740) vehicle-poll: Poller[Frame]: RX Task Queue Overflow Run 1 I (19764740) vehicle-poll: Poller[Frame]: RX Task Queue Overflow Run 1 I (19764740) vehicle-poll: Poller[Frame]: RX Task Queue Overflow Run 1 I (19764740) vehicle-poll: Poller[Frame]: RX Task Queue Overflow Run 1 I (19764750) vehicle-poll: Poller[Frame]: RX Task Queue Overflow Run 2 I (19764750) vehicle-poll: Poller[Frame]: RX Task Queue Overflow Run 1 I (19764750) vehicle-poll: Poller[Frame]: RX Task Queue Overflow Run 2 I (19764870) vehicle-poll: Poller[Frame]: RX Task Queue Overflow Run 1 I (19764870) vehicle-poll: Poller[Frame]: RX Task Queue Overflow Run 2 I (19765270) vehicle-poll: Poller[Frame]: RX Task Queue Overflow Run 4 I (19765270) vehicle-poll: Poller[Frame]: RX Task Queue Overflow Run 6 I (19765610) vehicle-poll: Poller[Frame]: RX Task Queue Overflow Run 3 I (19765930) vehicle-poll: Poller[Frame]: RX Task Queue Overflow Run 1 I (19765930) vehicle-poll: Poller[Frame]: RX Task Queue Overflow Run 3 I (19765930) vehicle-poll: Poller[Frame]: RX Task Queue Overflow Run 1 I (19766260) vehicle-poll: Poller[Frame]: RX Task Queue Overflow Run 50 I (19766260) vehicle-poll: Poller[Frame]: RX Task Queue Overflow Run 48 I (19766260) vehicle-poll: Poller[Frame]: RX Task Queue Overflow Run 27 I (19766270) vehicle-poll: Poller[Frame]: RX Task Queue Overflow Run 6 I (19766270) vehicle-poll: Poller[Frame]: RX Task Queue Overflow Run 4 E (19766280) can: can2: intr=4754831 rxpkt=4757493 txpkt=0 errflags=0x22401c02 rxerr=0 txerr=0 rxinval=0 rxovr=0 txovr=0 txdelay=0 txfail=0 wdgreset=1 errreset=0 E (19766300) can: can2: intr=4754831 rxpkt=4757494 txpkt=0 errflags=0x23401c01 rxerr=0 txerr=0 rxinval=0 rxovr=0 txovr=0 txdelay=0 txfail=0 wdgreset=1 errreset=0 I (19766300) vehicle-poll: Poller[Frame]: RX Task Queue Overflow Run 7 I (19766340) vehicle-poll: Poller[Frame]: RX Task Queue Overflow Run 39 I (19766350) vehicle-poll: Poller[Frame]: RX Task Queue Overflow Run 32 I (19766350) vehicle-poll: Poller[Frame]: RX Task Queue Overflow Run 17 I (19766350) vehicle-poll: Poller[Frame]: RX Task Queue Overflow Run 3 I (19766350) vehicle-poll: Pollers[Send]: Task Queue Overflow I (19766350) vehicle-poll: Poller[Frame]: RX Task Queue Overflow Run 1 I (19766350) vehicle-poll: Poller[Frame]: RX Task Queue Overflow Run 1 E (19766360) can: can2: intr=4754840 rxpkt=4757509 txpkt=0 errflags=0x22401c02 rxerr=0 txerr=0 rxinval=0 rxovr=0 txovr=0 txdelay=0 txfail=0 wdgreset=1 errreset=0 I (19766370) vehicle-poll: Poller[Frame]: RX Task Queue Overflow Run 4 E (19766370) can: can2: intr=4754840 rxpkt=4757510 txpkt=0 errflags=0x23401c01 rxerr=0 txerr=0 rxinval=0 rxovr=0 txovr=0 txdelay=0 txfail=0 wdgreset=1 errreset=0 I (19766430) vehicle-poll: Poller[Frame]: RX Task Queue Overflow Run 30 I (19766430) vehicle-poll: Poller[Frame]: RX Task Queue Overflow Run 36 I (19766430) vehicle-poll: Poller[Frame]: RX Task Queue Overflow Run 26 I (19766430) vehicle-poll: Poller[Frame]: RX Task Queue Overflow Run 4 I (19766430) vehicle-poll: Poller[Frame]: RX Task Queue Overflow Run 3 I (19766430) vehicle-poll: Poller[Frame]: RX Task Queue Overflow Run 2 I (19766430) vehicle-poll: Poller[Frame]: RX Task Queue Overflow Run 1 E (19766450) can: can2: intr=4754855 rxpkt=4757535 txpkt=0 errflags=0x23001001 rxerr=0 txerr=0 rxinval=0 rxovr=0 txovr=0 txdelay=0 txfail=0 wdgreset=1 errreset=0 E (19766460) can: can2: intr=4754855 rxpkt=4757536 txpkt=0 errflags=0x23401c01 rxerr=0 txerr=0 rxinval=0 rxovr=0 txovr=0 txdelay=0 txfail=0 wdgreset=1 errreset=0 E (19766520) can: can2: intr=4754855 rxpkt=4757539 txpkt=0 errflags=0x22001002 rxerr=0 txerr=0 rxinval=0 rxovr=0 txovr=0 txdelay=0 txfail=0 wdgreset=1 errreset=0 I (19766520) vehicle-poll: Poller[Frame]: RX Task Queue Overflow Run 9 I (19766520) vehicle-poll: Poller[Frame]: RX Task Queue Overflow Run 37 I (19766520) vehicle-poll: Poller[Frame]: RX Task Queue Overflow Run 30 I (19766520) vehicle-poll: Poller[Frame]: RX Task Queue Overflow Run 6 I (19766520) vehicle-poll: Poller[Frame]: RX Task Queue Overflow Run 2 I (19766520) vehicle-poll: Poller[Frame]: RX Task Queue Overflow Run 1 I (19766520) vehicle-poll: Poller[Frame]: RX Task Queue Overflow Run 1 I (19766520) vehicle-poll: Poller[Frame]: RX Task Queue Overflow Run 3 I (19766530) vehicle-poll: Poller[Frame]: RX Task Queue Overflow Run 1 I (19766530) vehicle-poll: Poller[Frame]: RX Task Queue Overflow Run 1 I (19766530) vehicle-poll: Poller[Frame]: RX Task Queue Overflow Run 1 E (19766540) can: can2: intr=4754861 rxpkt=4757548 txpkt=0 errflags=0x23401c01 rxerr=0 txerr=0 rxinval=0 rxovr=0 txovr=0 txdelay=0 txfail=0 wdgreset=1 errreset=0 I (19766550) vehicle-poll: Poller[Frame]: RX Task Queue Overflow Run 3 E (19766560) can: can2: intr=4754861 rxpkt=4757552 txpkt=0 errflags=0x23001001 rxerr=0 txerr=0 rxinval=0 rxovr=0 txovr=0 txdelay=0 txfail=0 wdgreset=1 errreset=0 E (19766610) can: can2: intr=4754861 rxpkt=4757553 txpkt=0 errflags=0x23401c01 rxerr=0 txerr=0 rxinval=0 rxovr=0 txovr=0 txdelay=0 txfail=0 wdgreset=1 errreset=0 I (19766610) vehicle-poll: Poller[Frame]: RX Task Queue Overflow Run 4 I (19766610) vehicle-poll: Poller[Frame]: RX Task Queue Overflow Run 5 I (19766610) vehicle-poll: Poller[Frame]: RX Task Queue Overflow Run 33 I (19766610) vehicle-poll: Poller[Frame]: RX Task Queue Overflow Run 34 I (19766610) vehicle-poll: Poller[Frame]: RX Task Queue Overflow Run 12 W (19767070) websocket: WebSocketHandler[0x3f8d79d8]: job queue overflow detected W (19767140) websocket: WebSocketHandler[0x3f8d79d8]: job queue overflow detected W (19767180) websocket: WebSocketHandler[0x3f8d79d8]: job queue overflow resolved, 1 drops W (19767260) websocket: WebSocketHandler[0x3f8d79d8]: job queue overflow detected W (19767310) websocket: WebSocketHandler[0x3f8d79d8]: job queue overflow resolved, 1 drops
Cheers Simon
Am 15.01.2025 um 19:18 schrieb Derek Caudwell via OvmsDev:
Since the following email I have high confidence the issue on the Leaf is related/caused by the poller as there has been no further occurrence and Chris has also experienced the car going to neutral on the new poller firmware.
.... I haven't ruled out it being a fault with my car yet. Shortly after it faulted the car was run into so has been off the road for sometime, my first step was to replace 12V battery. The ovms unit is now unplugged and if it does not fault over the next month while driving I'll be reasonably confident it's ovms related.
Not sure which firmware version the poller updates were included in but it was only after upgrading to it that the errors occurred (which could be coincidental however it has faulted twice more both on version 3.3.004-141-gf729d82c). For periods where I reverted to 3.3.003 it was fine.
It might be useful to have an extra option on the enable can write to only enable it when the car is parked/charging.
On Wed, 15 Jan 2025, 11:11 pm Michael Balzer via OvmsDev, <ovmsdev@lists.openvehicles.com> wrote:
Derek, can you comment on this? Do you still have the issue mentioned?
Speaking of the Leaf, the code there actually does something fishy in `CommandWakeup()`:
unsigned char data = 0; … m_can1->WriteStandard(0x5C0, *_8_*, &data); //Wakes up the VCM (by spoofing empty battery request heating)
And there are CAN transmissions from command execution in the Leaf code, so to be sure there is no TX, listen mode is needed there as well.
Regarding CAN trace, you can try with the monitor channel and use the USB console to record the log output. That way you should be able to at least rule out there are regular transmissions -- assuming not every TX will cause an immediate crash.
Another / probably better option: when in listen mode, the log will also tell you about TX attempts, as the driver will issue a warning on each.
The CAN monitor log may also tell you about bus errors detected.
Regards, Michael
Am 15.01.25 um 10:44 schrieb Simon Ehlen via OvmsDev:
There is at least one more Leaf from Derek that has also ended up in limp mode since the new poller. There, too, no polling was actually carried out while driving. I'm not familiar with the framework at all, but does this perhaps offer you enough of an approach to recognize a commonality?
Unfortunately I do not have a tool to create a CAN trace. I can't use the OVMS for this, as it no longer responds after a bus crash until I have disconnected it from the OBD and plugged it back in.
Cheers, Simon
Am 15.01.2025 um 10:18 schrieb Michael Balzer via OvmsDev:
The frame acknowledging is done automatically by the CAN transceiver when in active mode, this is part of the CAN protocol to indicate bit errors to the sender.
So normally a failure of the system to process received frames fast enough cannot cause any issue on the bus. But the ESP32 has a range of known hardware issues, especially in the embedded CAN transceiver, I wouldn't be surprised if there are more, or if our driver lacks some workaround for these.
Maybe the new poller has some bug that causes false transmissions from process data frames received. But many vehicles send process data frames, and we've had no issue reports like this on any of them, and ECUs also normally simply ignore out of sequence protocol frames.
You could record a CAN trace to see if there are transmissions, and what kind. If you don't poll and don't send frames from your code, there should be none. If the bus still crashes, that would be an indicator for something going wrong in the transceiver.
Regards, Michael
Am 15.01.25 um 07:15 schrieb Simon Ehlen via OvmsDev:
Thanks Mark for the explanation. So does this mean that OVMS tries to acknowledge all incoming messages in active mode? This seems to me to clearly exceed the capacity of OVMS with the mass of incoming messages.
In fact, I am currently opening the bus in active mode, as I was hoping to get my code to revive the BMS in OVMS to work. However, unlike the other data, I only get the cell voltages when I actively poll them. To be on the safe side, I will now open the bus in read mode again.
However, I am still wondering what in the poller change has altered the OVMS in such a way that the bus is now crashing completely. Currently I have undone the changes since february 2024, this only concerns code from the public repository, there was no change from me in that period. Now the OVMS is running stable again and there are neither queue overflows nor bus crashes.
I had also previously increased the following queue sizes, but unfortunately this was not successful: CONFIG_OVMS_HW_EVENT_QUEUE_SIZE=120 CONFIG_OVMS_HW_CAN_RX_QUEUE_SIZE=80 CONFIG_OVMS_VEHICLE_CAN_RX_QUEUE_SIZE=80
Cheers, Simon
Am 15.01.2025 um 02:08 schrieb Mark Webb-Johnson: > Note sure if this helps, but some comments: > > * Remember than CAN protocol in normal mode is an ‘active’ protocol. Nodes on the bus are actively acknowledging messages (and that includes OVMS), even if they never write messages. So in normal mode there is no absolute ‘read access’. For example, opening the CAN port at the wrong baud rate, even if not writing messages, will mess up the bus. > > > * However, if you open the CAN port in ‘listen’ mode, then it is truly read-only. In that mode it will not acknowledge messages, and cannot write on the bus at all. I’ve never seen an OVMS mess up a bus in listen mode, even if the baud rate is wrong. I think the only way for that to happen would be a hardware layer issue (cabling, termination, etc). > > > Regards, Mark. > >> On 15 Jan 2025, at 6:30 AM, Simon Ehlen via OvmsDev <ovmsdev@lists.openvehicles.com> <mailto:ovmsdev@lists.openvehicles.com> wrote: >> >> But what is the reason that a read access to the bus can cause the bus to crash? >> This is not critical during charging, it just aborts the charging process with an error. >> While driving, this results in a “stop safely now” error message on the dashboard and the engine is switched off immediately. >> >> Cheers, >> Simon >> >> Am 14.01.2025 um 23:22 schrieb Michael Geddes via OvmsDev: >>> You may need to increase the queue size for the poll task queue. >>> >>> The poller still handles the bus to vehicle notifications even if it is off. >>> >>> Any poller logging on such an intensive load of can messages is likely to be a problem. This is part of the reason it is flagged off. >>> >>> The total % looks wrong :/ >>> >>> //.ichael >>> >>> >>> >>> >>> On Wed, 15 Jan 2025, 03:17 Simon Ehlen via OvmsDev, <ovmsdev@lists.openvehicles.com> wrote: >>> >>> Hi, >>> >>> I finally got around to merging my code with the current master (previous merge february 2024). >>> I have rebuilt my code for a Ford Focus Electric so that it uses the new OvmsPoller class. >>> >>> However, I now see a lot of entries like this in my log: >>> >>> I (246448) vehicle-poll: Poller[Frame]: RX Task Queue Overflow Run 8 >>> I (246448) vehicle-poll: Poller[Frame]: RX Task Queue Overflow Run 3 >>> I (246448) vehicle-poll: Poller[Frame]: RX Task Queue Overflow Run 1 >>> I (246448) vehicle-poll: Poller[Frame]: RX Task Queue Overflow Run 2 >>> I (246448) vehicle-poll: Poller[Frame]: RX Task Queue Overflow Run 1 >>> I (246448) vehicle-poll: Poller[Frame]: RX Task Queue Overflow Run 2 >>> I (246448) vehicle-poll: Poller[Frame]: RX Task Queue Overflow Run 1 >>> I (246448) vehicle-poll: Poller[Frame]: RX Task Queue Overflow Run 1 >>> I (254448) vehicle-poll: Poller[Frame]: RX Task Queue Overflow Run 24 >>> I (254448) vehicle-poll: Poller[Frame]: RX Task Queue Overflow Run 1 >>> I (254448) vehicle-poll: Poller[Frame]: RX Task Queue Overflow Run 1 >>> I (254448) vehicle-poll: Poller[Frame]: RX Task Queue Overflow Run 1 >>> I (254448) vehicle-poll: Poller[Frame]: RX Task Queue Overflow Run 1 >>> I (254448) vehicle-poll: Poller[Frame]: RX Task Queue Overflow Run 1 >>> I (254448) vehicle-poll: Poller[Frame]: RX Task Queue Overflow Run 1 >>> >>> Was this message just hidden before or do I need to make further adjustments to my code? >>> >>> My code currently does not use active polling but reads on the busses (IncomingFrameCanX) on certain modules. >>> >>> When I look at poller times status, it looks very extensive to me... >>> >>> OVMS# poller times status >>> Poller timing is: on >>> Type | count | Utlztn | Time >>> | per s | [%] | [ms] >>> ---------------+--------+--------+--------- >>> Poll:PRI Avg| 0.00| 0.0000| 0.003 >>> Peak| | 0.0014| 0.041 >>> ---------------+--------+--------+--------- >>> RxCan1[010] Avg| 0.00| 0.0000| 0.020 >>> Peak| | 1.2217| 1.089 >>> ---------------+--------+--------+--------- >>> RxCan1[030] Avg| 0.00| 0.0000| 0.024 >>> Peak| | 1.2193| 1.241 >>> ---------------+--------+--------+--------- >>> RxCan1[041] Avg| 0.00| 0.0000| 0.023 >>> Peak| | 0.6460| 1.508 >>> ---------------+--------+--------+--------- >>> RxCan1[049] Avg| 0.00| 0.0000| 0.024 >>> Peak| | 0.6320| 0.630 >>> ---------------+--------+--------+--------- >>> RxCan1[04c] Avg| 0.00| 0.0000| 0.023 >>> Peak| | 0.6430| 1.474 >>> ---------------+--------+--------+--------- >>> RxCan1[04d] Avg| 0.00| 0.0000| 0.022 >>> Peak| | 1.2987| 1.359 >>> ---------------+--------+--------+--------- >>> RxCan1[076] Avg| 0.00| 0.0000| 0.072 >>> Peak| | 0.7818| 15.221 >>> ---------------+--------+--------+--------- >>> RxCan1[077] Avg| 0.00| 0.0000| 0.022 >>> Peak| | 0.6274| 0.955 >>> ---------------+--------+--------+--------- >>> RxCan1[07a] Avg| 0.00| 0.0000| 0.039 >>> Peak| | 1.7602| 1.684 >>> ---------------+--------+--------+--------- >>> RxCan1[07d] Avg| 0.00| 0.0000| 0.023 >>> Peak| | 0.6621| 1.913 >>> ---------------+--------+--------+--------- >>> RxCan1[0c8] Avg| 0.00| 0.0000| 0.026 >>> Peak| | 0.6292| 1.412 >>> ---------------+--------+--------+--------- >>> RxCan1[11a] Avg| 0.00| 0.0000| 0.023 >>> Peak| | 1.2635| 1.508 >>> ---------------+--------+--------+--------- >>> RxCan1[130] Avg| 0.00| 0.0000| 0.024 >>> Peak| | 0.6548| 0.703 >>> ---------------+--------+--------+--------- >>> RxCan1[139] Avg| 0.00| 0.0000| 0.021 >>> Peak| | 0.6002| 0.984 >>> ---------------+--------+--------+--------- >>> RxCan1[156] Avg| 0.00| 0.0000| 0.024 >>> Peak| | 0.1225| 0.479 >>> ---------------+--------+--------+--------- >>> RxCan1[160] Avg| 0.00| 0.0000| 0.028 >>> Peak| | 0.6586| 1.376 >>> ---------------+--------+--------+--------- >>> RxCan1[165] Avg| 0.00| 0.0000| 0.027 >>> Peak| | 0.6368| 1.132 >>> ---------------+--------+--------+--------- >>> RxCan1[167] Avg| 0.00| 0.0000| 0.024 >>> Peak| | 1.3009| 1.067 >>> ---------------+--------+--------+--------- >>> RxCan1[171] Avg| 0.00| 0.0000| 0.022 >>> Peak| | 0.6590| 4.320 >>> ---------------+--------+--------+--------- >>> RxCan1[178] Avg| 0.00| 0.0000| 0.023 >>> Peak| | 0.1161| 0.311 >>> ---------------+--------+--------+--------- >>> RxCan1[179] Avg| 0.00| 0.0000| 0.024 >>> Peak| | 0.1236| 0.536 >>> ---------------+--------+--------+--------- >>> RxCan1[180] Avg| 0.00| 0.0000| 0.022 >>> Peak| | 0.6472| 1.193 >>> ---------------+--------+--------+--------- >>> RxCan1[185] Avg| 0.00| 0.0000| 0.022 >>> Peak| | 0.6777| 1.385 >>> ---------------+--------+--------+--------- >>> RxCan1[1a0] Avg| 0.00| 0.0000| 0.022 >>> Peak| | 0.6486| 2.276 >>> ---------------+--------+--------+--------- >>> RxCan1[1e0] Avg| 0.00| 0.0000| 0.023 >>> Peak| | 0.6725| 1.376 >>> ---------------+--------+--------+--------- >>> RxCan1[1e4] Avg| 0.00| 0.0000| 0.027 >>> Peak| | 0.7370| 1.266 >>> ---------------+--------+--------+--------- >>> RxCan1[1f0] Avg| 0.00| 0.0000| 0.024 >>> Peak| | 0.4253| 0.753 >>> ---------------+--------+--------+--------- >>> RxCan1[200] Avg| 0.00| 0.0000| 0.025 >>> Peak| | 0.6262| 0.791 >>> ---------------+--------+--------+--------- >>> RxCan1[202] Avg| 0.00| 0.0000| 0.021 >>> Peak| | 1.2915| 1.257 >>> ---------------+--------+--------+--------- >>> RxCan1[204] Avg| 0.00| 0.0000| 0.022 >>> Peak| | 1.2620| 1.010 >>> ---------------+--------+--------+--------- >>> RxCan1[213] Avg| 0.00| 0.0000| 0.022 >>> Peak| | 0.6331| 1.185 >>> ---------------+--------+--------+--------- >>> RxCan1[214] Avg| 0.00| 0.0000| 0.023 >>> Peak| | 0.9977| 34.527 >>> ---------------+--------+--------+--------- >>> RxCan1[217] Avg| 0.00| 0.0000| 0.024 >>> Peak| | 1.2825| 1.328 >>> ---------------+--------+--------+--------- >>> RxCan1[218] Avg| 0.00| 0.0000| 0.022 >>> Peak| | 0.6328| 1.110 >>> ---------------+--------+--------+--------- >>> RxCan1[230] Avg| 0.00| 0.0000| 0.019 >>> Peak| | 0.6742| 5.119 >>> ---------------+--------+--------+--------- >>> RxCan1[240] Avg| 0.00| 0.0000| 0.022 >>> Peak| | 0.1163| 0.343 >>> ---------------+--------+--------+--------- >>> RxCan1[242] Avg| 0.00| 0.0000| 0.025 >>> Peak| | 0.3501| 1.015 >>> ---------------+--------+--------+--------- >>> RxCan1[24a] Avg| 0.00| 0.0000| 0.022 >>> Peak| | 0.1212| 0.338 >>> ---------------+--------+--------+--------- >>> RxCan1[24b] Avg| 0.00| 0.0000| 0.023 >>> Peak| | 0.1289| 0.330 >>> ---------------+--------+--------+--------- >>> RxCan1[24c] Avg| 0.00| 0.0000| 0.033 >>> Peak| | 0.1714| 1.189 >>> ---------------+--------+--------+--------- >>> RxCan1[25a] Avg| 0.00| 0.0000| 0.024 >>> Peak| | 0.1289| 0.510 >>> ---------------+--------+--------+--------- >>> RxCan1[25b] Avg| 0.00| 0.0000| 0.022 >>> Peak| | 0.6685| 0.930 >>> ---------------+--------+--------+--------- >>> RxCan1[25c] Avg| 0.00| 0.0000| 0.027 >>> Peak| | 1.3298| 2.670 >>> ---------------+--------+--------+--------- >>> RxCan1[260] Avg| 0.00| 0.0000| 0.023 >>> Peak| | 0.1271| 0.401 >>> ---------------+--------+--------+--------- >>> RxCan1[270] Avg| 0.00| 0.0000| 0.022 >>> Peak| | 0.6439| 0.898 >>> ---------------+--------+--------+--------- >>> RxCan1[280] Avg| 0.00| 0.0000| 0.023 >>> Peak| | 0.6502| 1.156 >>> ---------------+--------+--------+--------- >>> RxCan1[2e4] Avg| 0.00| 0.0000| 0.035 >>> Peak| | 0.3389| 0.811 >>> ---------------+--------+--------+--------- >>> RxCan1[2ec] Avg| 0.00| 0.0000| 0.027 >>> Peak| | 0.1417| 0.784 >>> ---------------+--------+--------+--------- >>> RxCan1[2ed] Avg| 0.00| 0.0000| 0.024 >>> Peak| | 0.1364| 0.746 >>> ---------------+--------+--------+--------- >>> RxCan1[2ee] Avg| 0.00| 0.0000| 0.024 >>> Peak| | 0.1406| 0.965 >>> ---------------+--------+--------+--------- >>> RxCan1[312] Avg| 0.00| 0.0000| 0.023 >>> Peak| | 0.1293| 0.978 >>> ---------------+--------+--------+--------- >>> RxCan1[326] Avg| 0.00| 0.0000| 0.024 >>> Peak| | 0.1298| 0.518 >>> ---------------+--------+--------+--------- >>> RxCan1[336] Avg| 0.00| 0.0000| 0.028 >>> Peak| | 0.0106| 0.329 >>> ---------------+--------+--------+--------- >>> RxCan1[352] Avg| 0.00| 0.0000| 0.030 >>> Peak| | 0.1054| 0.800 >>> ---------------+--------+--------+--------- >>> RxCan1[355] Avg| 0.00| 0.0000| 0.027 >>> Peak| | 0.0270| 0.546 >>> ---------------+--------+--------+--------- >>> RxCan1[35e] Avg| 0.00| 0.0000| 0.023 >>> Peak| | 0.1288| 0.573 >>> ---------------+--------+--------+--------- >>> RxCan1[365] Avg| 0.00| 0.0000| 0.024 >>> Peak| | 0.1297| 0.358 >>> ---------------+--------+--------+--------- >>> RxCan1[366] Avg| 0.00| 0.0000| 0.026 >>> Peak| | 0.1429| 1.001 >>> ---------------+--------+--------+--------- >>> RxCan1[367] Avg| 0.00| 0.0000| 0.026 >>> Peak| | 0.1472| 0.828 >>> ---------------+--------+--------+--------- >>> RxCan1[368] Avg| 0.00| 0.0000| 0.024 >>> Peak| | 0.1323| 0.931 >>> ---------------+--------+--------+--------- >>> RxCan1[369] Avg| 0.00| 0.0000| 0.026 >>> Peak| | 0.1498| 1.072 >>> ---------------+--------+--------+--------- >>> RxCan1[380] Avg| 0.00| 0.0000| 0.022 >>> Peak| | 0.1285| 0.348 >>> ---------------+--------+--------+--------- >>> RxCan1[38b] Avg| 0.00| 0.0000| 0.021 >>> Peak| | 0.3298| 1.168 >>> ---------------+--------+--------+--------- >>> RxCan1[3b3] Avg| 0.00| 0.0000| 0.025 >>> Peak| | 0.1348| 0.920 >>> ---------------+--------+--------+--------- >>> RxCan1[400] Avg| 0.00| 0.0000| 0.022 >>> Peak| | 0.0481| 0.445 >>> ---------------+--------+--------+--------- >>> RxCan1[405] Avg| 0.00| 0.0000| 0.034 >>> Peak| | 0.0723| 0.473 >>> ---------------+--------+--------+--------- >>> RxCan1[40a] Avg| 0.00| 0.0000| 0.025 >>> Peak| | 0.1040| 0.543 >>> ---------------+--------+--------+--------- >>> RxCan1[410] Avg| 0.00| 0.0000| 0.024 >>> Peak| | 0.1339| 0.678 >>> ---------------+--------+--------+--------- >>> RxCan1[411] Avg| 0.00| 0.0000| 0.025 >>> Peak| | 0.1376| 0.573 >>> ---------------+--------+--------+--------- >>> RxCan1[416] Avg| 0.00| 0.0000| 0.023 >>> Peak| | 0.1284| 0.346 >>> ---------------+--------+--------+--------- >>> RxCan1[421] Avg| 0.00| 0.0000| 0.024 >>> Peak| | 0.1323| 0.643 >>> ---------------+--------+--------+--------- >>> RxCan1[42d] Avg| 0.00| 0.0000| 0.023 >>> Peak| | 0.1362| 1.146 >>> ---------------+--------+--------+--------- >>> RxCan1[42f] Avg| 0.00| 0.0000| 0.027 >>> Peak| | 0.1503| 1.762 >>> ---------------+--------+--------+--------- >>> RxCan1[430] Avg| 0.00| 0.0000| 0.023 >>> Peak| | 0.1352| 0.347 >>> ---------------+--------+--------+--------- >>> RxCan1[434] Avg| 0.00| 0.0000| 0.024 >>> Peak| | 0.1312| 0.580 >>> ---------------+--------+--------+--------- >>> RxCan1[435] Avg| 0.00| 0.0000| 0.029 >>> Peak| | 0.1109| 1.133 >>> ---------------+--------+--------+--------- >>> RxCan1[43e] Avg| 0.00| 0.0000| 0.023 >>> Peak| | 0.2776| 0.686 >>> ---------------+--------+--------+--------- >>> RxCan1[440] Avg| 0.00| 0.0000| 0.022 >>> Peak| | 0.0118| 0.276 >>> ---------------+--------+--------+--------- >>> RxCan1[465] Avg| 0.00| 0.0000| 0.022 >>> Peak| | 0.0118| 0.279 >>> ---------------+--------+--------+--------- >>> RxCan1[466] Avg| 0.00| 0.0000| 0.023 >>> Peak| | 0.0123| 0.310 >>> ---------------+--------+--------+--------- >>> RxCan1[467] Avg| 0.00| 0.0000| 0.025 >>> Peak| | 0.0132| 0.314 >>> ---------------+--------+--------+--------- >>> RxCan1[472] Avg| 0.00| 0.0000| 0.101 >>> Peak| | 0.0307| 1.105 >>> ---------------+--------+--------+--------- >>> RxCan1[473] Avg| 0.00| 0.0000| 0.051 >>> Peak| | 0.0107| 0.575 >>> ---------------+--------+--------+--------- >>> RxCan1[474] Avg| 0.00| 0.0000| 0.024 >>> Peak| | 0.0097| 0.289 >>> ---------------+--------+--------+--------- >>> RxCan1[475] Avg| 0.00| 0.0000| 0.023 >>> Peak| | 0.0220| 0.327 >>> ---------------+--------+--------+--------- >>> RxCan1[476] Avg| 0.00| 0.0000| 0.050 >>> Peak| | 0.0762| 5.329 >>> ---------------+--------+--------+--------- >>> RxCan1[477] Avg| 0.00| 0.0000| 0.032 >>> Peak| | 0.0283| 0.669 >>> ---------------+--------+--------+--------- >>> RxCan1[595] Avg| 0.00| 0.0000| 0.026 >>> Peak| | 0.0103| 0.297 >>> ---------------+--------+--------+--------- >>> RxCan1[59e] Avg| 0.00| 0.0000| 0.022 >>> Peak| | 0.0114| 0.263 >>> ---------------+--------+--------+--------- >>> RxCan1[5a2] Avg| 0.00| 0.0000| 0.026 >>> Peak| | 0.0119| 0.505 >>> ---------------+--------+--------+--------- >>> RxCan1[5ba] Avg| 0.00| 0.0000| 0.025 >>> Peak| | 0.0139| 0.549 >>> ---------------+--------+--------+--------- >>> RxCan2[020] Avg| 0.00| 0.0000| 0.026 >>> Peak| | 0.4923| 1.133 >>> ---------------+--------+--------+--------- >>> RxCan2[030] Avg| 0.00| 0.0000| 0.023 >>> Peak| | 0.3297| 1.136 >>> ---------------+--------+--------+--------- >>> RxCan2[03a] Avg| 0.00| 0.0000| 0.022 >>> Peak| | 0.2792| 1.275 >>> ---------------+--------+--------+--------- >>> RxCan2[040] Avg| 0.00| 0.0000| 0.023 >>> Peak| | 0.2834| 1.080 >>> ---------------+--------+--------+--------- >>> RxCan2[060] Avg| 0.00| 0.0000| 0.029 >>> Peak| | 0.3037| 0.991 >>> ---------------+--------+--------+--------- >>> RxCan2[070] Avg| 0.00| 0.0000| 0.025 >>> Peak| | 0.2291| 0.460 >>> ---------------+--------+--------+--------- >>> RxCan2[080] Avg| 0.00| 0.0000| 0.043 >>> Peak| | 0.4015| 1.007 >>> ---------------+--------+--------+--------- >>> RxCan2[083] Avg| 0.00| 0.0000| 0.026 >>> Peak| | 0.2957| 0.788 >>> ---------------+--------+--------+--------- >>> RxCan2[090] Avg| 0.00| 0.0000| 0.027 >>> Peak| | 0.3951| 1.231 >>> ---------------+--------+--------+--------- >>> RxCan2[0a0] Avg| 0.00| 0.0000| 0.026 >>> Peak| | 0.2560| 0.722 >>> ---------------+--------+--------+--------- >>> RxCan2[100] Avg| 0.00| 0.0000| 0.046 >>> Peak| | 0.4506| 21.961 >>> ---------------+--------+--------+--------- >>> RxCan2[108] Avg| 0.00| 0.0000| 0.024 >>> Peak| | 0.3713| 1.125 >>> ---------------+--------+--------+--------- >>> RxCan2[110] Avg| 0.00| 0.0000| 0.029 >>> Peak| | 0.2443| 0.755 >>> ---------------+--------+--------+--------- >>> RxCan2[130] Avg| 0.00| 0.0000| 0.023 >>> Peak| | 0.2052| 1.097 >>> ---------------+--------+--------+--------- >>> RxCan2[150] Avg| 0.00| 0.0000| 0.023 >>> Peak| | 0.2246| 0.371 >>> ---------------+--------+--------+--------- >>> RxCan2[160] Avg| 0.00| 0.0000| 0.024 >>> Peak| | 0.0755| 1.125 >>> ---------------+--------+--------+--------- >>> RxCan2[180] Avg| 0.00| 0.0000| 0.023 >>> Peak| | 0.2350| 0.936 >>> ---------------+--------+--------+--------- >>> RxCan2[190] Avg| 0.00| 0.0000| 0.022 >>> Peak| | 0.2275| 0.592 >>> ---------------+--------+--------+--------- >>> RxCan2[1a0] Avg| 0.00| 0.0000| 0.025 >>> Peak| | 0.0125| 0.273 >>> ---------------+--------+--------+--------- >>> RxCan2[1a4] Avg| 0.00| 0.0000| 0.022 >>> Peak| | 0.2806| 0.632 >>> ---------------+--------+--------+--------- >>> RxCan2[1a8] Avg| 0.00| 0.0000| 0.022 >>> Peak| | 0.1683| 0.740 >>> ---------------+--------+--------+--------- >>> RxCan2[1b0] Avg| 0.00| 0.0000| 0.023 >>> Peak| | 0.1360| 0.490 >>> ---------------+--------+--------+--------- >>> RxCan2[1b4] Avg| 0.00| 0.0000| 0.027 >>> Peak| | 0.1556| 1.119 >>> ---------------+--------+--------+--------- >>> RxCan2[1b8] Avg| 0.00| 0.0000| 0.022 >>> Peak| | 0.1704| 0.616 >>> ---------------+--------+--------+--------- >>> RxCan2[1c0] Avg| 0.00| 0.0000| 0.023 >>> Peak| | 0.1317| 0.488 >>> ---------------+--------+--------+--------- >>> RxCan2[1e0] Avg| 0.00| 0.0000| 0.025 >>> Peak| | 0.1460| 0.675 >>> ---------------+--------+--------+--------- >>> RxCan2[215] Avg| 0.00| 0.0000| 0.023 >>> Peak| | 0.1191| 0.567 >>> ---------------+--------+--------+--------- >>> RxCan2[217] Avg| 0.00| 0.0000| 0.023 >>> Peak| | 0.1167| 0.869 >>> ---------------+--------+--------+--------- >>> RxCan2[220] Avg| 0.00| 0.0000| 0.023 >>> Peak| | 0.0918| 0.313 >>> ---------------+--------+--------+--------- >>> RxCan2[225] Avg| 0.00| 0.0000| 0.025 >>> Peak| | 0.3635| 1.018 >>> ---------------+--------+--------+--------- >>> RxCan2[230] Avg| 0.00| 0.0000| 0.057 >>> Peak| | 0.2192| 1.063 >>> ---------------+--------+--------+--------- >>> RxCan2[240] Avg| 0.00| 0.0000| 0.023 >>> Peak| | 0.1173| 0.760 >>> ---------------+--------+--------+--------- >>> RxCan2[241] Avg| 0.00| 0.0000| 0.022 >>> Peak| | 0.2830| 1.144 >>> ---------------+--------+--------+--------- >>> RxCan2[250] Avg| 0.00| 0.0000| 0.026 >>> Peak| | 0.0701| 0.698 >>> ---------------+--------+--------+--------- >>> RxCan2[255] Avg| 0.00| 0.0000| 0.022 >>> Peak| | 0.1755| 1.063 >>> ---------------+--------+--------+--------- >>> RxCan2[265] Avg| 0.00| 0.0000| 0.024 >>> Peak| | 0.1771| 0.729 >>> ---------------+--------+--------+--------- >>> RxCan2[270] Avg| 0.00| 0.0000| 0.023 >>> Peak| | 0.0667| 0.307 >>> ---------------+--------+--------+--------- >>> RxCan2[290] Avg| 0.00| 0.0000| 0.022 >>> Peak| | 0.0410| 0.280 >>> ---------------+--------+--------+--------- >>> RxCan2[295] Avg| 0.00| 0.0000| 0.023 >>> Peak| | 0.0881| 0.299 >>> ---------------+--------+--------+--------- >>> RxCan2[2a0] Avg| 0.00| 0.0000| 0.023 >>> Peak| | 0.0420| 0.268 >>> ---------------+--------+--------+--------- >>> RxCan2[2a7] Avg| 0.00| 0.0000| 0.021 >>> Peak| | 0.1716| 0.454 >>> ---------------+--------+--------+--------- >>> RxCan2[2b0] Avg| 0.00| 0.0000| 0.023 >>> Peak| | 0.0424| 0.300 >>> ---------------+--------+--------+--------- >>> RxCan2[2c0] Avg| 0.00| 0.0000| 0.024 >>> Peak| | 0.0470| 0.298 >>> ---------------+--------+--------+--------- >>> RxCan2[2e0] Avg| 0.00| 0.0000| 0.030 >>> Peak| | 0.0324| 1.152 >>> ---------------+--------+--------+--------- >>> RxCan2[2f0] Avg| 0.00| 0.0000| 0.024 >>> Peak| | 0.0229| 0.359 >>> ---------------+--------+--------+--------- >>> RxCan2[2f5] Avg| 0.00| 0.0000| 0.026 >>> Peak| | 0.1882| 0.673 >>> ---------------+--------+--------+--------- >>> RxCan2[300] Avg| 0.00| 0.0000| 0.022 >>> Peak| | 0.0186| 0.263 >>> ---------------+--------+--------+--------- >>> RxCan2[310] Avg| 0.00| 0.0000| 0.024 >>> Peak| | 0.0210| 0.265 >>> ---------------+--------+--------+--------- >>> RxCan2[320] Avg| 0.00| 0.0000| 0.025 >>> Peak| | 0.0207| 0.354 >>> ---------------+--------+--------+--------- >>> RxCan2[326] Avg| 0.00| 0.0000| 0.023 >>> Peak| | 0.1466| 0.686 >>> ---------------+--------+--------+--------- >>> RxCan2[330] Avg| 0.00| 0.0000| 0.022 >>> Peak| | 0.4580| 0.708 >>> ---------------+--------+--------+--------- >>> RxCan2[340] Avg| 0.00| 0.0000| 0.031 >>> Peak| | 0.1621| 0.785 >>> ---------------+--------+--------+--------- >>> RxCan2[345] Avg| 0.00| 0.0000| 0.021 >>> Peak| | 0.0199| 0.261 >>> ---------------+--------+--------+--------- >>> RxCan2[35e] Avg| 0.00| 0.0000| 0.023 >>> Peak| | 0.0686| 0.449 >>> ---------------+--------+--------+--------- >>> RxCan2[360] Avg| 0.00| 0.0000| 0.025 >>> Peak| | 0.0204| 0.289 >>> ---------------+--------+--------+--------- >>> RxCan2[361] Avg| 0.00| 0.0000| 0.022 >>> Peak| | 0.1166| 0.316 >>> ---------------+--------+--------+--------- >>> RxCan2[363] Avg| 0.00| 0.0000| 0.023 >>> Peak| | 0.0146| 0.304 >>> ---------------+--------+--------+--------- >>> RxCan2[370] Avg| 0.00| 0.0000| 0.024 >>> Peak| | 0.0099| 0.278 >>> ---------------+--------+--------+--------- >>> RxCan2[381] Avg| 0.00| 0.0000| 0.025 >>> Peak| | 0.0468| 0.459 >>> ---------------+--------+--------+--------- >>> RxCan2[3a0] Avg| 0.00| 0.0000| 0.021 >>> Peak| | 0.2339| 0.617 >>> ---------------+--------+--------+--------- >>> RxCan2[3d0] Avg| 0.00| 0.0000| 0.022 >>> Peak| | 0.1351| 0.351 >>> ---------------+--------+--------+--------- >>> RxCan2[3d5] Avg| 0.00| 0.0000| 0.023 >>> Peak| | 0.0796| 0.692 >>> ---------------+--------+--------+--------- >>> RxCan2[400] Avg| 0.00| 0.0000| 0.023 >>> Peak| | 0.0537| 0.307 >>> ---------------+--------+--------+--------- >>> RxCan2[405] Avg| 0.00| 0.0000| 0.021 >>> Peak| | 0.0513| 0.303 >>> ---------------+--------+--------+--------- >>> RxCan2[40a] Avg| 0.00| 0.0000| 0.022 >>> Peak| | 0.1099| 0.313 >>> ---------------+--------+--------+--------- >>> RxCan2[415] Avg| 0.00| 0.0000| 0.022 >>> Peak| | 0.0204| 0.251 >>> ---------------+--------+--------+--------- >>> RxCan2[435] Avg| 0.00| 0.0000| 0.028 >>> Peak| | 0.0113| 0.342 >>> ---------------+--------+--------+--------- >>> RxCan2[440] Avg| 0.00| 0.0000| 0.027 >>> Peak| | 0.0110| 0.299 >>> ---------------+--------+--------+--------- >>> RxCan2[465] Avg| 0.00| 0.0000| 0.023 >>> Peak| | 0.0122| 0.295 >>> ---------------+--------+--------+--------- >>> RxCan2[466] Avg| 0.00| 0.0000| 0.022 >>> Peak| | 0.0117| 0.267 >>> ---------------+--------+--------+--------- >>> RxCan2[467] Avg| 0.00| 0.0000| 0.022 >>> Peak| | 0.0164| 0.325 >>> ---------------+--------+--------+--------- >>> RxCan2[501] Avg| 0.00| 0.0000| 0.023 >>> Peak| | 0.0236| 0.276 >>> ---------------+--------+--------+--------- >>> RxCan2[503] Avg| 0.00| 0.0000| 0.023 >>> Peak| | 0.0248| 0.349 >>> ---------------+--------+--------+--------- >>> RxCan2[504] Avg| 0.00| 0.0000| 0.023 >>> Peak| | 0.0230| 0.312 >>> ---------------+--------+--------+--------- >>> RxCan2[505] Avg| 0.00| 0.0000| 0.025 >>> Peak| | 0.0256| 0.310 >>> ---------------+--------+--------+--------- >>> RxCan2[508] Avg| 0.00| 0.0000| 0.023 >>> Peak| | 0.0281| 0.329 >>> ---------------+--------+--------+--------- >>> RxCan2[511] Avg| 0.00| 0.0000| 0.022 >>> Peak| | 0.0232| 0.282 >>> ---------------+--------+--------+--------- >>> RxCan2[51e] Avg| 0.00| 0.0000| 0.023 >>> Peak| | 0.0248| 0.298 >>> ---------------+--------+--------+--------- >>> RxCan2[581] Avg| 0.00| 0.0000| 0.025 >>> Peak| | 0.0166| 0.286 >>> ===============+========+========+========= >>> Total Avg| 0.00| 0.0000| 43.563 >>> >>> At the same time, calling poller times on, poller times status causes the bus to crash, although no polls are actively being sent at all. >>> >>> Cheers, >>> Simon >>> _______________________________________________ >>> OvmsDev mailing list >>> OvmsDev@lists.openvehicles.com >>> http://lists.openvehicles.com/mailman/listinfo/ovmsdev >>> >>> >>> _______________________________________________ >>> OvmsDev mailing list >>> OvmsDev@lists.openvehicles.com >>> http://lists.openvehicles.com/mailman/listinfo/ovmsdev >> >> _______________________________________________ >> OvmsDev mailing list >> OvmsDev@lists.openvehicles.com >> http://lists.openvehicles.com/mailman/listinfo/ovmsdev >
_______________________________________________ OvmsDev mailing list OvmsDev@lists.openvehicles.com http://lists.openvehicles.com/mailman/listinfo/ovmsdev
-- Michael Balzer *Am Rahmen 5 * D-58313 Herdecke <https://www.google.com/maps/search/Am+Rahmen+5+*+D-58313+Herdecke?entry=gmail&source=g> Fon 02330 9104094 * Handy 0176 20698926
_______________________________________________ OvmsDev mailing list OvmsDev@lists.openvehicles.com http://lists.openvehicles.com/mailman/listinfo/ovmsdev
_______________________________________________ OvmsDev mailing list OvmsDev@lists.openvehicles.com http://lists.openvehicles.com/mailman/listinfo/ovmsdev
_______________________________________________ OvmsDev mailing list OvmsDev@lists.openvehicles.com http://lists.openvehicles.com/mailman/listinfo/ovmsdev
-- Michael Balzer * Am Rahmen 5 * D-58313 Herdecke Fon 02330 9104094 * Handy 0176 20698926
_______________________________________________ OvmsDev mailing list OvmsDev@lists.openvehicles.com http://lists.openvehicles.com/mailman/listinfo/ovmsdev
As written before, the poller thread does not need to do anything to acknowledge packets on the bus, that's done by the transceiver (i.e. in hardware). The most recent changes to the bus reset methods also date back before the last main release. I've run out of ideas here. Regarding the time statistics workload overhead, Michael Geddes could best estimate that. Maybe printing the stats locks these for too long in this case? There previously was no need for bus/ID filters for the statistics (or CAN RX), so that would need to be implemented. Regards, Michael Am 17.01.25 um 11:34 schrieb Simon Ehlen via OvmsDev:
Hi,
How does the CAN bus crash manifest? Charging stops during a charging process, the LEDs on the typ 2 socket flash. OVMS cannot be reached via WLAN or WAN. While driving, the crash of the bus means that the car switches to limp mode. In the Focus Electric, this means that the powertrain is _immediately_ switched off completely and “stop safely now” is displayed on the dashboard. OVMS cannot be reached via WLAN or WAN.
Since the problem does not occur in listen mode, I have to assume that the poller thread somewhere is no longer able to keep up with the acknowledgement and is therefore causing the bus to get out of step. For the statistics alone, the poller seems to evaluate every frame and therefore has a certain workload or do I have the option of restricting this to certain modules before calling IncomingFrameCan?
Cheers, Simon
Am 17.01.2025 um 11:08 schrieb Michael Balzer via OvmsDev:
Simon,
AFAIK "Pollers[Send]" is the regular "next round" request for the polling task, not a frame transmission. A TX attempt in listen mode would produce a warn level log entry "Cannot write <busname> when not in ACTIVE mode" for tag "esp32can" or "mcp2515".
With the old poller, you wouldn't have had any indication of a queue overflow, so the new poller may help you to identify an issue in your code.
You need to understand the new poller not only does polls, it's now the main CAN receiver for the vehicle module. That's why your poller time stats include all process data frames as well, not only protocol frames.
The overflow means either your CAN processing is too slow to keep up with the packets received, or some other task is hogging the CPU. That would need to be a task with an equal or higher priority as the vehicle task, which has priority level 10 -- only system & networking tasks are above, so that's not likely. (You can check the CPU usage with the "module tasks" command.)
That means you should check your standard frame processing (`IncomingFrameCanX` callbacks) for potential delays and processing complexity issues.
The poller statistics can help you track this down, but you need to have at least 10 seconds of statistics, the more the better. Rule of thumb: PRI average at 0.0/second means you don't have enough data yet. (-- //.ichael, correct me if I'm wrong)
At the same time, calling poller times on, poller times status causes the bus to crash
In any case that still doesn't explain how the poller could possibly cause a CAN bus (!) crash without actually doing any transmissions.
How does the CAN bus crash manifest?
Regards, Michael
Am 15.01.25 um 19:54 schrieb Simon Ehlen via OvmsDev:
I put the two buses back into listen mode and drove a short distance and charged the car. As I said, there is no active polling in my code. As expected, there is therefore no indication of a failed TX attempt in the console log. I only continue to see a lot of RX Task Queue Overflow messages in the log, which I did not have before. I also see a Pollers[Send]: Task Queue Overflow entry, but since I don't see any indication of “cannot write” on that, I'm not assuming that's a “real” send.
I (19760210) vehicle-poll: Poller[Frame]: RX Task Queue Overflow Run 5 I (19764420) vehicle-poll: Poller[Frame]: RX Task Queue Overflow Run 1 I (19764420) vehicle-poll: Poller[Frame]: RX Task Queue Overflow Run 3 I (19764420) vehicle-poll: Poller[Frame]: RX Task Queue Overflow Run 1 I (19764740) vehicle-poll: Poller[Frame]: RX Task Queue Overflow Run 1 I (19764740) vehicle-poll: Poller[Frame]: RX Task Queue Overflow Run 1 I (19764740) vehicle-poll: Poller[Frame]: RX Task Queue Overflow Run 1 I (19764740) vehicle-poll: Poller[Frame]: RX Task Queue Overflow Run 1 I (19764740) vehicle-poll: Poller[Frame]: RX Task Queue Overflow Run 1 I (19764750) vehicle-poll: Poller[Frame]: RX Task Queue Overflow Run 2 I (19764750) vehicle-poll: Poller[Frame]: RX Task Queue Overflow Run 1 I (19764750) vehicle-poll: Poller[Frame]: RX Task Queue Overflow Run 2 I (19764870) vehicle-poll: Poller[Frame]: RX Task Queue Overflow Run 1 I (19764870) vehicle-poll: Poller[Frame]: RX Task Queue Overflow Run 2 I (19765270) vehicle-poll: Poller[Frame]: RX Task Queue Overflow Run 4 I (19765270) vehicle-poll: Poller[Frame]: RX Task Queue Overflow Run 6 I (19765610) vehicle-poll: Poller[Frame]: RX Task Queue Overflow Run 3 I (19765930) vehicle-poll: Poller[Frame]: RX Task Queue Overflow Run 1 I (19765930) vehicle-poll: Poller[Frame]: RX Task Queue Overflow Run 3 I (19765930) vehicle-poll: Poller[Frame]: RX Task Queue Overflow Run 1 I (19766260) vehicle-poll: Poller[Frame]: RX Task Queue Overflow Run 50 I (19766260) vehicle-poll: Poller[Frame]: RX Task Queue Overflow Run 48 I (19766260) vehicle-poll: Poller[Frame]: RX Task Queue Overflow Run 27 I (19766270) vehicle-poll: Poller[Frame]: RX Task Queue Overflow Run 6 I (19766270) vehicle-poll: Poller[Frame]: RX Task Queue Overflow Run 4 E (19766280) can: can2: intr=4754831 rxpkt=4757493 txpkt=0 errflags=0x22401c02 rxerr=0 txerr=0 rxinval=0 rxovr=0 txovr=0 txdelay=0 txfail=0 wdgreset=1 errreset=0 E (19766300) can: can2: intr=4754831 rxpkt=4757494 txpkt=0 errflags=0x23401c01 rxerr=0 txerr=0 rxinval=0 rxovr=0 txovr=0 txdelay=0 txfail=0 wdgreset=1 errreset=0 I (19766300) vehicle-poll: Poller[Frame]: RX Task Queue Overflow Run 7 I (19766340) vehicle-poll: Poller[Frame]: RX Task Queue Overflow Run 39 I (19766350) vehicle-poll: Poller[Frame]: RX Task Queue Overflow Run 32 I (19766350) vehicle-poll: Poller[Frame]: RX Task Queue Overflow Run 17 I (19766350) vehicle-poll: Poller[Frame]: RX Task Queue Overflow Run 3 I (19766350) vehicle-poll: Pollers[Send]: Task Queue Overflow I (19766350) vehicle-poll: Poller[Frame]: RX Task Queue Overflow Run 1 I (19766350) vehicle-poll: Poller[Frame]: RX Task Queue Overflow Run 1 E (19766360) can: can2: intr=4754840 rxpkt=4757509 txpkt=0 errflags=0x22401c02 rxerr=0 txerr=0 rxinval=0 rxovr=0 txovr=0 txdelay=0 txfail=0 wdgreset=1 errreset=0 I (19766370) vehicle-poll: Poller[Frame]: RX Task Queue Overflow Run 4 E (19766370) can: can2: intr=4754840 rxpkt=4757510 txpkt=0 errflags=0x23401c01 rxerr=0 txerr=0 rxinval=0 rxovr=0 txovr=0 txdelay=0 txfail=0 wdgreset=1 errreset=0 I (19766430) vehicle-poll: Poller[Frame]: RX Task Queue Overflow Run 30 I (19766430) vehicle-poll: Poller[Frame]: RX Task Queue Overflow Run 36 I (19766430) vehicle-poll: Poller[Frame]: RX Task Queue Overflow Run 26 I (19766430) vehicle-poll: Poller[Frame]: RX Task Queue Overflow Run 4 I (19766430) vehicle-poll: Poller[Frame]: RX Task Queue Overflow Run 3 I (19766430) vehicle-poll: Poller[Frame]: RX Task Queue Overflow Run 2 I (19766430) vehicle-poll: Poller[Frame]: RX Task Queue Overflow Run 1 E (19766450) can: can2: intr=4754855 rxpkt=4757535 txpkt=0 errflags=0x23001001 rxerr=0 txerr=0 rxinval=0 rxovr=0 txovr=0 txdelay=0 txfail=0 wdgreset=1 errreset=0 E (19766460) can: can2: intr=4754855 rxpkt=4757536 txpkt=0 errflags=0x23401c01 rxerr=0 txerr=0 rxinval=0 rxovr=0 txovr=0 txdelay=0 txfail=0 wdgreset=1 errreset=0 E (19766520) can: can2: intr=4754855 rxpkt=4757539 txpkt=0 errflags=0x22001002 rxerr=0 txerr=0 rxinval=0 rxovr=0 txovr=0 txdelay=0 txfail=0 wdgreset=1 errreset=0 I (19766520) vehicle-poll: Poller[Frame]: RX Task Queue Overflow Run 9 I (19766520) vehicle-poll: Poller[Frame]: RX Task Queue Overflow Run 37 I (19766520) vehicle-poll: Poller[Frame]: RX Task Queue Overflow Run 30 I (19766520) vehicle-poll: Poller[Frame]: RX Task Queue Overflow Run 6 I (19766520) vehicle-poll: Poller[Frame]: RX Task Queue Overflow Run 2 I (19766520) vehicle-poll: Poller[Frame]: RX Task Queue Overflow Run 1 I (19766520) vehicle-poll: Poller[Frame]: RX Task Queue Overflow Run 1 I (19766520) vehicle-poll: Poller[Frame]: RX Task Queue Overflow Run 3 I (19766530) vehicle-poll: Poller[Frame]: RX Task Queue Overflow Run 1 I (19766530) vehicle-poll: Poller[Frame]: RX Task Queue Overflow Run 1 I (19766530) vehicle-poll: Poller[Frame]: RX Task Queue Overflow Run 1 E (19766540) can: can2: intr=4754861 rxpkt=4757548 txpkt=0 errflags=0x23401c01 rxerr=0 txerr=0 rxinval=0 rxovr=0 txovr=0 txdelay=0 txfail=0 wdgreset=1 errreset=0 I (19766550) vehicle-poll: Poller[Frame]: RX Task Queue Overflow Run 3 E (19766560) can: can2: intr=4754861 rxpkt=4757552 txpkt=0 errflags=0x23001001 rxerr=0 txerr=0 rxinval=0 rxovr=0 txovr=0 txdelay=0 txfail=0 wdgreset=1 errreset=0 E (19766610) can: can2: intr=4754861 rxpkt=4757553 txpkt=0 errflags=0x23401c01 rxerr=0 txerr=0 rxinval=0 rxovr=0 txovr=0 txdelay=0 txfail=0 wdgreset=1 errreset=0 I (19766610) vehicle-poll: Poller[Frame]: RX Task Queue Overflow Run 4 I (19766610) vehicle-poll: Poller[Frame]: RX Task Queue Overflow Run 5 I (19766610) vehicle-poll: Poller[Frame]: RX Task Queue Overflow Run 33 I (19766610) vehicle-poll: Poller[Frame]: RX Task Queue Overflow Run 34 I (19766610) vehicle-poll: Poller[Frame]: RX Task Queue Overflow Run 12 W (19767070) websocket: WebSocketHandler[0x3f8d79d8]: job queue overflow detected W (19767140) websocket: WebSocketHandler[0x3f8d79d8]: job queue overflow detected W (19767180) websocket: WebSocketHandler[0x3f8d79d8]: job queue overflow resolved, 1 drops W (19767260) websocket: WebSocketHandler[0x3f8d79d8]: job queue overflow detected W (19767310) websocket: WebSocketHandler[0x3f8d79d8]: job queue overflow resolved, 1 drops
Cheers Simon
Am 15.01.2025 um 19:18 schrieb Derek Caudwell via OvmsDev:
Since the following email I have high confidence the issue on the Leaf is related/caused by the poller as there has been no further occurrence and Chris has also experienced the car going to neutral on the new poller firmware.
.... I haven't ruled out it being a fault with my car yet. Shortly after it faulted the car was run into so has been off the road for sometime, my first step was to replace 12V battery. The ovms unit is now unplugged and if it does not fault over the next month while driving I'll be reasonably confident it's ovms related.
Not sure which firmware version the poller updates were included in but it was only after upgrading to it that the errors occurred (which could be coincidental however it has faulted twice more both on version 3.3.004-141-gf729d82c). For periods where I reverted to 3.3.003 it was fine.
It might be useful to have an extra option on the enable can write to only enable it when the car is parked/charging.
On Wed, 15 Jan 2025, 11:11 pm Michael Balzer via OvmsDev, <ovmsdev@lists.openvehicles.com> wrote:
Derek, can you comment on this? Do you still have the issue mentioned?
Speaking of the Leaf, the code there actually does something fishy in `CommandWakeup()`:
unsigned char data = 0; … m_can1->WriteStandard(0x5C0, *_8_*, &data); //Wakes up the VCM (by spoofing empty battery request heating)
And there are CAN transmissions from command execution in the Leaf code, so to be sure there is no TX, listen mode is needed there as well.
Regarding CAN trace, you can try with the monitor channel and use the USB console to record the log output. That way you should be able to at least rule out there are regular transmissions -- assuming not every TX will cause an immediate crash.
Another / probably better option: when in listen mode, the log will also tell you about TX attempts, as the driver will issue a warning on each.
The CAN monitor log may also tell you about bus errors detected.
Regards, Michael
Am 15.01.25 um 10:44 schrieb Simon Ehlen via OvmsDev:
There is at least one more Leaf from Derek that has also ended up in limp mode since the new poller. There, too, no polling was actually carried out while driving. I'm not familiar with the framework at all, but does this perhaps offer you enough of an approach to recognize a commonality?
Unfortunately I do not have a tool to create a CAN trace. I can't use the OVMS for this, as it no longer responds after a bus crash until I have disconnected it from the OBD and plugged it back in.
Cheers, Simon
Am 15.01.2025 um 10:18 schrieb Michael Balzer via OvmsDev:
The frame acknowledging is done automatically by the CAN transceiver when in active mode, this is part of the CAN protocol to indicate bit errors to the sender.
So normally a failure of the system to process received frames fast enough cannot cause any issue on the bus. But the ESP32 has a range of known hardware issues, especially in the embedded CAN transceiver, I wouldn't be surprised if there are more, or if our driver lacks some workaround for these.
Maybe the new poller has some bug that causes false transmissions from process data frames received. But many vehicles send process data frames, and we've had no issue reports like this on any of them, and ECUs also normally simply ignore out of sequence protocol frames.
You could record a CAN trace to see if there are transmissions, and what kind. If you don't poll and don't send frames from your code, there should be none. If the bus still crashes, that would be an indicator for something going wrong in the transceiver.
Regards, Michael
Am 15.01.25 um 07:15 schrieb Simon Ehlen via OvmsDev: > Thanks Mark for the explanation. > So does this mean that OVMS tries to acknowledge all > incoming messages in active mode? > This seems to me to clearly exceed the capacity of OVMS with > the mass of incoming messages. > > In fact, I am currently opening the bus in active mode, as I > was hoping to get my code to revive the BMS in OVMS to work. > However, unlike the other data, I only get the cell voltages > when I actively poll them. > To be on the safe side, I will now open the bus in read mode > again. > > However, I am still wondering what in the poller change has > altered the OVMS in such a way that the bus is now crashing > completely. > Currently I have undone the changes since february 2024, > this only concerns code from the public repository, there > was no change from me in that period. > Now the OVMS is running stable again and there are neither > queue overflows nor bus crashes. > > I had also previously increased the following queue sizes, > but unfortunately this was not successful: > CONFIG_OVMS_HW_EVENT_QUEUE_SIZE=120 > CONFIG_OVMS_HW_CAN_RX_QUEUE_SIZE=80 > CONFIG_OVMS_VEHICLE_CAN_RX_QUEUE_SIZE=80 > > Cheers, > Simon > > Am 15.01.2025 um 02:08 schrieb Mark Webb-Johnson: >> Note sure if this helps, but some comments: >> >> * Remember than CAN protocol in normal mode is an >> ‘active’ protocol. Nodes on the bus are actively >> acknowledging messages (and that includes OVMS), even >> if they never write messages. So in normal mode there >> is no absolute ‘read access’. For example, opening the >> CAN port at the wrong baud rate, even if not writing >> messages, will mess up the bus. >> >> >> * However, if you open the CAN port in ‘listen’ mode, >> then it is truly read-only. In that mode it will not >> acknowledge messages, and cannot write on the bus at >> all. I’ve never seen an OVMS mess up a bus in listen >> mode, even if the baud rate is wrong. I think the only >> way for that to happen would be a hardware layer issue >> (cabling, termination, etc). >> >> >> Regards, Mark. >> >>> On 15 Jan 2025, at 6:30 AM, Simon Ehlen via OvmsDev >>> <ovmsdev@lists.openvehicles.com> >>> <mailto:ovmsdev@lists.openvehicles.com> wrote: >>> >>> But what is the reason that a read access to the bus can >>> cause the bus to crash? >>> This is not critical during charging, it just aborts the >>> charging process with an error. >>> While driving, this results in a “stop safely now” error >>> message on the dashboard and the engine is switched off >>> immediately. >>> >>> Cheers, >>> Simon >>> >>> Am 14.01.2025 um 23:22 schrieb Michael Geddes via OvmsDev: >>>> You may need to increase the queue size for the poll task >>>> queue. >>>> >>>> The poller still handles the bus to vehicle notifications >>>> even if it is off. >>>> >>>> Any poller logging on such an intensive load of can >>>> messages is likely to be a problem. This is part of the >>>> reason it is flagged off. >>>> >>>> The total % looks wrong :/ >>>> >>>> //.ichael >>>> >>>> >>>> >>>> >>>> On Wed, 15 Jan 2025, 03:17 Simon Ehlen via OvmsDev, >>>> <ovmsdev@lists.openvehicles.com> wrote: >>>> >>>> Hi, >>>> >>>> I finally got around to merging my code with the >>>> current master (previous merge february 2024). >>>> I have rebuilt my code for a Ford Focus Electric so >>>> that it uses the new OvmsPoller class. >>>> >>>> However, I now see a lot of entries like this in my log: >>>> >>>> I (246448) vehicle-poll: Poller[Frame]: RX Task Queue >>>> Overflow Run 8 >>>> I (246448) vehicle-poll: Poller[Frame]: RX Task Queue >>>> Overflow Run 3 >>>> I (246448) vehicle-poll: Poller[Frame]: RX Task Queue >>>> Overflow Run 1 >>>> I (246448) vehicle-poll: Poller[Frame]: RX Task Queue >>>> Overflow Run 2 >>>> I (246448) vehicle-poll: Poller[Frame]: RX Task Queue >>>> Overflow Run 1 >>>> I (246448) vehicle-poll: Poller[Frame]: RX Task Queue >>>> Overflow Run 2 >>>> I (246448) vehicle-poll: Poller[Frame]: RX Task Queue >>>> Overflow Run 1 >>>> I (246448) vehicle-poll: Poller[Frame]: RX Task Queue >>>> Overflow Run 1 >>>> I (254448) vehicle-poll: Poller[Frame]: RX Task Queue >>>> Overflow Run 24 >>>> I (254448) vehicle-poll: Poller[Frame]: RX Task Queue >>>> Overflow Run 1 >>>> I (254448) vehicle-poll: Poller[Frame]: RX Task Queue >>>> Overflow Run 1 >>>> I (254448) vehicle-poll: Poller[Frame]: RX Task Queue >>>> Overflow Run 1 >>>> I (254448) vehicle-poll: Poller[Frame]: RX Task Queue >>>> Overflow Run 1 >>>> I (254448) vehicle-poll: Poller[Frame]: RX Task Queue >>>> Overflow Run 1 >>>> I (254448) vehicle-poll: Poller[Frame]: RX Task >>>> Queue Overflow Run 1 >>>> >>>> Was this message just hidden before or do I need to >>>> make further adjustments to my code? >>>> >>>> My code currently does not use active polling but >>>> reads on the busses (IncomingFrameCanX) on certain >>>> modules. >>>> >>>> When I look at poller times status, it looks very >>>> extensive to me... >>>> >>>> OVMS# poller times status >>>> Poller timing is: on >>>> Type | count | Utlztn | Time >>>> | per s | [%] | [ms] >>>> ---------------+--------+--------+--------- >>>> Poll:PRI Avg| 0.00| 0.0000| 0.003 >>>> Peak| | 0.0014| 0.041 >>>> ---------------+--------+--------+--------- >>>> RxCan1[010] Avg| 0.00| 0.0000| 0.020 >>>> Peak| | 1.2217| 1.089 >>>> ---------------+--------+--------+--------- >>>> RxCan1[030] Avg| 0.00| 0.0000| 0.024 >>>> Peak| | 1.2193| 1.241 >>>> ---------------+--------+--------+--------- >>>> RxCan1[041] Avg| 0.00| 0.0000| 0.023 >>>> Peak| | 0.6460| 1.508 >>>> ---------------+--------+--------+--------- >>>> RxCan1[049] Avg| 0.00| 0.0000| 0.024 >>>> Peak| | 0.6320| 0.630 >>>> ---------------+--------+--------+--------- >>>> RxCan1[04c] Avg| 0.00| 0.0000| 0.023 >>>> Peak| | 0.6430| 1.474 >>>> ---------------+--------+--------+--------- >>>> RxCan1[04d] Avg| 0.00| 0.0000| 0.022 >>>> Peak| | 1.2987| 1.359 >>>> ---------------+--------+--------+--------- >>>> RxCan1[076] Avg| 0.00| 0.0000| 0.072 >>>> Peak| | 0.7818| 15.221 >>>> ---------------+--------+--------+--------- >>>> RxCan1[077] Avg| 0.00| 0.0000| 0.022 >>>> Peak| | 0.6274| 0.955 >>>> ---------------+--------+--------+--------- >>>> RxCan1[07a] Avg| 0.00| 0.0000| 0.039 >>>> Peak| | 1.7602| 1.684 >>>> ---------------+--------+--------+--------- >>>> RxCan1[07d] Avg| 0.00| 0.0000| 0.023 >>>> Peak| | 0.6621| 1.913 >>>> ---------------+--------+--------+--------- >>>> RxCan1[0c8] Avg| 0.00| 0.0000| 0.026 >>>> Peak| | 0.6292| 1.412 >>>> ---------------+--------+--------+--------- >>>> RxCan1[11a] Avg| 0.00| 0.0000| 0.023 >>>> Peak| | 1.2635| 1.508 >>>> ---------------+--------+--------+--------- >>>> RxCan1[130] Avg| 0.00| 0.0000| 0.024 >>>> Peak| | 0.6548| 0.703 >>>> ---------------+--------+--------+--------- >>>> RxCan1[139] Avg| 0.00| 0.0000| 0.021 >>>> Peak| | 0.6002| 0.984 >>>> ---------------+--------+--------+--------- >>>> RxCan1[156] Avg| 0.00| 0.0000| 0.024 >>>> Peak| | 0.1225| 0.479 >>>> ---------------+--------+--------+--------- >>>> RxCan1[160] Avg| 0.00| 0.0000| 0.028 >>>> Peak| | 0.6586| 1.376 >>>> ---------------+--------+--------+--------- >>>> RxCan1[165] Avg| 0.00| 0.0000| 0.027 >>>> Peak| | 0.6368| 1.132 >>>> ---------------+--------+--------+--------- >>>> RxCan1[167] Avg| 0.00| 0.0000| 0.024 >>>> Peak| | 1.3009| 1.067 >>>> ---------------+--------+--------+--------- >>>> RxCan1[171] Avg| 0.00| 0.0000| 0.022 >>>> Peak| | 0.6590| 4.320 >>>> ---------------+--------+--------+--------- >>>> RxCan1[178] Avg| 0.00| 0.0000| 0.023 >>>> Peak| | 0.1161| 0.311 >>>> ---------------+--------+--------+--------- >>>> RxCan1[179] Avg| 0.00| 0.0000| 0.024 >>>> Peak| | 0.1236| 0.536 >>>> ---------------+--------+--------+--------- >>>> RxCan1[180] Avg| 0.00| 0.0000| 0.022 >>>> Peak| | 0.6472| 1.193 >>>> ---------------+--------+--------+--------- >>>> RxCan1[185] Avg| 0.00| 0.0000| 0.022 >>>> Peak| | 0.6777| 1.385 >>>> ---------------+--------+--------+--------- >>>> RxCan1[1a0] Avg| 0.00| 0.0000| 0.022 >>>> Peak| | 0.6486| 2.276 >>>> ---------------+--------+--------+--------- >>>> RxCan1[1e0] Avg| 0.00| 0.0000| 0.023 >>>> Peak| | 0.6725| 1.376 >>>> ---------------+--------+--------+--------- >>>> RxCan1[1e4] Avg| 0.00| 0.0000| 0.027 >>>> Peak| | 0.7370| 1.266 >>>> ---------------+--------+--------+--------- >>>> RxCan1[1f0] Avg| 0.00| 0.0000| 0.024 >>>> Peak| | 0.4253| 0.753 >>>> ---------------+--------+--------+--------- >>>> RxCan1[200] Avg| 0.00| 0.0000| 0.025 >>>> Peak| | 0.6262| 0.791 >>>> ---------------+--------+--------+--------- >>>> RxCan1[202] Avg| 0.00| 0.0000| 0.021 >>>> Peak| | 1.2915| 1.257 >>>> ---------------+--------+--------+--------- >>>> RxCan1[204] Avg| 0.00| 0.0000| 0.022 >>>> Peak| | 1.2620| 1.010 >>>> ---------------+--------+--------+--------- >>>> RxCan1[213] Avg| 0.00| 0.0000| 0.022 >>>> Peak| | 0.6331| 1.185 >>>> ---------------+--------+--------+--------- >>>> RxCan1[214] Avg| 0.00| 0.0000| 0.023 >>>> Peak| | 0.9977| 34.527 >>>> ---------------+--------+--------+--------- >>>> RxCan1[217] Avg| 0.00| 0.0000| 0.024 >>>> Peak| | 1.2825| 1.328 >>>> ---------------+--------+--------+--------- >>>> RxCan1[218] Avg| 0.00| 0.0000| 0.022 >>>> Peak| | 0.6328| 1.110 >>>> ---------------+--------+--------+--------- >>>> RxCan1[230] Avg| 0.00| 0.0000| 0.019 >>>> Peak| | 0.6742| 5.119 >>>> ---------------+--------+--------+--------- >>>> RxCan1[240] Avg| 0.00| 0.0000| 0.022 >>>> Peak| | 0.1163| 0.343 >>>> ---------------+--------+--------+--------- >>>> RxCan1[242] Avg| 0.00| 0.0000| 0.025 >>>> Peak| | 0.3501| 1.015 >>>> ---------------+--------+--------+--------- >>>> RxCan1[24a] Avg| 0.00| 0.0000| 0.022 >>>> Peak| | 0.1212| 0.338 >>>> ---------------+--------+--------+--------- >>>> RxCan1[24b] Avg| 0.00| 0.0000| 0.023 >>>> Peak| | 0.1289| 0.330 >>>> ---------------+--------+--------+--------- >>>> RxCan1[24c] Avg| 0.00| 0.0000| 0.033 >>>> Peak| | 0.1714| 1.189 >>>> ---------------+--------+--------+--------- >>>> RxCan1[25a] Avg| 0.00| 0.0000| 0.024 >>>> Peak| | 0.1289| 0.510 >>>> ---------------+--------+--------+--------- >>>> RxCan1[25b] Avg| 0.00| 0.0000| 0.022 >>>> Peak| | 0.6685| 0.930 >>>> ---------------+--------+--------+--------- >>>> RxCan1[25c] Avg| 0.00| 0.0000| 0.027 >>>> Peak| | 1.3298| 2.670 >>>> ---------------+--------+--------+--------- >>>> RxCan1[260] Avg| 0.00| 0.0000| 0.023 >>>> Peak| | 0.1271| 0.401 >>>> ---------------+--------+--------+--------- >>>> RxCan1[270] Avg| 0.00| 0.0000| 0.022 >>>> Peak| | 0.6439| 0.898 >>>> ---------------+--------+--------+--------- >>>> RxCan1[280] Avg| 0.00| 0.0000| 0.023 >>>> Peak| | 0.6502| 1.156 >>>> ---------------+--------+--------+--------- >>>> RxCan1[2e4] Avg| 0.00| 0.0000| 0.035 >>>> Peak| | 0.3389| 0.811 >>>> ---------------+--------+--------+--------- >>>> RxCan1[2ec] Avg| 0.00| 0.0000| 0.027 >>>> Peak| | 0.1417| 0.784 >>>> ---------------+--------+--------+--------- >>>> RxCan1[2ed] Avg| 0.00| 0.0000| 0.024 >>>> Peak| | 0.1364| 0.746 >>>> ---------------+--------+--------+--------- >>>> RxCan1[2ee] Avg| 0.00| 0.0000| 0.024 >>>> Peak| | 0.1406| 0.965 >>>> ---------------+--------+--------+--------- >>>> RxCan1[312] Avg| 0.00| 0.0000| 0.023 >>>> Peak| | 0.1293| 0.978 >>>> ---------------+--------+--------+--------- >>>> RxCan1[326] Avg| 0.00| 0.0000| 0.024 >>>> Peak| | 0.1298| 0.518 >>>> ---------------+--------+--------+--------- >>>> RxCan1[336] Avg| 0.00| 0.0000| 0.028 >>>> Peak| | 0.0106| 0.329 >>>> ---------------+--------+--------+--------- >>>> RxCan1[352] Avg| 0.00| 0.0000| 0.030 >>>> Peak| | 0.1054| 0.800 >>>> ---------------+--------+--------+--------- >>>> RxCan1[355] Avg| 0.00| 0.0000| 0.027 >>>> Peak| | 0.0270| 0.546 >>>> ---------------+--------+--------+--------- >>>> RxCan1[35e] Avg| 0.00| 0.0000| 0.023 >>>> Peak| | 0.1288| 0.573 >>>> ---------------+--------+--------+--------- >>>> RxCan1[365] Avg| 0.00| 0.0000| 0.024 >>>> Peak| | 0.1297| 0.358 >>>> ---------------+--------+--------+--------- >>>> RxCan1[366] Avg| 0.00| 0.0000| 0.026 >>>> Peak| | 0.1429| 1.001 >>>> ---------------+--------+--------+--------- >>>> RxCan1[367] Avg| 0.00| 0.0000| 0.026 >>>> Peak| | 0.1472| 0.828 >>>> ---------------+--------+--------+--------- >>>> RxCan1[368] Avg| 0.00| 0.0000| 0.024 >>>> Peak| | 0.1323| 0.931 >>>> ---------------+--------+--------+--------- >>>> RxCan1[369] Avg| 0.00| 0.0000| 0.026 >>>> Peak| | 0.1498| 1.072 >>>> ---------------+--------+--------+--------- >>>> RxCan1[380] Avg| 0.00| 0.0000| 0.022 >>>> Peak| | 0.1285| 0.348 >>>> ---------------+--------+--------+--------- >>>> RxCan1[38b] Avg| 0.00| 0.0000| 0.021 >>>> Peak| | 0.3298| 1.168 >>>> ---------------+--------+--------+--------- >>>> RxCan1[3b3] Avg| 0.00| 0.0000| 0.025 >>>> Peak| | 0.1348| 0.920 >>>> ---------------+--------+--------+--------- >>>> RxCan1[400] Avg| 0.00| 0.0000| 0.022 >>>> Peak| | 0.0481| 0.445 >>>> ---------------+--------+--------+--------- >>>> RxCan1[405] Avg| 0.00| 0.0000| 0.034 >>>> Peak| | 0.0723| 0.473 >>>> ---------------+--------+--------+--------- >>>> RxCan1[40a] Avg| 0.00| 0.0000| 0.025 >>>> Peak| | 0.1040| 0.543 >>>> ---------------+--------+--------+--------- >>>> RxCan1[410] Avg| 0.00| 0.0000| 0.024 >>>> Peak| | 0.1339| 0.678 >>>> ---------------+--------+--------+--------- >>>> RxCan1[411] Avg| 0.00| 0.0000| 0.025 >>>> Peak| | 0.1376| 0.573 >>>> ---------------+--------+--------+--------- >>>> RxCan1[416] Avg| 0.00| 0.0000| 0.023 >>>> Peak| | 0.1284| 0.346 >>>> ---------------+--------+--------+--------- >>>> RxCan1[421] Avg| 0.00| 0.0000| 0.024 >>>> Peak| | 0.1323| 0.643 >>>> ---------------+--------+--------+--------- >>>> RxCan1[42d] Avg| 0.00| 0.0000| 0.023 >>>> Peak| | 0.1362| 1.146 >>>> ---------------+--------+--------+--------- >>>> RxCan1[42f] Avg| 0.00| 0.0000| 0.027 >>>> Peak| | 0.1503| 1.762 >>>> ---------------+--------+--------+--------- >>>> RxCan1[430] Avg| 0.00| 0.0000| 0.023 >>>> Peak| | 0.1352| 0.347 >>>> ---------------+--------+--------+--------- >>>> RxCan1[434] Avg| 0.00| 0.0000| 0.024 >>>> Peak| | 0.1312| 0.580 >>>> ---------------+--------+--------+--------- >>>> RxCan1[435] Avg| 0.00| 0.0000| 0.029 >>>> Peak| | 0.1109| 1.133 >>>> ---------------+--------+--------+--------- >>>> RxCan1[43e] Avg| 0.00| 0.0000| 0.023 >>>> Peak| | 0.2776| 0.686 >>>> ---------------+--------+--------+--------- >>>> RxCan1[440] Avg| 0.00| 0.0000| 0.022 >>>> Peak| | 0.0118| 0.276 >>>> ---------------+--------+--------+--------- >>>> RxCan1[465] Avg| 0.00| 0.0000| 0.022 >>>> Peak| | 0.0118| 0.279 >>>> ---------------+--------+--------+--------- >>>> RxCan1[466] Avg| 0.00| 0.0000| 0.023 >>>> Peak| | 0.0123| 0.310 >>>> ---------------+--------+--------+--------- >>>> RxCan1[467] Avg| 0.00| 0.0000| 0.025 >>>> Peak| | 0.0132| 0.314 >>>> ---------------+--------+--------+--------- >>>> RxCan1[472] Avg| 0.00| 0.0000| 0.101 >>>> Peak| | 0.0307| 1.105 >>>> ---------------+--------+--------+--------- >>>> RxCan1[473] Avg| 0.00| 0.0000| 0.051 >>>> Peak| | 0.0107| 0.575 >>>> ---------------+--------+--------+--------- >>>> RxCan1[474] Avg| 0.00| 0.0000| 0.024 >>>> Peak| | 0.0097| 0.289 >>>> ---------------+--------+--------+--------- >>>> RxCan1[475] Avg| 0.00| 0.0000| 0.023 >>>> Peak| | 0.0220| 0.327 >>>> ---------------+--------+--------+--------- >>>> RxCan1[476] Avg| 0.00| 0.0000| 0.050 >>>> Peak| | 0.0762| 5.329 >>>> ---------------+--------+--------+--------- >>>> RxCan1[477] Avg| 0.00| 0.0000| 0.032 >>>> Peak| | 0.0283| 0.669 >>>> ---------------+--------+--------+--------- >>>> RxCan1[595] Avg| 0.00| 0.0000| 0.026 >>>> Peak| | 0.0103| 0.297 >>>> ---------------+--------+--------+--------- >>>> RxCan1[59e] Avg| 0.00| 0.0000| 0.022 >>>> Peak| | 0.0114| 0.263 >>>> ---------------+--------+--------+--------- >>>> RxCan1[5a2] Avg| 0.00| 0.0000| 0.026 >>>> Peak| | 0.0119| 0.505 >>>> ---------------+--------+--------+--------- >>>> RxCan1[5ba] Avg| 0.00| 0.0000| 0.025 >>>> Peak| | 0.0139| 0.549 >>>> ---------------+--------+--------+--------- >>>> RxCan2[020] Avg| 0.00| 0.0000| 0.026 >>>> Peak| | 0.4923| 1.133 >>>> ---------------+--------+--------+--------- >>>> RxCan2[030] Avg| 0.00| 0.0000| 0.023 >>>> Peak| | 0.3297| 1.136 >>>> ---------------+--------+--------+--------- >>>> RxCan2[03a] Avg| 0.00| 0.0000| 0.022 >>>> Peak| | 0.2792| 1.275 >>>> ---------------+--------+--------+--------- >>>> RxCan2[040] Avg| 0.00| 0.0000| 0.023 >>>> Peak| | 0.2834| 1.080 >>>> ---------------+--------+--------+--------- >>>> RxCan2[060] Avg| 0.00| 0.0000| 0.029 >>>> Peak| | 0.3037| 0.991 >>>> ---------------+--------+--------+--------- >>>> RxCan2[070] Avg| 0.00| 0.0000| 0.025 >>>> Peak| | 0.2291| 0.460 >>>> ---------------+--------+--------+--------- >>>> RxCan2[080] Avg| 0.00| 0.0000| 0.043 >>>> Peak| | 0.4015| 1.007 >>>> ---------------+--------+--------+--------- >>>> RxCan2[083] Avg| 0.00| 0.0000| 0.026 >>>> Peak| | 0.2957| 0.788 >>>> ---------------+--------+--------+--------- >>>> RxCan2[090] Avg| 0.00| 0.0000| 0.027 >>>> Peak| | 0.3951| 1.231 >>>> ---------------+--------+--------+--------- >>>> RxCan2[0a0] Avg| 0.00| 0.0000| 0.026 >>>> Peak| | 0.2560| 0.722 >>>> ---------------+--------+--------+--------- >>>> RxCan2[100] Avg| 0.00| 0.0000| 0.046 >>>> Peak| | 0.4506| 21.961 >>>> ---------------+--------+--------+--------- >>>> RxCan2[108] Avg| 0.00| 0.0000| 0.024 >>>> Peak| | 0.3713| 1.125 >>>> ---------------+--------+--------+--------- >>>> RxCan2[110] Avg| 0.00| 0.0000| 0.029 >>>> Peak| | 0.2443| 0.755 >>>> ---------------+--------+--------+--------- >>>> RxCan2[130] Avg| 0.00| 0.0000| 0.023 >>>> Peak| | 0.2052| 1.097 >>>> ---------------+--------+--------+--------- >>>> RxCan2[150] Avg| 0.00| 0.0000| 0.023 >>>> Peak| | 0.2246| 0.371 >>>> ---------------+--------+--------+--------- >>>> RxCan2[160] Avg| 0.00| 0.0000| 0.024 >>>> Peak| | 0.0755| 1.125 >>>> ---------------+--------+--------+--------- >>>> RxCan2[180] Avg| 0.00| 0.0000| 0.023 >>>> Peak| | 0.2350| 0.936 >>>> ---------------+--------+--------+--------- >>>> RxCan2[190] Avg| 0.00| 0.0000| 0.022 >>>> Peak| | 0.2275| 0.592 >>>> ---------------+--------+--------+--------- >>>> RxCan2[1a0] Avg| 0.00| 0.0000| 0.025 >>>> Peak| | 0.0125| 0.273 >>>> ---------------+--------+--------+--------- >>>> RxCan2[1a4] Avg| 0.00| 0.0000| 0.022 >>>> Peak| | 0.2806| 0.632 >>>> ---------------+--------+--------+--------- >>>> RxCan2[1a8] Avg| 0.00| 0.0000| 0.022 >>>> Peak| | 0.1683| 0.740 >>>> ---------------+--------+--------+--------- >>>> RxCan2[1b0] Avg| 0.00| 0.0000| 0.023 >>>> Peak| | 0.1360| 0.490 >>>> ---------------+--------+--------+--------- >>>> RxCan2[1b4] Avg| 0.00| 0.0000| 0.027 >>>> Peak| | 0.1556| 1.119 >>>> ---------------+--------+--------+--------- >>>> RxCan2[1b8] Avg| 0.00| 0.0000| 0.022 >>>> Peak| | 0.1704| 0.616 >>>> ---------------+--------+--------+--------- >>>> RxCan2[1c0] Avg| 0.00| 0.0000| 0.023 >>>> Peak| | 0.1317| 0.488 >>>> ---------------+--------+--------+--------- >>>> RxCan2[1e0] Avg| 0.00| 0.0000| 0.025 >>>> Peak| | 0.1460| 0.675 >>>> ---------------+--------+--------+--------- >>>> RxCan2[215] Avg| 0.00| 0.0000| 0.023 >>>> Peak| | 0.1191| 0.567 >>>> ---------------+--------+--------+--------- >>>> RxCan2[217] Avg| 0.00| 0.0000| 0.023 >>>> Peak| | 0.1167| 0.869 >>>> ---------------+--------+--------+--------- >>>> RxCan2[220] Avg| 0.00| 0.0000| 0.023 >>>> Peak| | 0.0918| 0.313 >>>> ---------------+--------+--------+--------- >>>> RxCan2[225] Avg| 0.00| 0.0000| 0.025 >>>> Peak| | 0.3635| 1.018 >>>> ---------------+--------+--------+--------- >>>> RxCan2[230] Avg| 0.00| 0.0000| 0.057 >>>> Peak| | 0.2192| 1.063 >>>> ---------------+--------+--------+--------- >>>> RxCan2[240] Avg| 0.00| 0.0000| 0.023 >>>> Peak| | 0.1173| 0.760 >>>> ---------------+--------+--------+--------- >>>> RxCan2[241] Avg| 0.00| 0.0000| 0.022 >>>> Peak| | 0.2830| 1.144 >>>> ---------------+--------+--------+--------- >>>> RxCan2[250] Avg| 0.00| 0.0000| 0.026 >>>> Peak| | 0.0701| 0.698 >>>> ---------------+--------+--------+--------- >>>> RxCan2[255] Avg| 0.00| 0.0000| 0.022 >>>> Peak| | 0.1755| 1.063 >>>> ---------------+--------+--------+--------- >>>> RxCan2[265] Avg| 0.00| 0.0000| 0.024 >>>> Peak| | 0.1771| 0.729 >>>> ---------------+--------+--------+--------- >>>> RxCan2[270] Avg| 0.00| 0.0000| 0.023 >>>> Peak| | 0.0667| 0.307 >>>> ---------------+--------+--------+--------- >>>> RxCan2[290] Avg| 0.00| 0.0000| 0.022 >>>> Peak| | 0.0410| 0.280 >>>> ---------------+--------+--------+--------- >>>> RxCan2[295] Avg| 0.00| 0.0000| 0.023 >>>> Peak| | 0.0881| 0.299 >>>> ---------------+--------+--------+--------- >>>> RxCan2[2a0] Avg| 0.00| 0.0000| 0.023 >>>> Peak| | 0.0420| 0.268 >>>> ---------------+--------+--------+--------- >>>> RxCan2[2a7] Avg| 0.00| 0.0000| 0.021 >>>> Peak| | 0.1716| 0.454 >>>> ---------------+--------+--------+--------- >>>> RxCan2[2b0] Avg| 0.00| 0.0000| 0.023 >>>> Peak| | 0.0424| 0.300 >>>> ---------------+--------+--------+--------- >>>> RxCan2[2c0] Avg| 0.00| 0.0000| 0.024 >>>> Peak| | 0.0470| 0.298 >>>> ---------------+--------+--------+--------- >>>> RxCan2[2e0] Avg| 0.00| 0.0000| 0.030 >>>> Peak| | 0.0324| 1.152 >>>> ---------------+--------+--------+--------- >>>> RxCan2[2f0] Avg| 0.00| 0.0000| 0.024 >>>> Peak| | 0.0229| 0.359 >>>> ---------------+--------+--------+--------- >>>> RxCan2[2f5] Avg| 0.00| 0.0000| 0.026 >>>> Peak| | 0.1882| 0.673 >>>> ---------------+--------+--------+--------- >>>> RxCan2[300] Avg| 0.00| 0.0000| 0.022 >>>> Peak| | 0.0186| 0.263 >>>> ---------------+--------+--------+--------- >>>> RxCan2[310] Avg| 0.00| 0.0000| 0.024 >>>> Peak| | 0.0210| 0.265 >>>> ---------------+--------+--------+--------- >>>> RxCan2[320] Avg| 0.00| 0.0000| 0.025 >>>> Peak| | 0.0207| 0.354 >>>> ---------------+--------+--------+--------- >>>> RxCan2[326] Avg| 0.00| 0.0000| 0.023 >>>> Peak| | 0.1466| 0.686 >>>> ---------------+--------+--------+--------- >>>> RxCan2[330] Avg| 0.00| 0.0000| 0.022 >>>> Peak| | 0.4580| 0.708 >>>> ---------------+--------+--------+--------- >>>> RxCan2[340] Avg| 0.00| 0.0000| 0.031 >>>> Peak| | 0.1621| 0.785 >>>> ---------------+--------+--------+--------- >>>> RxCan2[345] Avg| 0.00| 0.0000| 0.021 >>>> Peak| | 0.0199| 0.261 >>>> ---------------+--------+--------+--------- >>>> RxCan2[35e] Avg| 0.00| 0.0000| 0.023 >>>> Peak| | 0.0686| 0.449 >>>> ---------------+--------+--------+--------- >>>> RxCan2[360] Avg| 0.00| 0.0000| 0.025 >>>> Peak| | 0.0204| 0.289 >>>> ---------------+--------+--------+--------- >>>> RxCan2[361] Avg| 0.00| 0.0000| 0.022 >>>> Peak| | 0.1166| 0.316 >>>> ---------------+--------+--------+--------- >>>> RxCan2[363] Avg| 0.00| 0.0000| 0.023 >>>> Peak| | 0.0146| 0.304 >>>> ---------------+--------+--------+--------- >>>> RxCan2[370] Avg| 0.00| 0.0000| 0.024 >>>> Peak| | 0.0099| 0.278 >>>> ---------------+--------+--------+--------- >>>> RxCan2[381] Avg| 0.00| 0.0000| 0.025 >>>> Peak| | 0.0468| 0.459 >>>> ---------------+--------+--------+--------- >>>> RxCan2[3a0] Avg| 0.00| 0.0000| 0.021 >>>> Peak| | 0.2339| 0.617 >>>> ---------------+--------+--------+--------- >>>> RxCan2[3d0] Avg| 0.00| 0.0000| 0.022 >>>> Peak| | 0.1351| 0.351 >>>> ---------------+--------+--------+--------- >>>> RxCan2[3d5] Avg| 0.00| 0.0000| 0.023 >>>> Peak| | 0.0796| 0.692 >>>> ---------------+--------+--------+--------- >>>> RxCan2[400] Avg| 0.00| 0.0000| 0.023 >>>> Peak| | 0.0537| 0.307 >>>> ---------------+--------+--------+--------- >>>> RxCan2[405] Avg| 0.00| 0.0000| 0.021 >>>> Peak| | 0.0513| 0.303 >>>> ---------------+--------+--------+--------- >>>> RxCan2[40a] Avg| 0.00| 0.0000| 0.022 >>>> Peak| | 0.1099| 0.313 >>>> ---------------+--------+--------+--------- >>>> RxCan2[415] Avg| 0.00| 0.0000| 0.022 >>>> Peak| | 0.0204| 0.251 >>>> ---------------+--------+--------+--------- >>>> RxCan2[435] Avg| 0.00| 0.0000| 0.028 >>>> Peak| | 0.0113| 0.342 >>>> ---------------+--------+--------+--------- >>>> RxCan2[440] Avg| 0.00| 0.0000| 0.027 >>>> Peak| | 0.0110| 0.299 >>>> ---------------+--------+--------+--------- >>>> RxCan2[465] Avg| 0.00| 0.0000| 0.023 >>>> Peak| | 0.0122| 0.295 >>>> ---------------+--------+--------+--------- >>>> RxCan2[466] Avg| 0.00| 0.0000| 0.022 >>>> Peak| | 0.0117| 0.267 >>>> ---------------+--------+--------+--------- >>>> RxCan2[467] Avg| 0.00| 0.0000| 0.022 >>>> Peak| | 0.0164| 0.325 >>>> ---------------+--------+--------+--------- >>>> RxCan2[501] Avg| 0.00| 0.0000| 0.023 >>>> Peak| | 0.0236| 0.276 >>>> ---------------+--------+--------+--------- >>>> RxCan2[503] Avg| 0.00| 0.0000| 0.023 >>>> Peak| | 0.0248| 0.349 >>>> ---------------+--------+--------+--------- >>>> RxCan2[504] Avg| 0.00| 0.0000| 0.023 >>>> Peak| | 0.0230| 0.312 >>>> ---------------+--------+--------+--------- >>>> RxCan2[505] Avg| 0.00| 0.0000| 0.025 >>>> Peak| | 0.0256| 0.310 >>>> ---------------+--------+--------+--------- >>>> RxCan2[508] Avg| 0.00| 0.0000| 0.023 >>>> Peak| | 0.0281| 0.329 >>>> ---------------+--------+--------+--------- >>>> RxCan2[511] Avg| 0.00| 0.0000| 0.022 >>>> Peak| | 0.0232| 0.282 >>>> ---------------+--------+--------+--------- >>>> RxCan2[51e] Avg| 0.00| 0.0000| 0.023 >>>> Peak| | 0.0248| 0.298 >>>> ---------------+--------+--------+--------- >>>> RxCan2[581] Avg| 0.00| 0.0000| 0.025 >>>> Peak| | 0.0166| 0.286 >>>> ===============+========+========+========= >>>> Total Avg| 0.00| 0.0000| 43.563 >>>> >>>> At the same time, calling poller times on, poller >>>> times status causes the bus to crash, although no >>>> polls are actively being sent at all. >>>> >>>> Cheers, >>>> Simon >>>> _______________________________________________ >>>> OvmsDev mailing list >>>> OvmsDev@lists.openvehicles.com >>>> http://lists.openvehicles.com/mailman/listinfo/ovmsdev >>>> >>>> >>>> _______________________________________________ >>>> OvmsDev mailing list >>>> OvmsDev@lists.openvehicles.com >>>> http://lists.openvehicles.com/mailman/listinfo/ovmsdev >>> >>> _______________________________________________ >>> OvmsDev mailing list >>> OvmsDev@lists.openvehicles.com >>> http://lists.openvehicles.com/mailman/listinfo/ovmsdev >> > > > _______________________________________________ > OvmsDev mailing list > OvmsDev@lists.openvehicles.com > http://lists.openvehicles.com/mailman/listinfo/ovmsdev
-- Michael Balzer *Am Rahmen 5 * D-58313 Herdecke <https://www.google.com/maps/search/Am+Rahmen+5+*+D-58313+Herdecke?entry=gmail&source=g> Fon 02330 9104094 * Handy 0176 20698926
_______________________________________________ OvmsDev mailing list OvmsDev@lists.openvehicles.com http://lists.openvehicles.com/mailman/listinfo/ovmsdev
_______________________________________________ OvmsDev mailing list OvmsDev@lists.openvehicles.com http://lists.openvehicles.com/mailman/listinfo/ovmsdev
_______________________________________________ OvmsDev mailing list OvmsDev@lists.openvehicles.com http://lists.openvehicles.com/mailman/listinfo/ovmsdev
-- Michael Balzer * Am Rahmen 5 * D-58313 Herdecke Fon 02330 9104094 * Handy 0176 20698926
_______________________________________________ OvmsDev mailing list OvmsDev@lists.openvehicles.com http://lists.openvehicles.com/mailman/listinfo/ovmsdev
_______________________________________________ OvmsDev mailing list OvmsDev@lists.openvehicles.com http://lists.openvehicles.com/mailman/listinfo/ovmsdev
-- Michael Balzer * Am Rahmen 5 * D-58313 Herdecke Fon 02330 9104094 * Handy 0176 20698926
Yep, pretty much Inline below. Also I wonder if something is causing the module to sleep or reboot and the wakeup is sending that bus wakeup Frame Michael B was talking about. //.ichael On Fri, 17 Jan 2025, 18:09 Michael Balzer via OvmsDev, < ovmsdev@lists.openvehicles.com> wrote:
Simon,
AFAIK "Pollers[Send]" is the regular "next round" request for the polling task, not a frame transmission.
Yep exactly.
A TX attempt in listen mode would produce a warn level log entry "Cannot write <busname> when not in ACTIVE mode" for tag "esp32can" or "mcp2515".
With the old poller, you wouldn't have had any indication of a queue overflow, so the new poller may help you to identify an issue in your code.
You need to understand the new poller not only does polls, it's now the main CAN receiver for the vehicle module. That's why your poller time stats include all process data frames as well, not only protocol frames.
The overflow means either your CAN processing is too slow to keep up with the packets received, or some other task is hogging the CPU. That would need to be a task with an equal or higher priority as the vehicle task, which has priority level 10 -- only system & networking tasks are above, so that's not likely. (You can check the CPU usage with the "module tasks" command.)
I wonder whether some kind of filter before queueing the Frame might work. It would have to be quick and simple as it would be executing in the CAN task I think.
That means you should check your standard frame processing (`IncomingFrameCanX` callbacks) for potential delays and processing complexity issues.
The poller statistics can help you track this down, but you need to have at least 10 seconds of statistics, the more the better. Rule of thumb: PRI average at 0.0/second means you don't have enough data yet. (-- //.ichael, correct me if I'm wrong)
It's either that or we are rounding badly. I can check.
At the same time, calling poller times on, poller times status causes the bus to crash
In any case that still doesn't explain how the poller could possibly cause a CAN bus (!) crash without actually doing any transmissions.
How does the CAN bus crash manifest?
Regards, Michael
Am 15.01.25 um 19:54 schrieb Simon Ehlen via OvmsDev:
I put the two buses back into listen mode and drove a short distance and charged the car. As I said, there is no active polling in my code. As expected, there is therefore no indication of a failed TX attempt in the console log. I only continue to see a lot of RX Task Queue Overflow messages in the log, which I did not have before. I also see a Pollers[Send]: Task Queue Overflow entry, but since I don't see any indication of “cannot write” on that, I'm not assuming that's a “real” send.
I (19760210) vehicle-poll: Poller[Frame]: RX Task Queue Overflow Run 5 I (19764420) vehicle-poll: Poller[Frame]: RX Task Queue Overflow Run 1 I (19764420) vehicle-poll: Poller[Frame]: RX Task Queue Overflow Run 3 I (19764420) vehicle-poll: Poller[Frame]: RX Task Queue Overflow Run 1 I (19764740) vehicle-poll: Poller[Frame]: RX Task Queue Overflow Run 1 I (19764740) vehicle-poll: Poller[Frame]: RX Task Queue Overflow Run 1 I (19764740) vehicle-poll: Poller[Frame]: RX Task Queue Overflow Run 1 I (19764740) vehicle-poll: Poller[Frame]: RX Task Queue Overflow Run 1 I (19764740) vehicle-poll: Poller[Frame]: RX Task Queue Overflow Run 1 I (19764750) vehicle-poll: Poller[Frame]: RX Task Queue Overflow Run 2 I (19764750) vehicle-poll: Poller[Frame]: RX Task Queue Overflow Run 1 I (19764750) vehicle-poll: Poller[Frame]: RX Task Queue Overflow Run 2 I (19764870) vehicle-poll: Poller[Frame]: RX Task Queue Overflow Run 1 I (19764870) vehicle-poll: Poller[Frame]: RX Task Queue Overflow Run 2 I (19765270) vehicle-poll: Poller[Frame]: RX Task Queue Overflow Run 4 I (19765270) vehicle-poll: Poller[Frame]: RX Task Queue Overflow Run 6 I (19765610) vehicle-poll: Poller[Frame]: RX Task Queue Overflow Run 3 I (19765930) vehicle-poll: Poller[Frame]: RX Task Queue Overflow Run 1 I (19765930) vehicle-poll: Poller[Frame]: RX Task Queue Overflow Run 3 I (19765930) vehicle-poll: Poller[Frame]: RX Task Queue Overflow Run 1 I (19766260) vehicle-poll: Poller[Frame]: RX Task Queue Overflow Run 50 I (19766260) vehicle-poll: Poller[Frame]: RX Task Queue Overflow Run 48 I (19766260) vehicle-poll: Poller[Frame]: RX Task Queue Overflow Run 27 I (19766270) vehicle-poll: Poller[Frame]: RX Task Queue Overflow Run 6 I (19766270) vehicle-poll: Poller[Frame]: RX Task Queue Overflow Run 4 E (19766280) can: can2: intr=4754831 rxpkt=4757493 txpkt=0 errflags=0x22401c02 rxerr=0 txerr=0 rxinval=0 rxovr=0 txovr=0 txdelay=0 txfail=0 wdgreset=1 errreset=0 E (19766300) can: can2: intr=4754831 rxpkt=4757494 txpkt=0 errflags=0x23401c01 rxerr=0 txerr=0 rxinval=0 rxovr=0 txovr=0 txdelay=0 txfail=0 wdgreset=1 errreset=0 I (19766300) vehicle-poll: Poller[Frame]: RX Task Queue Overflow Run 7 I (19766340) vehicle-poll: Poller[Frame]: RX Task Queue Overflow Run 39 I (19766350) vehicle-poll: Poller[Frame]: RX Task Queue Overflow Run 32 I (19766350) vehicle-poll: Poller[Frame]: RX Task Queue Overflow Run 17 I (19766350) vehicle-poll: Poller[Frame]: RX Task Queue Overflow Run 3 I (19766350) vehicle-poll: Pollers[Send]: Task Queue Overflow I (19766350) vehicle-poll: Poller[Frame]: RX Task Queue Overflow Run 1 I (19766350) vehicle-poll: Poller[Frame]: RX Task Queue Overflow Run 1 E (19766360) can: can2: intr=4754840 rxpkt=4757509 txpkt=0 errflags=0x22401c02 rxerr=0 txerr=0 rxinval=0 rxovr=0 txovr=0 txdelay=0 txfail=0 wdgreset=1 errreset=0 I (19766370) vehicle-poll: Poller[Frame]: RX Task Queue Overflow Run 4 E (19766370) can: can2: intr=4754840 rxpkt=4757510 txpkt=0 errflags=0x23401c01 rxerr=0 txerr=0 rxinval=0 rxovr=0 txovr=0 txdelay=0 txfail=0 wdgreset=1 errreset=0 I (19766430) vehicle-poll: Poller[Frame]: RX Task Queue Overflow Run 30 I (19766430) vehicle-poll: Poller[Frame]: RX Task Queue Overflow Run 36 I (19766430) vehicle-poll: Poller[Frame]: RX Task Queue Overflow Run 26 I (19766430) vehicle-poll: Poller[Frame]: RX Task Queue Overflow Run 4 I (19766430) vehicle-poll: Poller[Frame]: RX Task Queue Overflow Run 3 I (19766430) vehicle-poll: Poller[Frame]: RX Task Queue Overflow Run 2 I (19766430) vehicle-poll: Poller[Frame]: RX Task Queue Overflow Run 1 E (19766450) can: can2: intr=4754855 rxpkt=4757535 txpkt=0 errflags=0x23001001 rxerr=0 txerr=0 rxinval=0 rxovr=0 txovr=0 txdelay=0 txfail=0 wdgreset=1 errreset=0 E (19766460) can: can2: intr=4754855 rxpkt=4757536 txpkt=0 errflags=0x23401c01 rxerr=0 txerr=0 rxinval=0 rxovr=0 txovr=0 txdelay=0 txfail=0 wdgreset=1 errreset=0 E (19766520) can: can2: intr=4754855 rxpkt=4757539 txpkt=0 errflags=0x22001002 rxerr=0 txerr=0 rxinval=0 rxovr=0 txovr=0 txdelay=0 txfail=0 wdgreset=1 errreset=0 I (19766520) vehicle-poll: Poller[Frame]: RX Task Queue Overflow Run 9 I (19766520) vehicle-poll: Poller[Frame]: RX Task Queue Overflow Run 37 I (19766520) vehicle-poll: Poller[Frame]: RX Task Queue Overflow Run 30 I (19766520) vehicle-poll: Poller[Frame]: RX Task Queue Overflow Run 6 I (19766520) vehicle-poll: Poller[Frame]: RX Task Queue Overflow Run 2 I (19766520) vehicle-poll: Poller[Frame]: RX Task Queue Overflow Run 1 I (19766520) vehicle-poll: Poller[Frame]: RX Task Queue Overflow Run 1 I (19766520) vehicle-poll: Poller[Frame]: RX Task Queue Overflow Run 3 I (19766530) vehicle-poll: Poller[Frame]: RX Task Queue Overflow Run 1 I (19766530) vehicle-poll: Poller[Frame]: RX Task Queue Overflow Run 1 I (19766530) vehicle-poll: Poller[Frame]: RX Task Queue Overflow Run 1 E (19766540) can: can2: intr=4754861 rxpkt=4757548 txpkt=0 errflags=0x23401c01 rxerr=0 txerr=0 rxinval=0 rxovr=0 txovr=0 txdelay=0 txfail=0 wdgreset=1 errreset=0 I (19766550) vehicle-poll: Poller[Frame]: RX Task Queue Overflow Run 3 E (19766560) can: can2: intr=4754861 rxpkt=4757552 txpkt=0 errflags=0x23001001 rxerr=0 txerr=0 rxinval=0 rxovr=0 txovr=0 txdelay=0 txfail=0 wdgreset=1 errreset=0 E (19766610) can: can2: intr=4754861 rxpkt=4757553 txpkt=0 errflags=0x23401c01 rxerr=0 txerr=0 rxinval=0 rxovr=0 txovr=0 txdelay=0 txfail=0 wdgreset=1 errreset=0 I (19766610) vehicle-poll: Poller[Frame]: RX Task Queue Overflow Run 4 I (19766610) vehicle-poll: Poller[Frame]: RX Task Queue Overflow Run 5 I (19766610) vehicle-poll: Poller[Frame]: RX Task Queue Overflow Run 33 I (19766610) vehicle-poll: Poller[Frame]: RX Task Queue Overflow Run 34 I (19766610) vehicle-poll: Poller[Frame]: RX Task Queue Overflow Run 12 W (19767070) websocket: WebSocketHandler[0x3f8d79d8]: job queue overflow detected W (19767140) websocket: WebSocketHandler[0x3f8d79d8]: job queue overflow detected W (19767180) websocket: WebSocketHandler[0x3f8d79d8]: job queue overflow resolved, 1 drops W (19767260) websocket: WebSocketHandler[0x3f8d79d8]: job queue overflow detected W (19767310) websocket: WebSocketHandler[0x3f8d79d8]: job queue overflow resolved, 1 drops
Cheers Simon
Am 15.01.2025 um 19:18 schrieb Derek Caudwell via OvmsDev:
Since the following email I have high confidence the issue on the Leaf is related/caused by the poller as there has been no further occurrence and Chris has also experienced the car going to neutral on the new poller firmware.
.... I haven't ruled out it being a fault with my car yet. Shortly after it faulted the car was run into so has been off the road for sometime, my first step was to replace 12V battery. The ovms unit is now unplugged and if it does not fault over the next month while driving I'll be reasonably confident it's ovms related.
Not sure which firmware version the poller updates were included in but it was only after upgrading to it that the errors occurred (which could be coincidental however it has faulted twice more both on version 3.3.004-141-gf729d82c). For periods where I reverted to 3.3.003 it was fine.
It might be useful to have an extra option on the enable can write to only enable it when the car is parked/charging.
On Wed, 15 Jan 2025, 11:11 pm Michael Balzer via OvmsDev, < ovmsdev@lists.openvehicles.com> wrote:
Derek, can you comment on this? Do you still have the issue mentioned?
Speaking of the Leaf, the code there actually does something fishy in `CommandWakeup()`:
unsigned char data = 0; … m_can1->WriteStandard(0x5C0, *8*, &data); //Wakes up the VCM (by spoofing empty battery request heating)
And there are CAN transmissions from command execution in the Leaf code, so to be sure there is no TX, listen mode is needed there as well.
Regarding CAN trace, you can try with the monitor channel and use the USB console to record the log output. That way you should be able to at least rule out there are regular transmissions -- assuming not every TX will cause an immediate crash.
Another / probably better option: when in listen mode, the log will also tell you about TX attempts, as the driver will issue a warning on each.
The CAN monitor log may also tell you about bus errors detected.
Regards, Michael
Am 15.01.25 um 10:44 schrieb Simon Ehlen via OvmsDev:
There is at least one more Leaf from Derek that has also ended up in limp mode since the new poller. There, too, no polling was actually carried out while driving. I'm not familiar with the framework at all, but does this perhaps offer you enough of an approach to recognize a commonality?
Unfortunately I do not have a tool to create a CAN trace. I can't use the OVMS for this, as it no longer responds after a bus crash until I have disconnected it from the OBD and plugged it back in.
Cheers, Simon
Am 15.01.2025 um 10:18 schrieb Michael Balzer via OvmsDev:
The frame acknowledging is done automatically by the CAN transceiver when in active mode, this is part of the CAN protocol to indicate bit errors to the sender.
So normally a failure of the system to process received frames fast enough cannot cause any issue on the bus. But the ESP32 has a range of known hardware issues, especially in the embedded CAN transceiver, I wouldn't be surprised if there are more, or if our driver lacks some workaround for these.
Maybe the new poller has some bug that causes false transmissions from process data frames received. But many vehicles send process data frames, and we've had no issue reports like this on any of them, and ECUs also normally simply ignore out of sequence protocol frames.
You could record a CAN trace to see if there are transmissions, and what kind. If you don't poll and don't send frames from your code, there should be none. If the bus still crashes, that would be an indicator for something going wrong in the transceiver.
Regards, Michael
Am 15.01.25 um 07:15 schrieb Simon Ehlen via OvmsDev:
Thanks Mark for the explanation. So does this mean that OVMS tries to acknowledge all incoming messages in active mode? This seems to me to clearly exceed the capacity of OVMS with the mass of incoming messages.
In fact, I am currently opening the bus in active mode, as I was hoping to get my code to revive the BMS in OVMS to work. However, unlike the other data, I only get the cell voltages when I actively poll them. To be on the safe side, I will now open the bus in read mode again.
However, I am still wondering what in the poller change has altered the OVMS in such a way that the bus is now crashing completely. Currently I have undone the changes since february 2024, this only concerns code from the public repository, there was no change from me in that period. Now the OVMS is running stable again and there are neither queue overflows nor bus crashes.
I had also previously increased the following queue sizes, but unfortunately this was not successful: CONFIG_OVMS_HW_EVENT_QUEUE_SIZE=120 CONFIG_OVMS_HW_CAN_RX_QUEUE_SIZE=80 CONFIG_OVMS_VEHICLE_CAN_RX_QUEUE_SIZE=80
Cheers, Simon
Am 15.01.2025 um 02:08 schrieb Mark Webb-Johnson:
Note sure if this helps, but some comments:
- Remember than CAN protocol in normal mode is an ‘active’ protocol. Nodes on the bus are actively acknowledging messages (and that includes OVMS), even if they never write messages. So in normal mode there is no absolute ‘read access’. For example, opening the CAN port at the wrong baud rate, even if not writing messages, will mess up the bus.
- However, if you open the CAN port in ‘listen’ mode, then it is truly read-only. In that mode it will not acknowledge messages, and cannot write on the bus at all. I’ve never seen an OVMS mess up a bus in listen mode, even if the baud rate is wrong. I think the only way for that to happen would be a hardware layer issue (cabling, termination, etc).
Regards, Mark.
On 15 Jan 2025, at 6:30 AM, Simon Ehlen via OvmsDev <ovmsdev@lists.openvehicles.com> <ovmsdev@lists.openvehicles.com> wrote:
But what is the reason that a read access to the bus can cause the bus to crash? This is not critical during charging, it just aborts the charging process with an error. While driving, this results in a “stop safely now” error message on the dashboard and the engine is switched off immediately.
Cheers, Simon
Am 14.01.2025 um 23:22 schrieb Michael Geddes via OvmsDev:
You may need to increase the queue size for the poll task queue.
The poller still handles the bus to vehicle notifications even if it is off.
Any poller logging on such an intensive load of can messages is likely to be a problem. This is part of the reason it is flagged off.
The total % looks wrong :/
//.ichael
On Wed, 15 Jan 2025, 03:17 Simon Ehlen via OvmsDev, < ovmsdev@lists.openvehicles.com> wrote:
Hi,
I finally got around to merging my code with the current master (previous merge february 2024). I have rebuilt my code for a Ford Focus Electric so that it uses the new OvmsPoller class.
However, I now see a lot of entries like this in my log:
I (246448) vehicle-poll: Poller[Frame]: RX Task Queue Overflow Run 8 I (246448) vehicle-poll: Poller[Frame]: RX Task Queue Overflow Run 3 I (246448) vehicle-poll: Poller[Frame]: RX Task Queue Overflow Run 1 I (246448) vehicle-poll: Poller[Frame]: RX Task Queue Overflow Run 2 I (246448) vehicle-poll: Poller[Frame]: RX Task Queue Overflow Run 1 I (246448) vehicle-poll: Poller[Frame]: RX Task Queue Overflow Run 2 I (246448) vehicle-poll: Poller[Frame]: RX Task Queue Overflow Run 1 I (246448) vehicle-poll: Poller[Frame]: RX Task Queue Overflow Run 1 I (254448) vehicle-poll: Poller[Frame]: RX Task Queue Overflow Run 24 I (254448) vehicle-poll: Poller[Frame]: RX Task Queue Overflow Run 1 I (254448) vehicle-poll: Poller[Frame]: RX Task Queue Overflow Run 1 I (254448) vehicle-poll: Poller[Frame]: RX Task Queue Overflow Run 1 I (254448) vehicle-poll: Poller[Frame]: RX Task Queue Overflow Run 1 I (254448) vehicle-poll: Poller[Frame]: RX Task Queue Overflow Run 1 I (254448) vehicle-poll: Poller[Frame]: RX Task Queue Overflow Run 1
Was this message just hidden before or do I need to make further adjustments to my code?
My code currently does not use active polling but reads on the busses (IncomingFrameCanX) on certain modules.
When I look at poller times status, it looks very extensive to me...
OVMS# poller times status Poller timing is: on Type | count | Utlztn | Time | per s | [%] | [ms] ---------------+--------+--------+--------- Poll:PRI Avg| 0.00| 0.0000| 0.003 Peak| | 0.0014| 0.041 ---------------+--------+--------+--------- RxCan1[010] Avg| 0.00| 0.0000| 0.020 Peak| | 1.2217| 1.089 ---------------+--------+--------+--------- RxCan1[030] Avg| 0.00| 0.0000| 0.024 Peak| | 1.2193| 1.241 ---------------+--------+--------+--------- RxCan1[041] Avg| 0.00| 0.0000| 0.023 Peak| | 0.6460| 1.508 ---------------+--------+--------+--------- RxCan1[049] Avg| 0.00| 0.0000| 0.024 Peak| | 0.6320| 0.630 ---------------+--------+--------+--------- RxCan1[04c] Avg| 0.00| 0.0000| 0.023 Peak| | 0.6430| 1.474 ---------------+--------+--------+--------- RxCan1[04d] Avg| 0.00| 0.0000| 0.022 Peak| | 1.2987| 1.359 ---------------+--------+--------+--------- RxCan1[076] Avg| 0.00| 0.0000| 0.072 Peak| | 0.7818| 15.221 ---------------+--------+--------+--------- RxCan1[077] Avg| 0.00| 0.0000| 0.022 Peak| | 0.6274| 0.955 ---------------+--------+--------+--------- RxCan1[07a] Avg| 0.00| 0.0000| 0.039 Peak| | 1.7602| 1.684 ---------------+--------+--------+--------- RxCan1[07d] Avg| 0.00| 0.0000| 0.023 Peak| | 0.6621| 1.913 ---------------+--------+--------+--------- RxCan1[0c8] Avg| 0.00| 0.0000| 0.026 Peak| | 0.6292| 1.412 ---------------+--------+--------+--------- RxCan1[11a] Avg| 0.00| 0.0000| 0.023 Peak| | 1.2635| 1.508 ---------------+--------+--------+--------- RxCan1[130] Avg| 0.00| 0.0000| 0.024 Peak| | 0.6548| 0.703 ---------------+--------+--------+--------- RxCan1[139] Avg| 0.00| 0.0000| 0.021 Peak| | 0.6002| 0.984 ---------------+--------+--------+--------- RxCan1[156] Avg| 0.00| 0.0000| 0.024 Peak| | 0.1225| 0.479 ---------------+--------+--------+--------- RxCan1[160] Avg| 0.00| 0.0000| 0.028 Peak| | 0.6586| 1.376 ---------------+--------+--------+--------- RxCan1[165] Avg| 0.00| 0.0000| 0.027 Peak| | 0.6368| 1.132 ---------------+--------+--------+--------- RxCan1[167] Avg| 0.00| 0.0000| 0.024 Peak| | 1.3009| 1.067 ---------------+--------+--------+--------- RxCan1[171] Avg| 0.00| 0.0000| 0.022 Peak| | 0.6590| 4.320 ---------------+--------+--------+--------- RxCan1[178] Avg| 0.00| 0.0000| 0.023 Peak| | 0.1161| 0.311 ---------------+--------+--------+--------- RxCan1[179] Avg| 0.00| 0.0000| 0.024 Peak| | 0.1236| 0.536 ---------------+--------+--------+--------- RxCan1[180] Avg| 0.00| 0.0000| 0.022 Peak| | 0.6472| 1.193 ---------------+--------+--------+--------- RxCan1[185] Avg| 0.00| 0.0000| 0.022 Peak| | 0.6777| 1.385 ---------------+--------+--------+--------- RxCan1[1a0] Avg| 0.00| 0.0000| 0.022 Peak| | 0.6486| 2.276 ---------------+--------+--------+--------- RxCan1[1e0] Avg| 0.00| 0.0000| 0.023 Peak| | 0.6725| 1.376 ---------------+--------+--------+--------- RxCan1[1e4] Avg| 0.00| 0.0000| 0.027 Peak| | 0.7370| 1.266 ---------------+--------+--------+--------- RxCan1[1f0] Avg| 0.00| 0.0000| 0.024 Peak| | 0.4253| 0.753 ---------------+--------+--------+--------- RxCan1[200] Avg| 0.00| 0.0000| 0.025 Peak| | 0.6262| 0.791 ---------------+--------+--------+--------- RxCan1[202] Avg| 0.00| 0.0000| 0.021 Peak| | 1.2915| 1.257 ---------------+--------+--------+--------- RxCan1[204] Avg| 0.00| 0.0000| 0.022 Peak| | 1.2620| 1.010 ---------------+--------+--------+--------- RxCan1[213] Avg| 0.00| 0.0000| 0.022 Peak| | 0.6331| 1.185 ---------------+--------+--------+--------- RxCan1[214] Avg| 0.00| 0.0000| 0.023 Peak| | 0.9977| 34.527 ---------------+--------+--------+--------- RxCan1[217] Avg| 0.00| 0.0000| 0.024 Peak| | 1.2825| 1.328 ---------------+--------+--------+--------- RxCan1[218] Avg| 0.00| 0.0000| 0.022 Peak| | 0.6328| 1.110 ---------------+--------+--------+--------- RxCan1[230] Avg| 0.00| 0.0000| 0.019 Peak| | 0.6742| 5.119 ---------------+--------+--------+--------- RxCan1[240] Avg| 0.00| 0.0000| 0.022 Peak| | 0.1163| 0.343 ---------------+--------+--------+--------- RxCan1[242] Avg| 0.00| 0.0000| 0.025 Peak| | 0.3501| 1.015 ---------------+--------+--------+--------- RxCan1[24a] Avg| 0.00| 0.0000| 0.022 Peak| | 0.1212| 0.338 ---------------+--------+--------+--------- RxCan1[24b] Avg| 0.00| 0.0000| 0.023 Peak| | 0.1289| 0.330 ---------------+--------+--------+--------- RxCan1[24c] Avg| 0.00| 0.0000| 0.033 Peak| | 0.1714| 1.189 ---------------+--------+--------+--------- RxCan1[25a] Avg| 0.00| 0.0000| 0.024 Peak| | 0.1289| 0.510 ---------------+--------+--------+--------- RxCan1[25b] Avg| 0.00| 0.0000| 0.022 Peak| | 0.6685| 0.930 ---------------+--------+--------+--------- RxCan1[25c] Avg| 0.00| 0.0000| 0.027 Peak| | 1.3298| 2.670 ---------------+--------+--------+--------- RxCan1[260] Avg| 0.00| 0.0000| 0.023 Peak| | 0.1271| 0.401 ---------------+--------+--------+--------- RxCan1[270] Avg| 0.00| 0.0000| 0.022 Peak| | 0.6439| 0.898 ---------------+--------+--------+--------- RxCan1[280] Avg| 0.00| 0.0000| 0.023 Peak| | 0.6502| 1.156 ---------------+--------+--------+--------- RxCan1[2e4] Avg| 0.00| 0.0000| 0.035 Peak| | 0.3389| 0.811 ---------------+--------+--------+--------- RxCan1[2ec] Avg| 0.00| 0.0000| 0.027 Peak| | 0.1417| 0.784 ---------------+--------+--------+--------- RxCan1[2ed] Avg| 0.00| 0.0000| 0.024 Peak| | 0.1364| 0.746 ---------------+--------+--------+--------- RxCan1[2ee] Avg| 0.00| 0.0000| 0.024 Peak| | 0.1406| 0.965 ---------------+--------+--------+--------- RxCan1[312] Avg| 0.00| 0.0000| 0.023 Peak| | 0.1293| 0.978 ---------------+--------+--------+--------- RxCan1[326] Avg| 0.00| 0.0000| 0.024 Peak| | 0.1298| 0.518 ---------------+--------+--------+--------- RxCan1[336] Avg| 0.00| 0.0000| 0.028 Peak| | 0.0106| 0.329 ---------------+--------+--------+--------- RxCan1[352] Avg| 0.00| 0.0000| 0.030 Peak| | 0.1054| 0.800 ---------------+--------+--------+--------- RxCan1[355] Avg| 0.00| 0.0000| 0.027 Peak| | 0.0270| 0.546 ---------------+--------+--------+--------- RxCan1[35e] Avg| 0.00| 0.0000| 0.023 Peak| | 0.1288| 0.573 ---------------+--------+--------+--------- RxCan1[365] Avg| 0.00| 0.0000| 0.024 Peak| | 0.1297| 0.358 ---------------+--------+--------+--------- RxCan1[366] Avg| 0.00| 0.0000| 0.026 Peak| | 0.1429| 1.001 ---------------+--------+--------+--------- RxCan1[367] Avg| 0.00| 0.0000| 0.026 Peak| | 0.1472| 0.828 ---------------+--------+--------+--------- RxCan1[368] Avg| 0.00| 0.0000| 0.024 Peak| | 0.1323| 0.931 ---------------+--------+--------+--------- RxCan1[369] Avg| 0.00| 0.0000| 0.026 Peak| | 0.1498| 1.072 ---------------+--------+--------+--------- RxCan1[380] Avg| 0.00| 0.0000| 0.022 Peak| | 0.1285| 0.348 ---------------+--------+--------+--------- RxCan1[38b] Avg| 0.00| 0.0000| 0.021 Peak| | 0.3298| 1.168 ---------------+--------+--------+--------- RxCan1[3b3] Avg| 0.00| 0.0000| 0.025 Peak| | 0.1348| 0.920 ---------------+--------+--------+--------- RxCan1[400] Avg| 0.00| 0.0000| 0.022 Peak| | 0.0481| 0.445 ---------------+--------+--------+--------- RxCan1[405] Avg| 0.00| 0.0000| 0.034 Peak| | 0.0723| 0.473 ---------------+--------+--------+--------- RxCan1[40a] Avg| 0.00| 0.0000| 0.025 Peak| | 0.1040| 0.543 ---------------+--------+--------+--------- RxCan1[410] Avg| 0.00| 0.0000| 0.024 Peak| | 0.1339| 0.678 ---------------+--------+--------+--------- RxCan1[411] Avg| 0.00| 0.0000| 0.025 Peak| | 0.1376| 0.573 ---------------+--------+--------+--------- RxCan1[416] Avg| 0.00| 0.0000| 0.023 Peak| | 0.1284| 0.346 ---------------+--------+--------+--------- RxCan1[421] Avg| 0.00| 0.0000| 0.024 Peak| | 0.1323| 0.643 ---------------+--------+--------+--------- RxCan1[42d] Avg| 0.00| 0.0000| 0.023 Peak| | 0.1362| 1.146 ---------------+--------+--------+--------- RxCan1[42f] Avg| 0.00| 0.0000| 0.027 Peak| | 0.1503| 1.762 ---------------+--------+--------+--------- RxCan1[430] Avg| 0.00| 0.0000| 0.023 Peak| | 0.1352| 0.347 ---------------+--------+--------+--------- RxCan1[434] Avg| 0.00| 0.0000| 0.024 Peak| | 0.1312| 0.580 ---------------+--------+--------+--------- RxCan1[435] Avg| 0.00| 0.0000| 0.029 Peak| | 0.1109| 1.133 ---------------+--------+--------+--------- RxCan1[43e] Avg| 0.00| 0.0000| 0.023 Peak| | 0.2776| 0.686 ---------------+--------+--------+--------- RxCan1[440] Avg| 0.00| 0.0000| 0.022 Peak| | 0.0118| 0.276 ---------------+--------+--------+--------- RxCan1[465] Avg| 0.00| 0.0000| 0.022 Peak| | 0.0118| 0.279 ---------------+--------+--------+--------- RxCan1[466] Avg| 0.00| 0.0000| 0.023 Peak| | 0.0123| 0.310 ---------------+--------+--------+--------- RxCan1[467] Avg| 0.00| 0.0000| 0.025 Peak| | 0.0132| 0.314 ---------------+--------+--------+--------- RxCan1[472] Avg| 0.00| 0.0000| 0.101 Peak| | 0.0307| 1.105 ---------------+--------+--------+--------- RxCan1[473] Avg| 0.00| 0.0000| 0.051 Peak| | 0.0107| 0.575 ---------------+--------+--------+--------- RxCan1[474] Avg| 0.00| 0.0000| 0.024 Peak| | 0.0097| 0.289 ---------------+--------+--------+--------- RxCan1[475] Avg| 0.00| 0.0000| 0.023 Peak| | 0.0220| 0.327 ---------------+--------+--------+--------- RxCan1[476] Avg| 0.00| 0.0000| 0.050 Peak| | 0.0762| 5.329 ---------------+--------+--------+--------- RxCan1[477] Avg| 0.00| 0.0000| 0.032 Peak| | 0.0283| 0.669 ---------------+--------+--------+--------- RxCan1[595] Avg| 0.00| 0.0000| 0.026 Peak| | 0.0103| 0.297 ---------------+--------+--------+--------- RxCan1[59e] Avg| 0.00| 0.0000| 0.022 Peak| | 0.0114| 0.263 ---------------+--------+--------+--------- RxCan1[5a2] Avg| 0.00| 0.0000| 0.026 Peak| | 0.0119| 0.505 ---------------+--------+--------+--------- RxCan1[5ba] Avg| 0.00| 0.0000| 0.025 Peak| | 0.0139| 0.549 ---------------+--------+--------+--------- RxCan2[020] Avg| 0.00| 0.0000| 0.026 Peak| | 0.4923| 1.133 ---------------+--------+--------+--------- RxCan2[030] Avg| 0.00| 0.0000| 0.023 Peak| | 0.3297| 1.136 ---------------+--------+--------+--------- RxCan2[03a] Avg| 0.00| 0.0000| 0.022 Peak| | 0.2792| 1.275 ---------------+--------+--------+--------- RxCan2[040] Avg| 0.00| 0.0000| 0.023 Peak| | 0.2834| 1.080 ---------------+--------+--------+--------- RxCan2[060] Avg| 0.00| 0.0000| 0.029 Peak| | 0.3037| 0.991 ---------------+--------+--------+--------- RxCan2[070] Avg| 0.00| 0.0000| 0.025 Peak| | 0.2291| 0.460 ---------------+--------+--------+--------- RxCan2[080] Avg| 0.00| 0.0000| 0.043 Peak| | 0.4015| 1.007 ---------------+--------+--------+--------- RxCan2[083] Avg| 0.00| 0.0000| 0.026 Peak| | 0.2957| 0.788 ---------------+--------+--------+--------- RxCan2[090] Avg| 0.00| 0.0000| 0.027 Peak| | 0.3951| 1.231 ---------------+--------+--------+--------- RxCan2[0a0] Avg| 0.00| 0.0000| 0.026 Peak| | 0.2560| 0.722 ---------------+--------+--------+--------- RxCan2[100] Avg| 0.00| 0.0000| 0.046 Peak| | 0.4506| 21.961 ---------------+--------+--------+--------- RxCan2[108] Avg| 0.00| 0.0000| 0.024 Peak| | 0.3713| 1.125 ---------------+--------+--------+--------- RxCan2[110] Avg| 0.00| 0.0000| 0.029 Peak| | 0.2443| 0.755 ---------------+--------+--------+--------- RxCan2[130] Avg| 0.00| 0.0000| 0.023 Peak| | 0.2052| 1.097 ---------------+--------+--------+--------- RxCan2[150] Avg| 0.00| 0.0000| 0.023 Peak| | 0.2246| 0.371 ---------------+--------+--------+--------- RxCan2[160] Avg| 0.00| 0.0000| 0.024 Peak| | 0.0755| 1.125 ---------------+--------+--------+--------- RxCan2[180] Avg| 0.00| 0.0000| 0.023 Peak| | 0.2350| 0.936 ---------------+--------+--------+--------- RxCan2[190] Avg| 0.00| 0.0000| 0.022 Peak| | 0.2275| 0.592 ---------------+--------+--------+--------- RxCan2[1a0] Avg| 0.00| 0.0000| 0.025 Peak| | 0.0125| 0.273 ---------------+--------+--------+--------- RxCan2[1a4] Avg| 0.00| 0.0000| 0.022 Peak| | 0.2806| 0.632 ---------------+--------+--------+--------- RxCan2[1a8] Avg| 0.00| 0.0000| 0.022 Peak| | 0.1683| 0.740 ---------------+--------+--------+--------- RxCan2[1b0] Avg| 0.00| 0.0000| 0.023 Peak| | 0.1360| 0.490 ---------------+--------+--------+--------- RxCan2[1b4] Avg| 0.00| 0.0000| 0.027 Peak| | 0.1556| 1.119 ---------------+--------+--------+--------- RxCan2[1b8] Avg| 0.00| 0.0000| 0.022 Peak| | 0.1704| 0.616 ---------------+--------+--------+--------- RxCan2[1c0] Avg| 0.00| 0.0000| 0.023 Peak| | 0.1317| 0.488 ---------------+--------+--------+--------- RxCan2[1e0] Avg| 0.00| 0.0000| 0.025 Peak| | 0.1460| 0.675 ---------------+--------+--------+--------- RxCan2[215] Avg| 0.00| 0.0000| 0.023 Peak| | 0.1191| 0.567 ---------------+--------+--------+--------- RxCan2[217] Avg| 0.00| 0.0000| 0.023 Peak| | 0.1167| 0.869 ---------------+--------+--------+--------- RxCan2[220] Avg| 0.00| 0.0000| 0.023 Peak| | 0.0918| 0.313 ---------------+--------+--------+--------- RxCan2[225] Avg| 0.00| 0.0000| 0.025 Peak| | 0.3635| 1.018 ---------------+--------+--------+--------- RxCan2[230] Avg| 0.00| 0.0000| 0.057 Peak| | 0.2192| 1.063 ---------------+--------+--------+--------- RxCan2[240] Avg| 0.00| 0.0000| 0.023 Peak| | 0.1173| 0.760 ---------------+--------+--------+--------- RxCan2[241] Avg| 0.00| 0.0000| 0.022 Peak| | 0.2830| 1.144 ---------------+--------+--------+--------- RxCan2[250] Avg| 0.00| 0.0000| 0.026 Peak| | 0.0701| 0.698 ---------------+--------+--------+--------- RxCan2[255] Avg| 0.00| 0.0000| 0.022 Peak| | 0.1755| 1.063 ---------------+--------+--------+--------- RxCan2[265] Avg| 0.00| 0.0000| 0.024 Peak| | 0.1771| 0.729 ---------------+--------+--------+--------- RxCan2[270] Avg| 0.00| 0.0000| 0.023 Peak| | 0.0667| 0.307 ---------------+--------+--------+--------- RxCan2[290] Avg| 0.00| 0.0000| 0.022 Peak| | 0.0410| 0.280 ---------------+--------+--------+--------- RxCan2[295] Avg| 0.00| 0.0000| 0.023 Peak| | 0.0881| 0.299 ---------------+--------+--------+--------- RxCan2[2a0] Avg| 0.00| 0.0000| 0.023 Peak| | 0.0420| 0.268 ---------------+--------+--------+--------- RxCan2[2a7] Avg| 0.00| 0.0000| 0.021 Peak| | 0.1716| 0.454 ---------------+--------+--------+--------- RxCan2[2b0] Avg| 0.00| 0.0000| 0.023 Peak| | 0.0424| 0.300 ---------------+--------+--------+--------- RxCan2[2c0] Avg| 0.00| 0.0000| 0.024 Peak| | 0.0470| 0.298 ---------------+--------+--------+--------- RxCan2[2e0] Avg| 0.00| 0.0000| 0.030 Peak| | 0.0324| 1.152 ---------------+--------+--------+--------- RxCan2[2f0] Avg| 0.00| 0.0000| 0.024 Peak| | 0.0229| 0.359 ---------------+--------+--------+--------- RxCan2[2f5] Avg| 0.00| 0.0000| 0.026 Peak| | 0.1882| 0.673 ---------------+--------+--------+--------- RxCan2[300] Avg| 0.00| 0.0000| 0.022 Peak| | 0.0186| 0.263 ---------------+--------+--------+--------- RxCan2[310] Avg| 0.00| 0.0000| 0.024 Peak| | 0.0210| 0.265 ---------------+--------+--------+--------- RxCan2[320] Avg| 0.00| 0.0000| 0.025 Peak| | 0.0207| 0.354 ---------------+--------+--------+--------- RxCan2[326] Avg| 0.00| 0.0000| 0.023 Peak| | 0.1466| 0.686 ---------------+--------+--------+--------- RxCan2[330] Avg| 0.00| 0.0000| 0.022 Peak| | 0.4580| 0.708 ---------------+--------+--------+--------- RxCan2[340] Avg| 0.00| 0.0000| 0.031 Peak| | 0.1621| 0.785 ---------------+--------+--------+--------- RxCan2[345] Avg| 0.00| 0.0000| 0.021 Peak| | 0.0199| 0.261 ---------------+--------+--------+--------- RxCan2[35e] Avg| 0.00| 0.0000| 0.023 Peak| | 0.0686| 0.449 ---------------+--------+--------+--------- RxCan2[360] Avg| 0.00| 0.0000| 0.025 Peak| | 0.0204| 0.289 ---------------+--------+--------+--------- RxCan2[361] Avg| 0.00| 0.0000| 0.022 Peak| | 0.1166| 0.316 ---------------+--------+--------+--------- RxCan2[363] Avg| 0.00| 0.0000| 0.023 Peak| | 0.0146| 0.304 ---------------+--------+--------+--------- RxCan2[370] Avg| 0.00| 0.0000| 0.024 Peak| | 0.0099| 0.278 ---------------+--------+--------+--------- RxCan2[381] Avg| 0.00| 0.0000| 0.025 Peak| | 0.0468| 0.459 ---------------+--------+--------+--------- RxCan2[3a0] Avg| 0.00| 0.0000| 0.021 Peak| | 0.2339| 0.617 ---------------+--------+--------+--------- RxCan2[3d0] Avg| 0.00| 0.0000| 0.022 Peak| | 0.1351| 0.351 ---------------+--------+--------+--------- RxCan2[3d5] Avg| 0.00| 0.0000| 0.023 Peak| | 0.0796| 0.692 ---------------+--------+--------+--------- RxCan2[400] Avg| 0.00| 0.0000| 0.023 Peak| | 0.0537| 0.307 ---------------+--------+--------+--------- RxCan2[405] Avg| 0.00| 0.0000| 0.021 Peak| | 0.0513| 0.303 ---------------+--------+--------+--------- RxCan2[40a] Avg| 0.00| 0.0000| 0.022 Peak| | 0.1099| 0.313 ---------------+--------+--------+--------- RxCan2[415] Avg| 0.00| 0.0000| 0.022 Peak| | 0.0204| 0.251 ---------------+--------+--------+--------- RxCan2[435] Avg| 0.00| 0.0000| 0.028 Peak| | 0.0113| 0.342 ---------------+--------+--------+--------- RxCan2[440] Avg| 0.00| 0.0000| 0.027 Peak| | 0.0110| 0.299 ---------------+--------+--------+--------- RxCan2[465] Avg| 0.00| 0.0000| 0.023 Peak| | 0.0122| 0.295 ---------------+--------+--------+--------- RxCan2[466] Avg| 0.00| 0.0000| 0.022 Peak| | 0.0117| 0.267 ---------------+--------+--------+--------- RxCan2[467] Avg| 0.00| 0.0000| 0.022 Peak| | 0.0164| 0.325 ---------------+--------+--------+--------- RxCan2[501] Avg| 0.00| 0.0000| 0.023 Peak| | 0.0236| 0.276 ---------------+--------+--------+--------- RxCan2[503] Avg| 0.00| 0.0000| 0.023 Peak| | 0.0248| 0.349 ---------------+--------+--------+--------- RxCan2[504] Avg| 0.00| 0.0000| 0.023 Peak| | 0.0230| 0.312 ---------------+--------+--------+--------- RxCan2[505] Avg| 0.00| 0.0000| 0.025 Peak| | 0.0256| 0.310 ---------------+--------+--------+--------- RxCan2[508] Avg| 0.00| 0.0000| 0.023 Peak| | 0.0281| 0.329 ---------------+--------+--------+--------- RxCan2[511] Avg| 0.00| 0.0000| 0.022 Peak| | 0.0232| 0.282 ---------------+--------+--------+--------- RxCan2[51e] Avg| 0.00| 0.0000| 0.023 Peak| | 0.0248| 0.298 ---------------+--------+--------+--------- RxCan2[581] Avg| 0.00| 0.0000| 0.025 Peak| | 0.0166| 0.286 ===============+========+========+========= Total Avg| 0.00| 0.0000| 43.563
At the same time, calling poller times on, poller times status causes the bus to crash, although no polls are actively being sent at all.
Cheers, Simon _______________________________________________ OvmsDev mailing list OvmsDev@lists.openvehicles.com http://lists.openvehicles.com/mailman/listinfo/ovmsdev
_______________________________________________ OvmsDev mailing listOvmsDev@lists.openvehicles.comhttp://lists.openvehicles.com/mailman/listinfo/ovmsdev
_______________________________________________ OvmsDev mailing list OvmsDev@lists.openvehicles.com http://lists.openvehicles.com/mailman/listinfo/ovmsdev
_______________________________________________ OvmsDev mailing listOvmsDev@lists.openvehicles.comhttp://lists.openvehicles.com/mailman/listinfo/ovmsdev
-- Michael Balzer * Am Rahmen 5 * D-58313 Herdecke <https://www.google.com/maps/search/Am+Rahmen+5+*+D-58313+Herdecke?entry=gmail&source=g> Fon 02330 9104094 * Handy 0176 20698926
_______________________________________________ OvmsDev mailing listOvmsDev@lists.openvehicles.comhttp://lists.openvehicles.com/mailman/listinfo/ovmsdev
_______________________________________________ OvmsDev mailing listOvmsDev@lists.openvehicles.comhttp://lists.openvehicles.com/mailman/listinfo/ovmsdev
-- Michael Balzer * Am Rahmen 5 * D-58313 Herdecke <https://www.google.com/maps/search/Am+Rahmen+5+*+D-58313+Herdecke?entry=gmail&source=g> Fon 02330 9104094 * Handy 0176 20698926
_______________________________________________ OvmsDev mailing list OvmsDev@lists.openvehicles.com http://lists.openvehicles.com/mailman/listinfo/ovmsdev
_______________________________________________ OvmsDev mailing listOvmsDev@lists.openvehicles.comhttp://lists.openvehicles.com/mailman/listinfo/ovmsdev
_______________________________________________ OvmsDev mailing listOvmsDev@lists.openvehicles.comhttp://lists.openvehicles.com/mailman/listinfo/ovmsdev
-- Michael Balzer * Am Rahmen 5 * D-58313 Herdecke <https://www.google.com/maps/search/Am+Rahmen+5+*+D-58313+Herdecke?entry=gmail&source=g> Fon 02330 9104094 * Handy 0176 20698926
_______________________________________________ OvmsDev mailing list OvmsDev@lists.openvehicles.com http://lists.openvehicles.com/mailman/listinfo/ovmsdev
Michael, we've got a sufficiently fast bus/ID filter class `canfilter`, used for the can logging filters. Reusing that would also keep the syntax identical. And I don't think it would be applied in the CAN task, the frames still need to be queued, just optionally not be included in the timing stats. A quick & dirty test could be to exclude all IDs < 0x200 from the statistics. IDs below 0x200 will normally be used for high frequency process data frames. But that would hide processing issues with these… …and @Simon, there are already two suspiciously long peak times for frames in that range in your statistics: Type | count | Utlztn | Time | per s | [%] | [ms] ---------------+--------+--------+--------- RxCan1[076] Avg| 0.00| 0.0000| 0.072 Peak| | 0.7818| 15.221 ---------------+--------+--------+--------- RxCan2[100] Avg| 0.00| 0.0000| 0.046 Peak| | 0.4506| 21.961 ---------------+--------+--------+--------- I'd have a look at these first. Btw, can you provide timing stats for a longer collection period (in listen mode)? Regards, Michael Am 17.01.25 um 14:51 schrieb Michael Geddes:
Yep, pretty much
Inline below.
Also I wonder if something is causing the module to sleep or reboot and the wakeup is sending that bus wakeup Frame Michael B was talking about.
//.ichael
On Fri, 17 Jan 2025, 18:09 Michael Balzer via OvmsDev, <ovmsdev@lists.openvehicles.com> wrote:
Simon,
AFAIK "Pollers[Send]" is the regular "next round" request for the polling task, not a frame transmission.
Yep exactly.
A TX attempt in listen mode would produce a warn level log entry "Cannot write <busname> when not in ACTIVE mode" for tag "esp32can" or "mcp2515".
With the old poller, you wouldn't have had any indication of a queue overflow, so the new poller may help you to identify an issue in your code.
You need to understand the new poller not only does polls, it's now the main CAN receiver for the vehicle module. That's why your poller time stats include all process data frames as well, not only protocol frames.
The overflow means either your CAN processing is too slow to keep up with the packets received, or some other task is hogging the CPU. That would need to be a task with an equal or higher priority as the vehicle task, which has priority level 10 -- only system & networking tasks are above, so that's not likely. (You can check the CPU usage with the "module tasks" command.)
I wonder whether some kind of filter before queueing the Frame might work. It would have to be quick and simple as it would be executing in the CAN task I think.
That means you should check your standard frame processing (`IncomingFrameCanX` callbacks) for potential delays and processing complexity issues.
The poller statistics can help you track this down, but you need to have at least 10 seconds of statistics, the more the better. Rule of thumb: PRI average at 0.0/second means you don't have enough data yet. (-- //.ichael, correct me if I'm wrong)
It's either that or we are rounding badly. I can check.
At the same time, calling poller times on, poller times status causes the bus to crash
In any case that still doesn't explain how the poller could possibly cause a CAN bus (!) crash without actually doing any transmissions.
How does the CAN bus crash manifest?
Regards, Michael
Am 15.01.25 um 19:54 schrieb Simon Ehlen via OvmsDev:
I put the two buses back into listen mode and drove a short distance and charged the car. As I said, there is no active polling in my code. As expected, there is therefore no indication of a failed TX attempt in the console log. I only continue to see a lot of RX Task Queue Overflow messages in the log, which I did not have before. I also see a Pollers[Send]: Task Queue Overflow entry, but since I don't see any indication of “cannot write” on that, I'm not assuming that's a “real” send.
I (19760210) vehicle-poll: Poller[Frame]: RX Task Queue Overflow Run 5 I (19764420) vehicle-poll: Poller[Frame]: RX Task Queue Overflow Run 1 I (19764420) vehicle-poll: Poller[Frame]: RX Task Queue Overflow Run 3 I (19764420) vehicle-poll: Poller[Frame]: RX Task Queue Overflow Run 1 I (19764740) vehicle-poll: Poller[Frame]: RX Task Queue Overflow Run 1 I (19764740) vehicle-poll: Poller[Frame]: RX Task Queue Overflow Run 1 I (19764740) vehicle-poll: Poller[Frame]: RX Task Queue Overflow Run 1 I (19764740) vehicle-poll: Poller[Frame]: RX Task Queue Overflow Run 1 I (19764740) vehicle-poll: Poller[Frame]: RX Task Queue Overflow Run 1 I (19764750) vehicle-poll: Poller[Frame]: RX Task Queue Overflow Run 2 I (19764750) vehicle-poll: Poller[Frame]: RX Task Queue Overflow Run 1 I (19764750) vehicle-poll: Poller[Frame]: RX Task Queue Overflow Run 2 I (19764870) vehicle-poll: Poller[Frame]: RX Task Queue Overflow Run 1 I (19764870) vehicle-poll: Poller[Frame]: RX Task Queue Overflow Run 2 I (19765270) vehicle-poll: Poller[Frame]: RX Task Queue Overflow Run 4 I (19765270) vehicle-poll: Poller[Frame]: RX Task Queue Overflow Run 6 I (19765610) vehicle-poll: Poller[Frame]: RX Task Queue Overflow Run 3 I (19765930) vehicle-poll: Poller[Frame]: RX Task Queue Overflow Run 1 I (19765930) vehicle-poll: Poller[Frame]: RX Task Queue Overflow Run 3 I (19765930) vehicle-poll: Poller[Frame]: RX Task Queue Overflow Run 1 I (19766260) vehicle-poll: Poller[Frame]: RX Task Queue Overflow Run 50 I (19766260) vehicle-poll: Poller[Frame]: RX Task Queue Overflow Run 48 I (19766260) vehicle-poll: Poller[Frame]: RX Task Queue Overflow Run 27 I (19766270) vehicle-poll: Poller[Frame]: RX Task Queue Overflow Run 6 I (19766270) vehicle-poll: Poller[Frame]: RX Task Queue Overflow Run 4 E (19766280) can: can2: intr=4754831 rxpkt=4757493 txpkt=0 errflags=0x22401c02 rxerr=0 txerr=0 rxinval=0 rxovr=0 txovr=0 txdelay=0 txfail=0 wdgreset=1 errreset=0 E (19766300) can: can2: intr=4754831 rxpkt=4757494 txpkt=0 errflags=0x23401c01 rxerr=0 txerr=0 rxinval=0 rxovr=0 txovr=0 txdelay=0 txfail=0 wdgreset=1 errreset=0 I (19766300) vehicle-poll: Poller[Frame]: RX Task Queue Overflow Run 7 I (19766340) vehicle-poll: Poller[Frame]: RX Task Queue Overflow Run 39 I (19766350) vehicle-poll: Poller[Frame]: RX Task Queue Overflow Run 32 I (19766350) vehicle-poll: Poller[Frame]: RX Task Queue Overflow Run 17 I (19766350) vehicle-poll: Poller[Frame]: RX Task Queue Overflow Run 3 I (19766350) vehicle-poll: Pollers[Send]: Task Queue Overflow I (19766350) vehicle-poll: Poller[Frame]: RX Task Queue Overflow Run 1 I (19766350) vehicle-poll: Poller[Frame]: RX Task Queue Overflow Run 1 E (19766360) can: can2: intr=4754840 rxpkt=4757509 txpkt=0 errflags=0x22401c02 rxerr=0 txerr=0 rxinval=0 rxovr=0 txovr=0 txdelay=0 txfail=0 wdgreset=1 errreset=0 I (19766370) vehicle-poll: Poller[Frame]: RX Task Queue Overflow Run 4 E (19766370) can: can2: intr=4754840 rxpkt=4757510 txpkt=0 errflags=0x23401c01 rxerr=0 txerr=0 rxinval=0 rxovr=0 txovr=0 txdelay=0 txfail=0 wdgreset=1 errreset=0 I (19766430) vehicle-poll: Poller[Frame]: RX Task Queue Overflow Run 30 I (19766430) vehicle-poll: Poller[Frame]: RX Task Queue Overflow Run 36 I (19766430) vehicle-poll: Poller[Frame]: RX Task Queue Overflow Run 26 I (19766430) vehicle-poll: Poller[Frame]: RX Task Queue Overflow Run 4 I (19766430) vehicle-poll: Poller[Frame]: RX Task Queue Overflow Run 3 I (19766430) vehicle-poll: Poller[Frame]: RX Task Queue Overflow Run 2 I (19766430) vehicle-poll: Poller[Frame]: RX Task Queue Overflow Run 1 E (19766450) can: can2: intr=4754855 rxpkt=4757535 txpkt=0 errflags=0x23001001 rxerr=0 txerr=0 rxinval=0 rxovr=0 txovr=0 txdelay=0 txfail=0 wdgreset=1 errreset=0 E (19766460) can: can2: intr=4754855 rxpkt=4757536 txpkt=0 errflags=0x23401c01 rxerr=0 txerr=0 rxinval=0 rxovr=0 txovr=0 txdelay=0 txfail=0 wdgreset=1 errreset=0 E (19766520) can: can2: intr=4754855 rxpkt=4757539 txpkt=0 errflags=0x22001002 rxerr=0 txerr=0 rxinval=0 rxovr=0 txovr=0 txdelay=0 txfail=0 wdgreset=1 errreset=0 I (19766520) vehicle-poll: Poller[Frame]: RX Task Queue Overflow Run 9 I (19766520) vehicle-poll: Poller[Frame]: RX Task Queue Overflow Run 37 I (19766520) vehicle-poll: Poller[Frame]: RX Task Queue Overflow Run 30 I (19766520) vehicle-poll: Poller[Frame]: RX Task Queue Overflow Run 6 I (19766520) vehicle-poll: Poller[Frame]: RX Task Queue Overflow Run 2 I (19766520) vehicle-poll: Poller[Frame]: RX Task Queue Overflow Run 1 I (19766520) vehicle-poll: Poller[Frame]: RX Task Queue Overflow Run 1 I (19766520) vehicle-poll: Poller[Frame]: RX Task Queue Overflow Run 3 I (19766530) vehicle-poll: Poller[Frame]: RX Task Queue Overflow Run 1 I (19766530) vehicle-poll: Poller[Frame]: RX Task Queue Overflow Run 1 I (19766530) vehicle-poll: Poller[Frame]: RX Task Queue Overflow Run 1 E (19766540) can: can2: intr=4754861 rxpkt=4757548 txpkt=0 errflags=0x23401c01 rxerr=0 txerr=0 rxinval=0 rxovr=0 txovr=0 txdelay=0 txfail=0 wdgreset=1 errreset=0 I (19766550) vehicle-poll: Poller[Frame]: RX Task Queue Overflow Run 3 E (19766560) can: can2: intr=4754861 rxpkt=4757552 txpkt=0 errflags=0x23001001 rxerr=0 txerr=0 rxinval=0 rxovr=0 txovr=0 txdelay=0 txfail=0 wdgreset=1 errreset=0 E (19766610) can: can2: intr=4754861 rxpkt=4757553 txpkt=0 errflags=0x23401c01 rxerr=0 txerr=0 rxinval=0 rxovr=0 txovr=0 txdelay=0 txfail=0 wdgreset=1 errreset=0 I (19766610) vehicle-poll: Poller[Frame]: RX Task Queue Overflow Run 4 I (19766610) vehicle-poll: Poller[Frame]: RX Task Queue Overflow Run 5 I (19766610) vehicle-poll: Poller[Frame]: RX Task Queue Overflow Run 33 I (19766610) vehicle-poll: Poller[Frame]: RX Task Queue Overflow Run 34 I (19766610) vehicle-poll: Poller[Frame]: RX Task Queue Overflow Run 12 W (19767070) websocket: WebSocketHandler[0x3f8d79d8]: job queue overflow detected W (19767140) websocket: WebSocketHandler[0x3f8d79d8]: job queue overflow detected W (19767180) websocket: WebSocketHandler[0x3f8d79d8]: job queue overflow resolved, 1 drops W (19767260) websocket: WebSocketHandler[0x3f8d79d8]: job queue overflow detected W (19767310) websocket: WebSocketHandler[0x3f8d79d8]: job queue overflow resolved, 1 drops
Cheers Simon
Am 15.01.2025 um 19:18 schrieb Derek Caudwell via OvmsDev:
Since the following email I have high confidence the issue on the Leaf is related/caused by the poller as there has been no further occurrence and Chris has also experienced the car going to neutral on the new poller firmware.
.... I haven't ruled out it being a fault with my car yet. Shortly after it faulted the car was run into so has been off the road for sometime, my first step was to replace 12V battery. The ovms unit is now unplugged and if it does not fault over the next month while driving I'll be reasonably confident it's ovms related.
Not sure which firmware version the poller updates were included in but it was only after upgrading to it that the errors occurred (which could be coincidental however it has faulted twice more both on version 3.3.004-141-gf729d82c). For periods where I reverted to 3.3.003 it was fine.
It might be useful to have an extra option on the enable can write to only enable it when the car is parked/charging.
On Wed, 15 Jan 2025, 11:11 pm Michael Balzer via OvmsDev, <ovmsdev@lists.openvehicles.com> wrote:
Derek, can you comment on this? Do you still have the issue mentioned?
Speaking of the Leaf, the code there actually does something fishy in `CommandWakeup()`:
unsigned char data = 0; … m_can1->WriteStandard(0x5C0, *_8_*, &data); //Wakes up the VCM (by spoofing empty battery request heating)
And there are CAN transmissions from command execution in the Leaf code, so to be sure there is no TX, listen mode is needed there as well.
Regarding CAN trace, you can try with the monitor channel and use the USB console to record the log output. That way you should be able to at least rule out there are regular transmissions -- assuming not every TX will cause an immediate crash.
Another / probably better option: when in listen mode, the log will also tell you about TX attempts, as the driver will issue a warning on each.
The CAN monitor log may also tell you about bus errors detected.
Regards, Michael
Am 15.01.25 um 10:44 schrieb Simon Ehlen via OvmsDev:
There is at least one more Leaf from Derek that has also ended up in limp mode since the new poller. There, too, no polling was actually carried out while driving. I'm not familiar with the framework at all, but does this perhaps offer you enough of an approach to recognize a commonality?
Unfortunately I do not have a tool to create a CAN trace. I can't use the OVMS for this, as it no longer responds after a bus crash until I have disconnected it from the OBD and plugged it back in.
Cheers, Simon
Am 15.01.2025 um 10:18 schrieb Michael Balzer via OvmsDev:
The frame acknowledging is done automatically by the CAN transceiver when in active mode, this is part of the CAN protocol to indicate bit errors to the sender.
So normally a failure of the system to process received frames fast enough cannot cause any issue on the bus. But the ESP32 has a range of known hardware issues, especially in the embedded CAN transceiver, I wouldn't be surprised if there are more, or if our driver lacks some workaround for these.
Maybe the new poller has some bug that causes false transmissions from process data frames received. But many vehicles send process data frames, and we've had no issue reports like this on any of them, and ECUs also normally simply ignore out of sequence protocol frames.
You could record a CAN trace to see if there are transmissions, and what kind. If you don't poll and don't send frames from your code, there should be none. If the bus still crashes, that would be an indicator for something going wrong in the transceiver.
Regards, Michael
Am 15.01.25 um 07:15 schrieb Simon Ehlen via OvmsDev:
Thanks Mark for the explanation. So does this mean that OVMS tries to acknowledge all incoming messages in active mode? This seems to me to clearly exceed the capacity of OVMS with the mass of incoming messages.
In fact, I am currently opening the bus in active mode, as I was hoping to get my code to revive the BMS in OVMS to work. However, unlike the other data, I only get the cell voltages when I actively poll them. To be on the safe side, I will now open the bus in read mode again.
However, I am still wondering what in the poller change has altered the OVMS in such a way that the bus is now crashing completely. Currently I have undone the changes since february 2024, this only concerns code from the public repository, there was no change from me in that period. Now the OVMS is running stable again and there are neither queue overflows nor bus crashes.
I had also previously increased the following queue sizes, but unfortunately this was not successful: CONFIG_OVMS_HW_EVENT_QUEUE_SIZE=120 CONFIG_OVMS_HW_CAN_RX_QUEUE_SIZE=80 CONFIG_OVMS_VEHICLE_CAN_RX_QUEUE_SIZE=80
Cheers, Simon
Am 15.01.2025 um 02:08 schrieb Mark Webb-Johnson: > Note sure if this helps, but some comments: > > * Remember than CAN protocol in normal mode is an > ‘active’ protocol. Nodes on the bus are actively > acknowledging messages (and that includes OVMS), > even if they never write messages. So in normal mode > there is no absolute ‘read access’. For example, > opening the CAN port at the wrong baud rate, even if > not writing messages, will mess up the bus. > > > * However, if you open the CAN port in ‘listen’ mode, > then it is truly read-only. In that mode it will not > acknowledge messages, and cannot write on the bus at > all. I’ve never seen an OVMS mess up a bus in listen > mode, even if the baud rate is wrong. I think the > only way for that to happen would be a hardware > layer issue (cabling, termination, etc). > > > Regards, Mark. > >> On 15 Jan 2025, at 6:30 AM, Simon Ehlen via OvmsDev >> <ovmsdev@lists.openvehicles.com> >> <mailto:ovmsdev@lists.openvehicles.com> wrote: >> >> But what is the reason that a read access to the bus >> can cause the bus to crash? >> This is not critical during charging, it just aborts >> the charging process with an error. >> While driving, this results in a “stop safely now” >> error message on the dashboard and the engine is >> switched off immediately. >> >> Cheers, >> Simon >> >> Am 14.01.2025 um 23:22 schrieb Michael Geddes via OvmsDev: >>> You may need to increase the queue size for the poll >>> task queue. >>> >>> The poller still handles the bus to vehicle >>> notifications even if it is off. >>> >>> Any poller logging on such an intensive load of can >>> messages is likely to be a problem. This is part of >>> the reason it is flagged off. >>> >>> The total % looks wrong :/ >>> >>> //.ichael >>> >>> >>> >>> >>> On Wed, 15 Jan 2025, 03:17 Simon Ehlen via OvmsDev, >>> <ovmsdev@lists.openvehicles.com> wrote: >>> >>> Hi, >>> >>> I finally got around to merging my code with the >>> current master (previous merge february 2024). >>> I have rebuilt my code for a Ford Focus Electric >>> so that it uses the new OvmsPoller class. >>> >>> However, I now see a lot of entries like this in >>> my log: >>> >>> I (246448) vehicle-poll: Poller[Frame]: RX Task >>> Queue Overflow Run 8 >>> I (246448) vehicle-poll: Poller[Frame]: RX Task >>> Queue Overflow Run 3 >>> I (246448) vehicle-poll: Poller[Frame]: RX Task >>> Queue Overflow Run 1 >>> I (246448) vehicle-poll: Poller[Frame]: RX Task >>> Queue Overflow Run 2 >>> I (246448) vehicle-poll: Poller[Frame]: RX Task >>> Queue Overflow Run 1 >>> I (246448) vehicle-poll: Poller[Frame]: RX Task >>> Queue Overflow Run 2 >>> I (246448) vehicle-poll: Poller[Frame]: RX Task >>> Queue Overflow Run 1 >>> I (246448) vehicle-poll: Poller[Frame]: RX Task >>> Queue Overflow Run 1 >>> I (254448) vehicle-poll: Poller[Frame]: RX Task >>> Queue Overflow Run 24 >>> I (254448) vehicle-poll: Poller[Frame]: RX Task >>> Queue Overflow Run 1 >>> I (254448) vehicle-poll: Poller[Frame]: RX Task >>> Queue Overflow Run 1 >>> I (254448) vehicle-poll: Poller[Frame]: RX Task >>> Queue Overflow Run 1 >>> I (254448) vehicle-poll: Poller[Frame]: RX Task >>> Queue Overflow Run 1 >>> I (254448) vehicle-poll: Poller[Frame]: RX Task >>> Queue Overflow Run 1 >>> I (254448) vehicle-poll: Poller[Frame]: RX Task >>> Queue Overflow Run 1 >>> >>> Was this message just hidden before or do I need >>> to make further adjustments to my code? >>> >>> My code currently does not use active polling but >>> reads on the busses (IncomingFrameCanX) on certain >>> modules. >>> >>> When I look at poller times status, it looks very >>> extensive to me... >>> >>> OVMS# poller times status >>> Poller timing is: on >>> Type | count | Utlztn | Time >>> | per s | [%] | [ms] >>> ---------------+--------+--------+--------- >>> Poll:PRI Avg| 0.00| 0.0000| 0.003 >>> Peak| | 0.0014| 0.041 >>> ---------------+--------+--------+--------- >>> RxCan1[010] Avg| 0.00| 0.0000| 0.020 >>> Peak| | 1.2217| 1.089 >>> ---------------+--------+--------+--------- >>> RxCan1[030] Avg| 0.00| 0.0000| 0.024 >>> Peak| | 1.2193| 1.241 >>> ---------------+--------+--------+--------- >>> RxCan1[041] Avg| 0.00| 0.0000| 0.023 >>> Peak| | 0.6460| 1.508 >>> ---------------+--------+--------+--------- >>> RxCan1[049] Avg| 0.00| 0.0000| 0.024 >>> Peak| | 0.6320| 0.630 >>> ---------------+--------+--------+--------- >>> RxCan1[04c] Avg| 0.00| 0.0000| 0.023 >>> Peak| | 0.6430| 1.474 >>> ---------------+--------+--------+--------- >>> RxCan1[04d] Avg| 0.00| 0.0000| 0.022 >>> Peak| | 1.2987| 1.359 >>> ---------------+--------+--------+--------- >>> RxCan1[076] Avg| 0.00| 0.0000| 0.072 >>> Peak| | 0.7818| 15.221 >>> ---------------+--------+--------+--------- >>> RxCan1[077] Avg| 0.00| 0.0000| 0.022 >>> Peak| | 0.6274| 0.955 >>> ---------------+--------+--------+--------- >>> RxCan1[07a] Avg| 0.00| 0.0000| 0.039 >>> Peak| | 1.7602| 1.684 >>> ---------------+--------+--------+--------- >>> RxCan1[07d] Avg| 0.00| 0.0000| 0.023 >>> Peak| | 0.6621| 1.913 >>> ---------------+--------+--------+--------- >>> RxCan1[0c8] Avg| 0.00| 0.0000| 0.026 >>> Peak| | 0.6292| 1.412 >>> ---------------+--------+--------+--------- >>> RxCan1[11a] Avg| 0.00| 0.0000| 0.023 >>> Peak| | 1.2635| 1.508 >>> ---------------+--------+--------+--------- >>> RxCan1[130] Avg| 0.00| 0.0000| 0.024 >>> Peak| | 0.6548| 0.703 >>> ---------------+--------+--------+--------- >>> RxCan1[139] Avg| 0.00| 0.0000| 0.021 >>> Peak| | 0.6002| 0.984 >>> ---------------+--------+--------+--------- >>> RxCan1[156] Avg| 0.00| 0.0000| 0.024 >>> Peak| | 0.1225| 0.479 >>> ---------------+--------+--------+--------- >>> RxCan1[160] Avg| 0.00| 0.0000| 0.028 >>> Peak| | 0.6586| 1.376 >>> ---------------+--------+--------+--------- >>> RxCan1[165] Avg| 0.00| 0.0000| 0.027 >>> Peak| | 0.6368| 1.132 >>> ---------------+--------+--------+--------- >>> RxCan1[167] Avg| 0.00| 0.0000| 0.024 >>> Peak| | 1.3009| 1.067 >>> ---------------+--------+--------+--------- >>> RxCan1[171] Avg| 0.00| 0.0000| 0.022 >>> Peak| | 0.6590| 4.320 >>> ---------------+--------+--------+--------- >>> RxCan1[178] Avg| 0.00| 0.0000| 0.023 >>> Peak| | 0.1161| 0.311 >>> ---------------+--------+--------+--------- >>> RxCan1[179] Avg| 0.00| 0.0000| 0.024 >>> Peak| | 0.1236| 0.536 >>> ---------------+--------+--------+--------- >>> RxCan1[180] Avg| 0.00| 0.0000| 0.022 >>> Peak| | 0.6472| 1.193 >>> ---------------+--------+--------+--------- >>> RxCan1[185] Avg| 0.00| 0.0000| 0.022 >>> Peak| | 0.6777| 1.385 >>> ---------------+--------+--------+--------- >>> RxCan1[1a0] Avg| 0.00| 0.0000| 0.022 >>> Peak| | 0.6486| 2.276 >>> ---------------+--------+--------+--------- >>> RxCan1[1e0] Avg| 0.00| 0.0000| 0.023 >>> Peak| | 0.6725| 1.376 >>> ---------------+--------+--------+--------- >>> RxCan1[1e4] Avg| 0.00| 0.0000| 0.027 >>> Peak| | 0.7370| 1.266 >>> ---------------+--------+--------+--------- >>> RxCan1[1f0] Avg| 0.00| 0.0000| 0.024 >>> Peak| | 0.4253| 0.753 >>> ---------------+--------+--------+--------- >>> RxCan1[200] Avg| 0.00| 0.0000| 0.025 >>> Peak| | 0.6262| 0.791 >>> ---------------+--------+--------+--------- >>> RxCan1[202] Avg| 0.00| 0.0000| 0.021 >>> Peak| | 1.2915| 1.257 >>> ---------------+--------+--------+--------- >>> RxCan1[204] Avg| 0.00| 0.0000| 0.022 >>> Peak| | 1.2620| 1.010 >>> ---------------+--------+--------+--------- >>> RxCan1[213] Avg| 0.00| 0.0000| 0.022 >>> Peak| | 0.6331| 1.185 >>> ---------------+--------+--------+--------- >>> RxCan1[214] Avg| 0.00| 0.0000| 0.023 >>> Peak| | 0.9977| 34.527 >>> ---------------+--------+--------+--------- >>> RxCan1[217] Avg| 0.00| 0.0000| 0.024 >>> Peak| | 1.2825| 1.328 >>> ---------------+--------+--------+--------- >>> RxCan1[218] Avg| 0.00| 0.0000| 0.022 >>> Peak| | 0.6328| 1.110 >>> ---------------+--------+--------+--------- >>> RxCan1[230] Avg| 0.00| 0.0000| 0.019 >>> Peak| | 0.6742| 5.119 >>> ---------------+--------+--------+--------- >>> RxCan1[240] Avg| 0.00| 0.0000| 0.022 >>> Peak| | 0.1163| 0.343 >>> ---------------+--------+--------+--------- >>> RxCan1[242] Avg| 0.00| 0.0000| 0.025 >>> Peak| | 0.3501| 1.015 >>> ---------------+--------+--------+--------- >>> RxCan1[24a] Avg| 0.00| 0.0000| 0.022 >>> Peak| | 0.1212| 0.338 >>> ---------------+--------+--------+--------- >>> RxCan1[24b] Avg| 0.00| 0.0000| 0.023 >>> Peak| | 0.1289| 0.330 >>> ---------------+--------+--------+--------- >>> RxCan1[24c] Avg| 0.00| 0.0000| 0.033 >>> Peak| | 0.1714| 1.189 >>> ---------------+--------+--------+--------- >>> RxCan1[25a] Avg| 0.00| 0.0000| 0.024 >>> Peak| | 0.1289| 0.510 >>> ---------------+--------+--------+--------- >>> RxCan1[25b] Avg| 0.00| 0.0000| 0.022 >>> Peak| | 0.6685| 0.930 >>> ---------------+--------+--------+--------- >>> RxCan1[25c] Avg| 0.00| 0.0000| 0.027 >>> Peak| | 1.3298| 2.670 >>> ---------------+--------+--------+--------- >>> RxCan1[260] Avg| 0.00| 0.0000| 0.023 >>> Peak| | 0.1271| 0.401 >>> ---------------+--------+--------+--------- >>> RxCan1[270] Avg| 0.00| 0.0000| 0.022 >>> Peak| | 0.6439| 0.898 >>> ---------------+--------+--------+--------- >>> RxCan1[280] Avg| 0.00| 0.0000| 0.023 >>> Peak| | 0.6502| 1.156 >>> ---------------+--------+--------+--------- >>> RxCan1[2e4] Avg| 0.00| 0.0000| 0.035 >>> Peak| | 0.3389| 0.811 >>> ---------------+--------+--------+--------- >>> RxCan1[2ec] Avg| 0.00| 0.0000| 0.027 >>> Peak| | 0.1417| 0.784 >>> ---------------+--------+--------+--------- >>> RxCan1[2ed] Avg| 0.00| 0.0000| 0.024 >>> Peak| | 0.1364| 0.746 >>> ---------------+--------+--------+--------- >>> RxCan1[2ee] Avg| 0.00| 0.0000| 0.024 >>> Peak| | 0.1406| 0.965 >>> ---------------+--------+--------+--------- >>> RxCan1[312] Avg| 0.00| 0.0000| 0.023 >>> Peak| | 0.1293| 0.978 >>> ---------------+--------+--------+--------- >>> RxCan1[326] Avg| 0.00| 0.0000| 0.024 >>> Peak| | 0.1298| 0.518 >>> ---------------+--------+--------+--------- >>> RxCan1[336] Avg| 0.00| 0.0000| 0.028 >>> Peak| | 0.0106| 0.329 >>> ---------------+--------+--------+--------- >>> RxCan1[352] Avg| 0.00| 0.0000| 0.030 >>> Peak| | 0.1054| 0.800 >>> ---------------+--------+--------+--------- >>> RxCan1[355] Avg| 0.00| 0.0000| 0.027 >>> Peak| | 0.0270| 0.546 >>> ---------------+--------+--------+--------- >>> RxCan1[35e] Avg| 0.00| 0.0000| 0.023 >>> Peak| | 0.1288| 0.573 >>> ---------------+--------+--------+--------- >>> RxCan1[365] Avg| 0.00| 0.0000| 0.024 >>> Peak| | 0.1297| 0.358 >>> ---------------+--------+--------+--------- >>> RxCan1[366] Avg| 0.00| 0.0000| 0.026 >>> Peak| | 0.1429| 1.001 >>> ---------------+--------+--------+--------- >>> RxCan1[367] Avg| 0.00| 0.0000| 0.026 >>> Peak| | 0.1472| 0.828 >>> ---------------+--------+--------+--------- >>> RxCan1[368] Avg| 0.00| 0.0000| 0.024 >>> Peak| | 0.1323| 0.931 >>> ---------------+--------+--------+--------- >>> RxCan1[369] Avg| 0.00| 0.0000| 0.026 >>> Peak| | 0.1498| 1.072 >>> ---------------+--------+--------+--------- >>> RxCan1[380] Avg| 0.00| 0.0000| 0.022 >>> Peak| | 0.1285| 0.348 >>> ---------------+--------+--------+--------- >>> RxCan1[38b] Avg| 0.00| 0.0000| 0.021 >>> Peak| | 0.3298| 1.168 >>> ---------------+--------+--------+--------- >>> RxCan1[3b3] Avg| 0.00| 0.0000| 0.025 >>> Peak| | 0.1348| 0.920 >>> ---------------+--------+--------+--------- >>> RxCan1[400] Avg| 0.00| 0.0000| 0.022 >>> Peak| | 0.0481| 0.445 >>> ---------------+--------+--------+--------- >>> RxCan1[405] Avg| 0.00| 0.0000| 0.034 >>> Peak| | 0.0723| 0.473 >>> ---------------+--------+--------+--------- >>> RxCan1[40a] Avg| 0.00| 0.0000| 0.025 >>> Peak| | 0.1040| 0.543 >>> ---------------+--------+--------+--------- >>> RxCan1[410] Avg| 0.00| 0.0000| 0.024 >>> Peak| | 0.1339| 0.678 >>> ---------------+--------+--------+--------- >>> RxCan1[411] Avg| 0.00| 0.0000| 0.025 >>> Peak| | 0.1376| 0.573 >>> ---------------+--------+--------+--------- >>> RxCan1[416] Avg| 0.00| 0.0000| 0.023 >>> Peak| | 0.1284| 0.346 >>> ---------------+--------+--------+--------- >>> RxCan1[421] Avg| 0.00| 0.0000| 0.024 >>> Peak| | 0.1323| 0.643 >>> ---------------+--------+--------+--------- >>> RxCan1[42d] Avg| 0.00| 0.0000| 0.023 >>> Peak| | 0.1362| 1.146 >>> ---------------+--------+--------+--------- >>> RxCan1[42f] Avg| 0.00| 0.0000| 0.027 >>> Peak| | 0.1503| 1.762 >>> ---------------+--------+--------+--------- >>> RxCan1[430] Avg| 0.00| 0.0000| 0.023 >>> Peak| | 0.1352| 0.347 >>> ---------------+--------+--------+--------- >>> RxCan1[434] Avg| 0.00| 0.0000| 0.024 >>> Peak| | 0.1312| 0.580 >>> ---------------+--------+--------+--------- >>> RxCan1[435] Avg| 0.00| 0.0000| 0.029 >>> Peak| | 0.1109| 1.133 >>> ---------------+--------+--------+--------- >>> RxCan1[43e] Avg| 0.00| 0.0000| 0.023 >>> Peak| | 0.2776| 0.686 >>> ---------------+--------+--------+--------- >>> RxCan1[440] Avg| 0.00| 0.0000| 0.022 >>> Peak| | 0.0118| 0.276 >>> ---------------+--------+--------+--------- >>> RxCan1[465] Avg| 0.00| 0.0000| 0.022 >>> Peak| | 0.0118| 0.279 >>> ---------------+--------+--------+--------- >>> RxCan1[466] Avg| 0.00| 0.0000| 0.023 >>> Peak| | 0.0123| 0.310 >>> ---------------+--------+--------+--------- >>> RxCan1[467] Avg| 0.00| 0.0000| 0.025 >>> Peak| | 0.0132| 0.314 >>> ---------------+--------+--------+--------- >>> RxCan1[472] Avg| 0.00| 0.0000| 0.101 >>> Peak| | 0.0307| 1.105 >>> ---------------+--------+--------+--------- >>> RxCan1[473] Avg| 0.00| 0.0000| 0.051 >>> Peak| | 0.0107| 0.575 >>> ---------------+--------+--------+--------- >>> RxCan1[474] Avg| 0.00| 0.0000| 0.024 >>> Peak| | 0.0097| 0.289 >>> ---------------+--------+--------+--------- >>> RxCan1[475] Avg| 0.00| 0.0000| 0.023 >>> Peak| | 0.0220| 0.327 >>> ---------------+--------+--------+--------- >>> RxCan1[476] Avg| 0.00| 0.0000| 0.050 >>> Peak| | 0.0762| 5.329 >>> ---------------+--------+--------+--------- >>> RxCan1[477] Avg| 0.00| 0.0000| 0.032 >>> Peak| | 0.0283| 0.669 >>> ---------------+--------+--------+--------- >>> RxCan1[595] Avg| 0.00| 0.0000| 0.026 >>> Peak| | 0.0103| 0.297 >>> ---------------+--------+--------+--------- >>> RxCan1[59e] Avg| 0.00| 0.0000| 0.022 >>> Peak| | 0.0114| 0.263 >>> ---------------+--------+--------+--------- >>> RxCan1[5a2] Avg| 0.00| 0.0000| 0.026 >>> Peak| | 0.0119| 0.505 >>> ---------------+--------+--------+--------- >>> RxCan1[5ba] Avg| 0.00| 0.0000| 0.025 >>> Peak| | 0.0139| 0.549 >>> ---------------+--------+--------+--------- >>> RxCan2[020] Avg| 0.00| 0.0000| 0.026 >>> Peak| | 0.4923| 1.133 >>> ---------------+--------+--------+--------- >>> RxCan2[030] Avg| 0.00| 0.0000| 0.023 >>> Peak| | 0.3297| 1.136 >>> ---------------+--------+--------+--------- >>> RxCan2[03a] Avg| 0.00| 0.0000| 0.022 >>> Peak| | 0.2792| 1.275 >>> ---------------+--------+--------+--------- >>> RxCan2[040] Avg| 0.00| 0.0000| 0.023 >>> Peak| | 0.2834| 1.080 >>> ---------------+--------+--------+--------- >>> RxCan2[060] Avg| 0.00| 0.0000| 0.029 >>> Peak| | 0.3037| 0.991 >>> ---------------+--------+--------+--------- >>> RxCan2[070] Avg| 0.00| 0.0000| 0.025 >>> Peak| | 0.2291| 0.460 >>> ---------------+--------+--------+--------- >>> RxCan2[080] Avg| 0.00| 0.0000| 0.043 >>> Peak| | 0.4015| 1.007 >>> ---------------+--------+--------+--------- >>> RxCan2[083] Avg| 0.00| 0.0000| 0.026 >>> Peak| | 0.2957| 0.788 >>> ---------------+--------+--------+--------- >>> RxCan2[090] Avg| 0.00| 0.0000| 0.027 >>> Peak| | 0.3951| 1.231 >>> ---------------+--------+--------+--------- >>> RxCan2[0a0] Avg| 0.00| 0.0000| 0.026 >>> Peak| | 0.2560| 0.722 >>> ---------------+--------+--------+--------- >>> RxCan2[100] Avg| 0.00| 0.0000| 0.046 >>> Peak| | 0.4506| 21.961 >>> ---------------+--------+--------+--------- >>> RxCan2[108] Avg| 0.00| 0.0000| 0.024 >>> Peak| | 0.3713| 1.125 >>> ---------------+--------+--------+--------- >>> RxCan2[110] Avg| 0.00| 0.0000| 0.029 >>> Peak| | 0.2443| 0.755 >>> ---------------+--------+--------+--------- >>> RxCan2[130] Avg| 0.00| 0.0000| 0.023 >>> Peak| | 0.2052| 1.097 >>> ---------------+--------+--------+--------- >>> RxCan2[150] Avg| 0.00| 0.0000| 0.023 >>> Peak| | 0.2246| 0.371 >>> ---------------+--------+--------+--------- >>> RxCan2[160] Avg| 0.00| 0.0000| 0.024 >>> Peak| | 0.0755| 1.125 >>> ---------------+--------+--------+--------- >>> RxCan2[180] Avg| 0.00| 0.0000| 0.023 >>> Peak| | 0.2350| 0.936 >>> ---------------+--------+--------+--------- >>> RxCan2[190] Avg| 0.00| 0.0000| 0.022 >>> Peak| | 0.2275| 0.592 >>> ---------------+--------+--------+--------- >>> RxCan2[1a0] Avg| 0.00| 0.0000| 0.025 >>> Peak| | 0.0125| 0.273 >>> ---------------+--------+--------+--------- >>> RxCan2[1a4] Avg| 0.00| 0.0000| 0.022 >>> Peak| | 0.2806| 0.632 >>> ---------------+--------+--------+--------- >>> RxCan2[1a8] Avg| 0.00| 0.0000| 0.022 >>> Peak| | 0.1683| 0.740 >>> ---------------+--------+--------+--------- >>> RxCan2[1b0] Avg| 0.00| 0.0000| 0.023 >>> Peak| | 0.1360| 0.490 >>> ---------------+--------+--------+--------- >>> RxCan2[1b4] Avg| 0.00| 0.0000| 0.027 >>> Peak| | 0.1556| 1.119 >>> ---------------+--------+--------+--------- >>> RxCan2[1b8] Avg| 0.00| 0.0000| 0.022 >>> Peak| | 0.1704| 0.616 >>> ---------------+--------+--------+--------- >>> RxCan2[1c0] Avg| 0.00| 0.0000| 0.023 >>> Peak| | 0.1317| 0.488 >>> ---------------+--------+--------+--------- >>> RxCan2[1e0] Avg| 0.00| 0.0000| 0.025 >>> Peak| | 0.1460| 0.675 >>> ---------------+--------+--------+--------- >>> RxCan2[215] Avg| 0.00| 0.0000| 0.023 >>> Peak| | 0.1191| 0.567 >>> ---------------+--------+--------+--------- >>> RxCan2[217] Avg| 0.00| 0.0000| 0.023 >>> Peak| | 0.1167| 0.869 >>> ---------------+--------+--------+--------- >>> RxCan2[220] Avg| 0.00| 0.0000| 0.023 >>> Peak| | 0.0918| 0.313 >>> ---------------+--------+--------+--------- >>> RxCan2[225] Avg| 0.00| 0.0000| 0.025 >>> Peak| | 0.3635| 1.018 >>> ---------------+--------+--------+--------- >>> RxCan2[230] Avg| 0.00| 0.0000| 0.057 >>> Peak| | 0.2192| 1.063 >>> ---------------+--------+--------+--------- >>> RxCan2[240] Avg| 0.00| 0.0000| 0.023 >>> Peak| | 0.1173| 0.760 >>> ---------------+--------+--------+--------- >>> RxCan2[241] Avg| 0.00| 0.0000| 0.022 >>> Peak| | 0.2830| 1.144 >>> ---------------+--------+--------+--------- >>> RxCan2[250] Avg| 0.00| 0.0000| 0.026 >>> Peak| | 0.0701| 0.698 >>> ---------------+--------+--------+--------- >>> RxCan2[255] Avg| 0.00| 0.0000| 0.022 >>> Peak| | 0.1755| 1.063 >>> ---------------+--------+--------+--------- >>> RxCan2[265] Avg| 0.00| 0.0000| 0.024 >>> Peak| | 0.1771| 0.729 >>> ---------------+--------+--------+--------- >>> RxCan2[270] Avg| 0.00| 0.0000| 0.023 >>> Peak| | 0.0667| 0.307 >>> ---------------+--------+--------+--------- >>> RxCan2[290] Avg| 0.00| 0.0000| 0.022 >>> Peak| | 0.0410| 0.280 >>> ---------------+--------+--------+--------- >>> RxCan2[295] Avg| 0.00| 0.0000| 0.023 >>> Peak| | 0.0881| 0.299 >>> ---------------+--------+--------+--------- >>> RxCan2[2a0] Avg| 0.00| 0.0000| 0.023 >>> Peak| | 0.0420| 0.268 >>> ---------------+--------+--------+--------- >>> RxCan2[2a7] Avg| 0.00| 0.0000| 0.021 >>> Peak| | 0.1716| 0.454 >>> ---------------+--------+--------+--------- >>> RxCan2[2b0] Avg| 0.00| 0.0000| 0.023 >>> Peak| | 0.0424| 0.300 >>> ---------------+--------+--------+--------- >>> RxCan2[2c0] Avg| 0.00| 0.0000| 0.024 >>> Peak| | 0.0470| 0.298 >>> ---------------+--------+--------+--------- >>> RxCan2[2e0] Avg| 0.00| 0.0000| 0.030 >>> Peak| | 0.0324| 1.152 >>> ---------------+--------+--------+--------- >>> RxCan2[2f0] Avg| 0.00| 0.0000| 0.024 >>> Peak| | 0.0229| 0.359 >>> ---------------+--------+--------+--------- >>> RxCan2[2f5] Avg| 0.00| 0.0000| 0.026 >>> Peak| | 0.1882| 0.673 >>> ---------------+--------+--------+--------- >>> RxCan2[300] Avg| 0.00| 0.0000| 0.022 >>> Peak| | 0.0186| 0.263 >>> ---------------+--------+--------+--------- >>> RxCan2[310] Avg| 0.00| 0.0000| 0.024 >>> Peak| | 0.0210| 0.265 >>> ---------------+--------+--------+--------- >>> RxCan2[320] Avg| 0.00| 0.0000| 0.025 >>> Peak| | 0.0207| 0.354 >>> ---------------+--------+--------+--------- >>> RxCan2[326] Avg| 0.00| 0.0000| 0.023 >>> Peak| | 0.1466| 0.686 >>> ---------------+--------+--------+--------- >>> RxCan2[330] Avg| 0.00| 0.0000| 0.022 >>> Peak| | 0.4580| 0.708 >>> ---------------+--------+--------+--------- >>> RxCan2[340] Avg| 0.00| 0.0000| 0.031 >>> Peak| | 0.1621| 0.785 >>> ---------------+--------+--------+--------- >>> RxCan2[345] Avg| 0.00| 0.0000| 0.021 >>> Peak| | 0.0199| 0.261 >>> ---------------+--------+--------+--------- >>> RxCan2[35e] Avg| 0.00| 0.0000| 0.023 >>> Peak| | 0.0686| 0.449 >>> ---------------+--------+--------+--------- >>> RxCan2[360] Avg| 0.00| 0.0000| 0.025 >>> Peak| | 0.0204| 0.289 >>> ---------------+--------+--------+--------- >>> RxCan2[361] Avg| 0.00| 0.0000| 0.022 >>> Peak| | 0.1166| 0.316 >>> ---------------+--------+--------+--------- >>> RxCan2[363] Avg| 0.00| 0.0000| 0.023 >>> Peak| | 0.0146| 0.304 >>> ---------------+--------+--------+--------- >>> RxCan2[370] Avg| 0.00| 0.0000| 0.024 >>> Peak| | 0.0099| 0.278 >>> ---------------+--------+--------+--------- >>> RxCan2[381] Avg| 0.00| 0.0000| 0.025 >>> Peak| | 0.0468| 0.459 >>> ---------------+--------+--------+--------- >>> RxCan2[3a0] Avg| 0.00| 0.0000| 0.021 >>> Peak| | 0.2339| 0.617 >>> ---------------+--------+--------+--------- >>> RxCan2[3d0] Avg| 0.00| 0.0000| 0.022 >>> Peak| | 0.1351| 0.351 >>> ---------------+--------+--------+--------- >>> RxCan2[3d5] Avg| 0.00| 0.0000| 0.023 >>> Peak| | 0.0796| 0.692 >>> ---------------+--------+--------+--------- >>> RxCan2[400] Avg| 0.00| 0.0000| 0.023 >>> Peak| | 0.0537| 0.307 >>> ---------------+--------+--------+--------- >>> RxCan2[405] Avg| 0.00| 0.0000| 0.021 >>> Peak| | 0.0513| 0.303 >>> ---------------+--------+--------+--------- >>> RxCan2[40a] Avg| 0.00| 0.0000| 0.022 >>> Peak| | 0.1099| 0.313 >>> ---------------+--------+--------+--------- >>> RxCan2[415] Avg| 0.00| 0.0000| 0.022 >>> Peak| | 0.0204| 0.251 >>> ---------------+--------+--------+--------- >>> RxCan2[435] Avg| 0.00| 0.0000| 0.028 >>> Peak| | 0.0113| 0.342 >>> ---------------+--------+--------+--------- >>> RxCan2[440] Avg| 0.00| 0.0000| 0.027 >>> Peak| | 0.0110| 0.299 >>> ---------------+--------+--------+--------- >>> RxCan2[465] Avg| 0.00| 0.0000| 0.023 >>> Peak| | 0.0122| 0.295 >>> ---------------+--------+--------+--------- >>> RxCan2[466] Avg| 0.00| 0.0000| 0.022 >>> Peak| | 0.0117| 0.267 >>> ---------------+--------+--------+--------- >>> RxCan2[467] Avg| 0.00| 0.0000| 0.022 >>> Peak| | 0.0164| 0.325 >>> ---------------+--------+--------+--------- >>> RxCan2[501] Avg| 0.00| 0.0000| 0.023 >>> Peak| | 0.0236| 0.276 >>> ---------------+--------+--------+--------- >>> RxCan2[503] Avg| 0.00| 0.0000| 0.023 >>> Peak| | 0.0248| 0.349 >>> ---------------+--------+--------+--------- >>> RxCan2[504] Avg| 0.00| 0.0000| 0.023 >>> Peak| | 0.0230| 0.312 >>> ---------------+--------+--------+--------- >>> RxCan2[505] Avg| 0.00| 0.0000| 0.025 >>> Peak| | 0.0256| 0.310 >>> ---------------+--------+--------+--------- >>> RxCan2[508] Avg| 0.00| 0.0000| 0.023 >>> Peak| | 0.0281| 0.329 >>> ---------------+--------+--------+--------- >>> RxCan2[511] Avg| 0.00| 0.0000| 0.022 >>> Peak| | 0.0232| 0.282 >>> ---------------+--------+--------+--------- >>> RxCan2[51e] Avg| 0.00| 0.0000| 0.023 >>> Peak| | 0.0248| 0.298 >>> ---------------+--------+--------+--------- >>> RxCan2[581] Avg| 0.00| 0.0000| 0.025 >>> Peak| | 0.0166| 0.286 >>> ===============+========+========+========= >>> Total Avg| 0.00| 0.0000| 43.563 >>> >>> At the same time, calling poller times on, poller >>> times status causes the bus to crash, although no >>> polls are actively being sent at all. >>> >>> Cheers, >>> Simon >>> _______________________________________________ >>> OvmsDev mailing list >>> OvmsDev@lists.openvehicles.com >>> http://lists.openvehicles.com/mailman/listinfo/ovmsdev >>> >>> >>> _______________________________________________ >>> OvmsDev mailing list >>> OvmsDev@lists.openvehicles.com >>> http://lists.openvehicles.com/mailman/listinfo/ovmsdev >> >> _______________________________________________ >> OvmsDev mailing list >> OvmsDev@lists.openvehicles.com >> http://lists.openvehicles.com/mailman/listinfo/ovmsdev >
_______________________________________________ OvmsDev mailing list OvmsDev@lists.openvehicles.com http://lists.openvehicles.com/mailman/listinfo/ovmsdev
-- Michael Balzer *Am Rahmen 5 * D-58313 Herdecke <https://www.google.com/maps/search/Am+Rahmen+5+*+D-58313+Herdecke?entry=gmail&source=g> Fon 02330 9104094 * Handy 0176 20698926
_______________________________________________ OvmsDev mailing list OvmsDev@lists.openvehicles.com http://lists.openvehicles.com/mailman/listinfo/ovmsdev
_______________________________________________ OvmsDev mailing list OvmsDev@lists.openvehicles.com http://lists.openvehicles.com/mailman/listinfo/ovmsdev
_______________________________________________ OvmsDev mailing list OvmsDev@lists.openvehicles.com http://lists.openvehicles.com/mailman/listinfo/ovmsdev
-- Michael Balzer *Am Rahmen 5 * D-58313 Herdecke <https://www.google.com/maps/search/Am+Rahmen+5+*+D-58313+Herdecke?entry=gmail&source=g> Fon 02330 9104094 * Handy 0176 20698926
_______________________________________________ OvmsDev mailing list OvmsDev@lists.openvehicles.com http://lists.openvehicles.com/mailman/listinfo/ovmsdev
-- Michael Balzer * Am Rahmen 5 * D-58313 Herdecke Fon 02330 9104094 * Handy 0176 20698926
I may have expressed myself unclearly when I said that the poller is too slow in confirming. My statement referred to Mark's comment that it makes a difference whether the CAN is started in listen-only mode or active mode. Since this is a software-level decision, I assumed that the confirmation also occurs in the software rather than in the hardware. With the version from february 2024, this issue did not occur, even in active CAN mode. The error only started appearing now, among other things, in connection with the modified poller. However, I cannot say with certainty whether the poller is the actual cause. I only know that the change must have been made somewhere in the code between 19.02.2024 and 14.01.2025. I also do not know the priority at which the poller runs or whether it can influence this issue at all. However, since other vehicles also enter a fault mode with the modified poller, I consider it a possible cause. I also cannot explain why the IDs CAN1 076 and CAN2 100 exhibit such long peak times. I do not evaluate these modules myself. Here is a list of the MsgIDs I actually monitor. CAN1: 0x07A, 0x07A, 0x0C8, 0x118, 0x178, 0x1E4, 0x202, 0x242, 0x24C, 0x260, 0x2E4, 0x2EC, 0x352, 0x355, 0x367, 0x38B, 0x3B3, 0x405, 0x430, 0x435, 0x43D, 0x472, 0x473, 0x483 CAN2: 0x080, 0x230, 0x2F0, 0x340, 0x435 I will also review the corresponding code to ensure that no unnecessarily complex evaluations are being performed. Currently, the vehicle is on the road, and for safety reasons, I have temporarily flashed OVMS with the old firmware. I will provide a detailed timing analysis during a charging session as soon as possible. Thank you for your support in troubleshooting this issue! Cheers, Simon Am 17.01.2025 um 17:02 schrieb Michael Balzer via OvmsDev:
Michael,
we've got a sufficiently fast bus/ID filter class `canfilter`, used for the can logging filters. Reusing that would also keep the syntax identical. And I don't think it would be applied in the CAN task, the frames still need to be queued, just optionally not be included in the timing stats.
A quick & dirty test could be to exclude all IDs < 0x200 from the statistics. IDs below 0x200 will normally be used for high frequency process data frames. But that would hide processing issues with these…
…and @Simon, there are already two suspiciously long peak times for frames in that range in your statistics:
Type | count | Utlztn | Time | per s | [%] | [ms] ---------------+--------+--------+--------- RxCan1[076] Avg| 0.00| 0.0000| 0.072 Peak| | 0.7818| 15.221 ---------------+--------+--------+--------- RxCan2[100] Avg| 0.00| 0.0000| 0.046 Peak| | 0.4506| 21.961 ---------------+--------+--------+---------
I'd have a look at these first. Btw, can you provide timing stats for a longer collection period (in listen mode)?
Regards, Michael
Am 17.01.25 um 14:51 schrieb Michael Geddes:
Yep, pretty much
Inline below.
Also I wonder if something is causing the module to sleep or reboot and the wakeup is sending that bus wakeup Frame Michael B was talking about.
//.ichael
On Fri, 17 Jan 2025, 18:09 Michael Balzer via OvmsDev, <ovmsdev@lists.openvehicles.com> wrote:
Simon,
AFAIK "Pollers[Send]" is the regular "next round" request for the polling task, not a frame transmission.
Yep exactly.
A TX attempt in listen mode would produce a warn level log entry "Cannot write <busname> when not in ACTIVE mode" for tag "esp32can" or "mcp2515".
With the old poller, you wouldn't have had any indication of a queue overflow, so the new poller may help you to identify an issue in your code.
You need to understand the new poller not only does polls, it's now the main CAN receiver for the vehicle module. That's why your poller time stats include all process data frames as well, not only protocol frames.
The overflow means either your CAN processing is too slow to keep up with the packets received, or some other task is hogging the CPU. That would need to be a task with an equal or higher priority as the vehicle task, which has priority level 10 -- only system & networking tasks are above, so that's not likely. (You can check the CPU usage with the "module tasks" command.)
I wonder whether some kind of filter before queueing the Frame might work. It would have to be quick and simple as it would be executing in the CAN task I think.
That means you should check your standard frame processing (`IncomingFrameCanX` callbacks) for potential delays and processing complexity issues.
The poller statistics can help you track this down, but you need to have at least 10 seconds of statistics, the more the better. Rule of thumb: PRI average at 0.0/second means you don't have enough data yet. (-- //.ichael, correct me if I'm wrong)
It's either that or we are rounding badly. I can check.
At the same time, calling poller times on, poller times status causes the bus to crash
In any case that still doesn't explain how the poller could possibly cause a CAN bus (!) crash without actually doing any transmissions.
How does the CAN bus crash manifest?
Regards, Michael
Am 15.01.25 um 19:54 schrieb Simon Ehlen via OvmsDev:
I put the two buses back into listen mode and drove a short distance and charged the car. As I said, there is no active polling in my code. As expected, there is therefore no indication of a failed TX attempt in the console log. I only continue to see a lot of RX Task Queue Overflow messages in the log, which I did not have before. I also see a Pollers[Send]: Task Queue Overflow entry, but since I don't see any indication of “cannot write” on that, I'm not assuming that's a “real” send.
I (19760210) vehicle-poll: Poller[Frame]: RX Task Queue Overflow Run 5 I (19764420) vehicle-poll: Poller[Frame]: RX Task Queue Overflow Run 1 I (19764420) vehicle-poll: Poller[Frame]: RX Task Queue Overflow Run 3 I (19764420) vehicle-poll: Poller[Frame]: RX Task Queue Overflow Run 1 I (19764740) vehicle-poll: Poller[Frame]: RX Task Queue Overflow Run 1 I (19764740) vehicle-poll: Poller[Frame]: RX Task Queue Overflow Run 1 I (19764740) vehicle-poll: Poller[Frame]: RX Task Queue Overflow Run 1 I (19764740) vehicle-poll: Poller[Frame]: RX Task Queue Overflow Run 1 I (19764740) vehicle-poll: Poller[Frame]: RX Task Queue Overflow Run 1 I (19764750) vehicle-poll: Poller[Frame]: RX Task Queue Overflow Run 2 I (19764750) vehicle-poll: Poller[Frame]: RX Task Queue Overflow Run 1 I (19764750) vehicle-poll: Poller[Frame]: RX Task Queue Overflow Run 2 I (19764870) vehicle-poll: Poller[Frame]: RX Task Queue Overflow Run 1 I (19764870) vehicle-poll: Poller[Frame]: RX Task Queue Overflow Run 2 I (19765270) vehicle-poll: Poller[Frame]: RX Task Queue Overflow Run 4 I (19765270) vehicle-poll: Poller[Frame]: RX Task Queue Overflow Run 6 I (19765610) vehicle-poll: Poller[Frame]: RX Task Queue Overflow Run 3 I (19765930) vehicle-poll: Poller[Frame]: RX Task Queue Overflow Run 1 I (19765930) vehicle-poll: Poller[Frame]: RX Task Queue Overflow Run 3 I (19765930) vehicle-poll: Poller[Frame]: RX Task Queue Overflow Run 1 I (19766260) vehicle-poll: Poller[Frame]: RX Task Queue Overflow Run 50 I (19766260) vehicle-poll: Poller[Frame]: RX Task Queue Overflow Run 48 I (19766260) vehicle-poll: Poller[Frame]: RX Task Queue Overflow Run 27 I (19766270) vehicle-poll: Poller[Frame]: RX Task Queue Overflow Run 6 I (19766270) vehicle-poll: Poller[Frame]: RX Task Queue Overflow Run 4 E (19766280) can: can2: intr=4754831 rxpkt=4757493 txpkt=0 errflags=0x22401c02 rxerr=0 txerr=0 rxinval=0 rxovr=0 txovr=0 txdelay=0 txfail=0 wdgreset=1 errreset=0 E (19766300) can: can2: intr=4754831 rxpkt=4757494 txpkt=0 errflags=0x23401c01 rxerr=0 txerr=0 rxinval=0 rxovr=0 txovr=0 txdelay=0 txfail=0 wdgreset=1 errreset=0 I (19766300) vehicle-poll: Poller[Frame]: RX Task Queue Overflow Run 7 I (19766340) vehicle-poll: Poller[Frame]: RX Task Queue Overflow Run 39 I (19766350) vehicle-poll: Poller[Frame]: RX Task Queue Overflow Run 32 I (19766350) vehicle-poll: Poller[Frame]: RX Task Queue Overflow Run 17 I (19766350) vehicle-poll: Poller[Frame]: RX Task Queue Overflow Run 3 I (19766350) vehicle-poll: Pollers[Send]: Task Queue Overflow I (19766350) vehicle-poll: Poller[Frame]: RX Task Queue Overflow Run 1 I (19766350) vehicle-poll: Poller[Frame]: RX Task Queue Overflow Run 1 E (19766360) can: can2: intr=4754840 rxpkt=4757509 txpkt=0 errflags=0x22401c02 rxerr=0 txerr=0 rxinval=0 rxovr=0 txovr=0 txdelay=0 txfail=0 wdgreset=1 errreset=0 I (19766370) vehicle-poll: Poller[Frame]: RX Task Queue Overflow Run 4 E (19766370) can: can2: intr=4754840 rxpkt=4757510 txpkt=0 errflags=0x23401c01 rxerr=0 txerr=0 rxinval=0 rxovr=0 txovr=0 txdelay=0 txfail=0 wdgreset=1 errreset=0 I (19766430) vehicle-poll: Poller[Frame]: RX Task Queue Overflow Run 30 I (19766430) vehicle-poll: Poller[Frame]: RX Task Queue Overflow Run 36 I (19766430) vehicle-poll: Poller[Frame]: RX Task Queue Overflow Run 26 I (19766430) vehicle-poll: Poller[Frame]: RX Task Queue Overflow Run 4 I (19766430) vehicle-poll: Poller[Frame]: RX Task Queue Overflow Run 3 I (19766430) vehicle-poll: Poller[Frame]: RX Task Queue Overflow Run 2 I (19766430) vehicle-poll: Poller[Frame]: RX Task Queue Overflow Run 1 E (19766450) can: can2: intr=4754855 rxpkt=4757535 txpkt=0 errflags=0x23001001 rxerr=0 txerr=0 rxinval=0 rxovr=0 txovr=0 txdelay=0 txfail=0 wdgreset=1 errreset=0 E (19766460) can: can2: intr=4754855 rxpkt=4757536 txpkt=0 errflags=0x23401c01 rxerr=0 txerr=0 rxinval=0 rxovr=0 txovr=0 txdelay=0 txfail=0 wdgreset=1 errreset=0 E (19766520) can: can2: intr=4754855 rxpkt=4757539 txpkt=0 errflags=0x22001002 rxerr=0 txerr=0 rxinval=0 rxovr=0 txovr=0 txdelay=0 txfail=0 wdgreset=1 errreset=0 I (19766520) vehicle-poll: Poller[Frame]: RX Task Queue Overflow Run 9 I (19766520) vehicle-poll: Poller[Frame]: RX Task Queue Overflow Run 37 I (19766520) vehicle-poll: Poller[Frame]: RX Task Queue Overflow Run 30 I (19766520) vehicle-poll: Poller[Frame]: RX Task Queue Overflow Run 6 I (19766520) vehicle-poll: Poller[Frame]: RX Task Queue Overflow Run 2 I (19766520) vehicle-poll: Poller[Frame]: RX Task Queue Overflow Run 1 I (19766520) vehicle-poll: Poller[Frame]: RX Task Queue Overflow Run 1 I (19766520) vehicle-poll: Poller[Frame]: RX Task Queue Overflow Run 3 I (19766530) vehicle-poll: Poller[Frame]: RX Task Queue Overflow Run 1 I (19766530) vehicle-poll: Poller[Frame]: RX Task Queue Overflow Run 1 I (19766530) vehicle-poll: Poller[Frame]: RX Task Queue Overflow Run 1 E (19766540) can: can2: intr=4754861 rxpkt=4757548 txpkt=0 errflags=0x23401c01 rxerr=0 txerr=0 rxinval=0 rxovr=0 txovr=0 txdelay=0 txfail=0 wdgreset=1 errreset=0 I (19766550) vehicle-poll: Poller[Frame]: RX Task Queue Overflow Run 3 E (19766560) can: can2: intr=4754861 rxpkt=4757552 txpkt=0 errflags=0x23001001 rxerr=0 txerr=0 rxinval=0 rxovr=0 txovr=0 txdelay=0 txfail=0 wdgreset=1 errreset=0 E (19766610) can: can2: intr=4754861 rxpkt=4757553 txpkt=0 errflags=0x23401c01 rxerr=0 txerr=0 rxinval=0 rxovr=0 txovr=0 txdelay=0 txfail=0 wdgreset=1 errreset=0 I (19766610) vehicle-poll: Poller[Frame]: RX Task Queue Overflow Run 4 I (19766610) vehicle-poll: Poller[Frame]: RX Task Queue Overflow Run 5 I (19766610) vehicle-poll: Poller[Frame]: RX Task Queue Overflow Run 33 I (19766610) vehicle-poll: Poller[Frame]: RX Task Queue Overflow Run 34 I (19766610) vehicle-poll: Poller[Frame]: RX Task Queue Overflow Run 12 W (19767070) websocket: WebSocketHandler[0x3f8d79d8]: job queue overflow detected W (19767140) websocket: WebSocketHandler[0x3f8d79d8]: job queue overflow detected W (19767180) websocket: WebSocketHandler[0x3f8d79d8]: job queue overflow resolved, 1 drops W (19767260) websocket: WebSocketHandler[0x3f8d79d8]: job queue overflow detected W (19767310) websocket: WebSocketHandler[0x3f8d79d8]: job queue overflow resolved, 1 drops
Cheers Simon
Am 15.01.2025 um 19:18 schrieb Derek Caudwell via OvmsDev:
Since the following email I have high confidence the issue on the Leaf is related/caused by the poller as there has been no further occurrence and Chris has also experienced the car going to neutral on the new poller firmware.
.... I haven't ruled out it being a fault with my car yet. Shortly after it faulted the car was run into so has been off the road for sometime, my first step was to replace 12V battery. The ovms unit is now unplugged and if it does not fault over the next month while driving I'll be reasonably confident it's ovms related.
Not sure which firmware version the poller updates were included in but it was only after upgrading to it that the errors occurred (which could be coincidental however it has faulted twice more both on version 3.3.004-141-gf729d82c). For periods where I reverted to 3.3.003 it was fine.
It might be useful to have an extra option on the enable can write to only enable it when the car is parked/charging.
On Wed, 15 Jan 2025, 11:11 pm Michael Balzer via OvmsDev, <ovmsdev@lists.openvehicles.com> wrote:
Derek, can you comment on this? Do you still have the issue mentioned?
Speaking of the Leaf, the code there actually does something fishy in `CommandWakeup()`:
unsigned char data = 0; … m_can1->WriteStandard(0x5C0, *_8_*, &data); //Wakes up the VCM (by spoofing empty battery request heating)
And there are CAN transmissions from command execution in the Leaf code, so to be sure there is no TX, listen mode is needed there as well.
Regarding CAN trace, you can try with the monitor channel and use the USB console to record the log output. That way you should be able to at least rule out there are regular transmissions -- assuming not every TX will cause an immediate crash.
Another / probably better option: when in listen mode, the log will also tell you about TX attempts, as the driver will issue a warning on each.
The CAN monitor log may also tell you about bus errors detected.
Regards, Michael
Am 15.01.25 um 10:44 schrieb Simon Ehlen via OvmsDev:
There is at least one more Leaf from Derek that has also ended up in limp mode since the new poller. There, too, no polling was actually carried out while driving. I'm not familiar with the framework at all, but does this perhaps offer you enough of an approach to recognize a commonality?
Unfortunately I do not have a tool to create a CAN trace. I can't use the OVMS for this, as it no longer responds after a bus crash until I have disconnected it from the OBD and plugged it back in.
Cheers, Simon
Am 15.01.2025 um 10:18 schrieb Michael Balzer via OvmsDev:
The frame acknowledging is done automatically by the CAN transceiver when in active mode, this is part of the CAN protocol to indicate bit errors to the sender.
So normally a failure of the system to process received frames fast enough cannot cause any issue on the bus. But the ESP32 has a range of known hardware issues, especially in the embedded CAN transceiver, I wouldn't be surprised if there are more, or if our driver lacks some workaround for these.
Maybe the new poller has some bug that causes false transmissions from process data frames received. But many vehicles send process data frames, and we've had no issue reports like this on any of them, and ECUs also normally simply ignore out of sequence protocol frames.
You could record a CAN trace to see if there are transmissions, and what kind. If you don't poll and don't send frames from your code, there should be none. If the bus still crashes, that would be an indicator for something going wrong in the transceiver.
Regards, Michael
Am 15.01.25 um 07:15 schrieb Simon Ehlen via OvmsDev: > Thanks Mark for the explanation. > So does this mean that OVMS tries to acknowledge all incoming messages in active mode? > This seems to me to clearly exceed the capacity of OVMS with the mass of incoming messages. > > In fact, I am currently opening the bus in active mode, as I was hoping to get my code to revive the BMS in OVMS to work. > However, unlike the other data, I only get the cell voltages when I actively poll them. > To be on the safe side, I will now open the bus in read mode again. > > However, I am still wondering what in the poller change has altered the OVMS in such a way that the bus is now crashing completely. > Currently I have undone the changes since february 2024, this only concerns code from the public repository, there was no change from me in that period. > Now the OVMS is running stable again and there are neither queue overflows nor bus crashes. > > I had also previously increased the following queue sizes, but unfortunately this was not successful: > CONFIG_OVMS_HW_EVENT_QUEUE_SIZE=120 > CONFIG_OVMS_HW_CAN_RX_QUEUE_SIZE=80 > CONFIG_OVMS_VEHICLE_CAN_RX_QUEUE_SIZE=80 > > Cheers, > Simon > > Am 15.01.2025 um 02:08 schrieb Mark Webb-Johnson: >> Note sure if this helps, but some comments: >> >> * Remember than CAN protocol in normal mode is an ‘active’ protocol. Nodes on the bus are actively acknowledging messages (and that includes OVMS), even if they never write messages. So in normal mode there is no absolute ‘read access’. For example, opening the CAN port at the wrong baud rate, even if not writing messages, will mess up the bus. >> >> >> * However, if you open the CAN port in ‘listen’ mode, then it is truly read-only. In that mode it will not acknowledge messages, and cannot write on the bus at all. I’ve never seen an OVMS mess up a bus in listen mode, even if the baud rate is wrong. I think the only way for that to happen would be a hardware layer issue (cabling, termination, etc). >> >> >> Regards, Mark. >> >>> On 15 Jan 2025, at 6:30 AM, Simon Ehlen via OvmsDev <ovmsdev@lists.openvehicles.com> <mailto:ovmsdev@lists.openvehicles.com> wrote: >>> >>> But what is the reason that a read access to the bus can cause the bus to crash? >>> This is not critical during charging, it just aborts the charging process with an error. >>> While driving, this results in a “stop safely now” error message on the dashboard and the engine is switched off immediately. >>> >>> Cheers, >>> Simon >>> >>> Am 14.01.2025 um 23:22 schrieb Michael Geddes via OvmsDev: >>>> You may need to increase the queue size for the poll task queue. >>>> >>>> The poller still handles the bus to vehicle notifications even if it is off. >>>> >>>> Any poller logging on such an intensive load of can messages is likely to be a problem. This is part of the reason it is flagged off. >>>> >>>> The total % looks wrong :/ >>>> >>>> //.ichael >>>> >>>> >>>> >>>> >>>> On Wed, 15 Jan 2025, 03:17 Simon Ehlen via OvmsDev, <ovmsdev@lists.openvehicles.com> wrote: >>>> >>>> Hi, >>>> >>>> I finally got around to merging my code with the current master (previous merge february 2024). >>>> I have rebuilt my code for a Ford Focus Electric so that it uses the new OvmsPoller class. >>>> >>>> However, I now see a lot of entries like this in my log: >>>> >>>> I (246448) vehicle-poll: Poller[Frame]: RX Task Queue Overflow Run 8 >>>> I (246448) vehicle-poll: Poller[Frame]: RX Task Queue Overflow Run 3 >>>> I (246448) vehicle-poll: Poller[Frame]: RX Task Queue Overflow Run 1 >>>> I (246448) vehicle-poll: Poller[Frame]: RX Task Queue Overflow Run 2 >>>> I (246448) vehicle-poll: Poller[Frame]: RX Task Queue Overflow Run 1 >>>> I (246448) vehicle-poll: Poller[Frame]: RX Task Queue Overflow Run 2 >>>> I (246448) vehicle-poll: Poller[Frame]: RX Task Queue Overflow Run 1 >>>> I (246448) vehicle-poll: Poller[Frame]: RX Task Queue Overflow Run 1 >>>> I (254448) vehicle-poll: Poller[Frame]: RX Task Queue Overflow Run 24 >>>> I (254448) vehicle-poll: Poller[Frame]: RX Task Queue Overflow Run 1 >>>> I (254448) vehicle-poll: Poller[Frame]: RX Task Queue Overflow Run 1 >>>> I (254448) vehicle-poll: Poller[Frame]: RX Task Queue Overflow Run 1 >>>> I (254448) vehicle-poll: Poller[Frame]: RX Task Queue Overflow Run 1 >>>> I (254448) vehicle-poll: Poller[Frame]: RX Task Queue Overflow Run 1 >>>> I (254448) vehicle-poll: Poller[Frame]: RX Task Queue Overflow Run 1 >>>> >>>> Was this message just hidden before or do I need to make further adjustments to my code? >>>> >>>> My code currently does not use active polling but reads on the busses (IncomingFrameCanX) on certain modules. >>>> >>>> When I look at poller times status, it looks very extensive to me... >>>> >>>> OVMS# poller times status >>>> Poller timing is: on >>>> Type | count | Utlztn | Time >>>> | per s | [%] | [ms] >>>> ---------------+--------+--------+--------- >>>> Poll:PRI Avg| 0.00| 0.0000| 0.003 >>>> Peak| | 0.0014| 0.041 >>>> ---------------+--------+--------+--------- >>>> RxCan1[010] Avg| 0.00| 0.0000| 0.020 >>>> Peak| | 1.2217| 1.089 >>>> ---------------+--------+--------+--------- >>>> RxCan1[030] Avg| 0.00| 0.0000| 0.024 >>>> Peak| | 1.2193| 1.241 >>>> ---------------+--------+--------+--------- >>>> RxCan1[041] Avg| 0.00| 0.0000| 0.023 >>>> Peak| | 0.6460| 1.508 >>>> ---------------+--------+--------+--------- >>>> RxCan1[049] Avg| 0.00| 0.0000| 0.024 >>>> Peak| | 0.6320| 0.630 >>>> ---------------+--------+--------+--------- >>>> RxCan1[04c] Avg| 0.00| 0.0000| 0.023 >>>> Peak| | 0.6430| 1.474 >>>> ---------------+--------+--------+--------- >>>> RxCan1[04d] Avg| 0.00| 0.0000| 0.022 >>>> Peak| | 1.2987| 1.359 >>>> ---------------+--------+--------+--------- >>>> RxCan1[076] Avg| 0.00| 0.0000| 0.072 >>>> Peak| | 0.7818| 15.221 >>>> ---------------+--------+--------+--------- >>>> RxCan1[077] Avg| 0.00| 0.0000| 0.022 >>>> Peak| | 0.6274| 0.955 >>>> ---------------+--------+--------+--------- >>>> RxCan1[07a] Avg| 0.00| 0.0000| 0.039 >>>> Peak| | 1.7602| 1.684 >>>> ---------------+--------+--------+--------- >>>> RxCan1[07d] Avg| 0.00| 0.0000| 0.023 >>>> Peak| | 0.6621| 1.913 >>>> ---------------+--------+--------+--------- >>>> RxCan1[0c8] Avg| 0.00| 0.0000| 0.026 >>>> Peak| | 0.6292| 1.412 >>>> ---------------+--------+--------+--------- >>>> RxCan1[11a] Avg| 0.00| 0.0000| 0.023 >>>> Peak| | 1.2635| 1.508 >>>> ---------------+--------+--------+--------- >>>> RxCan1[130] Avg| 0.00| 0.0000| 0.024 >>>> Peak| | 0.6548| 0.703 >>>> ---------------+--------+--------+--------- >>>> RxCan1[139] Avg| 0.00| 0.0000| 0.021 >>>> Peak| | 0.6002| 0.984 >>>> ---------------+--------+--------+--------- >>>> RxCan1[156] Avg| 0.00| 0.0000| 0.024 >>>> Peak| | 0.1225| 0.479 >>>> ---------------+--------+--------+--------- >>>> RxCan1[160] Avg| 0.00| 0.0000| 0.028 >>>> Peak| | 0.6586| 1.376 >>>> ---------------+--------+--------+--------- >>>> RxCan1[165] Avg| 0.00| 0.0000| 0.027 >>>> Peak| | 0.6368| 1.132 >>>> ---------------+--------+--------+--------- >>>> RxCan1[167] Avg| 0.00| 0.0000| 0.024 >>>> Peak| | 1.3009| 1.067 >>>> ---------------+--------+--------+--------- >>>> RxCan1[171] Avg| 0.00| 0.0000| 0.022 >>>> Peak| | 0.6590| 4.320 >>>> ---------------+--------+--------+--------- >>>> RxCan1[178] Avg| 0.00| 0.0000| 0.023 >>>> Peak| | 0.1161| 0.311 >>>> ---------------+--------+--------+--------- >>>> RxCan1[179] Avg| 0.00| 0.0000| 0.024 >>>> Peak| | 0.1236| 0.536 >>>> ---------------+--------+--------+--------- >>>> RxCan1[180] Avg| 0.00| 0.0000| 0.022 >>>> Peak| | 0.6472| 1.193 >>>> ---------------+--------+--------+--------- >>>> RxCan1[185] Avg| 0.00| 0.0000| 0.022 >>>> Peak| | 0.6777| 1.385 >>>> ---------------+--------+--------+--------- >>>> RxCan1[1a0] Avg| 0.00| 0.0000| 0.022 >>>> Peak| | 0.6486| 2.276 >>>> ---------------+--------+--------+--------- >>>> RxCan1[1e0] Avg| 0.00| 0.0000| 0.023 >>>> Peak| | 0.6725| 1.376 >>>> ---------------+--------+--------+--------- >>>> RxCan1[1e4] Avg| 0.00| 0.0000| 0.027 >>>> Peak| | 0.7370| 1.266 >>>> ---------------+--------+--------+--------- >>>> RxCan1[1f0] Avg| 0.00| 0.0000| 0.024 >>>> Peak| | 0.4253| 0.753 >>>> ---------------+--------+--------+--------- >>>> RxCan1[200] Avg| 0.00| 0.0000| 0.025 >>>> Peak| | 0.6262| 0.791 >>>> ---------------+--------+--------+--------- >>>> RxCan1[202] Avg| 0.00| 0.0000| 0.021 >>>> Peak| | 1.2915| 1.257 >>>> ---------------+--------+--------+--------- >>>> RxCan1[204] Avg| 0.00| 0.0000| 0.022 >>>> Peak| | 1.2620| 1.010 >>>> ---------------+--------+--------+--------- >>>> RxCan1[213] Avg| 0.00| 0.0000| 0.022 >>>> Peak| | 0.6331| 1.185 >>>> ---------------+--------+--------+--------- >>>> RxCan1[214] Avg| 0.00| 0.0000| 0.023 >>>> Peak| | 0.9977| 34.527 >>>> ---------------+--------+--------+--------- >>>> RxCan1[217] Avg| 0.00| 0.0000| 0.024 >>>> Peak| | 1.2825| 1.328 >>>> ---------------+--------+--------+--------- >>>> RxCan1[218] Avg| 0.00| 0.0000| 0.022 >>>> Peak| | 0.6328| 1.110 >>>> ---------------+--------+--------+--------- >>>> RxCan1[230] Avg| 0.00| 0.0000| 0.019 >>>> Peak| | 0.6742| 5.119 >>>> ---------------+--------+--------+--------- >>>> RxCan1[240] Avg| 0.00| 0.0000| 0.022 >>>> Peak| | 0.1163| 0.343 >>>> ---------------+--------+--------+--------- >>>> RxCan1[242] Avg| 0.00| 0.0000| 0.025 >>>> Peak| | 0.3501| 1.015 >>>> ---------------+--------+--------+--------- >>>> RxCan1[24a] Avg| 0.00| 0.0000| 0.022 >>>> Peak| | 0.1212| 0.338 >>>> ---------------+--------+--------+--------- >>>> RxCan1[24b] Avg| 0.00| 0.0000| 0.023 >>>> Peak| | 0.1289| 0.330 >>>> ---------------+--------+--------+--------- >>>> RxCan1[24c] Avg| 0.00| 0.0000| 0.033 >>>> Peak| | 0.1714| 1.189 >>>> ---------------+--------+--------+--------- >>>> RxCan1[25a] Avg| 0.00| 0.0000| 0.024 >>>> Peak| | 0.1289| 0.510 >>>> ---------------+--------+--------+--------- >>>> RxCan1[25b] Avg| 0.00| 0.0000| 0.022 >>>> Peak| | 0.6685| 0.930 >>>> ---------------+--------+--------+--------- >>>> RxCan1[25c] Avg| 0.00| 0.0000| 0.027 >>>> Peak| | 1.3298| 2.670 >>>> ---------------+--------+--------+--------- >>>> RxCan1[260] Avg| 0.00| 0.0000| 0.023 >>>> Peak| | 0.1271| 0.401 >>>> ---------------+--------+--------+--------- >>>> RxCan1[270] Avg| 0.00| 0.0000| 0.022 >>>> Peak| | 0.6439| 0.898 >>>> ---------------+--------+--------+--------- >>>> RxCan1[280] Avg| 0.00| 0.0000| 0.023 >>>> Peak| | 0.6502| 1.156 >>>> ---------------+--------+--------+--------- >>>> RxCan1[2e4] Avg| 0.00| 0.0000| 0.035 >>>> Peak| | 0.3389| 0.811 >>>> ---------------+--------+--------+--------- >>>> RxCan1[2ec] Avg| 0.00| 0.0000| 0.027 >>>> Peak| | 0.1417| 0.784 >>>> ---------------+--------+--------+--------- >>>> RxCan1[2ed] Avg| 0.00| 0.0000| 0.024 >>>> Peak| | 0.1364| 0.746 >>>> ---------------+--------+--------+--------- >>>> RxCan1[2ee] Avg| 0.00| 0.0000| 0.024 >>>> Peak| | 0.1406| 0.965 >>>> ---------------+--------+--------+--------- >>>> RxCan1[312] Avg| 0.00| 0.0000| 0.023 >>>> Peak| | 0.1293| 0.978 >>>> ---------------+--------+--------+--------- >>>> RxCan1[326] Avg| 0.00| 0.0000| 0.024 >>>> Peak| | 0.1298| 0.518 >>>> ---------------+--------+--------+--------- >>>> RxCan1[336] Avg| 0.00| 0.0000| 0.028 >>>> Peak| | 0.0106| 0.329 >>>> ---------------+--------+--------+--------- >>>> RxCan1[352] Avg| 0.00| 0.0000| 0.030 >>>> Peak| | 0.1054| 0.800 >>>> ---------------+--------+--------+--------- >>>> RxCan1[355] Avg| 0.00| 0.0000| 0.027 >>>> Peak| | 0.0270| 0.546 >>>> ---------------+--------+--------+--------- >>>> RxCan1[35e] Avg| 0.00| 0.0000| 0.023 >>>> Peak| | 0.1288| 0.573 >>>> ---------------+--------+--------+--------- >>>> RxCan1[365] Avg| 0.00| 0.0000| 0.024 >>>> Peak| | 0.1297| 0.358 >>>> ---------------+--------+--------+--------- >>>> RxCan1[366] Avg| 0.00| 0.0000| 0.026 >>>> Peak| | 0.1429| 1.001 >>>> ---------------+--------+--------+--------- >>>> RxCan1[367] Avg| 0.00| 0.0000| 0.026 >>>> Peak| | 0.1472| 0.828 >>>> ---------------+--------+--------+--------- >>>> RxCan1[368] Avg| 0.00| 0.0000| 0.024 >>>> Peak| | 0.1323| 0.931 >>>> ---------------+--------+--------+--------- >>>> RxCan1[369] Avg| 0.00| 0.0000| 0.026 >>>> Peak| | 0.1498| 1.072 >>>> ---------------+--------+--------+--------- >>>> RxCan1[380] Avg| 0.00| 0.0000| 0.022 >>>> Peak| | 0.1285| 0.348 >>>> ---------------+--------+--------+--------- >>>> RxCan1[38b] Avg| 0.00| 0.0000| 0.021 >>>> Peak| | 0.3298| 1.168 >>>> ---------------+--------+--------+--------- >>>> RxCan1[3b3] Avg| 0.00| 0.0000| 0.025 >>>> Peak| | 0.1348| 0.920 >>>> ---------------+--------+--------+--------- >>>> RxCan1[400] Avg| 0.00| 0.0000| 0.022 >>>> Peak| | 0.0481| 0.445 >>>> ---------------+--------+--------+--------- >>>> RxCan1[405] Avg| 0.00| 0.0000| 0.034 >>>> Peak| | 0.0723| 0.473 >>>> ---------------+--------+--------+--------- >>>> RxCan1[40a] Avg| 0.00| 0.0000| 0.025 >>>> Peak| | 0.1040| 0.543 >>>> ---------------+--------+--------+--------- >>>> RxCan1[410] Avg| 0.00| 0.0000| 0.024 >>>> Peak| | 0.1339| 0.678 >>>> ---------------+--------+--------+--------- >>>> RxCan1[411] Avg| 0.00| 0.0000| 0.025 >>>> Peak| | 0.1376| 0.573 >>>> ---------------+--------+--------+--------- >>>> RxCan1[416] Avg| 0.00| 0.0000| 0.023 >>>> Peak| | 0.1284| 0.346 >>>> ---------------+--------+--------+--------- >>>> RxCan1[421] Avg| 0.00| 0.0000| 0.024 >>>> Peak| | 0.1323| 0.643 >>>> ---------------+--------+--------+--------- >>>> RxCan1[42d] Avg| 0.00| 0.0000| 0.023 >>>> Peak| | 0.1362| 1.146 >>>> ---------------+--------+--------+--------- >>>> RxCan1[42f] Avg| 0.00| 0.0000| 0.027 >>>> Peak| | 0.1503| 1.762 >>>> ---------------+--------+--------+--------- >>>> RxCan1[430] Avg| 0.00| 0.0000| 0.023 >>>> Peak| | 0.1352| 0.347 >>>> ---------------+--------+--------+--------- >>>> RxCan1[434] Avg| 0.00| 0.0000| 0.024 >>>> Peak| | 0.1312| 0.580 >>>> ---------------+--------+--------+--------- >>>> RxCan1[435] Avg| 0.00| 0.0000| 0.029 >>>> Peak| | 0.1109| 1.133 >>>> ---------------+--------+--------+--------- >>>> RxCan1[43e] Avg| 0.00| 0.0000| 0.023 >>>> Peak| | 0.2776| 0.686 >>>> ---------------+--------+--------+--------- >>>> RxCan1[440] Avg| 0.00| 0.0000| 0.022 >>>> Peak| | 0.0118| 0.276 >>>> ---------------+--------+--------+--------- >>>> RxCan1[465] Avg| 0.00| 0.0000| 0.022 >>>> Peak| | 0.0118| 0.279 >>>> ---------------+--------+--------+--------- >>>> RxCan1[466] Avg| 0.00| 0.0000| 0.023 >>>> Peak| | 0.0123| 0.310 >>>> ---------------+--------+--------+--------- >>>> RxCan1[467] Avg| 0.00| 0.0000| 0.025 >>>> Peak| | 0.0132| 0.314 >>>> ---------------+--------+--------+--------- >>>> RxCan1[472] Avg| 0.00| 0.0000| 0.101 >>>> Peak| | 0.0307| 1.105 >>>> ---------------+--------+--------+--------- >>>> RxCan1[473] Avg| 0.00| 0.0000| 0.051 >>>> Peak| | 0.0107| 0.575 >>>> ---------------+--------+--------+--------- >>>> RxCan1[474] Avg| 0.00| 0.0000| 0.024 >>>> Peak| | 0.0097| 0.289 >>>> ---------------+--------+--------+--------- >>>> RxCan1[475] Avg| 0.00| 0.0000| 0.023 >>>> Peak| | 0.0220| 0.327 >>>> ---------------+--------+--------+--------- >>>> RxCan1[476] Avg| 0.00| 0.0000| 0.050 >>>> Peak| | 0.0762| 5.329 >>>> ---------------+--------+--------+--------- >>>> RxCan1[477] Avg| 0.00| 0.0000| 0.032 >>>> Peak| | 0.0283| 0.669 >>>> ---------------+--------+--------+--------- >>>> RxCan1[595] Avg| 0.00| 0.0000| 0.026 >>>> Peak| | 0.0103| 0.297 >>>> ---------------+--------+--------+--------- >>>> RxCan1[59e] Avg| 0.00| 0.0000| 0.022 >>>> Peak| | 0.0114| 0.263 >>>> ---------------+--------+--------+--------- >>>> RxCan1[5a2] Avg| 0.00| 0.0000| 0.026 >>>> Peak| | 0.0119| 0.505 >>>> ---------------+--------+--------+--------- >>>> RxCan1[5ba] Avg| 0.00| 0.0000| 0.025 >>>> Peak| | 0.0139| 0.549 >>>> ---------------+--------+--------+--------- >>>> RxCan2[020] Avg| 0.00| 0.0000| 0.026 >>>> Peak| | 0.4923| 1.133 >>>> ---------------+--------+--------+--------- >>>> RxCan2[030] Avg| 0.00| 0.0000| 0.023 >>>> Peak| | 0.3297| 1.136 >>>> ---------------+--------+--------+--------- >>>> RxCan2[03a] Avg| 0.00| 0.0000| 0.022 >>>> Peak| | 0.2792| 1.275 >>>> ---------------+--------+--------+--------- >>>> RxCan2[040] Avg| 0.00| 0.0000| 0.023 >>>> Peak| | 0.2834| 1.080 >>>> ---------------+--------+--------+--------- >>>> RxCan2[060] Avg| 0.00| 0.0000| 0.029 >>>> Peak| | 0.3037| 0.991 >>>> ---------------+--------+--------+--------- >>>> RxCan2[070] Avg| 0.00| 0.0000| 0.025 >>>> Peak| | 0.2291| 0.460 >>>> ---------------+--------+--------+--------- >>>> RxCan2[080] Avg| 0.00| 0.0000| 0.043 >>>> Peak| | 0.4015| 1.007 >>>> ---------------+--------+--------+--------- >>>> RxCan2[083] Avg| 0.00| 0.0000| 0.026 >>>> Peak| | 0.2957| 0.788 >>>> ---------------+--------+--------+--------- >>>> RxCan2[090] Avg| 0.00| 0.0000| 0.027 >>>> Peak| | 0.3951| 1.231 >>>> ---------------+--------+--------+--------- >>>> RxCan2[0a0] Avg| 0.00| 0.0000| 0.026 >>>> Peak| | 0.2560| 0.722 >>>> ---------------+--------+--------+--------- >>>> RxCan2[100] Avg| 0.00| 0.0000| 0.046 >>>> Peak| | 0.4506| 21.961 >>>> ---------------+--------+--------+--------- >>>> RxCan2[108] Avg| 0.00| 0.0000| 0.024 >>>> Peak| | 0.3713| 1.125 >>>> ---------------+--------+--------+--------- >>>> RxCan2[110] Avg| 0.00| 0.0000| 0.029 >>>> Peak| | 0.2443| 0.755 >>>> ---------------+--------+--------+--------- >>>> RxCan2[130] Avg| 0.00| 0.0000| 0.023 >>>> Peak| | 0.2052| 1.097 >>>> ---------------+--------+--------+--------- >>>> RxCan2[150] Avg| 0.00| 0.0000| 0.023 >>>> Peak| | 0.2246| 0.371 >>>> ---------------+--------+--------+--------- >>>> RxCan2[160] Avg| 0.00| 0.0000| 0.024 >>>> Peak| | 0.0755| 1.125 >>>> ---------------+--------+--------+--------- >>>> RxCan2[180] Avg| 0.00| 0.0000| 0.023 >>>> Peak| | 0.2350| 0.936 >>>> ---------------+--------+--------+--------- >>>> RxCan2[190] Avg| 0.00| 0.0000| 0.022 >>>> Peak| | 0.2275| 0.592 >>>> ---------------+--------+--------+--------- >>>> RxCan2[1a0] Avg| 0.00| 0.0000| 0.025 >>>> Peak| | 0.0125| 0.273 >>>> ---------------+--------+--------+--------- >>>> RxCan2[1a4] Avg| 0.00| 0.0000| 0.022 >>>> Peak| | 0.2806| 0.632 >>>> ---------------+--------+--------+--------- >>>> RxCan2[1a8] Avg| 0.00| 0.0000| 0.022 >>>> Peak| | 0.1683| 0.740 >>>> ---------------+--------+--------+--------- >>>> RxCan2[1b0] Avg| 0.00| 0.0000| 0.023 >>>> Peak| | 0.1360| 0.490 >>>> ---------------+--------+--------+--------- >>>> RxCan2[1b4] Avg| 0.00| 0.0000| 0.027 >>>> Peak| | 0.1556| 1.119 >>>> ---------------+--------+--------+--------- >>>> RxCan2[1b8] Avg| 0.00| 0.0000| 0.022 >>>> Peak| | 0.1704| 0.616 >>>> ---------------+--------+--------+--------- >>>> RxCan2[1c0] Avg| 0.00| 0.0000| 0.023 >>>> Peak| | 0.1317| 0.488 >>>> ---------------+--------+--------+--------- >>>> RxCan2[1e0] Avg| 0.00| 0.0000| 0.025 >>>> Peak| | 0.1460| 0.675 >>>> ---------------+--------+--------+--------- >>>> RxCan2[215] Avg| 0.00| 0.0000| 0.023 >>>> Peak| | 0.1191| 0.567 >>>> ---------------+--------+--------+--------- >>>> RxCan2[217] Avg| 0.00| 0.0000| 0.023 >>>> Peak| | 0.1167| 0.869 >>>> ---------------+--------+--------+--------- >>>> RxCan2[220] Avg| 0.00| 0.0000| 0.023 >>>> Peak| | 0.0918| 0.313 >>>> ---------------+--------+--------+--------- >>>> RxCan2[225] Avg| 0.00| 0.0000| 0.025 >>>> Peak| | 0.3635| 1.018 >>>> ---------------+--------+--------+--------- >>>> RxCan2[230] Avg| 0.00| 0.0000| 0.057 >>>> Peak| | 0.2192| 1.063 >>>> ---------------+--------+--------+--------- >>>> RxCan2[240] Avg| 0.00| 0.0000| 0.023 >>>> Peak| | 0.1173| 0.760 >>>> ---------------+--------+--------+--------- >>>> RxCan2[241] Avg| 0.00| 0.0000| 0.022 >>>> Peak| | 0.2830| 1.144 >>>> ---------------+--------+--------+--------- >>>> RxCan2[250] Avg| 0.00| 0.0000| 0.026 >>>> Peak| | 0.0701| 0.698 >>>> ---------------+--------+--------+--------- >>>> RxCan2[255] Avg| 0.00| 0.0000| 0.022 >>>> Peak| | 0.1755| 1.063 >>>> ---------------+--------+--------+--------- >>>> RxCan2[265] Avg| 0.00| 0.0000| 0.024 >>>> Peak| | 0.1771| 0.729 >>>> ---------------+--------+--------+--------- >>>> RxCan2[270] Avg| 0.00| 0.0000| 0.023 >>>> Peak| | 0.0667| 0.307 >>>> ---------------+--------+--------+--------- >>>> RxCan2[290] Avg| 0.00| 0.0000| 0.022 >>>> Peak| | 0.0410| 0.280 >>>> ---------------+--------+--------+--------- >>>> RxCan2[295] Avg| 0.00| 0.0000| 0.023 >>>> Peak| | 0.0881| 0.299 >>>> ---------------+--------+--------+--------- >>>> RxCan2[2a0] Avg| 0.00| 0.0000| 0.023 >>>> Peak| | 0.0420| 0.268 >>>> ---------------+--------+--------+--------- >>>> RxCan2[2a7] Avg| 0.00| 0.0000| 0.021 >>>> Peak| | 0.1716| 0.454 >>>> ---------------+--------+--------+--------- >>>> RxCan2[2b0] Avg| 0.00| 0.0000| 0.023 >>>> Peak| | 0.0424| 0.300 >>>> ---------------+--------+--------+--------- >>>> RxCan2[2c0] Avg| 0.00| 0.0000| 0.024 >>>> Peak| | 0.0470| 0.298 >>>> ---------------+--------+--------+--------- >>>> RxCan2[2e0] Avg| 0.00| 0.0000| 0.030 >>>> Peak| | 0.0324| 1.152 >>>> ---------------+--------+--------+--------- >>>> RxCan2[2f0] Avg| 0.00| 0.0000| 0.024 >>>> Peak| | 0.0229| 0.359 >>>> ---------------+--------+--------+--------- >>>> RxCan2[2f5] Avg| 0.00| 0.0000| 0.026 >>>> Peak| | 0.1882| 0.673 >>>> ---------------+--------+--------+--------- >>>> RxCan2[300] Avg| 0.00| 0.0000| 0.022 >>>> Peak| | 0.0186| 0.263 >>>> ---------------+--------+--------+--------- >>>> RxCan2[310] Avg| 0.00| 0.0000| 0.024 >>>> Peak| | 0.0210| 0.265 >>>> ---------------+--------+--------+--------- >>>> RxCan2[320] Avg| 0.00| 0.0000| 0.025 >>>> Peak| | 0.0207| 0.354 >>>> ---------------+--------+--------+--------- >>>> RxCan2[326] Avg| 0.00| 0.0000| 0.023 >>>> Peak| | 0.1466| 0.686 >>>> ---------------+--------+--------+--------- >>>> RxCan2[330] Avg| 0.00| 0.0000| 0.022 >>>> Peak| | 0.4580| 0.708 >>>> ---------------+--------+--------+--------- >>>> RxCan2[340] Avg| 0.00| 0.0000| 0.031 >>>> Peak| | 0.1621| 0.785 >>>> ---------------+--------+--------+--------- >>>> RxCan2[345] Avg| 0.00| 0.0000| 0.021 >>>> Peak| | 0.0199| 0.261 >>>> ---------------+--------+--------+--------- >>>> RxCan2[35e] Avg| 0.00| 0.0000| 0.023 >>>> Peak| | 0.0686| 0.449 >>>> ---------------+--------+--------+--------- >>>> RxCan2[360] Avg| 0.00| 0.0000| 0.025 >>>> Peak| | 0.0204| 0.289 >>>> ---------------+--------+--------+--------- >>>> RxCan2[361] Avg| 0.00| 0.0000| 0.022 >>>> Peak| | 0.1166| 0.316 >>>> ---------------+--------+--------+--------- >>>> RxCan2[363] Avg| 0.00| 0.0000| 0.023 >>>> Peak| | 0.0146| 0.304 >>>> ---------------+--------+--------+--------- >>>> RxCan2[370] Avg| 0.00| 0.0000| 0.024 >>>> Peak| | 0.0099| 0.278 >>>> ---------------+--------+--------+--------- >>>> RxCan2[381] Avg| 0.00| 0.0000| 0.025 >>>> Peak| | 0.0468| 0.459 >>>> ---------------+--------+--------+--------- >>>> RxCan2[3a0] Avg| 0.00| 0.0000| 0.021 >>>> Peak| | 0.2339| 0.617 >>>> ---------------+--------+--------+--------- >>>> RxCan2[3d0] Avg| 0.00| 0.0000| 0.022 >>>> Peak| | 0.1351| 0.351 >>>> ---------------+--------+--------+--------- >>>> RxCan2[3d5] Avg| 0.00| 0.0000| 0.023 >>>> Peak| | 0.0796| 0.692 >>>> ---------------+--------+--------+--------- >>>> RxCan2[400] Avg| 0.00| 0.0000| 0.023 >>>> Peak| | 0.0537| 0.307 >>>> ---------------+--------+--------+--------- >>>> RxCan2[405] Avg| 0.00| 0.0000| 0.021 >>>> Peak| | 0.0513| 0.303 >>>> ---------------+--------+--------+--------- >>>> RxCan2[40a] Avg| 0.00| 0.0000| 0.022 >>>> Peak| | 0.1099| 0.313 >>>> ---------------+--------+--------+--------- >>>> RxCan2[415] Avg| 0.00| 0.0000| 0.022 >>>> Peak| | 0.0204| 0.251 >>>> ---------------+--------+--------+--------- >>>> RxCan2[435] Avg| 0.00| 0.0000| 0.028 >>>> Peak| | 0.0113| 0.342 >>>> ---------------+--------+--------+--------- >>>> RxCan2[440] Avg| 0.00| 0.0000| 0.027 >>>> Peak| | 0.0110| 0.299 >>>> ---------------+--------+--------+--------- >>>> RxCan2[465] Avg| 0.00| 0.0000| 0.023 >>>> Peak| | 0.0122| 0.295 >>>> ---------------+--------+--------+--------- >>>> RxCan2[466] Avg| 0.00| 0.0000| 0.022 >>>> Peak| | 0.0117| 0.267 >>>> ---------------+--------+--------+--------- >>>> RxCan2[467] Avg| 0.00| 0.0000| 0.022 >>>> Peak| | 0.0164| 0.325 >>>> ---------------+--------+--------+--------- >>>> RxCan2[501] Avg| 0.00| 0.0000| 0.023 >>>> Peak| | 0.0236| 0.276 >>>> ---------------+--------+--------+--------- >>>> RxCan2[503] Avg| 0.00| 0.0000| 0.023 >>>> Peak| | 0.0248| 0.349 >>>> ---------------+--------+--------+--------- >>>> RxCan2[504] Avg| 0.00| 0.0000| 0.023 >>>> Peak| | 0.0230| 0.312 >>>> ---------------+--------+--------+--------- >>>> RxCan2[505] Avg| 0.00| 0.0000| 0.025 >>>> Peak| | 0.0256| 0.310 >>>> ---------------+--------+--------+--------- >>>> RxCan2[508] Avg| 0.00| 0.0000| 0.023 >>>> Peak| | 0.0281| 0.329 >>>> ---------------+--------+--------+--------- >>>> RxCan2[511] Avg| 0.00| 0.0000| 0.022 >>>> Peak| | 0.0232| 0.282 >>>> ---------------+--------+--------+--------- >>>> RxCan2[51e] Avg| 0.00| 0.0000| 0.023 >>>> Peak| | 0.0248| 0.298 >>>> ---------------+--------+--------+--------- >>>> RxCan2[581] Avg| 0.00| 0.0000| 0.025 >>>> Peak| | 0.0166| 0.286 >>>> ===============+========+========+========= >>>> Total Avg| 0.00| 0.0000| 43.563 >>>> >>>> At the same time, calling poller times on, poller times status causes the bus to crash, although no polls are actively being sent at all. >>>> >>>> Cheers, >>>> Simon >>>> _______________________________________________ >>>> OvmsDev mailing list >>>> OvmsDev@lists.openvehicles.com >>>> http://lists.openvehicles.com/mailman/listinfo/ovmsdev >>>> >>>> >>>> _______________________________________________ >>>> OvmsDev mailing list >>>> OvmsDev@lists.openvehicles.com >>>> http://lists.openvehicles.com/mailman/listinfo/ovmsdev >>> >>> _______________________________________________ >>> OvmsDev mailing list >>> OvmsDev@lists.openvehicles.com >>> http://lists.openvehicles.com/mailman/listinfo/ovmsdev >> > > > _______________________________________________ > OvmsDev mailing list > OvmsDev@lists.openvehicles.com > http://lists.openvehicles.com/mailman/listinfo/ovmsdev
-- Michael Balzer *Am Rahmen 5 * D-58313 Herdecke <https://www.google.com/maps/search/Am+Rahmen+5+*+D-58313+Herdecke?entry=gmail&source=g> Fon 02330 9104094 * Handy 0176 20698926
_______________________________________________ OvmsDev mailing list OvmsDev@lists.openvehicles.com http://lists.openvehicles.com/mailman/listinfo/ovmsdev
_______________________________________________ OvmsDev mailing list OvmsDev@lists.openvehicles.com http://lists.openvehicles.com/mailman/listinfo/ovmsdev
_______________________________________________ OvmsDev mailing list OvmsDev@lists.openvehicles.com http://lists.openvehicles.com/mailman/listinfo/ovmsdev
-- Michael Balzer *Am Rahmen 5 * D-58313 Herdecke <https://www.google.com/maps/search/Am+Rahmen+5+*+D-58313+Herdecke?entry=gmail&source=g> Fon 02330 9104094 * Handy 0176 20698926
_______________________________________________ OvmsDev mailing list OvmsDev@lists.openvehicles.com http://lists.openvehicles.com/mailman/listinfo/ovmsdev
-- Michael Balzer * Am Rahmen 5 * D-58313 Herdecke Fon 02330 9104094 * Handy 0176 20698926
_______________________________________________ OvmsDev mailing list OvmsDev@lists.openvehicles.com http://lists.openvehicles.com/mailman/listinfo/ovmsdev

Yes, I can confirm I've had one experience of the Leaf switching to Neutral while driving, with a yellow warning symbol on the dash. It refused to reselect Drive until I had switched the car off and back on. Derek wasn't so lucky and he need to clear fault codes before the car would work. On returning home, I found OVMS was not accessible over a network. I didn't try a USB cable. Unplugging and reinserting the OBD cable caused OVMS to rejoin Wi-Fi. However the SD logs showed nothing from the time of the event. CAN writes are enabled, so it can perform SOC limiting. My car has been using this firmware since 21st November, based on the git master of that day. As a relatively new user of OVMS (only since October) I don't have much experience of older firmware. Perhaps a safeguard should be implemented before releasing a new stable firmware that will be automatically downloaded by Leaf owners. But I don't have the expertise to know what that safeguard should be. Derek's suggestion of 'only CAN write when parked' appears to be a good idea. Chris On 2025-01-15 18:18, Derek Caudwell via OvmsDev wrote:
Since the following email I have high confidence the issue on the Leaf is related/caused by the poller as there has been no further occurrence and Chris has also experienced the car going to neutral on the new poller firmware.
.... I haven't ruled out it being a fault with my car yet. Shortly after it faulted the car was run into so has been off the road for sometime, my first step was to replace 12V battery. The ovms unit is now unplugged and if it does not fault over the next month while driving I'll be reasonably confident it's ovms related.
Not sure which firmware version the poller updates were included in but it was only after upgrading to it that the errors occurred (which could be coincidental however it has faulted twice more both on version 3.3.004-141-gf729d82c). For periods where I reverted to 3.3.003 it was fine.
It might be useful to have an extra option on the enable can write to only enable it when the car is parked/charging.
OK, I've got a new idea: CAN timing. Comparing our esp32can bit timing to the esp-idf driver's, there seem to be some differences: https://github.com/espressif/esp-idf/blob/master/components/hal/include/hal/... Transceivers are normally tolerant to small timing offsets. Maybe being off a little bit has no effect under normal conditions, but it has when the transceiver has to cope with a filled RX queue. That could be causing the transceiver to slide just out of sync. If the timing gets garbled, the transceiver would signal errors in the packets to the bus, possibly so many the vehicle ECUs decide to raise an error condition. Is that plausible? On why the new poller could be causing this (in combination with too slow processing by the vehicle): as mentioned, the standard CAN listener mechanism doesn't care about queue overflows. The poller does. `OvmsPollers::Queue_PollerFrame()` does a log call when Tx/Rx tracing is enabled, that could even block, but tracing is optional and only meant for debugging. Not optional is the overflow counting using an atomic uint32. The atomic types are said to be fast, but I never checked their actual implementation on the ESP32. Maybe they can block as well? @Simon: it would be an option to try commenting out the overflow counting, to see if that's causing the issue. Regards, Michael Am 17.01.25 um 15:37 schrieb Chris Box via OvmsDev:
Yes, I can confirm I've had one experience of the Leaf switching to Neutral while driving, with a yellow warning symbol on the dash. It refused to reselect Drive until I had switched the car off and back on. Derek wasn't so lucky and he need to clear fault codes before the car would work.
On returning home, I found OVMS was not accessible over a network. I didn't try a USB cable. Unplugging and reinserting the OBD cable caused OVMS to rejoin Wi-Fi. However the SD logs showed nothing from the time of the event. CAN writes are enabled, so it can perform SOC limiting.
My car has been using this firmware since 21st November, based on the git master of that day. As a relatively new user of OVMS (only since October) I don't have much experience of older firmware.
Perhaps a safeguard should be implemented before releasing a new stable firmware that will be automatically downloaded by Leaf owners. But I don't have the expertise to know what that safeguard should be. Derek's suggestion of 'only CAN write when parked' appears to be a good idea.
Chris
On 2025-01-15 18:18, Derek Caudwell via OvmsDev wrote:
Since the following email I have high confidence the issue on the Leaf is related/caused by the poller as there has been no further occurrence and Chris has also experienced the car going to neutral on the new poller firmware.
.... I haven't ruled out it being a fault with my car yet. Shortly after it faulted the car was run into so has been off the road for sometime, my first step was to replace 12V battery. The ovms unit is now unplugged and if it does not fault over the next month while driving I'll be reasonably confident it's ovms related. Not sure which firmware version the poller updates were included in but it was only after upgrading to it that the errors occurred (which could be coincidental however it has faulted twice more both on version 3.3.004-141-gf729d82c). For periods where I reverted to 3.3.003 it was fine. It might be useful to have an extra option on the enable can write to only enable it when the car is parked/charging.
_______________________________________________ OvmsDev mailing list OvmsDev@lists.openvehicles.com http://lists.openvehicles.com/mailman/listinfo/ovmsdev
-- Michael Balzer * Am Rahmen 5 * D-58313 Herdecke Fon 02330 9104094 * Handy 0176 20698926
The poller statistics can help you track this down, but you need to have at least 10 seconds of statistics, the more the better. Rule of thumb: PRI average at 0.0/second means you don't have enough data yet.
There were again many messages with “RX Task Queue Overflow Run”. Here are the statistics of poller times status: OVMS# poll times status Poller timing is: on Type | count | Utlztn | Time | per s | [%] | [ms] ---------------+--------+--------+--------- Poll:PRI Avg| 1.00| 0.0043| 0.004 Peak| | 0.0043| 0.052 ---------------+--------+--------+--------- RxCan1[010] Avg| 34.26| 1.6741| 0.015 Peak| | 1.6741| 1.182 ---------------+--------+--------+--------- RxCan1[030] Avg| 34.06| 1.7085| 0.020 Peak| | 1.7085| 1.390 ---------------+--------+--------+--------- RxCan1[041] Avg| 49.89| 0.8109| 0.016 Peak| | 0.8541| 1.098 ---------------+--------+--------+--------- RxCan1[049] Avg| 50.00| 1.5970| 0.019 Peak| | 1.7154| 32.233 ---------------+--------+--------+--------- RxCan1[04c] Avg| 49.92| 0.8340| 0.014 Peak| | 0.8933| 1.995 ---------------+--------+--------+--------- RxCan1[04d] Avg| 34.43| 1.6211| 0.014 Peak| | 1.6756| 1.318 ---------------+--------+--------+--------- RxCan1[076] Avg| 50.00| 0.8362| 0.024 Peak| | 0.8784| 2.185 ---------------+--------+--------+--------- RxCan1[077] Avg| 50.00| 0.7837| 0.014 Peak| | 0.8083| 1.156 ---------------+--------+--------+--------- RxCan1[07a] Avg| 34.31| 2.1870| 0.017 Peak| | 2.3252| 1.888 ---------------+--------+--------+--------- RxCan1[07d] Avg| 50.00| 0.8001| 0.013 Peak| | 0.8434| 1.150 ---------------+--------+--------+--------- RxCan1[0c8] Avg| 49.96| 0.8359| 0.013 Peak| | 0.8715| 1.171 ---------------+--------+--------+--------- RxCan1[11a] Avg| 34.35| 1.6701| 0.020 Peak| | 1.6981| 1.273 ---------------+--------+--------+--------- RxCan1[130] Avg| 50.00| 0.7902| 0.018 Peak| | 0.8513| 0.980 ---------------+--------+--------+--------- RxCan1[139] Avg| 49.92| 0.7872| 0.013 Peak| | 0.8219| 0.795 ---------------+--------+--------+--------- RxCan1[156] Avg| 10.00| 0.1620| 0.014 Peak| | 0.1729| 0.919 ---------------+--------+--------+--------- RxCan1[160] Avg| 50.04| 0.7977| 0.014 Peak| | 0.8232| 1.495 ---------------+--------+--------+--------- RxCan1[165] Avg| 49.85| 0.7976| 0.014 Peak| | 0.8486| 1.015 ---------------+--------+--------+--------- RxCan1[167] Avg| 34.39| 1.6025| 0.016 Peak| | 1.6888| 1.354 ---------------+--------+--------+--------- RxCan1[171] Avg| 50.00| 0.8150| 0.017 Peak| | 0.8488| 1.091 ---------------+--------+--------+--------- RxCan1[178] Avg| 10.00| 0.1614| 0.014 Peak| | 0.1702| 0.903 ---------------+--------+--------+--------- RxCan1[179] Avg| 10.00| 0.1630| 0.017 Peak| | 0.1663| 1.336 ---------------+--------+--------+--------- RxCan1[180] Avg| 50.00| 0.8137| 0.014 Peak| | 0.8605| 1.566 ---------------+--------+--------+--------- RxCan1[185] Avg| 50.04| 0.8033| 0.013 Peak| | 0.8393| 1.126 ---------------+--------+--------+--------- RxCan1[1a0] Avg| 49.92| 0.7748| 0.013 Peak| | 0.8169| 1.184 ---------------+--------+--------+--------- RxCan1[1e0] Avg| 49.92| 0.7738| 0.014 Peak| | 0.8028| 1.049 ---------------+--------+--------+--------- RxCan1[1e4] Avg| 49.89| 0.9692| 0.018 Peak| | 1.0096| 1.332 ---------------+--------+--------+--------- RxCan1[1f0] Avg| 33.22| 0.5544| 0.014 Peak| | 0.5855| 0.848 ---------------+--------+--------+--------- RxCan1[200] Avg| 49.92| 0.7879| 0.015 Peak| | 0.8345| 1.206 ---------------+--------+--------+--------- RxCan1[202] Avg| 34.28| 1.7075| 0.016 Peak| | 1.7874| 1.218 ---------------+--------+--------+--------- RxCan1[204] Avg| 34.35| 1.5641| 0.013 Peak| | 1.6427| 1.235 ---------------+--------+--------+--------- RxCan1[213] Avg| 49.89| 0.7814| 0.015 Peak| | 0.8232| 0.910 ---------------+--------+--------+--------- RxCan1[214] Avg| 49.92| 0.7736| 0.014 Peak| | 0.8216| 0.800 ---------------+--------+--------+--------- RxCan1[217] Avg| 34.31| 1.6294| 0.014 Peak| | 1.7165| 1.153 ---------------+--------+--------+--------- RxCan1[218] Avg| 49.86| 0.7877| 0.013 Peak| | 0.8290| 1.068 ---------------+--------+--------+--------- RxCan1[230] Avg| 50.00| 0.7596| 0.014 Peak| | 0.7660| 1.021 ---------------+--------+--------+--------- RxCan1[240] Avg| 10.00| 0.1669| 0.013 Peak| | 0.1835| 0.887 ---------------+--------+--------+--------- RxCan1[242] Avg| 24.96| 0.4764| 0.020 Peak| | 0.4963| 1.501 ---------------+--------+--------+--------- RxCan1[24a] Avg| 9.89| 0.1789| 0.015 Peak| | 0.2009| 0.874 ---------------+--------+--------+--------- RxCan1[24b] Avg| 9.89| 0.1702| 0.014 Peak| | 0.1870| 1.195 ---------------+--------+--------+--------- RxCan1[24c] Avg| 9.89| 0.2146| 0.019 Peak| | 0.2187| 1.242 ---------------+--------+--------+--------- RxCan1[25a] Avg| 10.00| 0.1603| 0.013 Peak| | 0.1667| 0.720 ---------------+--------+--------+--------- RxCan1[25b] Avg| 49.94| 0.7918| 0.017 Peak| | 0.8454| 1.666 ---------------+--------+--------+--------- RxCan1[25c] Avg| 34.24| 1.5331| 0.013 Peak| | 1.5997| 1.538 ---------------+--------+--------+--------- RxCan1[260] Avg| 10.00| 0.1626| 0.014 Peak| | 0.1682| 0.718 ---------------+--------+--------+--------- RxCan1[270] Avg| 49.90| 0.8120| 0.014 Peak| | 0.8460| 1.671 ---------------+--------+--------+--------- RxCan1[280] Avg| 49.92| 0.7777| 0.019 Peak| | 0.8447| 1.157 ---------------+--------+--------+--------- RxCan1[2e4] Avg| 19.89| 0.5778| 0.032 Peak| | 0.6648| 2.226 ---------------+--------+--------+--------- RxCan1[2ec] Avg| 10.00| 0.1701| 0.014 Peak| | 0.1755| 0.928 ---------------+--------+--------+--------- RxCan1[2ed] Avg| 10.00| 0.1650| 0.013 Peak| | 0.1747| 0.917 ---------------+--------+--------+--------- RxCan1[2ee] Avg| 9.98| 0.1544| 0.013 Peak| | 0.1588| 1.312 ---------------+--------+--------+--------- RxCan1[312] Avg| 10.00| 0.1648| 0.017 Peak| | 0.1690| 0.922 ---------------+--------+--------+--------- RxCan1[326] Avg| 9.89| 0.1603| 0.015 Peak| | 0.1833| 1.230 ---------------+--------+--------+--------- RxCan1[336] Avg| 1.00| 0.0146| 0.015 Peak| | 0.0150| 0.349 ---------------+--------+--------+--------- RxCan1[352] Avg| 6.66| 0.1223| 0.022 Peak| | 0.1338| 1.015 ---------------+--------+--------+--------- RxCan1[355] Avg| 2.00| 0.0424| 0.019 Peak| | 0.0431| 0.786 ---------------+--------+--------+--------- RxCan1[35e] Avg| 9.96| 0.1570| 0.013 Peak| | 0.1644| 0.579 ---------------+--------+--------+--------- RxCan1[365] Avg| 10.00| 0.1600| 0.014 Peak| | 0.1653| 0.961 ---------------+--------+--------+--------- RxCan1[366] Avg| 10.00| 0.1716| 0.013 Peak| | 0.1890| 0.987 ---------------+--------+--------+--------- RxCan1[367] Avg| 9.93| 0.1793| 0.015 Peak| | 0.1864| 0.984 ---------------+--------+--------+--------- RxCan1[368] Avg| 10.00| 0.1645| 0.014 Peak| | 0.1778| 0.768 ---------------+--------+--------+--------- RxCan1[369] Avg| 10.00| 0.1562| 0.016 Peak| | 0.1606| 0.724 ---------------+--------+--------+--------- RxCan1[380] Avg| 10.00| 0.1619| 0.014 Peak| | 0.1644| 0.605 ---------------+--------+--------+--------- RxCan1[38b] Avg| 25.00| 0.3991| 0.016 Peak| | 0.4280| 1.448 ---------------+--------+--------+--------- RxCan1[3b3] Avg| 10.00| 0.1537| 0.013 Peak| | 0.1610| 0.380 ---------------+--------+--------+--------- RxCan1[400] Avg| 4.00| 0.0626| 0.014 Peak| | 0.0626| 0.251 ---------------+--------+--------+--------- RxCan1[405] Avg| 3.90| 0.1019| 0.028 Peak| | 0.1019| 0.781 ---------------+--------+--------+--------- RxCan1[40a] Avg| 7.90| 0.1256| 0.020 Peak| | 0.1256| 0.991 ---------------+--------+--------+--------- RxCan1[410] Avg| 10.00| 0.1643| 0.016 Peak| | 0.1839| 1.634 ---------------+--------+--------+--------- RxCan1[411] Avg| 10.00| 0.1532| 0.013 Peak| | 0.1645| 0.824 ---------------+--------+--------+--------- RxCan1[416] Avg| 10.00| 0.1516| 0.016 Peak| | 0.1582| 0.807 ---------------+--------+--------+--------- RxCan1[421] Avg| 10.00| 0.1648| 0.013 Peak| | 0.1740| 0.839 ---------------+--------+--------+--------- RxCan1[42d] Avg| 10.00| 0.1548| 0.014 Peak| | 0.1658| 0.741 ---------------+--------+--------+--------- RxCan1[42f] Avg| 10.00| 0.1527| 0.013 Peak| | 0.1578| 0.667 ---------------+--------+--------+--------- RxCan1[430] Avg| 10.00| 0.1730| 0.016 Peak| | 0.1880| 1.209 ---------------+--------+--------+--------- RxCan1[434] Avg| 10.00| 0.1620| 0.021 Peak| | 0.1712| 1.140 ---------------+--------+--------+--------- RxCan1[435] Avg| 6.66| 0.1104| 0.014 Peak| | 0.1121| 1.011 ---------------+--------+--------+--------- RxCan1[43e] Avg| 20.00| 0.3194| 0.013 Peak| | 0.3434| 1.212 ---------------+--------+--------+--------- RxCan1[440] Avg| 1.00| 0.0160| 0.014 Peak| | 0.0175| 0.315 ---------------+--------+--------+--------- RxCan1[465] Avg| 1.00| 0.0172| 0.015 Peak| | 0.0194| 0.404 ---------------+--------+--------+--------- RxCan1[466] Avg| 1.00| 0.0198| 0.015 Peak| | 0.0252| 0.890 ---------------+--------+--------+--------- RxCan1[467] Avg| 1.00| 0.0152| 0.014 Peak| | 0.0160| 0.217 ---------------+--------+--------+--------- RxCan1[472] Avg| 0.70| 0.0533| 0.075 Peak| | 0.0546| 0.990 ---------------+--------+--------+--------- RxCan1[473] Avg| 0.65| 0.0325| 0.051 Peak| | 0.0361| 0.774 ---------------+--------+--------+--------- RxCan1[474] Avg| 1.00| 0.0146| 0.014 Peak| | 0.0151| 0.189 ---------------+--------+--------+--------- RxCan1[475] Avg| 2.00| 0.0332| 0.015 Peak| | 0.0362| 0.513 ---------------+--------+--------+--------- RxCan1[476] Avg| 2.00| 0.0305| 0.014 Peak| | 0.0307| 0.249 ---------------+--------+--------+--------- RxCan1[477] Avg| 2.00| 0.0309| 0.014 Peak| | 0.0311| 0.438 ---------------+--------+--------+--------- RxCan1[595] Avg| 1.00| 0.0151| 0.014 Peak| | 0.0160| 0.230 ---------------+--------+--------+--------- RxCan1[59e] Avg| 1.00| 0.0179| 0.015 Peak| | 0.0209| 0.716 ---------------+--------+--------+--------- RxCan1[5a2] Avg| 1.00| 0.0154| 0.016 Peak| | 0.0184| 0.699 ---------------+--------+--------+--------- RxCan1[5ba] Avg| 1.00| 0.0159| 0.017 Peak| | 0.0174| 0.485 ---------------+--------+--------+--------- RxCan2[010] Avg| 0.00| 0.0000| 0.015 Peak| | 0.0000| 0.146 ---------------+--------+--------+--------- RxCan2[020] Avg| 31.10| 0.5159| 0.015 Peak| | 0.5730| 0.992 ---------------+--------+--------+--------- RxCan2[030] Avg| 20.70| 0.3506| 0.016 Peak| | 0.3956| 1.055 ---------------+--------+--------+--------- RxCan2[03a] Avg| 18.65| 0.3157| 0.014 Peak| | 0.3292| 0.702 ---------------+--------+--------+--------- RxCan2[040] Avg| 18.60| 0.3111| 0.015 Peak| | 0.3474| 0.953 ---------------+--------+--------+--------- RxCan2[060] Avg| 18.60| 0.3182| 0.014 Peak| | 0.3569| 0.694 ---------------+--------+--------+--------- RxCan2[070] Avg| 15.55| 0.4581| 0.017 Peak| | 0.6859| 39.212 ---------------+--------+--------+--------- RxCan2[080] Avg| 15.50| 0.5041| 0.029 Peak| | 0.5414| 1.555 ---------------+--------+--------+--------- RxCan2[083] Avg| 18.70| 0.3083| 0.014 Peak| | 0.3325| 0.557 ---------------+--------+--------+--------- RxCan2[090] Avg| 23.40| 0.3961| 0.014 Peak| | 0.4445| 1.218 ---------------+--------+--------+--------- RxCan2[0a0] Avg| 15.55| 0.2734| 0.014 Peak| | 0.3144| 1.062 ---------------+--------+--------+--------- RxCan2[100] Avg| 15.50| 0.2645| 0.016 Peak| | 0.2875| 1.021 ---------------+--------+--------+--------- RxCan2[108] Avg| 23.40| 0.4231| 0.016 Peak| | 0.4680| 1.297 ---------------+--------+--------+--------- RxCan2[110] Avg| 15.55| 0.2467| 0.014 Peak| | 0.2684| 0.475 ---------------+--------+--------+--------- RxCan2[130] Avg| 13.30| 0.2231| 0.014 Peak| | 0.2447| 0.512 ---------------+--------+--------+--------- RxCan2[150] Avg| 15.50| 0.2533| 0.015 Peak| | 0.2836| 0.823 ---------------+--------+--------+--------- RxCan2[160] Avg| 4.70| 0.0784| 0.014 Peak| | 0.0863| 0.608 ---------------+--------+--------+--------- RxCan2[180] Avg| 15.55| 0.2713| 0.015 Peak| | 0.2841| 0.884 ---------------+--------+--------+--------- RxCan2[190] Avg| 15.50| 0.2596| 0.014 Peak| | 0.2825| 0.743 ---------------+--------+--------+--------- RxCan2[1a0] Avg| 0.95| 0.0164| 0.015 Peak| | 0.0164| 0.346 ---------------+--------+--------+--------- RxCan2[1a4] Avg| 18.65| 0.3232| 0.015 Peak| | 0.3515| 0.989 ---------------+--------+--------+--------- RxCan2[1a8] Avg| 11.60| 0.1911| 0.016 Peak| | 0.2012| 0.757 ---------------+--------+--------+--------- RxCan2[1b0] Avg| 9.35| 0.1558| 0.016 Peak| | 0.1641| 0.795 ---------------+--------+--------+--------- RxCan2[1b4] Avg| 9.35| 0.1543| 0.015 Peak| | 0.1617| 1.217 ---------------+--------+--------+--------- RxCan2[1b8] Avg| 11.65| 0.2003| 0.014 Peak| | 0.2236| 1.549 ---------------+--------+--------+--------- RxCan2[1c0] Avg| 9.40| 0.1532| 0.016 Peak| | 0.1673| 0.955 ---------------+--------+--------+--------- RxCan2[1e0] Avg| 9.30| 0.1582| 0.015 Peak| | 0.1708| 0.661 ---------------+--------+--------+--------- RxCan2[215] Avg| 7.80| 0.1409| 0.016 Peak| | 0.1531| 0.660 ---------------+--------+--------+--------- RxCan2[217] Avg| 7.80| 0.1239| 0.014 Peak| | 0.1333| 0.520 ---------------+--------+--------+--------- RxCan2[220] Avg| 6.20| 0.1041| 0.015 Peak| | 0.1094| 0.652 ---------------+--------+--------+--------- RxCan2[225] Avg| 23.40| 0.4648| 0.015 Peak| | 0.4696| 4.288 ---------------+--------+--------+--------- RxCan2[230] Avg| 6.20| 0.3120| 0.048 Peak| | 0.3377| 1.065 ---------------+--------+--------+--------- RxCan2[240] Avg| 7.70| 0.1248| 0.014 Peak| | 0.1364| 0.635 ---------------+--------+--------+--------- RxCan2[241] Avg| 18.60| 0.3258| 0.014 Peak| | 0.3343| 1.288 ---------------+--------+--------+--------- RxCan2[250] Avg| 4.70| 0.0761| 0.014 Peak| | 0.0809| 0.322 ---------------+--------+--------+--------- RxCan2[255] Avg| 11.75| 0.2058| 0.014 Peak| | 0.2283| 0.937 ---------------+--------+--------+--------- RxCan2[265] Avg| 11.65| 0.1964| 0.014 Peak| | 0.2068| 0.965 ---------------+--------+--------+--------- RxCan2[270] Avg| 4.70| 0.0808| 0.016 Peak| | 0.0949| 0.729 ---------------+--------+--------+--------- RxCan2[290] Avg| 3.15| 0.0498| 0.015 Peak| | 0.0504| 0.449 ---------------+--------+--------+--------- RxCan2[295] Avg| 6.25| 0.1019| 0.014 Peak| | 0.1094| 0.859 ---------------+--------+--------+--------- RxCan2[2a0] Avg| 3.15| 0.0550| 0.014 Peak| | 0.0551| 0.779 ---------------+--------+--------+--------- RxCan2[2a7] Avg| 11.65| 0.1929| 0.014 Peak| | 0.2080| 0.775 ---------------+--------+--------+--------- RxCan2[2b0] Avg| 3.00| 0.0497| 0.015 Peak| | 0.0562| 0.528 ---------------+--------+--------+--------- RxCan2[2c0] Avg| 3.10| 0.0534| 0.016 Peak| | 0.0592| 0.501 ---------------+--------+--------+--------- RxCan2[2e0] Avg| 1.55| 0.0247| 0.014 Peak| | 0.0289| 0.319 ---------------+--------+--------+--------- RxCan2[2f0] Avg| 1.55| 0.0244| 0.014 Peak| | 0.0273| 0.192 ---------------+--------+--------+--------- RxCan2[2f5] Avg| 11.65| 0.2078| 0.016 Peak| | 0.2333| 0.879 ---------------+--------+--------+--------- RxCan2[300] Avg| 1.60| 0.0266| 0.018 Peak| | 0.0278| 0.724 ---------------+--------+--------+--------- RxCan2[310] Avg| 1.55| 0.0276| 0.016 Peak| | 0.0285| 0.759 ---------------+--------+--------+--------- RxCan2[320] Avg| 1.60| 0.0240| 0.014 Peak| | 0.0258| 0.179 ---------------+--------+--------+--------- RxCan2[326] Avg| 9.30| 0.1550| 0.014 Peak| | 0.1582| 0.850 ---------------+--------+--------+--------- RxCan2[330] Avg| 29.95| 0.5311| 0.015 Peak| | 0.5565| 4.522 ---------------+--------+--------+--------- RxCan2[340] Avg| 7.75| 0.1693| 0.024 Peak| | 0.1868| 1.148 ---------------+--------+--------+--------- RxCan2[345] Avg| 1.60| 0.0292| 0.016 Peak| | 0.0316| 0.471 ---------------+--------+--------+--------- RxCan2[350] Avg| 0.00| 0.0000| 0.019 Peak| | 0.0000| 0.188 ---------------+--------+--------+--------- RxCan2[35e] Avg| 4.70| 0.0851| 0.019 Peak| | 0.0911| 1.023 ---------------+--------+--------+--------- RxCan2[360] Avg| 1.60| 0.0258| 0.015 Peak| | 0.0284| 0.306 ---------------+--------+--------+--------- RxCan2[361] Avg| 7.75| 0.1341| 0.017 Peak| | 0.1487| 0.761 ---------------+--------+--------+--------- RxCan2[363] Avg| 1.20| 0.0203| 0.016 Peak| | 0.0220| 0.421 ---------------+--------+--------+--------- RxCan2[370] Avg| 0.85| 0.0140| 0.016 Peak| | 0.0162| 0.354 ---------------+--------+--------+--------- RxCan2[381] Avg| 3.15| 0.0512| 0.016 Peak| | 0.0546| 0.416 ---------------+--------+--------+--------- RxCan2[3a0] Avg| 15.60| 0.2548| 0.015 Peak| | 0.2890| 0.976 ---------------+--------+--------+--------- RxCan2[3d0] Avg| 9.35| 0.1553| 0.019 Peak| | 0.1612| 1.115 ---------------+--------+--------+--------- RxCan2[3d5] Avg| 5.15| 0.0836| 0.016 Peak| | 0.0867| 0.479 ---------------+--------+--------+--------- RxCan2[3e0] Avg| 0.00| 0.0000| 0.014 Peak| | 0.0000| 0.142 ---------------+--------+--------+--------- RxCan2[400] Avg| 3.55| 0.0613| 0.017 Peak| | 0.0695| 0.501 ---------------+--------+--------+--------- RxCan2[405] Avg| 3.50| 0.0584| 0.018 Peak| | 0.0626| 0.686 ---------------+--------+--------+--------- RxCan2[40a] Avg| 7.10| 0.1278| 0.017 Peak| | 0.1389| 1.244 ---------------+--------+--------+--------- RxCan2[415] Avg| 1.60| 0.0258| 0.014 Peak| | 0.0287| 0.266 ---------------+--------+--------+--------- RxCan2[435] Avg| 0.85| 0.0165| 0.019 Peak| | 0.0167| 0.367 ---------------+--------+--------+--------- RxCan2[440] Avg| 0.85| 0.0128| 0.019 Peak| | 0.0141| 0.885 ---------------+--------+--------+--------- RxCan2[465] Avg| 0.95| 0.0177| 0.016 Peak| | 0.0195| 0.721 ---------------+--------+--------+--------- RxCan2[466] Avg| 0.95| 0.0147| 0.014 Peak| | 0.0160| 0.184 ---------------+--------+--------+--------- RxCan2[467] Avg| 0.95| 0.0172| 0.017 Peak| | 0.0188| 0.391 ---------------+--------+--------+--------- RxCan2[501] Avg| 1.45| 0.0273| 0.016 Peak| | 0.0327| 0.996 ---------------+--------+--------+--------- RxCan2[503] Avg| 1.45| 0.0288| 0.020 Peak| | 0.0338| 0.970 ---------------+--------+--------+--------- RxCan2[504] Avg| 1.40| 0.0241| 0.015 Peak| | 0.0263| 0.609 ---------------+--------+--------+--------- RxCan2[505] Avg| 1.40| 0.0255| 0.015 Peak| | 0.0296| 0.866 ---------------+--------+--------+--------- RxCan2[508] Avg| 1.35| 0.0237| 0.017 Peak| | 0.0237| 0.384 ---------------+--------+--------+--------- RxCan2[511] Avg| 1.35| 0.0226| 0.016 Peak| | 0.0228| 0.426 ---------------+--------+--------+--------- RxCan2[51e] Avg| 1.40| 0.0221| 0.014 Peak| | 0.0245| 0.211 ---------------+--------+--------+--------- RxCan2[581] Avg| 0.80| 0.0189| 0.019 Peak| | 0.0290| 1.217 ---------------+--------+--------+--------- RxCan2[606] Avg| 0.00| 0.0000| 0.014 Peak| | 0.0000| 0.142 ---------------+--------+--------+--------- RxCan2[657] Avg| 0.00| 0.0000| 0.014 Peak| | 0.0000| 0.137 ---------------+--------+--------+--------- Cmd:State Avg| 0.00| 0.0000| 0.002 Peak| | 0.0000| 0.024 ===============+========+========+========= Total Avg| 2748.42| 58.3344| 28.718
@Simon: it would be an option to try commenting out the overflow counting, to see if that's causing the issue.
I have commented out the line with the Atomic_Increment statement. Now I no longer receive any messages with “RX Task Queue Overflow Run” Here is the output of poller times status: OVMS# poll time status Poller timing is: on Type | count | Utlztn | Time | per s | [%] | [ms] ---------------+--------+--------+--------- Poll:PRI Avg| 1.00| 0.0045| 0.004 Peak| | 0.0046| 0.064 ---------------+--------+--------+--------- RxCan1[010] Avg| 34.26| 2.2574| 0.021 Peak| | 2.2574| 4.609 ---------------+--------+--------+--------- RxCan1[030] Avg| 34.26| 2.3820| 0.021 Peak| | 2.3820| 1.135 ---------------+--------+--------+--------- RxCan1[041] Avg| 49.89| 1.2059| 0.021 Peak| | 1.2295| 5.331 ---------------+--------+--------+--------- RxCan1[049] Avg| 49.96| 1.2400| 0.030 Peak| | 1.2699| 1.402 ---------------+--------+--------+--------- RxCan1[04c] Avg| 49.92| 1.1752| 0.021 Peak| | 1.2072| 4.502 ---------------+--------+--------+--------- RxCan1[04d] Avg| 34.31| 2.4433| 0.022 Peak| | 2.4773| 1.368 ---------------+--------+--------+--------- RxCan1[076] Avg| 49.96| 1.2071| 0.024 Peak| | 1.2554| 2.007 ---------------+--------+--------+--------- RxCan1[077] Avg| 49.96| 1.2012| 0.022 Peak| | 1.2492| 1.955 ---------------+--------+--------+--------- RxCan1[07a] Avg| 34.35| 2.9251| 0.030 Peak| | 3.1103| 1.829 ---------------+--------+--------+--------- RxCan1[07d] Avg| 49.96| 1.1954| 0.022 Peak| | 1.2282| 1.074 ---------------+--------+--------+--------- RxCan1[0c8] Avg| 49.89| 1.2491| 0.021 Peak| | 1.3169| 1.181 ---------------+--------+--------+--------- RxCan1[11a] Avg| 34.39| 2.4423| 0.024 Peak| | 2.5693| 1.491 ---------------+--------+--------+--------- RxCan1[130] Avg| 49.95| 1.1312| 0.020 Peak| | 1.1684| 1.218 ---------------+--------+--------+--------- RxCan1[139] Avg| 49.92| 1.1547| 0.021 Peak| | 1.1778| 1.199 ---------------+--------+--------+--------- RxCan1[156] Avg| 9.96| 0.2391| 0.023 Peak| | 0.2591| 1.943 ---------------+--------+--------+--------- RxCan1[160] Avg| 49.96| 1.1657| 0.031 Peak| | 1.2017| 2.158 ---------------+--------+--------+--------- RxCan1[165] Avg| 49.96| 1.1257| 0.021 Peak| | 1.1652| 1.471 ---------------+--------+--------+--------- RxCan1[167] Avg| 34.31| 2.2871| 0.021 Peak| | 2.3374| 1.776 ---------------+--------+--------+--------- RxCan1[171] Avg| 49.96| 1.1879| 0.023 Peak| | 1.2268| 1.166 ---------------+--------+--------+--------- RxCan1[178] Avg| 10.00| 0.2371| 0.029 Peak| | 0.2459| 1.516 ---------------+--------+--------+--------- RxCan1[179] Avg| 10.00| 0.2196| 0.021 Peak| | 0.2260| 0.758 ---------------+--------+--------+--------- RxCan1[180] Avg| 49.96| 1.1703| 0.022 Peak| | 1.2103| 1.481 ---------------+--------+--------+--------- RxCan1[185] Avg| 49.95| 1.1127| 0.020 Peak| | 1.1636| 1.292 ---------------+--------+--------+--------- RxCan1[1a0] Avg| 49.96| 1.1009| 0.020 Peak| | 1.1468| 1.060 ---------------+--------+--------+--------- RxCan1[1e0] Avg| 49.96| 1.1744| 0.021 Peak| | 1.2027| 1.240 ---------------+--------+--------+--------- RxCan1[1e4] Avg| 49.96| 1.3733| 0.032 Peak| | 1.4085| 1.523 ---------------+--------+--------+--------- RxCan1[1f0] Avg| 33.30| 0.7625| 0.023 Peak| | 0.8004| 3.349 ---------------+--------+--------+--------- RxCan1[200] Avg| 49.92| 1.1462| 0.021 Peak| | 1.1809| 1.254 ---------------+--------+--------+--------- RxCan1[202] Avg| 34.39| 2.4034| 0.028 Peak| | 2.5611| 1.472 ---------------+--------+--------+--------- RxCan1[204] Avg| 34.30| 2.2541| 0.022 Peak| | 2.2924| 2.015 ---------------+--------+--------+--------- RxCan1[213] Avg| 49.96| 1.1599| 0.027 Peak| | 1.1794| 1.714 ---------------+--------+--------+--------- RxCan1[214] Avg| 49.96| 1.1537| 0.022 Peak| | 1.1941| 1.439 ---------------+--------+--------+--------- RxCan1[217] Avg| 34.39| 2.2490| 0.020 Peak| | 2.2856| 3.766 ---------------+--------+--------+--------- RxCan1[218] Avg| 49.96| 1.1291| 0.021 Peak| | 1.1646| 1.547 ---------------+--------+--------+--------- RxCan1[230] Avg| 49.96| 1.1272| 0.020 Peak| | 1.2237| 1.295 ---------------+--------+--------+--------- RxCan1[240] Avg| 10.00| 0.2191| 0.021 Peak| | 0.2226| 1.067 ---------------+--------+--------+--------- RxCan1[242] Avg| 24.96| 0.6911| 0.024 Peak| | 0.7161| 1.180 ---------------+--------+--------+--------- RxCan1[24a] Avg| 9.96| 0.2345| 0.024 Peak| | 0.2535| 0.779 ---------------+--------+--------+--------- RxCan1[24b] Avg| 9.96| 0.2433| 0.023 Peak| | 0.2697| 2.085 ---------------+--------+--------+--------- RxCan1[24c] Avg| 9.96| 0.3103| 0.029 Peak| | 0.3203| 0.809 ---------------+--------+--------+--------- RxCan1[25a] Avg| 10.00| 0.2346| 0.022 Peak| | 0.2405| 1.223 ---------------+--------+--------+--------- RxCan1[25b] Avg| 49.89| 1.2121| 0.020 Peak| | 1.3659| 19.523 ---------------+--------+--------+--------- RxCan1[25c] Avg| 34.31| 2.4193| 0.019 Peak| | 2.8022| 58.153 ---------------+--------+--------+--------- RxCan1[260] Avg| 9.93| 0.2149| 0.024 Peak| | 0.2174| 1.096 ---------------+--------+--------+--------- RxCan1[270] Avg| 49.96| 1.2042| 0.026 Peak| | 1.2755| 20.612 ---------------+--------+--------+--------- RxCan1[280] Avg| 49.96| 1.0922| 0.020 Peak| | 1.1312| 1.266 ---------------+--------+--------+--------- RxCan1[2e4] Avg| 19.96| 0.6942| 0.044 Peak| | 0.8604| 1.533 ---------------+--------+--------+--------- RxCan1[2ec] Avg| 10.00| 0.3727| 0.025 Peak| | 0.5154| 28.819 ---------------+--------+--------+--------- RxCan1[2ed] Avg| 10.00| 0.2298| 0.023 Peak| | 0.2378| 1.345 ---------------+--------+--------+--------- RxCan1[2ee] Avg| 9.96| 0.2172| 0.019 Peak| | 0.2210| 1.058 ---------------+--------+--------+--------- RxCan1[312] Avg| 10.00| 0.2206| 0.020 Peak| | 0.2396| 1.060 ---------------+--------+--------+--------- RxCan1[326] Avg| 9.96| 0.2099| 0.020 Peak| | 0.2158| 0.507 ---------------+--------+--------+--------- RxCan1[336] Avg| 1.00| 0.0212| 0.020 Peak| | 0.0233| 0.315 ---------------+--------+--------+--------- RxCan1[352] Avg| 6.64| 0.1675| 0.024 Peak| | 0.1818| 1.048 ---------------+--------+--------+--------- RxCan1[355] Avg| 2.00| 0.0540| 0.027 Peak| | 0.0619| 1.209 ---------------+--------+--------+--------- RxCan1[35e] Avg| 9.98| 0.2221| 0.021 Peak| | 0.2284| 1.186 ---------------+--------+--------+--------- RxCan1[365] Avg| 10.00| 0.2282| 0.023 Peak| | 0.2335| 0.769 ---------------+--------+--------+--------- RxCan1[366] Avg| 10.00| 0.3163| 0.022 Peak| | 0.6330| 23.587 ---------------+--------+--------+--------- RxCan1[367] Avg| 10.00| 0.2417| 0.021 Peak| | 0.2568| 1.417 ---------------+--------+--------+--------- RxCan1[368] Avg| 9.96| 0.2187| 0.019 Peak| | 0.2250| 1.135 ---------------+--------+--------+--------- RxCan1[369] Avg| 9.99| 0.2277| 0.021 Peak| | 0.2334| 0.667 ---------------+--------+--------+--------- RxCan1[380] Avg| 9.96| 0.2133| 0.020 Peak| | 0.2161| 0.560 ---------------+--------+--------+--------- RxCan1[38b] Avg| 24.92| 0.5622| 0.022 Peak| | 0.5716| 1.618 ---------------+--------+--------+--------- RxCan1[3b3] Avg| 10.00| 0.2132| 0.023 Peak| | 0.2194| 1.106 ---------------+--------+--------+--------- RxCan1[400] Avg| 4.00| 0.0885| 0.019 Peak| | 0.0885| 0.570 ---------------+--------+--------+--------- RxCan1[405] Avg| 3.70| 0.1414| 0.036 Peak| | 0.1414| 0.710 ---------------+--------+--------+--------- RxCan1[40a] Avg| 8.00| 0.1887| 0.021 Peak| | 0.1887| 1.027 ---------------+--------+--------+--------- RxCan1[410] Avg| 10.00| 0.2141| 0.023 Peak| | 0.2188| 0.984 ---------------+--------+--------+--------- RxCan1[411] Avg| 10.00| 0.2325| 0.023 Peak| | 0.2447| 0.660 ---------------+--------+--------+--------- RxCan1[416] Avg| 10.00| 0.2326| 0.022 Peak| | 0.2389| 0.774 ---------------+--------+--------+--------- RxCan1[421] Avg| 10.00| 0.2245| 0.021 Peak| | 0.2271| 1.160 ---------------+--------+--------+--------- RxCan1[42d] Avg| 10.00| 0.2315| 0.021 Peak| | 0.2411| 0.677 ---------------+--------+--------+--------- RxCan1[42f] Avg| 10.00| 0.2480| 0.020 Peak| | 0.2975| 8.093 ---------------+--------+--------+--------- RxCan1[430] Avg| 10.00| 0.2203| 0.019 Peak| | 0.2302| 0.847 ---------------+--------+--------+--------- RxCan1[434] Avg| 10.00| 0.2331| 0.019 Peak| | 0.2620| 1.150 ---------------+--------+--------+--------- RxCan1[435] Avg| 6.68| 0.1445| 0.020 Peak| | 0.1486| 1.063 ---------------+--------+--------+--------- RxCan1[43e] Avg| 20.00| 0.4515| 0.021 Peak| | 0.4632| 1.013 ---------------+--------+--------+--------- RxCan1[440] Avg| 1.00| 0.0210| 0.019 Peak| | 0.0218| 0.294 ---------------+--------+--------+--------- RxCan1[465] Avg| 0.95| 0.0214| 0.023 Peak| | 0.0215| 0.587 ---------------+--------+--------+--------- RxCan1[466] Avg| 0.95| 0.0211| 0.021 Peak| | 0.0215| 0.350 ---------------+--------+--------+--------- RxCan1[467] Avg| 0.95| 0.0191| 0.020 Peak| | 0.0201| 0.444 ---------------+--------+--------+--------- RxCan1[472] Avg| 0.68| 0.0588| 0.085 Peak| | 0.0606| 1.170 ---------------+--------+--------+--------- RxCan1[473] Avg| 0.66| 0.0407| 0.062 Peak| | 0.0492| 1.329 ---------------+--------+--------+--------- RxCan1[474] Avg| 1.00| 0.0218| 0.021 Peak| | 0.0237| 0.278 ---------------+--------+--------+--------- RxCan1[475] Avg| 1.96| 0.0466| 0.024 Peak| | 0.0570| 1.112 ---------------+--------+--------+--------- RxCan1[476] Avg| 2.00| 0.0454| 0.020 Peak| | 0.0497| 0.409 ---------------+--------+--------+--------- RxCan1[477] Avg| 2.00| 0.0497| 0.022 Peak| | 0.0595| 0.864 ---------------+--------+--------+--------- RxCan1[595] Avg| 1.00| 0.0223| 0.021 Peak| | 0.0241| 0.296 ---------------+--------+--------+--------- RxCan1[59e] Avg| 1.00| 0.0233| 0.024 Peak| | 0.0289| 0.713 ---------------+--------+--------+--------- RxCan1[5a2] Avg| 1.00| 0.0200| 0.020 Peak| | 0.0204| 0.264 ---------------+--------+--------+--------- RxCan1[5ba] Avg| 1.00| 0.0206| 0.021 Peak| | 0.0238| 0.515 ---------------+--------+--------+--------- RxCan2[020] Avg| 33.30| 0.7938| 0.022 Peak| | 0.7938| 4.793 ---------------+--------+--------+--------- RxCan2[030] Avg| 22.20| 0.5229| 0.022 Peak| | 0.5229| 0.985 ---------------+--------+--------+--------- RxCan2[03a] Avg| 19.90| 0.4700| 0.022 Peak| | 0.4700| 0.804 ---------------+--------+--------+--------- RxCan2[040] Avg| 19.90| 0.4678| 0.023 Peak| | 0.4678| 1.222 ---------------+--------+--------+--------- RxCan2[060] Avg| 20.00| 0.6480| 0.050 Peak| | 0.6480| 20.997 ---------------+--------+--------+--------- RxCan2[070] Avg| 16.60| 0.3944| 0.022 Peak| | 0.3944| 1.053 ---------------+--------+--------+--------- RxCan2[080] Avg| 16.70| 0.7032| 0.041 Peak| | 0.7032| 1.611 ---------------+--------+--------+--------- RxCan2[083] Avg| 20.10| 0.4329| 0.021 Peak| | 0.4329| 0.520 ---------------+--------+--------+--------- RxCan2[090] Avg| 24.90| 0.5674| 0.017 Peak| | 0.5674| 1.149 ---------------+--------+--------+--------- RxCan2[0a0] Avg| 16.60| 0.3836| 0.023 Peak| | 0.3836| 0.933 ---------------+--------+--------+--------- RxCan2[100] Avg| 16.50| 0.3661| 0.021 Peak| | 0.3661| 0.740 ---------------+--------+--------+--------- RxCan2[108] Avg| 24.90| 0.5923| 0.025 Peak| | 0.5923| 0.859 ---------------+--------+--------+--------- RxCan2[110] Avg| 16.70| 0.3906| 0.023 Peak| | 0.3906| 0.697 ---------------+--------+--------+--------- RxCan2[130] Avg| 14.40| 0.3341| 0.022 Peak| | 0.3341| 0.829 ---------------+--------+--------+--------- RxCan2[150] Avg| 16.50| 0.4025| 0.020 Peak| | 0.4025| 1.120 ---------------+--------+--------+--------- RxCan2[160] Avg| 4.90| 0.1252| 0.025 Peak| | 0.1252| 0.502 ---------------+--------+--------+--------- RxCan2[180] Avg| 16.60| 0.3899| 0.023 Peak| | 0.3899| 0.799 ---------------+--------+--------+--------- RxCan2[190] Avg| 16.60| 0.3892| 0.025 Peak| | 0.3892| 1.172 ---------------+--------+--------+--------- RxCan2[1a0] Avg| 1.00| 0.0281| 0.025 Peak| | 0.0281| 0.695 ---------------+--------+--------+--------- RxCan2[1a4] Avg| 20.00| 0.4525| 0.022 Peak| | 0.4525| 1.231 ---------------+--------+--------+--------- RxCan2[1a8] Avg| 12.50| 0.2886| 0.020 Peak| | 0.2886| 1.048 ---------------+--------+--------+--------- RxCan2[1b0] Avg| 10.00| 0.2300| 0.023 Peak| | 0.2300| 0.579 ---------------+--------+--------+--------- RxCan2[1b4] Avg| 10.00| 0.2334| 0.022 Peak| | 0.2334| 0.947 ---------------+--------+--------+--------- RxCan2[1b8] Avg| 12.40| 0.2970| 0.023 Peak| | 0.2970| 0.909 ---------------+--------+--------+--------- RxCan2[1c0] Avg| 10.00| 0.2257| 0.021 Peak| | 0.2257| 0.983 ---------------+--------+--------+--------- RxCan2[1e0] Avg| 10.00| 0.2141| 0.023 Peak| | 0.2141| 0.556 ---------------+--------+--------+--------- RxCan2[215] Avg| 8.30| 0.2047| 0.025 Peak| | 0.2047| 0.786 ---------------+--------+--------+--------- RxCan2[217] Avg| 8.30| 0.2033| 0.022 Peak| | 0.2033| 1.135 ---------------+--------+--------+--------- RxCan2[220] Avg| 6.70| 0.1647| 0.020 Peak| | 0.1647| 0.961 ---------------+--------+--------+--------- RxCan2[225] Avg| 24.90| 0.6136| 0.026 Peak| | 0.6136| 1.018 ---------------+--------+--------+--------- RxCan2[230] Avg| 6.70| 0.4045| 0.057 Peak| | 0.4045| 1.532 ---------------+--------+--------+--------- RxCan2[240] Avg| 8.20| 0.1849| 0.021 Peak| | 0.1849| 0.510 ---------------+--------+--------+--------- RxCan2[241] Avg| 20.00| 0.4312| 0.021 Peak| | 0.4312| 5.110 ---------------+--------+--------+--------- RxCan2[250] Avg| 5.00| 0.1072| 0.021 Peak| | 0.1072| 0.320 ---------------+--------+--------+--------- RxCan2[255] Avg| 12.50| 0.3091| 0.022 Peak| | 0.3091| 0.904 ---------------+--------+--------+--------- RxCan2[265] Avg| 12.50| 0.2819| 0.021 Peak| | 0.2819| 1.035 ---------------+--------+--------+--------- RxCan2[270] Avg| 5.00| 0.1189| 0.022 Peak| | 0.1189| 0.631 ---------------+--------+--------+--------- RxCan2[290] Avg| 3.30| 0.0740| 0.023 Peak| | 0.0740| 0.455 ---------------+--------+--------+--------- RxCan2[295] Avg| 6.60| 0.1431| 0.023 Peak| | 0.1431| 0.504 ---------------+--------+--------+--------- RxCan2[2a0] Avg| 3.30| 0.0686| 0.020 Peak| | 0.0686| 0.445 ---------------+--------+--------+--------- RxCan2[2a7] Avg| 12.50| 0.2869| 0.021 Peak| | 0.2869| 0.660 ---------------+--------+--------+--------- RxCan2[2b0] Avg| 3.20| 0.0707| 0.023 Peak| | 0.0707| 0.331 ---------------+--------+--------+--------- RxCan2[2c0] Avg| 3.20| 0.0988| 0.026 Peak| | 0.0988| 0.932 ---------------+--------+--------+--------- RxCan2[2e0] Avg| 1.60| 0.0388| 0.024 Peak| | 0.0388| 0.393 ---------------+--------+--------+--------- RxCan2[2f0] Avg| 1.70| 0.0376| 0.021 Peak| | 0.0376| 0.282 ---------------+--------+--------+--------- RxCan2[2f5] Avg| 12.50| 0.2833| 0.021 Peak| | 0.2833| 0.855 ---------------+--------+--------+--------- RxCan2[300] Avg| 1.70| 0.0398| 0.023 Peak| | 0.0398| 0.488 ---------------+--------+--------+--------- RxCan2[310] Avg| 1.60| 0.0480| 0.026 Peak| | 0.0480| 0.937 ---------------+--------+--------+--------- RxCan2[320] Avg| 1.70| 0.0346| 0.020 Peak| | 0.0346| 0.370 ---------------+--------+--------+--------- RxCan2[326] Avg| 9.90| 0.2200| 0.022 Peak| | 0.2200| 0.502 ---------------+--------+--------+--------- RxCan2[330] Avg| 32.30| 0.7323| 0.021 Peak| | 0.7323| 1.130 ---------------+--------+--------+--------- RxCan2[340] Avg| 8.20| 0.2375| 0.028 Peak| | 0.2375| 0.578 ---------------+--------+--------+--------- RxCan2[345] Avg| 1.60| 0.0393| 0.022 Peak| | 0.0393| 0.590 ---------------+--------+--------+--------- RxCan2[35e] Avg| 5.00| 0.1303| 0.023 Peak| | 0.1303| 0.943 ---------------+--------+--------+--------- RxCan2[360] Avg| 1.70| 0.0381| 0.025 Peak| | 0.0381| 0.922 ---------------+--------+--------+--------- RxCan2[361] Avg| 8.20| 0.1907| 0.023 Peak| | 0.1907| 1.119 ---------------+--------+--------+--------- RxCan2[363] Avg| 1.30| 0.0337| 0.024 Peak| | 0.0337| 0.425 ---------------+--------+--------+--------- RxCan2[370] Avg| 0.90| 0.0194| 0.022 Peak| | 0.0194| 0.246 ---------------+--------+--------+--------- RxCan2[381] Avg| 3.20| 0.0684| 0.024 Peak| | 0.0684| 0.828 ---------------+--------+--------+--------- RxCan2[3a0] Avg| 16.60| 0.3734| 0.022 Peak| | 0.3734| 0.636 ---------------+--------+--------+--------- RxCan2[3d0] Avg| 10.00| 0.2262| 0.023 Peak| | 0.2262| 0.663 ---------------+--------+--------+--------- RxCan2[3d5] Avg| 5.60| 0.1335| 0.022 Peak| | 0.1335| 1.222 ---------------+--------+--------+--------- RxCan2[400] Avg| 4.00| 0.0949| 0.022 Peak| | 0.0949| 0.715 ---------------+--------+--------+--------- RxCan2[405] Avg| 3.70| 0.0861| 0.022 Peak| | 0.0861| 0.443 ---------------+--------+--------+--------- RxCan2[40a] Avg| 8.00| 0.1853| 0.021 Peak| | 0.1853| 0.552 ---------------+--------+--------+--------- RxCan2[415] Avg| 1.60| 0.0341| 0.021 Peak| | 0.0341| 0.273 ---------------+--------+--------+--------- RxCan2[435] Avg| 0.90| 0.0220| 0.025 Peak| | 0.0220| 0.354 ---------------+--------+--------+--------- RxCan2[440] Avg| 0.90| 0.0199| 0.021 Peak| | 0.0199| 0.266 ---------------+--------+--------+--------- RxCan2[465] Avg| 0.90| 0.0234| 0.028 Peak| | 0.0234| 0.633 ---------------+--------+--------+--------- RxCan2[466] Avg| 1.00| 0.0222| 0.021 Peak| | 0.0222| 0.322 ---------------+--------+--------+--------- RxCan2[467] Avg| 1.00| 0.0221| 0.020 Peak| | 0.0221| 0.355 ---------------+--------+--------+--------- RxCan2[501] Avg| 1.50| 0.0335| 0.023 Peak| | 0.0335| 0.393 ---------------+--------+--------+--------- RxCan2[503] Avg| 1.50| 0.0370| 0.022 Peak| | 0.0370| 0.546 ---------------+--------+--------+--------- RxCan2[504] Avg| 1.40| 0.0328| 0.022 Peak| | 0.0328| 0.489 ---------------+--------+--------+--------- RxCan2[505] Avg| 1.40| 0.0290| 0.021 Peak| | 0.0290| 0.354 ---------------+--------+--------+--------- RxCan2[508] Avg| 1.40| 0.0318| 0.023 Peak| | 0.0318| 0.408 ---------------+--------+--------+--------- RxCan2[511] Avg| 1.40| 0.0306| 0.022 Peak| | 0.0306| 0.328 ---------------+--------+--------+--------- RxCan2[51e] Avg| 1.40| 0.0310| 0.022 Peak| | 0.0310| 0.269 ---------------+--------+--------+--------- RxCan2[581] Avg| 1.00| 0.0222| 0.022 Peak| | 0.0222| 0.256 ---------------+--------+--------+--------- Cmd:State Avg| 0.00| 0.0000| 0.002 Peak| | 0.0000| 0.024 ===============+========+========+========= Total Avg| 2795.57| 82.7745| 40.174 Cheers, Simon Am 17.01.2025 um 17:49 schrieb Michael Balzer via OvmsDev:
OK, I've got a new idea: CAN timing.
Comparing our esp32can bit timing to the esp-idf driver's, there seem to be some differences: https://github.com/espressif/esp-idf/blob/master/components/hal/include/hal/...
Transceivers are normally tolerant to small timing offsets. Maybe being off a little bit has no effect under normal conditions, but it has when the transceiver has to cope with a filled RX queue. That could be causing the transceiver to slide just out of sync. If the timing gets garbled, the transceiver would signal errors in the packets to the bus, possibly so many the vehicle ECUs decide to raise an error condition.
Is that plausible?
On why the new poller could be causing this (in combination with too slow processing by the vehicle): as mentioned, the standard CAN listener mechanism doesn't care about queue overflows. The poller does. `OvmsPollers::Queue_PollerFrame()` does a log call when Tx/Rx tracing is enabled, that could even block, but tracing is optional and only meant for debugging. Not optional is the overflow counting using an atomic uint32.
The atomic types are said to be fast, but I never checked their actual implementation on the ESP32. Maybe they can block as well?
@Simon: it would be an option to try commenting out the overflow counting, to see if that's causing the issue.
Regards, Michael
Am 17.01.25 um 15:37 schrieb Chris Box via OvmsDev:
Yes, I can confirm I've had one experience of the Leaf switching to Neutral while driving, with a yellow warning symbol on the dash. It refused to reselect Drive until I had switched the car off and back on. Derek wasn't so lucky and he need to clear fault codes before the car would work.
On returning home, I found OVMS was not accessible over a network. I didn't try a USB cable. Unplugging and reinserting the OBD cable caused OVMS to rejoin Wi-Fi. However the SD logs showed nothing from the time of the event. CAN writes are enabled, so it can perform SOC limiting.
My car has been using this firmware since 21st November, based on the git master of that day. As a relatively new user of OVMS (only since October) I don't have much experience of older firmware.
Perhaps a safeguard should be implemented before releasing a new stable firmware that will be automatically downloaded by Leaf owners. But I don't have the expertise to know what that safeguard should be. Derek's suggestion of 'only CAN write when parked' appears to be a good idea.
Chris
On 2025-01-15 18:18, Derek Caudwell via OvmsDev wrote:
Since the following email I have high confidence the issue on the Leaf is related/caused by the poller as there has been no further occurrence and Chris has also experienced the car going to neutral on the new poller firmware.
.... I haven't ruled out it being a fault with my car yet. Shortly after it faulted the car was run into so has been off the road for sometime, my first step was to replace 12V battery. The ovms unit is now unplugged and if it does not fault over the next month while driving I'll be reasonably confident it's ovms related. Not sure which firmware version the poller updates were included in but it was only after upgrading to it that the errors occurred (which could be coincidental however it has faulted twice more both on version 3.3.004-141-gf729d82c). For periods where I reverted to 3.3.003 it was fine. It might be useful to have an extra option on the enable can write to only enable it when the car is parked/charging.
_______________________________________________ OvmsDev mailing list OvmsDev@lists.openvehicles.com http://lists.openvehicles.com/mailman/listinfo/ovmsdev
-- Michael Balzer * Am Rahmen 5 * D-58313 Herdecke Fon 02330 9104094 * Handy 0176 20698926
_______________________________________________ OvmsDev mailing list OvmsDev@lists.openvehicles.com http://lists.openvehicles.com/mailman/listinfo/ovmsdev
Ok, the fact that I no longer receive “Overflow Run” messages is obviously because I no longer count them at all due to the missing Atomic_Increment... I had initially read that the counter is still recorded in m_overflow_count. Am 17.01.2025 um 19:42 schrieb Simon Ehlen via OvmsDev:
The poller statistics can help you track this down, but you need to have at least 10 seconds of statistics, the more the better. Rule of thumb: PRI average at 0.0/second means you don't have enough data yet.
There were again many messages with “RX Task Queue Overflow Run”. Here are the statistics of poller times status:
OVMS# poll times status Poller timing is: on Type | count | Utlztn | Time | per s | [%] | [ms] ---------------+--------+--------+--------- Poll:PRI Avg| 1.00| 0.0043| 0.004 Peak| | 0.0043| 0.052 ---------------+--------+--------+--------- RxCan1[010] Avg| 34.26| 1.6741| 0.015 Peak| | 1.6741| 1.182 ---------------+--------+--------+--------- RxCan1[030] Avg| 34.06| 1.7085| 0.020 Peak| | 1.7085| 1.390 ---------------+--------+--------+--------- RxCan1[041] Avg| 49.89| 0.8109| 0.016 Peak| | 0.8541| 1.098 ---------------+--------+--------+--------- RxCan1[049] Avg| 50.00| 1.5970| 0.019 Peak| | 1.7154| 32.233 ---------------+--------+--------+--------- RxCan1[04c] Avg| 49.92| 0.8340| 0.014 Peak| | 0.8933| 1.995 ---------------+--------+--------+--------- RxCan1[04d] Avg| 34.43| 1.6211| 0.014 Peak| | 1.6756| 1.318 ---------------+--------+--------+--------- RxCan1[076] Avg| 50.00| 0.8362| 0.024 Peak| | 0.8784| 2.185 ---------------+--------+--------+--------- RxCan1[077] Avg| 50.00| 0.7837| 0.014 Peak| | 0.8083| 1.156 ---------------+--------+--------+--------- RxCan1[07a] Avg| 34.31| 2.1870| 0.017 Peak| | 2.3252| 1.888 ---------------+--------+--------+--------- RxCan1[07d] Avg| 50.00| 0.8001| 0.013 Peak| | 0.8434| 1.150 ---------------+--------+--------+--------- RxCan1[0c8] Avg| 49.96| 0.8359| 0.013 Peak| | 0.8715| 1.171 ---------------+--------+--------+--------- RxCan1[11a] Avg| 34.35| 1.6701| 0.020 Peak| | 1.6981| 1.273 ---------------+--------+--------+--------- RxCan1[130] Avg| 50.00| 0.7902| 0.018 Peak| | 0.8513| 0.980 ---------------+--------+--------+--------- RxCan1[139] Avg| 49.92| 0.7872| 0.013 Peak| | 0.8219| 0.795 ---------------+--------+--------+--------- RxCan1[156] Avg| 10.00| 0.1620| 0.014 Peak| | 0.1729| 0.919 ---------------+--------+--------+--------- RxCan1[160] Avg| 50.04| 0.7977| 0.014 Peak| | 0.8232| 1.495 ---------------+--------+--------+--------- RxCan1[165] Avg| 49.85| 0.7976| 0.014 Peak| | 0.8486| 1.015 ---------------+--------+--------+--------- RxCan1[167] Avg| 34.39| 1.6025| 0.016 Peak| | 1.6888| 1.354 ---------------+--------+--------+--------- RxCan1[171] Avg| 50.00| 0.8150| 0.017 Peak| | 0.8488| 1.091 ---------------+--------+--------+--------- RxCan1[178] Avg| 10.00| 0.1614| 0.014 Peak| | 0.1702| 0.903 ---------------+--------+--------+--------- RxCan1[179] Avg| 10.00| 0.1630| 0.017 Peak| | 0.1663| 1.336 ---------------+--------+--------+--------- RxCan1[180] Avg| 50.00| 0.8137| 0.014 Peak| | 0.8605| 1.566 ---------------+--------+--------+--------- RxCan1[185] Avg| 50.04| 0.8033| 0.013 Peak| | 0.8393| 1.126 ---------------+--------+--------+--------- RxCan1[1a0] Avg| 49.92| 0.7748| 0.013 Peak| | 0.8169| 1.184 ---------------+--------+--------+--------- RxCan1[1e0] Avg| 49.92| 0.7738| 0.014 Peak| | 0.8028| 1.049 ---------------+--------+--------+--------- RxCan1[1e4] Avg| 49.89| 0.9692| 0.018 Peak| | 1.0096| 1.332 ---------------+--------+--------+--------- RxCan1[1f0] Avg| 33.22| 0.5544| 0.014 Peak| | 0.5855| 0.848 ---------------+--------+--------+--------- RxCan1[200] Avg| 49.92| 0.7879| 0.015 Peak| | 0.8345| 1.206 ---------------+--------+--------+--------- RxCan1[202] Avg| 34.28| 1.7075| 0.016 Peak| | 1.7874| 1.218 ---------------+--------+--------+--------- RxCan1[204] Avg| 34.35| 1.5641| 0.013 Peak| | 1.6427| 1.235 ---------------+--------+--------+--------- RxCan1[213] Avg| 49.89| 0.7814| 0.015 Peak| | 0.8232| 0.910 ---------------+--------+--------+--------- RxCan1[214] Avg| 49.92| 0.7736| 0.014 Peak| | 0.8216| 0.800 ---------------+--------+--------+--------- RxCan1[217] Avg| 34.31| 1.6294| 0.014 Peak| | 1.7165| 1.153 ---------------+--------+--------+--------- RxCan1[218] Avg| 49.86| 0.7877| 0.013 Peak| | 0.8290| 1.068 ---------------+--------+--------+--------- RxCan1[230] Avg| 50.00| 0.7596| 0.014 Peak| | 0.7660| 1.021 ---------------+--------+--------+--------- RxCan1[240] Avg| 10.00| 0.1669| 0.013 Peak| | 0.1835| 0.887 ---------------+--------+--------+--------- RxCan1[242] Avg| 24.96| 0.4764| 0.020 Peak| | 0.4963| 1.501 ---------------+--------+--------+--------- RxCan1[24a] Avg| 9.89| 0.1789| 0.015 Peak| | 0.2009| 0.874 ---------------+--------+--------+--------- RxCan1[24b] Avg| 9.89| 0.1702| 0.014 Peak| | 0.1870| 1.195 ---------------+--------+--------+--------- RxCan1[24c] Avg| 9.89| 0.2146| 0.019 Peak| | 0.2187| 1.242 ---------------+--------+--------+--------- RxCan1[25a] Avg| 10.00| 0.1603| 0.013 Peak| | 0.1667| 0.720 ---------------+--------+--------+--------- RxCan1[25b] Avg| 49.94| 0.7918| 0.017 Peak| | 0.8454| 1.666 ---------------+--------+--------+--------- RxCan1[25c] Avg| 34.24| 1.5331| 0.013 Peak| | 1.5997| 1.538 ---------------+--------+--------+--------- RxCan1[260] Avg| 10.00| 0.1626| 0.014 Peak| | 0.1682| 0.718 ---------------+--------+--------+--------- RxCan1[270] Avg| 49.90| 0.8120| 0.014 Peak| | 0.8460| 1.671 ---------------+--------+--------+--------- RxCan1[280] Avg| 49.92| 0.7777| 0.019 Peak| | 0.8447| 1.157 ---------------+--------+--------+--------- RxCan1[2e4] Avg| 19.89| 0.5778| 0.032 Peak| | 0.6648| 2.226 ---------------+--------+--------+--------- RxCan1[2ec] Avg| 10.00| 0.1701| 0.014 Peak| | 0.1755| 0.928 ---------------+--------+--------+--------- RxCan1[2ed] Avg| 10.00| 0.1650| 0.013 Peak| | 0.1747| 0.917 ---------------+--------+--------+--------- RxCan1[2ee] Avg| 9.98| 0.1544| 0.013 Peak| | 0.1588| 1.312 ---------------+--------+--------+--------- RxCan1[312] Avg| 10.00| 0.1648| 0.017 Peak| | 0.1690| 0.922 ---------------+--------+--------+--------- RxCan1[326] Avg| 9.89| 0.1603| 0.015 Peak| | 0.1833| 1.230 ---------------+--------+--------+--------- RxCan1[336] Avg| 1.00| 0.0146| 0.015 Peak| | 0.0150| 0.349 ---------------+--------+--------+--------- RxCan1[352] Avg| 6.66| 0.1223| 0.022 Peak| | 0.1338| 1.015 ---------------+--------+--------+--------- RxCan1[355] Avg| 2.00| 0.0424| 0.019 Peak| | 0.0431| 0.786 ---------------+--------+--------+--------- RxCan1[35e] Avg| 9.96| 0.1570| 0.013 Peak| | 0.1644| 0.579 ---------------+--------+--------+--------- RxCan1[365] Avg| 10.00| 0.1600| 0.014 Peak| | 0.1653| 0.961 ---------------+--------+--------+--------- RxCan1[366] Avg| 10.00| 0.1716| 0.013 Peak| | 0.1890| 0.987 ---------------+--------+--------+--------- RxCan1[367] Avg| 9.93| 0.1793| 0.015 Peak| | 0.1864| 0.984 ---------------+--------+--------+--------- RxCan1[368] Avg| 10.00| 0.1645| 0.014 Peak| | 0.1778| 0.768 ---------------+--------+--------+--------- RxCan1[369] Avg| 10.00| 0.1562| 0.016 Peak| | 0.1606| 0.724 ---------------+--------+--------+--------- RxCan1[380] Avg| 10.00| 0.1619| 0.014 Peak| | 0.1644| 0.605 ---------------+--------+--------+--------- RxCan1[38b] Avg| 25.00| 0.3991| 0.016 Peak| | 0.4280| 1.448 ---------------+--------+--------+--------- RxCan1[3b3] Avg| 10.00| 0.1537| 0.013 Peak| | 0.1610| 0.380 ---------------+--------+--------+--------- RxCan1[400] Avg| 4.00| 0.0626| 0.014 Peak| | 0.0626| 0.251 ---------------+--------+--------+--------- RxCan1[405] Avg| 3.90| 0.1019| 0.028 Peak| | 0.1019| 0.781 ---------------+--------+--------+--------- RxCan1[40a] Avg| 7.90| 0.1256| 0.020 Peak| | 0.1256| 0.991 ---------------+--------+--------+--------- RxCan1[410] Avg| 10.00| 0.1643| 0.016 Peak| | 0.1839| 1.634 ---------------+--------+--------+--------- RxCan1[411] Avg| 10.00| 0.1532| 0.013 Peak| | 0.1645| 0.824 ---------------+--------+--------+--------- RxCan1[416] Avg| 10.00| 0.1516| 0.016 Peak| | 0.1582| 0.807 ---------------+--------+--------+--------- RxCan1[421] Avg| 10.00| 0.1648| 0.013 Peak| | 0.1740| 0.839 ---------------+--------+--------+--------- RxCan1[42d] Avg| 10.00| 0.1548| 0.014 Peak| | 0.1658| 0.741 ---------------+--------+--------+--------- RxCan1[42f] Avg| 10.00| 0.1527| 0.013 Peak| | 0.1578| 0.667 ---------------+--------+--------+--------- RxCan1[430] Avg| 10.00| 0.1730| 0.016 Peak| | 0.1880| 1.209 ---------------+--------+--------+--------- RxCan1[434] Avg| 10.00| 0.1620| 0.021 Peak| | 0.1712| 1.140 ---------------+--------+--------+--------- RxCan1[435] Avg| 6.66| 0.1104| 0.014 Peak| | 0.1121| 1.011 ---------------+--------+--------+--------- RxCan1[43e] Avg| 20.00| 0.3194| 0.013 Peak| | 0.3434| 1.212 ---------------+--------+--------+--------- RxCan1[440] Avg| 1.00| 0.0160| 0.014 Peak| | 0.0175| 0.315 ---------------+--------+--------+--------- RxCan1[465] Avg| 1.00| 0.0172| 0.015 Peak| | 0.0194| 0.404 ---------------+--------+--------+--------- RxCan1[466] Avg| 1.00| 0.0198| 0.015 Peak| | 0.0252| 0.890 ---------------+--------+--------+--------- RxCan1[467] Avg| 1.00| 0.0152| 0.014 Peak| | 0.0160| 0.217 ---------------+--------+--------+--------- RxCan1[472] Avg| 0.70| 0.0533| 0.075 Peak| | 0.0546| 0.990 ---------------+--------+--------+--------- RxCan1[473] Avg| 0.65| 0.0325| 0.051 Peak| | 0.0361| 0.774 ---------------+--------+--------+--------- RxCan1[474] Avg| 1.00| 0.0146| 0.014 Peak| | 0.0151| 0.189 ---------------+--------+--------+--------- RxCan1[475] Avg| 2.00| 0.0332| 0.015 Peak| | 0.0362| 0.513 ---------------+--------+--------+--------- RxCan1[476] Avg| 2.00| 0.0305| 0.014 Peak| | 0.0307| 0.249 ---------------+--------+--------+--------- RxCan1[477] Avg| 2.00| 0.0309| 0.014 Peak| | 0.0311| 0.438 ---------------+--------+--------+--------- RxCan1[595] Avg| 1.00| 0.0151| 0.014 Peak| | 0.0160| 0.230 ---------------+--------+--------+--------- RxCan1[59e] Avg| 1.00| 0.0179| 0.015 Peak| | 0.0209| 0.716 ---------------+--------+--------+--------- RxCan1[5a2] Avg| 1.00| 0.0154| 0.016 Peak| | 0.0184| 0.699 ---------------+--------+--------+--------- RxCan1[5ba] Avg| 1.00| 0.0159| 0.017 Peak| | 0.0174| 0.485 ---------------+--------+--------+--------- RxCan2[010] Avg| 0.00| 0.0000| 0.015 Peak| | 0.0000| 0.146 ---------------+--------+--------+--------- RxCan2[020] Avg| 31.10| 0.5159| 0.015 Peak| | 0.5730| 0.992 ---------------+--------+--------+--------- RxCan2[030] Avg| 20.70| 0.3506| 0.016 Peak| | 0.3956| 1.055 ---------------+--------+--------+--------- RxCan2[03a] Avg| 18.65| 0.3157| 0.014 Peak| | 0.3292| 0.702 ---------------+--------+--------+--------- RxCan2[040] Avg| 18.60| 0.3111| 0.015 Peak| | 0.3474| 0.953 ---------------+--------+--------+--------- RxCan2[060] Avg| 18.60| 0.3182| 0.014 Peak| | 0.3569| 0.694 ---------------+--------+--------+--------- RxCan2[070] Avg| 15.55| 0.4581| 0.017 Peak| | 0.6859| 39.212 ---------------+--------+--------+--------- RxCan2[080] Avg| 15.50| 0.5041| 0.029 Peak| | 0.5414| 1.555 ---------------+--------+--------+--------- RxCan2[083] Avg| 18.70| 0.3083| 0.014 Peak| | 0.3325| 0.557 ---------------+--------+--------+--------- RxCan2[090] Avg| 23.40| 0.3961| 0.014 Peak| | 0.4445| 1.218 ---------------+--------+--------+--------- RxCan2[0a0] Avg| 15.55| 0.2734| 0.014 Peak| | 0.3144| 1.062 ---------------+--------+--------+--------- RxCan2[100] Avg| 15.50| 0.2645| 0.016 Peak| | 0.2875| 1.021 ---------------+--------+--------+--------- RxCan2[108] Avg| 23.40| 0.4231| 0.016 Peak| | 0.4680| 1.297 ---------------+--------+--------+--------- RxCan2[110] Avg| 15.55| 0.2467| 0.014 Peak| | 0.2684| 0.475 ---------------+--------+--------+--------- RxCan2[130] Avg| 13.30| 0.2231| 0.014 Peak| | 0.2447| 0.512 ---------------+--------+--------+--------- RxCan2[150] Avg| 15.50| 0.2533| 0.015 Peak| | 0.2836| 0.823 ---------------+--------+--------+--------- RxCan2[160] Avg| 4.70| 0.0784| 0.014 Peak| | 0.0863| 0.608 ---------------+--------+--------+--------- RxCan2[180] Avg| 15.55| 0.2713| 0.015 Peak| | 0.2841| 0.884 ---------------+--------+--------+--------- RxCan2[190] Avg| 15.50| 0.2596| 0.014 Peak| | 0.2825| 0.743 ---------------+--------+--------+--------- RxCan2[1a0] Avg| 0.95| 0.0164| 0.015 Peak| | 0.0164| 0.346 ---------------+--------+--------+--------- RxCan2[1a4] Avg| 18.65| 0.3232| 0.015 Peak| | 0.3515| 0.989 ---------------+--------+--------+--------- RxCan2[1a8] Avg| 11.60| 0.1911| 0.016 Peak| | 0.2012| 0.757 ---------------+--------+--------+--------- RxCan2[1b0] Avg| 9.35| 0.1558| 0.016 Peak| | 0.1641| 0.795 ---------------+--------+--------+--------- RxCan2[1b4] Avg| 9.35| 0.1543| 0.015 Peak| | 0.1617| 1.217 ---------------+--------+--------+--------- RxCan2[1b8] Avg| 11.65| 0.2003| 0.014 Peak| | 0.2236| 1.549 ---------------+--------+--------+--------- RxCan2[1c0] Avg| 9.40| 0.1532| 0.016 Peak| | 0.1673| 0.955 ---------------+--------+--------+--------- RxCan2[1e0] Avg| 9.30| 0.1582| 0.015 Peak| | 0.1708| 0.661 ---------------+--------+--------+--------- RxCan2[215] Avg| 7.80| 0.1409| 0.016 Peak| | 0.1531| 0.660 ---------------+--------+--------+--------- RxCan2[217] Avg| 7.80| 0.1239| 0.014 Peak| | 0.1333| 0.520 ---------------+--------+--------+--------- RxCan2[220] Avg| 6.20| 0.1041| 0.015 Peak| | 0.1094| 0.652 ---------------+--------+--------+--------- RxCan2[225] Avg| 23.40| 0.4648| 0.015 Peak| | 0.4696| 4.288 ---------------+--------+--------+--------- RxCan2[230] Avg| 6.20| 0.3120| 0.048 Peak| | 0.3377| 1.065 ---------------+--------+--------+--------- RxCan2[240] Avg| 7.70| 0.1248| 0.014 Peak| | 0.1364| 0.635 ---------------+--------+--------+--------- RxCan2[241] Avg| 18.60| 0.3258| 0.014 Peak| | 0.3343| 1.288 ---------------+--------+--------+--------- RxCan2[250] Avg| 4.70| 0.0761| 0.014 Peak| | 0.0809| 0.322 ---------------+--------+--------+--------- RxCan2[255] Avg| 11.75| 0.2058| 0.014 Peak| | 0.2283| 0.937 ---------------+--------+--------+--------- RxCan2[265] Avg| 11.65| 0.1964| 0.014 Peak| | 0.2068| 0.965 ---------------+--------+--------+--------- RxCan2[270] Avg| 4.70| 0.0808| 0.016 Peak| | 0.0949| 0.729 ---------------+--------+--------+--------- RxCan2[290] Avg| 3.15| 0.0498| 0.015 Peak| | 0.0504| 0.449 ---------------+--------+--------+--------- RxCan2[295] Avg| 6.25| 0.1019| 0.014 Peak| | 0.1094| 0.859 ---------------+--------+--------+--------- RxCan2[2a0] Avg| 3.15| 0.0550| 0.014 Peak| | 0.0551| 0.779 ---------------+--------+--------+--------- RxCan2[2a7] Avg| 11.65| 0.1929| 0.014 Peak| | 0.2080| 0.775 ---------------+--------+--------+--------- RxCan2[2b0] Avg| 3.00| 0.0497| 0.015 Peak| | 0.0562| 0.528 ---------------+--------+--------+--------- RxCan2[2c0] Avg| 3.10| 0.0534| 0.016 Peak| | 0.0592| 0.501 ---------------+--------+--------+--------- RxCan2[2e0] Avg| 1.55| 0.0247| 0.014 Peak| | 0.0289| 0.319 ---------------+--------+--------+--------- RxCan2[2f0] Avg| 1.55| 0.0244| 0.014 Peak| | 0.0273| 0.192 ---------------+--------+--------+--------- RxCan2[2f5] Avg| 11.65| 0.2078| 0.016 Peak| | 0.2333| 0.879 ---------------+--------+--------+--------- RxCan2[300] Avg| 1.60| 0.0266| 0.018 Peak| | 0.0278| 0.724 ---------------+--------+--------+--------- RxCan2[310] Avg| 1.55| 0.0276| 0.016 Peak| | 0.0285| 0.759 ---------------+--------+--------+--------- RxCan2[320] Avg| 1.60| 0.0240| 0.014 Peak| | 0.0258| 0.179 ---------------+--------+--------+--------- RxCan2[326] Avg| 9.30| 0.1550| 0.014 Peak| | 0.1582| 0.850 ---------------+--------+--------+--------- RxCan2[330] Avg| 29.95| 0.5311| 0.015 Peak| | 0.5565| 4.522 ---------------+--------+--------+--------- RxCan2[340] Avg| 7.75| 0.1693| 0.024 Peak| | 0.1868| 1.148 ---------------+--------+--------+--------- RxCan2[345] Avg| 1.60| 0.0292| 0.016 Peak| | 0.0316| 0.471 ---------------+--------+--------+--------- RxCan2[350] Avg| 0.00| 0.0000| 0.019 Peak| | 0.0000| 0.188 ---------------+--------+--------+--------- RxCan2[35e] Avg| 4.70| 0.0851| 0.019 Peak| | 0.0911| 1.023 ---------------+--------+--------+--------- RxCan2[360] Avg| 1.60| 0.0258| 0.015 Peak| | 0.0284| 0.306 ---------------+--------+--------+--------- RxCan2[361] Avg| 7.75| 0.1341| 0.017 Peak| | 0.1487| 0.761 ---------------+--------+--------+--------- RxCan2[363] Avg| 1.20| 0.0203| 0.016 Peak| | 0.0220| 0.421 ---------------+--------+--------+--------- RxCan2[370] Avg| 0.85| 0.0140| 0.016 Peak| | 0.0162| 0.354 ---------------+--------+--------+--------- RxCan2[381] Avg| 3.15| 0.0512| 0.016 Peak| | 0.0546| 0.416 ---------------+--------+--------+--------- RxCan2[3a0] Avg| 15.60| 0.2548| 0.015 Peak| | 0.2890| 0.976 ---------------+--------+--------+--------- RxCan2[3d0] Avg| 9.35| 0.1553| 0.019 Peak| | 0.1612| 1.115 ---------------+--------+--------+--------- RxCan2[3d5] Avg| 5.15| 0.0836| 0.016 Peak| | 0.0867| 0.479 ---------------+--------+--------+--------- RxCan2[3e0] Avg| 0.00| 0.0000| 0.014 Peak| | 0.0000| 0.142 ---------------+--------+--------+--------- RxCan2[400] Avg| 3.55| 0.0613| 0.017 Peak| | 0.0695| 0.501 ---------------+--------+--------+--------- RxCan2[405] Avg| 3.50| 0.0584| 0.018 Peak| | 0.0626| 0.686 ---------------+--------+--------+--------- RxCan2[40a] Avg| 7.10| 0.1278| 0.017 Peak| | 0.1389| 1.244 ---------------+--------+--------+--------- RxCan2[415] Avg| 1.60| 0.0258| 0.014 Peak| | 0.0287| 0.266 ---------------+--------+--------+--------- RxCan2[435] Avg| 0.85| 0.0165| 0.019 Peak| | 0.0167| 0.367 ---------------+--------+--------+--------- RxCan2[440] Avg| 0.85| 0.0128| 0.019 Peak| | 0.0141| 0.885 ---------------+--------+--------+--------- RxCan2[465] Avg| 0.95| 0.0177| 0.016 Peak| | 0.0195| 0.721 ---------------+--------+--------+--------- RxCan2[466] Avg| 0.95| 0.0147| 0.014 Peak| | 0.0160| 0.184 ---------------+--------+--------+--------- RxCan2[467] Avg| 0.95| 0.0172| 0.017 Peak| | 0.0188| 0.391 ---------------+--------+--------+--------- RxCan2[501] Avg| 1.45| 0.0273| 0.016 Peak| | 0.0327| 0.996 ---------------+--------+--------+--------- RxCan2[503] Avg| 1.45| 0.0288| 0.020 Peak| | 0.0338| 0.970 ---------------+--------+--------+--------- RxCan2[504] Avg| 1.40| 0.0241| 0.015 Peak| | 0.0263| 0.609 ---------------+--------+--------+--------- RxCan2[505] Avg| 1.40| 0.0255| 0.015 Peak| | 0.0296| 0.866 ---------------+--------+--------+--------- RxCan2[508] Avg| 1.35| 0.0237| 0.017 Peak| | 0.0237| 0.384 ---------------+--------+--------+--------- RxCan2[511] Avg| 1.35| 0.0226| 0.016 Peak| | 0.0228| 0.426 ---------------+--------+--------+--------- RxCan2[51e] Avg| 1.40| 0.0221| 0.014 Peak| | 0.0245| 0.211 ---------------+--------+--------+--------- RxCan2[581] Avg| 0.80| 0.0189| 0.019 Peak| | 0.0290| 1.217 ---------------+--------+--------+--------- RxCan2[606] Avg| 0.00| 0.0000| 0.014 Peak| | 0.0000| 0.142 ---------------+--------+--------+--------- RxCan2[657] Avg| 0.00| 0.0000| 0.014 Peak| | 0.0000| 0.137 ---------------+--------+--------+--------- Cmd:State Avg| 0.00| 0.0000| 0.002 Peak| | 0.0000| 0.024 ===============+========+========+========= Total Avg| 2748.42| 58.3344| 28.718
@Simon: it would be an option to try commenting out the overflow counting, to see if that's causing the issue.
I have commented out the line with the Atomic_Increment statement. Now I no longer receive any messages with “RX Task Queue Overflow Run” Here is the output of poller times status:
OVMS# poll time status Poller timing is: on Type | count | Utlztn | Time | per s | [%] | [ms] ---------------+--------+--------+--------- Poll:PRI Avg| 1.00| 0.0045| 0.004 Peak| | 0.0046| 0.064 ---------------+--------+--------+--------- RxCan1[010] Avg| 34.26| 2.2574| 0.021 Peak| | 2.2574| 4.609 ---------------+--------+--------+--------- RxCan1[030] Avg| 34.26| 2.3820| 0.021 Peak| | 2.3820| 1.135 ---------------+--------+--------+--------- RxCan1[041] Avg| 49.89| 1.2059| 0.021 Peak| | 1.2295| 5.331 ---------------+--------+--------+--------- RxCan1[049] Avg| 49.96| 1.2400| 0.030 Peak| | 1.2699| 1.402 ---------------+--------+--------+--------- RxCan1[04c] Avg| 49.92| 1.1752| 0.021 Peak| | 1.2072| 4.502 ---------------+--------+--------+--------- RxCan1[04d] Avg| 34.31| 2.4433| 0.022 Peak| | 2.4773| 1.368 ---------------+--------+--------+--------- RxCan1[076] Avg| 49.96| 1.2071| 0.024 Peak| | 1.2554| 2.007 ---------------+--------+--------+--------- RxCan1[077] Avg| 49.96| 1.2012| 0.022 Peak| | 1.2492| 1.955 ---------------+--------+--------+--------- RxCan1[07a] Avg| 34.35| 2.9251| 0.030 Peak| | 3.1103| 1.829 ---------------+--------+--------+--------- RxCan1[07d] Avg| 49.96| 1.1954| 0.022 Peak| | 1.2282| 1.074 ---------------+--------+--------+--------- RxCan1[0c8] Avg| 49.89| 1.2491| 0.021 Peak| | 1.3169| 1.181 ---------------+--------+--------+--------- RxCan1[11a] Avg| 34.39| 2.4423| 0.024 Peak| | 2.5693| 1.491 ---------------+--------+--------+--------- RxCan1[130] Avg| 49.95| 1.1312| 0.020 Peak| | 1.1684| 1.218 ---------------+--------+--------+--------- RxCan1[139] Avg| 49.92| 1.1547| 0.021 Peak| | 1.1778| 1.199 ---------------+--------+--------+--------- RxCan1[156] Avg| 9.96| 0.2391| 0.023 Peak| | 0.2591| 1.943 ---------------+--------+--------+--------- RxCan1[160] Avg| 49.96| 1.1657| 0.031 Peak| | 1.2017| 2.158 ---------------+--------+--------+--------- RxCan1[165] Avg| 49.96| 1.1257| 0.021 Peak| | 1.1652| 1.471 ---------------+--------+--------+--------- RxCan1[167] Avg| 34.31| 2.2871| 0.021 Peak| | 2.3374| 1.776 ---------------+--------+--------+--------- RxCan1[171] Avg| 49.96| 1.1879| 0.023 Peak| | 1.2268| 1.166 ---------------+--------+--------+--------- RxCan1[178] Avg| 10.00| 0.2371| 0.029 Peak| | 0.2459| 1.516 ---------------+--------+--------+--------- RxCan1[179] Avg| 10.00| 0.2196| 0.021 Peak| | 0.2260| 0.758 ---------------+--------+--------+--------- RxCan1[180] Avg| 49.96| 1.1703| 0.022 Peak| | 1.2103| 1.481 ---------------+--------+--------+--------- RxCan1[185] Avg| 49.95| 1.1127| 0.020 Peak| | 1.1636| 1.292 ---------------+--------+--------+--------- RxCan1[1a0] Avg| 49.96| 1.1009| 0.020 Peak| | 1.1468| 1.060 ---------------+--------+--------+--------- RxCan1[1e0] Avg| 49.96| 1.1744| 0.021 Peak| | 1.2027| 1.240 ---------------+--------+--------+--------- RxCan1[1e4] Avg| 49.96| 1.3733| 0.032 Peak| | 1.4085| 1.523 ---------------+--------+--------+--------- RxCan1[1f0] Avg| 33.30| 0.7625| 0.023 Peak| | 0.8004| 3.349 ---------------+--------+--------+--------- RxCan1[200] Avg| 49.92| 1.1462| 0.021 Peak| | 1.1809| 1.254 ---------------+--------+--------+--------- RxCan1[202] Avg| 34.39| 2.4034| 0.028 Peak| | 2.5611| 1.472 ---------------+--------+--------+--------- RxCan1[204] Avg| 34.30| 2.2541| 0.022 Peak| | 2.2924| 2.015 ---------------+--------+--------+--------- RxCan1[213] Avg| 49.96| 1.1599| 0.027 Peak| | 1.1794| 1.714 ---------------+--------+--------+--------- RxCan1[214] Avg| 49.96| 1.1537| 0.022 Peak| | 1.1941| 1.439 ---------------+--------+--------+--------- RxCan1[217] Avg| 34.39| 2.2490| 0.020 Peak| | 2.2856| 3.766 ---------------+--------+--------+--------- RxCan1[218] Avg| 49.96| 1.1291| 0.021 Peak| | 1.1646| 1.547 ---------------+--------+--------+--------- RxCan1[230] Avg| 49.96| 1.1272| 0.020 Peak| | 1.2237| 1.295 ---------------+--------+--------+--------- RxCan1[240] Avg| 10.00| 0.2191| 0.021 Peak| | 0.2226| 1.067 ---------------+--------+--------+--------- RxCan1[242] Avg| 24.96| 0.6911| 0.024 Peak| | 0.7161| 1.180 ---------------+--------+--------+--------- RxCan1[24a] Avg| 9.96| 0.2345| 0.024 Peak| | 0.2535| 0.779 ---------------+--------+--------+--------- RxCan1[24b] Avg| 9.96| 0.2433| 0.023 Peak| | 0.2697| 2.085 ---------------+--------+--------+--------- RxCan1[24c] Avg| 9.96| 0.3103| 0.029 Peak| | 0.3203| 0.809 ---------------+--------+--------+--------- RxCan1[25a] Avg| 10.00| 0.2346| 0.022 Peak| | 0.2405| 1.223 ---------------+--------+--------+--------- RxCan1[25b] Avg| 49.89| 1.2121| 0.020 Peak| | 1.3659| 19.523 ---------------+--------+--------+--------- RxCan1[25c] Avg| 34.31| 2.4193| 0.019 Peak| | 2.8022| 58.153 ---------------+--------+--------+--------- RxCan1[260] Avg| 9.93| 0.2149| 0.024 Peak| | 0.2174| 1.096 ---------------+--------+--------+--------- RxCan1[270] Avg| 49.96| 1.2042| 0.026 Peak| | 1.2755| 20.612 ---------------+--------+--------+--------- RxCan1[280] Avg| 49.96| 1.0922| 0.020 Peak| | 1.1312| 1.266 ---------------+--------+--------+--------- RxCan1[2e4] Avg| 19.96| 0.6942| 0.044 Peak| | 0.8604| 1.533 ---------------+--------+--------+--------- RxCan1[2ec] Avg| 10.00| 0.3727| 0.025 Peak| | 0.5154| 28.819 ---------------+--------+--------+--------- RxCan1[2ed] Avg| 10.00| 0.2298| 0.023 Peak| | 0.2378| 1.345 ---------------+--------+--------+--------- RxCan1[2ee] Avg| 9.96| 0.2172| 0.019 Peak| | 0.2210| 1.058 ---------------+--------+--------+--------- RxCan1[312] Avg| 10.00| 0.2206| 0.020 Peak| | 0.2396| 1.060 ---------------+--------+--------+--------- RxCan1[326] Avg| 9.96| 0.2099| 0.020 Peak| | 0.2158| 0.507 ---------------+--------+--------+--------- RxCan1[336] Avg| 1.00| 0.0212| 0.020 Peak| | 0.0233| 0.315 ---------------+--------+--------+--------- RxCan1[352] Avg| 6.64| 0.1675| 0.024 Peak| | 0.1818| 1.048 ---------------+--------+--------+--------- RxCan1[355] Avg| 2.00| 0.0540| 0.027 Peak| | 0.0619| 1.209 ---------------+--------+--------+--------- RxCan1[35e] Avg| 9.98| 0.2221| 0.021 Peak| | 0.2284| 1.186 ---------------+--------+--------+--------- RxCan1[365] Avg| 10.00| 0.2282| 0.023 Peak| | 0.2335| 0.769 ---------------+--------+--------+--------- RxCan1[366] Avg| 10.00| 0.3163| 0.022 Peak| | 0.6330| 23.587 ---------------+--------+--------+--------- RxCan1[367] Avg| 10.00| 0.2417| 0.021 Peak| | 0.2568| 1.417 ---------------+--------+--------+--------- RxCan1[368] Avg| 9.96| 0.2187| 0.019 Peak| | 0.2250| 1.135 ---------------+--------+--------+--------- RxCan1[369] Avg| 9.99| 0.2277| 0.021 Peak| | 0.2334| 0.667 ---------------+--------+--------+--------- RxCan1[380] Avg| 9.96| 0.2133| 0.020 Peak| | 0.2161| 0.560 ---------------+--------+--------+--------- RxCan1[38b] Avg| 24.92| 0.5622| 0.022 Peak| | 0.5716| 1.618 ---------------+--------+--------+--------- RxCan1[3b3] Avg| 10.00| 0.2132| 0.023 Peak| | 0.2194| 1.106 ---------------+--------+--------+--------- RxCan1[400] Avg| 4.00| 0.0885| 0.019 Peak| | 0.0885| 0.570 ---------------+--------+--------+--------- RxCan1[405] Avg| 3.70| 0.1414| 0.036 Peak| | 0.1414| 0.710 ---------------+--------+--------+--------- RxCan1[40a] Avg| 8.00| 0.1887| 0.021 Peak| | 0.1887| 1.027 ---------------+--------+--------+--------- RxCan1[410] Avg| 10.00| 0.2141| 0.023 Peak| | 0.2188| 0.984 ---------------+--------+--------+--------- RxCan1[411] Avg| 10.00| 0.2325| 0.023 Peak| | 0.2447| 0.660 ---------------+--------+--------+--------- RxCan1[416] Avg| 10.00| 0.2326| 0.022 Peak| | 0.2389| 0.774 ---------------+--------+--------+--------- RxCan1[421] Avg| 10.00| 0.2245| 0.021 Peak| | 0.2271| 1.160 ---------------+--------+--------+--------- RxCan1[42d] Avg| 10.00| 0.2315| 0.021 Peak| | 0.2411| 0.677 ---------------+--------+--------+--------- RxCan1[42f] Avg| 10.00| 0.2480| 0.020 Peak| | 0.2975| 8.093 ---------------+--------+--------+--------- RxCan1[430] Avg| 10.00| 0.2203| 0.019 Peak| | 0.2302| 0.847 ---------------+--------+--------+--------- RxCan1[434] Avg| 10.00| 0.2331| 0.019 Peak| | 0.2620| 1.150 ---------------+--------+--------+--------- RxCan1[435] Avg| 6.68| 0.1445| 0.020 Peak| | 0.1486| 1.063 ---------------+--------+--------+--------- RxCan1[43e] Avg| 20.00| 0.4515| 0.021 Peak| | 0.4632| 1.013 ---------------+--------+--------+--------- RxCan1[440] Avg| 1.00| 0.0210| 0.019 Peak| | 0.0218| 0.294 ---------------+--------+--------+--------- RxCan1[465] Avg| 0.95| 0.0214| 0.023 Peak| | 0.0215| 0.587 ---------------+--------+--------+--------- RxCan1[466] Avg| 0.95| 0.0211| 0.021 Peak| | 0.0215| 0.350 ---------------+--------+--------+--------- RxCan1[467] Avg| 0.95| 0.0191| 0.020 Peak| | 0.0201| 0.444 ---------------+--------+--------+--------- RxCan1[472] Avg| 0.68| 0.0588| 0.085 Peak| | 0.0606| 1.170 ---------------+--------+--------+--------- RxCan1[473] Avg| 0.66| 0.0407| 0.062 Peak| | 0.0492| 1.329 ---------------+--------+--------+--------- RxCan1[474] Avg| 1.00| 0.0218| 0.021 Peak| | 0.0237| 0.278 ---------------+--------+--------+--------- RxCan1[475] Avg| 1.96| 0.0466| 0.024 Peak| | 0.0570| 1.112 ---------------+--------+--------+--------- RxCan1[476] Avg| 2.00| 0.0454| 0.020 Peak| | 0.0497| 0.409 ---------------+--------+--------+--------- RxCan1[477] Avg| 2.00| 0.0497| 0.022 Peak| | 0.0595| 0.864 ---------------+--------+--------+--------- RxCan1[595] Avg| 1.00| 0.0223| 0.021 Peak| | 0.0241| 0.296 ---------------+--------+--------+--------- RxCan1[59e] Avg| 1.00| 0.0233| 0.024 Peak| | 0.0289| 0.713 ---------------+--------+--------+--------- RxCan1[5a2] Avg| 1.00| 0.0200| 0.020 Peak| | 0.0204| 0.264 ---------------+--------+--------+--------- RxCan1[5ba] Avg| 1.00| 0.0206| 0.021 Peak| | 0.0238| 0.515 ---------------+--------+--------+--------- RxCan2[020] Avg| 33.30| 0.7938| 0.022 Peak| | 0.7938| 4.793 ---------------+--------+--------+--------- RxCan2[030] Avg| 22.20| 0.5229| 0.022 Peak| | 0.5229| 0.985 ---------------+--------+--------+--------- RxCan2[03a] Avg| 19.90| 0.4700| 0.022 Peak| | 0.4700| 0.804 ---------------+--------+--------+--------- RxCan2[040] Avg| 19.90| 0.4678| 0.023 Peak| | 0.4678| 1.222 ---------------+--------+--------+--------- RxCan2[060] Avg| 20.00| 0.6480| 0.050 Peak| | 0.6480| 20.997 ---------------+--------+--------+--------- RxCan2[070] Avg| 16.60| 0.3944| 0.022 Peak| | 0.3944| 1.053 ---------------+--------+--------+--------- RxCan2[080] Avg| 16.70| 0.7032| 0.041 Peak| | 0.7032| 1.611 ---------------+--------+--------+--------- RxCan2[083] Avg| 20.10| 0.4329| 0.021 Peak| | 0.4329| 0.520 ---------------+--------+--------+--------- RxCan2[090] Avg| 24.90| 0.5674| 0.017 Peak| | 0.5674| 1.149 ---------------+--------+--------+--------- RxCan2[0a0] Avg| 16.60| 0.3836| 0.023 Peak| | 0.3836| 0.933 ---------------+--------+--------+--------- RxCan2[100] Avg| 16.50| 0.3661| 0.021 Peak| | 0.3661| 0.740 ---------------+--------+--------+--------- RxCan2[108] Avg| 24.90| 0.5923| 0.025 Peak| | 0.5923| 0.859 ---------------+--------+--------+--------- RxCan2[110] Avg| 16.70| 0.3906| 0.023 Peak| | 0.3906| 0.697 ---------------+--------+--------+--------- RxCan2[130] Avg| 14.40| 0.3341| 0.022 Peak| | 0.3341| 0.829 ---------------+--------+--------+--------- RxCan2[150] Avg| 16.50| 0.4025| 0.020 Peak| | 0.4025| 1.120 ---------------+--------+--------+--------- RxCan2[160] Avg| 4.90| 0.1252| 0.025 Peak| | 0.1252| 0.502 ---------------+--------+--------+--------- RxCan2[180] Avg| 16.60| 0.3899| 0.023 Peak| | 0.3899| 0.799 ---------------+--------+--------+--------- RxCan2[190] Avg| 16.60| 0.3892| 0.025 Peak| | 0.3892| 1.172 ---------------+--------+--------+--------- RxCan2[1a0] Avg| 1.00| 0.0281| 0.025 Peak| | 0.0281| 0.695 ---------------+--------+--------+--------- RxCan2[1a4] Avg| 20.00| 0.4525| 0.022 Peak| | 0.4525| 1.231 ---------------+--------+--------+--------- RxCan2[1a8] Avg| 12.50| 0.2886| 0.020 Peak| | 0.2886| 1.048 ---------------+--------+--------+--------- RxCan2[1b0] Avg| 10.00| 0.2300| 0.023 Peak| | 0.2300| 0.579 ---------------+--------+--------+--------- RxCan2[1b4] Avg| 10.00| 0.2334| 0.022 Peak| | 0.2334| 0.947 ---------------+--------+--------+--------- RxCan2[1b8] Avg| 12.40| 0.2970| 0.023 Peak| | 0.2970| 0.909 ---------------+--------+--------+--------- RxCan2[1c0] Avg| 10.00| 0.2257| 0.021 Peak| | 0.2257| 0.983 ---------------+--------+--------+--------- RxCan2[1e0] Avg| 10.00| 0.2141| 0.023 Peak| | 0.2141| 0.556 ---------------+--------+--------+--------- RxCan2[215] Avg| 8.30| 0.2047| 0.025 Peak| | 0.2047| 0.786 ---------------+--------+--------+--------- RxCan2[217] Avg| 8.30| 0.2033| 0.022 Peak| | 0.2033| 1.135 ---------------+--------+--------+--------- RxCan2[220] Avg| 6.70| 0.1647| 0.020 Peak| | 0.1647| 0.961 ---------------+--------+--------+--------- RxCan2[225] Avg| 24.90| 0.6136| 0.026 Peak| | 0.6136| 1.018 ---------------+--------+--------+--------- RxCan2[230] Avg| 6.70| 0.4045| 0.057 Peak| | 0.4045| 1.532 ---------------+--------+--------+--------- RxCan2[240] Avg| 8.20| 0.1849| 0.021 Peak| | 0.1849| 0.510 ---------------+--------+--------+--------- RxCan2[241] Avg| 20.00| 0.4312| 0.021 Peak| | 0.4312| 5.110 ---------------+--------+--------+--------- RxCan2[250] Avg| 5.00| 0.1072| 0.021 Peak| | 0.1072| 0.320 ---------------+--------+--------+--------- RxCan2[255] Avg| 12.50| 0.3091| 0.022 Peak| | 0.3091| 0.904 ---------------+--------+--------+--------- RxCan2[265] Avg| 12.50| 0.2819| 0.021 Peak| | 0.2819| 1.035 ---------------+--------+--------+--------- RxCan2[270] Avg| 5.00| 0.1189| 0.022 Peak| | 0.1189| 0.631 ---------------+--------+--------+--------- RxCan2[290] Avg| 3.30| 0.0740| 0.023 Peak| | 0.0740| 0.455 ---------------+--------+--------+--------- RxCan2[295] Avg| 6.60| 0.1431| 0.023 Peak| | 0.1431| 0.504 ---------------+--------+--------+--------- RxCan2[2a0] Avg| 3.30| 0.0686| 0.020 Peak| | 0.0686| 0.445 ---------------+--------+--------+--------- RxCan2[2a7] Avg| 12.50| 0.2869| 0.021 Peak| | 0.2869| 0.660 ---------------+--------+--------+--------- RxCan2[2b0] Avg| 3.20| 0.0707| 0.023 Peak| | 0.0707| 0.331 ---------------+--------+--------+--------- RxCan2[2c0] Avg| 3.20| 0.0988| 0.026 Peak| | 0.0988| 0.932 ---------------+--------+--------+--------- RxCan2[2e0] Avg| 1.60| 0.0388| 0.024 Peak| | 0.0388| 0.393 ---------------+--------+--------+--------- RxCan2[2f0] Avg| 1.70| 0.0376| 0.021 Peak| | 0.0376| 0.282 ---------------+--------+--------+--------- RxCan2[2f5] Avg| 12.50| 0.2833| 0.021 Peak| | 0.2833| 0.855 ---------------+--------+--------+--------- RxCan2[300] Avg| 1.70| 0.0398| 0.023 Peak| | 0.0398| 0.488 ---------------+--------+--------+--------- RxCan2[310] Avg| 1.60| 0.0480| 0.026 Peak| | 0.0480| 0.937 ---------------+--------+--------+--------- RxCan2[320] Avg| 1.70| 0.0346| 0.020 Peak| | 0.0346| 0.370 ---------------+--------+--------+--------- RxCan2[326] Avg| 9.90| 0.2200| 0.022 Peak| | 0.2200| 0.502 ---------------+--------+--------+--------- RxCan2[330] Avg| 32.30| 0.7323| 0.021 Peak| | 0.7323| 1.130 ---------------+--------+--------+--------- RxCan2[340] Avg| 8.20| 0.2375| 0.028 Peak| | 0.2375| 0.578 ---------------+--------+--------+--------- RxCan2[345] Avg| 1.60| 0.0393| 0.022 Peak| | 0.0393| 0.590 ---------------+--------+--------+--------- RxCan2[35e] Avg| 5.00| 0.1303| 0.023 Peak| | 0.1303| 0.943 ---------------+--------+--------+--------- RxCan2[360] Avg| 1.70| 0.0381| 0.025 Peak| | 0.0381| 0.922 ---------------+--------+--------+--------- RxCan2[361] Avg| 8.20| 0.1907| 0.023 Peak| | 0.1907| 1.119 ---------------+--------+--------+--------- RxCan2[363] Avg| 1.30| 0.0337| 0.024 Peak| | 0.0337| 0.425 ---------------+--------+--------+--------- RxCan2[370] Avg| 0.90| 0.0194| 0.022 Peak| | 0.0194| 0.246 ---------------+--------+--------+--------- RxCan2[381] Avg| 3.20| 0.0684| 0.024 Peak| | 0.0684| 0.828 ---------------+--------+--------+--------- RxCan2[3a0] Avg| 16.60| 0.3734| 0.022 Peak| | 0.3734| 0.636 ---------------+--------+--------+--------- RxCan2[3d0] Avg| 10.00| 0.2262| 0.023 Peak| | 0.2262| 0.663 ---------------+--------+--------+--------- RxCan2[3d5] Avg| 5.60| 0.1335| 0.022 Peak| | 0.1335| 1.222 ---------------+--------+--------+--------- RxCan2[400] Avg| 4.00| 0.0949| 0.022 Peak| | 0.0949| 0.715 ---------------+--------+--------+--------- RxCan2[405] Avg| 3.70| 0.0861| 0.022 Peak| | 0.0861| 0.443 ---------------+--------+--------+--------- RxCan2[40a] Avg| 8.00| 0.1853| 0.021 Peak| | 0.1853| 0.552 ---------------+--------+--------+--------- RxCan2[415] Avg| 1.60| 0.0341| 0.021 Peak| | 0.0341| 0.273 ---------------+--------+--------+--------- RxCan2[435] Avg| 0.90| 0.0220| 0.025 Peak| | 0.0220| 0.354 ---------------+--------+--------+--------- RxCan2[440] Avg| 0.90| 0.0199| 0.021 Peak| | 0.0199| 0.266 ---------------+--------+--------+--------- RxCan2[465] Avg| 0.90| 0.0234| 0.028 Peak| | 0.0234| 0.633 ---------------+--------+--------+--------- RxCan2[466] Avg| 1.00| 0.0222| 0.021 Peak| | 0.0222| 0.322 ---------------+--------+--------+--------- RxCan2[467] Avg| 1.00| 0.0221| 0.020 Peak| | 0.0221| 0.355 ---------------+--------+--------+--------- RxCan2[501] Avg| 1.50| 0.0335| 0.023 Peak| | 0.0335| 0.393 ---------------+--------+--------+--------- RxCan2[503] Avg| 1.50| 0.0370| 0.022 Peak| | 0.0370| 0.546 ---------------+--------+--------+--------- RxCan2[504] Avg| 1.40| 0.0328| 0.022 Peak| | 0.0328| 0.489 ---------------+--------+--------+--------- RxCan2[505] Avg| 1.40| 0.0290| 0.021 Peak| | 0.0290| 0.354 ---------------+--------+--------+--------- RxCan2[508] Avg| 1.40| 0.0318| 0.023 Peak| | 0.0318| 0.408 ---------------+--------+--------+--------- RxCan2[511] Avg| 1.40| 0.0306| 0.022 Peak| | 0.0306| 0.328 ---------------+--------+--------+--------- RxCan2[51e] Avg| 1.40| 0.0310| 0.022 Peak| | 0.0310| 0.269 ---------------+--------+--------+--------- RxCan2[581] Avg| 1.00| 0.0222| 0.022 Peak| | 0.0222| 0.256 ---------------+--------+--------+--------- Cmd:State Avg| 0.00| 0.0000| 0.002 Peak| | 0.0000| 0.024 ===============+========+========+========= Total Avg| 2795.57| 82.7745| 40.174
Cheers, Simon
Am 17.01.2025 um 17:49 schrieb Michael Balzer via OvmsDev:
OK, I've got a new idea: CAN timing.
Comparing our esp32can bit timing to the esp-idf driver's, there seem to be some differences: https://github.com/espressif/esp-idf/blob/master/components/hal/include/hal/...
Transceivers are normally tolerant to small timing offsets. Maybe being off a little bit has no effect under normal conditions, but it has when the transceiver has to cope with a filled RX queue. That could be causing the transceiver to slide just out of sync. If the timing gets garbled, the transceiver would signal errors in the packets to the bus, possibly so many the vehicle ECUs decide to raise an error condition.
Is that plausible?
On why the new poller could be causing this (in combination with too slow processing by the vehicle): as mentioned, the standard CAN listener mechanism doesn't care about queue overflows. The poller does. `OvmsPollers::Queue_PollerFrame()` does a log call when Tx/Rx tracing is enabled, that could even block, but tracing is optional and only meant for debugging. Not optional is the overflow counting using an atomic uint32.
The atomic types are said to be fast, but I never checked their actual implementation on the ESP32. Maybe they can block as well?
@Simon: it would be an option to try commenting out the overflow counting, to see if that's causing the issue.
Regards, Michael
Am 17.01.25 um 15:37 schrieb Chris Box via OvmsDev:
Yes, I can confirm I've had one experience of the Leaf switching to Neutral while driving, with a yellow warning symbol on the dash. It refused to reselect Drive until I had switched the car off and back on. Derek wasn't so lucky and he need to clear fault codes before the car would work.
On returning home, I found OVMS was not accessible over a network. I didn't try a USB cable. Unplugging and reinserting the OBD cable caused OVMS to rejoin Wi-Fi. However the SD logs showed nothing from the time of the event. CAN writes are enabled, so it can perform SOC limiting.
My car has been using this firmware since 21st November, based on the git master of that day. As a relatively new user of OVMS (only since October) I don't have much experience of older firmware.
Perhaps a safeguard should be implemented before releasing a new stable firmware that will be automatically downloaded by Leaf owners. But I don't have the expertise to know what that safeguard should be. Derek's suggestion of 'only CAN write when parked' appears to be a good idea.
Chris
On 2025-01-15 18:18, Derek Caudwell via OvmsDev wrote:
Since the following email I have high confidence the issue on the Leaf is related/caused by the poller as there has been no further occurrence and Chris has also experienced the car going to neutral on the new poller firmware.
.... I haven't ruled out it being a fault with my car yet. Shortly after it faulted the car was run into so has been off the road for sometime, my first step was to replace 12V battery. The ovms unit is now unplugged and if it does not fault over the next month while driving I'll be reasonably confident it's ovms related. Not sure which firmware version the poller updates were included in but it was only after upgrading to it that the errors occurred (which could be coincidental however it has faulted twice more both on version 3.3.004-141-gf729d82c). For periods where I reverted to 3.3.003 it was fine. It might be useful to have an extra option on the enable can write to only enable it when the car is parked/charging.
_______________________________________________ OvmsDev mailing list OvmsDev@lists.openvehicles.com http://lists.openvehicles.com/mailman/listinfo/ovmsdev
-- Michael Balzer * Am Rahmen 5 * D-58313 Herdecke Fon 02330 9104094 * Handy 0176 20698926
_______________________________________________ OvmsDev mailing list OvmsDev@lists.openvehicles.com http://lists.openvehicles.com/mailman/listinfo/ovmsdev
_______________________________________________ OvmsDev mailing list OvmsDev@lists.openvehicles.com http://lists.openvehicles.com/mailman/listinfo/ovmsdev
In terms of a quick fix for the Leaf the can bus could be set to listen mode when driving and if can writes are disabled. How does this need to be done? Can the bus mode be changed after it's registered or does it have to be deregistered in a given mode and then registered again in the new mode? On Sat, 18 Jan 2025, 7:54 am Simon Ehlen via OvmsDev, < ovmsdev@lists.openvehicles.com> wrote:
Ok, the fact that I no longer receive “Overflow Run” messages is obviously because I no longer count them at all due to the missing Atomic_Increment... I had initially read that the counter is still recorded in m_overflow_count.
Am 17.01.2025 um 19:42 schrieb Simon Ehlen via OvmsDev:
The poller statistics can help you track this down, but you need to have at least 10 seconds of statistics, the more the better. Rule of thumb: PRI average at 0.0/second means you don't have enough data yet.
There were again many messages with “RX Task Queue Overflow Run”. Here are the statistics of poller times status:
OVMS# poll times status Poller timing is: on Type | count | Utlztn | Time | per s | [%] | [ms] ---------------+--------+--------+--------- Poll:PRI Avg| 1.00| 0.0043| 0.004 Peak| | 0.0043| 0.052 ---------------+--------+--------+--------- RxCan1[010] Avg| 34.26| 1.6741| 0.015 Peak| | 1.6741| 1.182 ---------------+--------+--------+--------- RxCan1[030] Avg| 34.06| 1.7085| 0.020 Peak| | 1.7085| 1.390 ---------------+--------+--------+--------- RxCan1[041] Avg| 49.89| 0.8109| 0.016 Peak| | 0.8541| 1.098 ---------------+--------+--------+--------- RxCan1[049] Avg| 50.00| 1.5970| 0.019 Peak| | 1.7154| 32.233 ---------------+--------+--------+--------- RxCan1[04c] Avg| 49.92| 0.8340| 0.014 Peak| | 0.8933| 1.995 ---------------+--------+--------+--------- RxCan1[04d] Avg| 34.43| 1.6211| 0.014 Peak| | 1.6756| 1.318 ---------------+--------+--------+--------- RxCan1[076] Avg| 50.00| 0.8362| 0.024 Peak| | 0.8784| 2.185 ---------------+--------+--------+--------- RxCan1[077] Avg| 50.00| 0.7837| 0.014 Peak| | 0.8083| 1.156 ---------------+--------+--------+--------- RxCan1[07a] Avg| 34.31| 2.1870| 0.017 Peak| | 2.3252| 1.888 ---------------+--------+--------+--------- RxCan1[07d] Avg| 50.00| 0.8001| 0.013 Peak| | 0.8434| 1.150 ---------------+--------+--------+--------- RxCan1[0c8] Avg| 49.96| 0.8359| 0.013 Peak| | 0.8715| 1.171 ---------------+--------+--------+--------- RxCan1[11a] Avg| 34.35| 1.6701| 0.020 Peak| | 1.6981| 1.273 ---------------+--------+--------+--------- RxCan1[130] Avg| 50.00| 0.7902| 0.018 Peak| | 0.8513| 0.980 ---------------+--------+--------+--------- RxCan1[139] Avg| 49.92| 0.7872| 0.013 Peak| | 0.8219| 0.795 ---------------+--------+--------+--------- RxCan1[156] Avg| 10.00| 0.1620| 0.014 Peak| | 0.1729| 0.919 ---------------+--------+--------+--------- RxCan1[160] Avg| 50.04| 0.7977| 0.014 Peak| | 0.8232| 1.495 ---------------+--------+--------+--------- RxCan1[165] Avg| 49.85| 0.7976| 0.014 Peak| | 0.8486| 1.015 ---------------+--------+--------+--------- RxCan1[167] Avg| 34.39| 1.6025| 0.016 Peak| | 1.6888| 1.354 ---------------+--------+--------+--------- RxCan1[171] Avg| 50.00| 0.8150| 0.017 Peak| | 0.8488| 1.091 ---------------+--------+--------+--------- RxCan1[178] Avg| 10.00| 0.1614| 0.014 Peak| | 0.1702| 0.903 ---------------+--------+--------+--------- RxCan1[179] Avg| 10.00| 0.1630| 0.017 Peak| | 0.1663| 1.336 ---------------+--------+--------+--------- RxCan1[180] Avg| 50.00| 0.8137| 0.014 Peak| | 0.8605| 1.566 ---------------+--------+--------+--------- RxCan1[185] Avg| 50.04| 0.8033| 0.013 Peak| | 0.8393| 1.126 ---------------+--------+--------+--------- RxCan1[1a0] Avg| 49.92| 0.7748| 0.013 Peak| | 0.8169| 1.184 ---------------+--------+--------+--------- RxCan1[1e0] Avg| 49.92| 0.7738| 0.014 Peak| | 0.8028| 1.049 ---------------+--------+--------+--------- RxCan1[1e4] Avg| 49.89| 0.9692| 0.018 Peak| | 1.0096| 1.332 ---------------+--------+--------+--------- RxCan1[1f0] Avg| 33.22| 0.5544| 0.014 Peak| | 0.5855| 0.848 ---------------+--------+--------+--------- RxCan1[200] Avg| 49.92| 0.7879| 0.015 Peak| | 0.8345| 1.206 ---------------+--------+--------+--------- RxCan1[202] Avg| 34.28| 1.7075| 0.016 Peak| | 1.7874| 1.218 ---------------+--------+--------+--------- RxCan1[204] Avg| 34.35| 1.5641| 0.013 Peak| | 1.6427| 1.235 ---------------+--------+--------+--------- RxCan1[213] Avg| 49.89| 0.7814| 0.015 Peak| | 0.8232| 0.910 ---------------+--------+--------+--------- RxCan1[214] Avg| 49.92| 0.7736| 0.014 Peak| | 0.8216| 0.800 ---------------+--------+--------+--------- RxCan1[217] Avg| 34.31| 1.6294| 0.014 Peak| | 1.7165| 1.153 ---------------+--------+--------+--------- RxCan1[218] Avg| 49.86| 0.7877| 0.013 Peak| | 0.8290| 1.068 ---------------+--------+--------+--------- RxCan1[230] Avg| 50.00| 0.7596| 0.014 Peak| | 0.7660| 1.021 ---------------+--------+--------+--------- RxCan1[240] Avg| 10.00| 0.1669| 0.013 Peak| | 0.1835| 0.887 ---------------+--------+--------+--------- RxCan1[242] Avg| 24.96| 0.4764| 0.020 Peak| | 0.4963| 1.501 ---------------+--------+--------+--------- RxCan1[24a] Avg| 9.89| 0.1789| 0.015 Peak| | 0.2009| 0.874 ---------------+--------+--------+--------- RxCan1[24b] Avg| 9.89| 0.1702| 0.014 Peak| | 0.1870| 1.195 ---------------+--------+--------+--------- RxCan1[24c] Avg| 9.89| 0.2146| 0.019 Peak| | 0.2187| 1.242 ---------------+--------+--------+--------- RxCan1[25a] Avg| 10.00| 0.1603| 0.013 Peak| | 0.1667| 0.720 ---------------+--------+--------+--------- RxCan1[25b] Avg| 49.94| 0.7918| 0.017 Peak| | 0.8454| 1.666 ---------------+--------+--------+--------- RxCan1[25c] Avg| 34.24| 1.5331| 0.013 Peak| | 1.5997| 1.538 ---------------+--------+--------+--------- RxCan1[260] Avg| 10.00| 0.1626| 0.014 Peak| | 0.1682| 0.718 ---------------+--------+--------+--------- RxCan1[270] Avg| 49.90| 0.8120| 0.014 Peak| | 0.8460| 1.671 ---------------+--------+--------+--------- RxCan1[280] Avg| 49.92| 0.7777| 0.019 Peak| | 0.8447| 1.157 ---------------+--------+--------+--------- RxCan1[2e4] Avg| 19.89| 0.5778| 0.032 Peak| | 0.6648| 2.226 ---------------+--------+--------+--------- RxCan1[2ec] Avg| 10.00| 0.1701| 0.014 Peak| | 0.1755| 0.928 ---------------+--------+--------+--------- RxCan1[2ed] Avg| 10.00| 0.1650| 0.013 Peak| | 0.1747| 0.917 ---------------+--------+--------+--------- RxCan1[2ee] Avg| 9.98| 0.1544| 0.013 Peak| | 0.1588| 1.312 ---------------+--------+--------+--------- RxCan1[312] Avg| 10.00| 0.1648| 0.017 Peak| | 0.1690| 0.922 ---------------+--------+--------+--------- RxCan1[326] Avg| 9.89| 0.1603| 0.015 Peak| | 0.1833| 1.230 ---------------+--------+--------+--------- RxCan1[336] Avg| 1.00| 0.0146| 0.015 Peak| | 0.0150| 0.349 ---------------+--------+--------+--------- RxCan1[352] Avg| 6.66| 0.1223| 0.022 Peak| | 0.1338| 1.015 ---------------+--------+--------+--------- RxCan1[355] Avg| 2.00| 0.0424| 0.019 Peak| | 0.0431| 0.786 ---------------+--------+--------+--------- RxCan1[35e] Avg| 9.96| 0.1570| 0.013 Peak| | 0.1644| 0.579 ---------------+--------+--------+--------- RxCan1[365] Avg| 10.00| 0.1600| 0.014 Peak| | 0.1653| 0.961 ---------------+--------+--------+--------- RxCan1[366] Avg| 10.00| 0.1716| 0.013 Peak| | 0.1890| 0.987 ---------------+--------+--------+--------- RxCan1[367] Avg| 9.93| 0.1793| 0.015 Peak| | 0.1864| 0.984 ---------------+--------+--------+--------- RxCan1[368] Avg| 10.00| 0.1645| 0.014 Peak| | 0.1778| 0.768 ---------------+--------+--------+--------- RxCan1[369] Avg| 10.00| 0.1562| 0.016 Peak| | 0.1606| 0.724 ---------------+--------+--------+--------- RxCan1[380] Avg| 10.00| 0.1619| 0.014 Peak| | 0.1644| 0.605 ---------------+--------+--------+--------- RxCan1[38b] Avg| 25.00| 0.3991| 0.016 Peak| | 0.4280| 1.448 ---------------+--------+--------+--------- RxCan1[3b3] Avg| 10.00| 0.1537| 0.013 Peak| | 0.1610| 0.380 ---------------+--------+--------+--------- RxCan1[400] Avg| 4.00| 0.0626| 0.014 Peak| | 0.0626| 0.251 ---------------+--------+--------+--------- RxCan1[405] Avg| 3.90| 0.1019| 0.028 Peak| | 0.1019| 0.781 ---------------+--------+--------+--------- RxCan1[40a] Avg| 7.90| 0.1256| 0.020 Peak| | 0.1256| 0.991 ---------------+--------+--------+--------- RxCan1[410] Avg| 10.00| 0.1643| 0.016 Peak| | 0.1839| 1.634 ---------------+--------+--------+--------- RxCan1[411] Avg| 10.00| 0.1532| 0.013 Peak| | 0.1645| 0.824 ---------------+--------+--------+--------- RxCan1[416] Avg| 10.00| 0.1516| 0.016 Peak| | 0.1582| 0.807 ---------------+--------+--------+--------- RxCan1[421] Avg| 10.00| 0.1648| 0.013 Peak| | 0.1740| 0.839 ---------------+--------+--------+--------- RxCan1[42d] Avg| 10.00| 0.1548| 0.014 Peak| | 0.1658| 0.741 ---------------+--------+--------+--------- RxCan1[42f] Avg| 10.00| 0.1527| 0.013 Peak| | 0.1578| 0.667 ---------------+--------+--------+--------- RxCan1[430] Avg| 10.00| 0.1730| 0.016 Peak| | 0.1880| 1.209 ---------------+--------+--------+--------- RxCan1[434] Avg| 10.00| 0.1620| 0.021 Peak| | 0.1712| 1.140 ---------------+--------+--------+--------- RxCan1[435] Avg| 6.66| 0.1104| 0.014 Peak| | 0.1121| 1.011 ---------------+--------+--------+--------- RxCan1[43e] Avg| 20.00| 0.3194| 0.013 Peak| | 0.3434| 1.212 ---------------+--------+--------+--------- RxCan1[440] Avg| 1.00| 0.0160| 0.014 Peak| | 0.0175| 0.315 ---------------+--------+--------+--------- RxCan1[465] Avg| 1.00| 0.0172| 0.015 Peak| | 0.0194| 0.404 ---------------+--------+--------+--------- RxCan1[466] Avg| 1.00| 0.0198| 0.015 Peak| | 0.0252| 0.890 ---------------+--------+--------+--------- RxCan1[467] Avg| 1.00| 0.0152| 0.014 Peak| | 0.0160| 0.217 ---------------+--------+--------+--------- RxCan1[472] Avg| 0.70| 0.0533| 0.075 Peak| | 0.0546| 0.990 ---------------+--------+--------+--------- RxCan1[473] Avg| 0.65| 0.0325| 0.051 Peak| | 0.0361| 0.774 ---------------+--------+--------+--------- RxCan1[474] Avg| 1.00| 0.0146| 0.014 Peak| | 0.0151| 0.189 ---------------+--------+--------+--------- RxCan1[475] Avg| 2.00| 0.0332| 0.015 Peak| | 0.0362| 0.513 ---------------+--------+--------+--------- RxCan1[476] Avg| 2.00| 0.0305| 0.014 Peak| | 0.0307| 0.249 ---------------+--------+--------+--------- RxCan1[477] Avg| 2.00| 0.0309| 0.014 Peak| | 0.0311| 0.438 ---------------+--------+--------+--------- RxCan1[595] Avg| 1.00| 0.0151| 0.014 Peak| | 0.0160| 0.230 ---------------+--------+--------+--------- RxCan1[59e] Avg| 1.00| 0.0179| 0.015 Peak| | 0.0209| 0.716 ---------------+--------+--------+--------- RxCan1[5a2] Avg| 1.00| 0.0154| 0.016 Peak| | 0.0184| 0.699 ---------------+--------+--------+--------- RxCan1[5ba] Avg| 1.00| 0.0159| 0.017 Peak| | 0.0174| 0.485 ---------------+--------+--------+--------- RxCan2[010] Avg| 0.00| 0.0000| 0.015 Peak| | 0.0000| 0.146 ---------------+--------+--------+--------- RxCan2[020] Avg| 31.10| 0.5159| 0.015 Peak| | 0.5730| 0.992 ---------------+--------+--------+--------- RxCan2[030] Avg| 20.70| 0.3506| 0.016 Peak| | 0.3956| 1.055 ---------------+--------+--------+--------- RxCan2[03a] Avg| 18.65| 0.3157| 0.014 Peak| | 0.3292| 0.702 ---------------+--------+--------+--------- RxCan2[040] Avg| 18.60| 0.3111| 0.015 Peak| | 0.3474| 0.953 ---------------+--------+--------+--------- RxCan2[060] Avg| 18.60| 0.3182| 0.014 Peak| | 0.3569| 0.694 ---------------+--------+--------+--------- RxCan2[070] Avg| 15.55| 0.4581| 0.017 Peak| | 0.6859| 39.212 ---------------+--------+--------+--------- RxCan2[080] Avg| 15.50| 0.5041| 0.029 Peak| | 0.5414| 1.555 ---------------+--------+--------+--------- RxCan2[083] Avg| 18.70| 0.3083| 0.014 Peak| | 0.3325| 0.557 ---------------+--------+--------+--------- RxCan2[090] Avg| 23.40| 0.3961| 0.014 Peak| | 0.4445| 1.218 ---------------+--------+--------+--------- RxCan2[0a0] Avg| 15.55| 0.2734| 0.014 Peak| | 0.3144| 1.062 ---------------+--------+--------+--------- RxCan2[100] Avg| 15.50| 0.2645| 0.016 Peak| | 0.2875| 1.021 ---------------+--------+--------+--------- RxCan2[108] Avg| 23.40| 0.4231| 0.016 Peak| | 0.4680| 1.297 ---------------+--------+--------+--------- RxCan2[110] Avg| 15.55| 0.2467| 0.014 Peak| | 0.2684| 0.475 ---------------+--------+--------+--------- RxCan2[130] Avg| 13.30| 0.2231| 0.014 Peak| | 0.2447| 0.512 ---------------+--------+--------+--------- RxCan2[150] Avg| 15.50| 0.2533| 0.015 Peak| | 0.2836| 0.823 ---------------+--------+--------+--------- RxCan2[160] Avg| 4.70| 0.0784| 0.014 Peak| | 0.0863| 0.608 ---------------+--------+--------+--------- RxCan2[180] Avg| 15.55| 0.2713| 0.015 Peak| | 0.2841| 0.884 ---------------+--------+--------+--------- RxCan2[190] Avg| 15.50| 0.2596| 0.014 Peak| | 0.2825| 0.743 ---------------+--------+--------+--------- RxCan2[1a0] Avg| 0.95| 0.0164| 0.015 Peak| | 0.0164| 0.346 ---------------+--------+--------+--------- RxCan2[1a4] Avg| 18.65| 0.3232| 0.015 Peak| | 0.3515| 0.989 ---------------+--------+--------+--------- RxCan2[1a8] Avg| 11.60| 0.1911| 0.016 Peak| | 0.2012| 0.757 ---------------+--------+--------+--------- RxCan2[1b0] Avg| 9.35| 0.1558| 0.016 Peak| | 0.1641| 0.795 ---------------+--------+--------+--------- RxCan2[1b4] Avg| 9.35| 0.1543| 0.015 Peak| | 0.1617| 1.217 ---------------+--------+--------+--------- RxCan2[1b8] Avg| 11.65| 0.2003| 0.014 Peak| | 0.2236| 1.549 ---------------+--------+--------+--------- RxCan2[1c0] Avg| 9.40| 0.1532| 0.016 Peak| | 0.1673| 0.955 ---------------+--------+--------+--------- RxCan2[1e0] Avg| 9.30| 0.1582| 0.015 Peak| | 0.1708| 0.661 ---------------+--------+--------+--------- RxCan2[215] Avg| 7.80| 0.1409| 0.016 Peak| | 0.1531| 0.660 ---------------+--------+--------+--------- RxCan2[217] Avg| 7.80| 0.1239| 0.014 Peak| | 0.1333| 0.520 ---------------+--------+--------+--------- RxCan2[220] Avg| 6.20| 0.1041| 0.015 Peak| | 0.1094| 0.652 ---------------+--------+--------+--------- RxCan2[225] Avg| 23.40| 0.4648| 0.015 Peak| | 0.4696| 4.288 ---------------+--------+--------+--------- RxCan2[230] Avg| 6.20| 0.3120| 0.048 Peak| | 0.3377| 1.065 ---------------+--------+--------+--------- RxCan2[240] Avg| 7.70| 0.1248| 0.014 Peak| | 0.1364| 0.635 ---------------+--------+--------+--------- RxCan2[241] Avg| 18.60| 0.3258| 0.014 Peak| | 0.3343| 1.288 ---------------+--------+--------+--------- RxCan2[250] Avg| 4.70| 0.0761| 0.014 Peak| | 0.0809| 0.322 ---------------+--------+--------+--------- RxCan2[255] Avg| 11.75| 0.2058| 0.014 Peak| | 0.2283| 0.937 ---------------+--------+--------+--------- RxCan2[265] Avg| 11.65| 0.1964| 0.014 Peak| | 0.2068| 0.965 ---------------+--------+--------+--------- RxCan2[270] Avg| 4.70| 0.0808| 0.016 Peak| | 0.0949| 0.729 ---------------+--------+--------+--------- RxCan2[290] Avg| 3.15| 0.0498| 0.015 Peak| | 0.0504| 0.449 ---------------+--------+--------+--------- RxCan2[295] Avg| 6.25| 0.1019| 0.014 Peak| | 0.1094| 0.859 ---------------+--------+--------+--------- RxCan2[2a0] Avg| 3.15| 0.0550| 0.014 Peak| | 0.0551| 0.779 ---------------+--------+--------+--------- RxCan2[2a7] Avg| 11.65| 0.1929| 0.014 Peak| | 0.2080| 0.775 ---------------+--------+--------+--------- RxCan2[2b0] Avg| 3.00| 0.0497| 0.015 Peak| | 0.0562| 0.528 ---------------+--------+--------+--------- RxCan2[2c0] Avg| 3.10| 0.0534| 0.016 Peak| | 0.0592| 0.501 ---------------+--------+--------+--------- RxCan2[2e0] Avg| 1.55| 0.0247| 0.014 Peak| | 0.0289| 0.319 ---------------+--------+--------+--------- RxCan2[2f0] Avg| 1.55| 0.0244| 0.014 Peak| | 0.0273| 0.192 ---------------+--------+--------+--------- RxCan2[2f5] Avg| 11.65| 0.2078| 0.016 Peak| | 0.2333| 0.879 ---------------+--------+--------+--------- RxCan2[300] Avg| 1.60| 0.0266| 0.018 Peak| | 0.0278| 0.724 ---------------+--------+--------+--------- RxCan2[310] Avg| 1.55| 0.0276| 0.016 Peak| | 0.0285| 0.759 ---------------+--------+--------+--------- RxCan2[320] Avg| 1.60| 0.0240| 0.014 Peak| | 0.0258| 0.179 ---------------+--------+--------+--------- RxCan2[326] Avg| 9.30| 0.1550| 0.014 Peak| | 0.1582| 0.850 ---------------+--------+--------+--------- RxCan2[330] Avg| 29.95| 0.5311| 0.015 Peak| | 0.5565| 4.522 ---------------+--------+--------+--------- RxCan2[340] Avg| 7.75| 0.1693| 0.024 Peak| | 0.1868| 1.148 ---------------+--------+--------+--------- RxCan2[345] Avg| 1.60| 0.0292| 0.016 Peak| | 0.0316| 0.471 ---------------+--------+--------+--------- RxCan2[350] Avg| 0.00| 0.0000| 0.019 Peak| | 0.0000| 0.188 ---------------+--------+--------+--------- RxCan2[35e] Avg| 4.70| 0.0851| 0.019 Peak| | 0.0911| 1.023 ---------------+--------+--------+--------- RxCan2[360] Avg| 1.60| 0.0258| 0.015 Peak| | 0.0284| 0.306 ---------------+--------+--------+--------- RxCan2[361] Avg| 7.75| 0.1341| 0.017 Peak| | 0.1487| 0.761 ---------------+--------+--------+--------- RxCan2[363] Avg| 1.20| 0.0203| 0.016 Peak| | 0.0220| 0.421 ---------------+--------+--------+--------- RxCan2[370] Avg| 0.85| 0.0140| 0.016 Peak| | 0.0162| 0.354 ---------------+--------+--------+--------- RxCan2[381] Avg| 3.15| 0.0512| 0.016 Peak| | 0.0546| 0.416 ---------------+--------+--------+--------- RxCan2[3a0] Avg| 15.60| 0.2548| 0.015 Peak| | 0.2890| 0.976 ---------------+--------+--------+--------- RxCan2[3d0] Avg| 9.35| 0.1553| 0.019 Peak| | 0.1612| 1.115 ---------------+--------+--------+--------- RxCan2[3d5] Avg| 5.15| 0.0836| 0.016 Peak| | 0.0867| 0.479 ---------------+--------+--------+--------- RxCan2[3e0] Avg| 0.00| 0.0000| 0.014 Peak| | 0.0000| 0.142 ---------------+--------+--------+--------- RxCan2[400] Avg| 3.55| 0.0613| 0.017 Peak| | 0.0695| 0.501 ---------------+--------+--------+--------- RxCan2[405] Avg| 3.50| 0.0584| 0.018 Peak| | 0.0626| 0.686 ---------------+--------+--------+--------- RxCan2[40a] Avg| 7.10| 0.1278| 0.017 Peak| | 0.1389| 1.244 ---------------+--------+--------+--------- RxCan2[415] Avg| 1.60| 0.0258| 0.014 Peak| | 0.0287| 0.266 ---------------+--------+--------+--------- RxCan2[435] Avg| 0.85| 0.0165| 0.019 Peak| | 0.0167| 0.367 ---------------+--------+--------+--------- RxCan2[440] Avg| 0.85| 0.0128| 0.019 Peak| | 0.0141| 0.885 ---------------+--------+--------+--------- RxCan2[465] Avg| 0.95| 0.0177| 0.016 Peak| | 0.0195| 0.721 ---------------+--------+--------+--------- RxCan2[466] Avg| 0.95| 0.0147| 0.014 Peak| | 0.0160| 0.184 ---------------+--------+--------+--------- RxCan2[467] Avg| 0.95| 0.0172| 0.017 Peak| | 0.0188| 0.391 ---------------+--------+--------+--------- RxCan2[501] Avg| 1.45| 0.0273| 0.016 Peak| | 0.0327| 0.996 ---------------+--------+--------+--------- RxCan2[503] Avg| 1.45| 0.0288| 0.020 Peak| | 0.0338| 0.970 ---------------+--------+--------+--------- RxCan2[504] Avg| 1.40| 0.0241| 0.015 Peak| | 0.0263| 0.609 ---------------+--------+--------+--------- RxCan2[505] Avg| 1.40| 0.0255| 0.015 Peak| | 0.0296| 0.866 ---------------+--------+--------+--------- RxCan2[508] Avg| 1.35| 0.0237| 0.017 Peak| | 0.0237| 0.384 ---------------+--------+--------+--------- RxCan2[511] Avg| 1.35| 0.0226| 0.016 Peak| | 0.0228| 0.426 ---------------+--------+--------+--------- RxCan2[51e] Avg| 1.40| 0.0221| 0.014 Peak| | 0.0245| 0.211 ---------------+--------+--------+--------- RxCan2[581] Avg| 0.80| 0.0189| 0.019 Peak| | 0.0290| 1.217 ---------------+--------+--------+--------- RxCan2[606] Avg| 0.00| 0.0000| 0.014 Peak| | 0.0000| 0.142 ---------------+--------+--------+--------- RxCan2[657] Avg| 0.00| 0.0000| 0.014 Peak| | 0.0000| 0.137 ---------------+--------+--------+--------- Cmd:State Avg| 0.00| 0.0000| 0.002 Peak| | 0.0000| 0.024 ===============+========+========+========= Total Avg| 2748.42| 58.3344| 28.718
@Simon: it would be an option to try commenting out the overflow counting, to see if that's causing the issue.
I have commented out the line with the Atomic_Increment statement. Now I no longer receive any messages with “RX Task Queue Overflow Run” Here is the output of poller times status:
OVMS# poll time status Poller timing is: on Type | count | Utlztn | Time | per s | [%] | [ms] ---------------+--------+--------+--------- Poll:PRI Avg| 1.00| 0.0045| 0.004 Peak| | 0.0046| 0.064 ---------------+--------+--------+--------- RxCan1[010] Avg| 34.26| 2.2574| 0.021 Peak| | 2.2574| 4.609 ---------------+--------+--------+--------- RxCan1[030] Avg| 34.26| 2.3820| 0.021 Peak| | 2.3820| 1.135 ---------------+--------+--------+--------- RxCan1[041] Avg| 49.89| 1.2059| 0.021 Peak| | 1.2295| 5.331 ---------------+--------+--------+--------- RxCan1[049] Avg| 49.96| 1.2400| 0.030 Peak| | 1.2699| 1.402 ---------------+--------+--------+--------- RxCan1[04c] Avg| 49.92| 1.1752| 0.021 Peak| | 1.2072| 4.502 ---------------+--------+--------+--------- RxCan1[04d] Avg| 34.31| 2.4433| 0.022 Peak| | 2.4773| 1.368 ---------------+--------+--------+--------- RxCan1[076] Avg| 49.96| 1.2071| 0.024 Peak| | 1.2554| 2.007 ---------------+--------+--------+--------- RxCan1[077] Avg| 49.96| 1.2012| 0.022 Peak| | 1.2492| 1.955 ---------------+--------+--------+--------- RxCan1[07a] Avg| 34.35| 2.9251| 0.030 Peak| | 3.1103| 1.829 ---------------+--------+--------+--------- RxCan1[07d] Avg| 49.96| 1.1954| 0.022 Peak| | 1.2282| 1.074 ---------------+--------+--------+--------- RxCan1[0c8] Avg| 49.89| 1.2491| 0.021 Peak| | 1.3169| 1.181 ---------------+--------+--------+--------- RxCan1[11a] Avg| 34.39| 2.4423| 0.024 Peak| | 2.5693| 1.491 ---------------+--------+--------+--------- RxCan1[130] Avg| 49.95| 1.1312| 0.020 Peak| | 1.1684| 1.218 ---------------+--------+--------+--------- RxCan1[139] Avg| 49.92| 1.1547| 0.021 Peak| | 1.1778| 1.199 ---------------+--------+--------+--------- RxCan1[156] Avg| 9.96| 0.2391| 0.023 Peak| | 0.2591| 1.943 ---------------+--------+--------+--------- RxCan1[160] Avg| 49.96| 1.1657| 0.031 Peak| | 1.2017| 2.158 ---------------+--------+--------+--------- RxCan1[165] Avg| 49.96| 1.1257| 0.021 Peak| | 1.1652| 1.471 ---------------+--------+--------+--------- RxCan1[167] Avg| 34.31| 2.2871| 0.021 Peak| | 2.3374| 1.776 ---------------+--------+--------+--------- RxCan1[171] Avg| 49.96| 1.1879| 0.023 Peak| | 1.2268| 1.166 ---------------+--------+--------+--------- RxCan1[178] Avg| 10.00| 0.2371| 0.029 Peak| | 0.2459| 1.516 ---------------+--------+--------+--------- RxCan1[179] Avg| 10.00| 0.2196| 0.021 Peak| | 0.2260| 0.758 ---------------+--------+--------+--------- RxCan1[180] Avg| 49.96| 1.1703| 0.022 Peak| | 1.2103| 1.481 ---------------+--------+--------+--------- RxCan1[185] Avg| 49.95| 1.1127| 0.020 Peak| | 1.1636| 1.292 ---------------+--------+--------+--------- RxCan1[1a0] Avg| 49.96| 1.1009| 0.020 Peak| | 1.1468| 1.060 ---------------+--------+--------+--------- RxCan1[1e0] Avg| 49.96| 1.1744| 0.021 Peak| | 1.2027| 1.240 ---------------+--------+--------+--------- RxCan1[1e4] Avg| 49.96| 1.3733| 0.032 Peak| | 1.4085| 1.523 ---------------+--------+--------+--------- RxCan1[1f0] Avg| 33.30| 0.7625| 0.023 Peak| | 0.8004| 3.349 ---------------+--------+--------+--------- RxCan1[200] Avg| 49.92| 1.1462| 0.021 Peak| | 1.1809| 1.254 ---------------+--------+--------+--------- RxCan1[202] Avg| 34.39| 2.4034| 0.028 Peak| | 2.5611| 1.472 ---------------+--------+--------+--------- RxCan1[204] Avg| 34.30| 2.2541| 0.022 Peak| | 2.2924| 2.015 ---------------+--------+--------+--------- RxCan1[213] Avg| 49.96| 1.1599| 0.027 Peak| | 1.1794| 1.714 ---------------+--------+--------+--------- RxCan1[214] Avg| 49.96| 1.1537| 0.022 Peak| | 1.1941| 1.439 ---------------+--------+--------+--------- RxCan1[217] Avg| 34.39| 2.2490| 0.020 Peak| | 2.2856| 3.766 ---------------+--------+--------+--------- RxCan1[218] Avg| 49.96| 1.1291| 0.021 Peak| | 1.1646| 1.547 ---------------+--------+--------+--------- RxCan1[230] Avg| 49.96| 1.1272| 0.020 Peak| | 1.2237| 1.295 ---------------+--------+--------+--------- RxCan1[240] Avg| 10.00| 0.2191| 0.021 Peak| | 0.2226| 1.067 ---------------+--------+--------+--------- RxCan1[242] Avg| 24.96| 0.6911| 0.024 Peak| | 0.7161| 1.180 ---------------+--------+--------+--------- RxCan1[24a] Avg| 9.96| 0.2345| 0.024 Peak| | 0.2535| 0.779 ---------------+--------+--------+--------- RxCan1[24b] Avg| 9.96| 0.2433| 0.023 Peak| | 0.2697| 2.085 ---------------+--------+--------+--------- RxCan1[24c] Avg| 9.96| 0.3103| 0.029 Peak| | 0.3203| 0.809 ---------------+--------+--------+--------- RxCan1[25a] Avg| 10.00| 0.2346| 0.022 Peak| | 0.2405| 1.223 ---------------+--------+--------+--------- RxCan1[25b] Avg| 49.89| 1.2121| 0.020 Peak| | 1.3659| 19.523 ---------------+--------+--------+--------- RxCan1[25c] Avg| 34.31| 2.4193| 0.019 Peak| | 2.8022| 58.153 ---------------+--------+--------+--------- RxCan1[260] Avg| 9.93| 0.2149| 0.024 Peak| | 0.2174| 1.096 ---------------+--------+--------+--------- RxCan1[270] Avg| 49.96| 1.2042| 0.026 Peak| | 1.2755| 20.612 ---------------+--------+--------+--------- RxCan1[280] Avg| 49.96| 1.0922| 0.020 Peak| | 1.1312| 1.266 ---------------+--------+--------+--------- RxCan1[2e4] Avg| 19.96| 0.6942| 0.044 Peak| | 0.8604| 1.533 ---------------+--------+--------+--------- RxCan1[2ec] Avg| 10.00| 0.3727| 0.025 Peak| | 0.5154| 28.819 ---------------+--------+--------+--------- RxCan1[2ed] Avg| 10.00| 0.2298| 0.023 Peak| | 0.2378| 1.345 ---------------+--------+--------+--------- RxCan1[2ee] Avg| 9.96| 0.2172| 0.019 Peak| | 0.2210| 1.058 ---------------+--------+--------+--------- RxCan1[312] Avg| 10.00| 0.2206| 0.020 Peak| | 0.2396| 1.060 ---------------+--------+--------+--------- RxCan1[326] Avg| 9.96| 0.2099| 0.020 Peak| | 0.2158| 0.507 ---------------+--------+--------+--------- RxCan1[336] Avg| 1.00| 0.0212| 0.020 Peak| | 0.0233| 0.315 ---------------+--------+--------+--------- RxCan1[352] Avg| 6.64| 0.1675| 0.024 Peak| | 0.1818| 1.048 ---------------+--------+--------+--------- RxCan1[355] Avg| 2.00| 0.0540| 0.027 Peak| | 0.0619| 1.209 ---------------+--------+--------+--------- RxCan1[35e] Avg| 9.98| 0.2221| 0.021 Peak| | 0.2284| 1.186 ---------------+--------+--------+--------- RxCan1[365] Avg| 10.00| 0.2282| 0.023 Peak| | 0.2335| 0.769 ---------------+--------+--------+--------- RxCan1[366] Avg| 10.00| 0.3163| 0.022 Peak| | 0.6330| 23.587 ---------------+--------+--------+--------- RxCan1[367] Avg| 10.00| 0.2417| 0.021 Peak| | 0.2568| 1.417 ---------------+--------+--------+--------- RxCan1[368] Avg| 9.96| 0.2187| 0.019 Peak| | 0.2250| 1.135 ---------------+--------+--------+--------- RxCan1[369] Avg| 9.99| 0.2277| 0.021 Peak| | 0.2334| 0.667 ---------------+--------+--------+--------- RxCan1[380] Avg| 9.96| 0.2133| 0.020 Peak| | 0.2161| 0.560 ---------------+--------+--------+--------- RxCan1[38b] Avg| 24.92| 0.5622| 0.022 Peak| | 0.5716| 1.618 ---------------+--------+--------+--------- RxCan1[3b3] Avg| 10.00| 0.2132| 0.023 Peak| | 0.2194| 1.106 ---------------+--------+--------+--------- RxCan1[400] Avg| 4.00| 0.0885| 0.019 Peak| | 0.0885| 0.570 ---------------+--------+--------+--------- RxCan1[405] Avg| 3.70| 0.1414| 0.036 Peak| | 0.1414| 0.710 ---------------+--------+--------+--------- RxCan1[40a] Avg| 8.00| 0.1887| 0.021 Peak| | 0.1887| 1.027 ---------------+--------+--------+--------- RxCan1[410] Avg| 10.00| 0.2141| 0.023 Peak| | 0.2188| 0.984 ---------------+--------+--------+--------- RxCan1[411] Avg| 10.00| 0.2325| 0.023 Peak| | 0.2447| 0.660 ---------------+--------+--------+--------- RxCan1[416] Avg| 10.00| 0.2326| 0.022 Peak| | 0.2389| 0.774 ---------------+--------+--------+--------- RxCan1[421] Avg| 10.00| 0.2245| 0.021 Peak| | 0.2271| 1.160 ---------------+--------+--------+--------- RxCan1[42d] Avg| 10.00| 0.2315| 0.021 Peak| | 0.2411| 0.677 ---------------+--------+--------+--------- RxCan1[42f] Avg| 10.00| 0.2480| 0.020 Peak| | 0.2975| 8.093 ---------------+--------+--------+--------- RxCan1[430] Avg| 10.00| 0.2203| 0.019 Peak| | 0.2302| 0.847 ---------------+--------+--------+--------- RxCan1[434] Avg| 10.00| 0.2331| 0.019 Peak| | 0.2620| 1.150 ---------------+--------+--------+--------- RxCan1[435] Avg| 6.68| 0.1445| 0.020 Peak| | 0.1486| 1.063 ---------------+--------+--------+--------- RxCan1[43e] Avg| 20.00| 0.4515| 0.021 Peak| | 0.4632| 1.013 ---------------+--------+--------+--------- RxCan1[440] Avg| 1.00| 0.0210| 0.019 Peak| | 0.0218| 0.294 ---------------+--------+--------+--------- RxCan1[465] Avg| 0.95| 0.0214| 0.023 Peak| | 0.0215| 0.587 ---------------+--------+--------+--------- RxCan1[466] Avg| 0.95| 0.0211| 0.021 Peak| | 0.0215| 0.350 ---------------+--------+--------+--------- RxCan1[467] Avg| 0.95| 0.0191| 0.020 Peak| | 0.0201| 0.444 ---------------+--------+--------+--------- RxCan1[472] Avg| 0.68| 0.0588| 0.085 Peak| | 0.0606| 1.170 ---------------+--------+--------+--------- RxCan1[473] Avg| 0.66| 0.0407| 0.062 Peak| | 0.0492| 1.329 ---------------+--------+--------+--------- RxCan1[474] Avg| 1.00| 0.0218| 0.021 Peak| | 0.0237| 0.278 ---------------+--------+--------+--------- RxCan1[475] Avg| 1.96| 0.0466| 0.024 Peak| | 0.0570| 1.112 ---------------+--------+--------+--------- RxCan1[476] Avg| 2.00| 0.0454| 0.020 Peak| | 0.0497| 0.409 ---------------+--------+--------+--------- RxCan1[477] Avg| 2.00| 0.0497| 0.022 Peak| | 0.0595| 0.864 ---------------+--------+--------+--------- RxCan1[595] Avg| 1.00| 0.0223| 0.021 Peak| | 0.0241| 0.296 ---------------+--------+--------+--------- RxCan1[59e] Avg| 1.00| 0.0233| 0.024 Peak| | 0.0289| 0.713 ---------------+--------+--------+--------- RxCan1[5a2] Avg| 1.00| 0.0200| 0.020 Peak| | 0.0204| 0.264 ---------------+--------+--------+--------- RxCan1[5ba] Avg| 1.00| 0.0206| 0.021 Peak| | 0.0238| 0.515 ---------------+--------+--------+--------- RxCan2[020] Avg| 33.30| 0.7938| 0.022 Peak| | 0.7938| 4.793 ---------------+--------+--------+--------- RxCan2[030] Avg| 22.20| 0.5229| 0.022 Peak| | 0.5229| 0.985 ---------------+--------+--------+--------- RxCan2[03a] Avg| 19.90| 0.4700| 0.022 Peak| | 0.4700| 0.804 ---------------+--------+--------+--------- RxCan2[040] Avg| 19.90| 0.4678| 0.023 Peak| | 0.4678| 1.222 ---------------+--------+--------+--------- RxCan2[060] Avg| 20.00| 0.6480| 0.050 Peak| | 0.6480| 20.997 ---------------+--------+--------+--------- RxCan2[070] Avg| 16.60| 0.3944| 0.022 Peak| | 0.3944| 1.053 ---------------+--------+--------+--------- RxCan2[080] Avg| 16.70| 0.7032| 0.041 Peak| | 0.7032| 1.611 ---------------+--------+--------+--------- RxCan2[083] Avg| 20.10| 0.4329| 0.021 Peak| | 0.4329| 0.520 ---------------+--------+--------+--------- RxCan2[090] Avg| 24.90| 0.5674| 0.017 Peak| | 0.5674| 1.149 ---------------+--------+--------+--------- RxCan2[0a0] Avg| 16.60| 0.3836| 0.023 Peak| | 0.3836| 0.933 ---------------+--------+--------+--------- RxCan2[100] Avg| 16.50| 0.3661| 0.021 Peak| | 0.3661| 0.740 ---------------+--------+--------+--------- RxCan2[108] Avg| 24.90| 0.5923| 0.025 Peak| | 0.5923| 0.859 ---------------+--------+--------+--------- RxCan2[110] Avg| 16.70| 0.3906| 0.023 Peak| | 0.3906| 0.697 ---------------+--------+--------+--------- RxCan2[130] Avg| 14.40| 0.3341| 0.022 Peak| | 0.3341| 0.829 ---------------+--------+--------+--------- RxCan2[150] Avg| 16.50| 0.4025| 0.020 Peak| | 0.4025| 1.120 ---------------+--------+--------+--------- RxCan2[160] Avg| 4.90| 0.1252| 0.025 Peak| | 0.1252| 0.502 ---------------+--------+--------+--------- RxCan2[180] Avg| 16.60| 0.3899| 0.023 Peak| | 0.3899| 0.799 ---------------+--------+--------+--------- RxCan2[190] Avg| 16.60| 0.3892| 0.025 Peak| | 0.3892| 1.172 ---------------+--------+--------+--------- RxCan2[1a0] Avg| 1.00| 0.0281| 0.025 Peak| | 0.0281| 0.695 ---------------+--------+--------+--------- RxCan2[1a4] Avg| 20.00| 0.4525| 0.022 Peak| | 0.4525| 1.231 ---------------+--------+--------+--------- RxCan2[1a8] Avg| 12.50| 0.2886| 0.020 Peak| | 0.2886| 1.048 ---------------+--------+--------+--------- RxCan2[1b0] Avg| 10.00| 0.2300| 0.023 Peak| | 0.2300| 0.579 ---------------+--------+--------+--------- RxCan2[1b4] Avg| 10.00| 0.2334| 0.022 Peak| | 0.2334| 0.947 ---------------+--------+--------+--------- RxCan2[1b8] Avg| 12.40| 0.2970| 0.023 Peak| | 0.2970| 0.909 ---------------+--------+--------+--------- RxCan2[1c0] Avg| 10.00| 0.2257| 0.021 Peak| | 0.2257| 0.983 ---------------+--------+--------+--------- RxCan2[1e0] Avg| 10.00| 0.2141| 0.023 Peak| | 0.2141| 0.556 ---------------+--------+--------+--------- RxCan2[215] Avg| 8.30| 0.2047| 0.025 Peak| | 0.2047| 0.786 ---------------+--------+--------+--------- RxCan2[217] Avg| 8.30| 0.2033| 0.022 Peak| | 0.2033| 1.135 ---------------+--------+--------+--------- RxCan2[220] Avg| 6.70| 0.1647| 0.020 Peak| | 0.1647| 0.961 ---------------+--------+--------+--------- RxCan2[225] Avg| 24.90| 0.6136| 0.026 Peak| | 0.6136| 1.018 ---------------+--------+--------+--------- RxCan2[230] Avg| 6.70| 0.4045| 0.057 Peak| | 0.4045| 1.532 ---------------+--------+--------+--------- RxCan2[240] Avg| 8.20| 0.1849| 0.021 Peak| | 0.1849| 0.510 ---------------+--------+--------+--------- RxCan2[241] Avg| 20.00| 0.4312| 0.021 Peak| | 0.4312| 5.110 ---------------+--------+--------+--------- RxCan2[250] Avg| 5.00| 0.1072| 0.021 Peak| | 0.1072| 0.320 ---------------+--------+--------+--------- RxCan2[255] Avg| 12.50| 0.3091| 0.022 Peak| | 0.3091| 0.904 ---------------+--------+--------+--------- RxCan2[265] Avg| 12.50| 0.2819| 0.021 Peak| | 0.2819| 1.035 ---------------+--------+--------+--------- RxCan2[270] Avg| 5.00| 0.1189| 0.022 Peak| | 0.1189| 0.631 ---------------+--------+--------+--------- RxCan2[290] Avg| 3.30| 0.0740| 0.023 Peak| | 0.0740| 0.455 ---------------+--------+--------+--------- RxCan2[295] Avg| 6.60| 0.1431| 0.023 Peak| | 0.1431| 0.504 ---------------+--------+--------+--------- RxCan2[2a0] Avg| 3.30| 0.0686| 0.020 Peak| | 0.0686| 0.445 ---------------+--------+--------+--------- RxCan2[2a7] Avg| 12.50| 0.2869| 0.021 Peak| | 0.2869| 0.660 ---------------+--------+--------+--------- RxCan2[2b0] Avg| 3.20| 0.0707| 0.023 Peak| | 0.0707| 0.331 ---------------+--------+--------+--------- RxCan2[2c0] Avg| 3.20| 0.0988| 0.026 Peak| | 0.0988| 0.932 ---------------+--------+--------+--------- RxCan2[2e0] Avg| 1.60| 0.0388| 0.024 Peak| | 0.0388| 0.393 ---------------+--------+--------+--------- RxCan2[2f0] Avg| 1.70| 0.0376| 0.021 Peak| | 0.0376| 0.282 ---------------+--------+--------+--------- RxCan2[2f5] Avg| 12.50| 0.2833| 0.021 Peak| | 0.2833| 0.855 ---------------+--------+--------+--------- RxCan2[300] Avg| 1.70| 0.0398| 0.023 Peak| | 0.0398| 0.488 ---------------+--------+--------+--------- RxCan2[310] Avg| 1.60| 0.0480| 0.026 Peak| | 0.0480| 0.937 ---------------+--------+--------+--------- RxCan2[320] Avg| 1.70| 0.0346| 0.020 Peak| | 0.0346| 0.370 ---------------+--------+--------+--------- RxCan2[326] Avg| 9.90| 0.2200| 0.022 Peak| | 0.2200| 0.502 ---------------+--------+--------+--------- RxCan2[330] Avg| 32.30| 0.7323| 0.021 Peak| | 0.7323| 1.130 ---------------+--------+--------+--------- RxCan2[340] Avg| 8.20| 0.2375| 0.028 Peak| | 0.2375| 0.578 ---------------+--------+--------+--------- RxCan2[345] Avg| 1.60| 0.0393| 0.022 Peak| | 0.0393| 0.590 ---------------+--------+--------+--------- RxCan2[35e] Avg| 5.00| 0.1303| 0.023 Peak| | 0.1303| 0.943 ---------------+--------+--------+--------- RxCan2[360] Avg| 1.70| 0.0381| 0.025 Peak| | 0.0381| 0.922 ---------------+--------+--------+--------- RxCan2[361] Avg| 8.20| 0.1907| 0.023 Peak| | 0.1907| 1.119 ---------------+--------+--------+--------- RxCan2[363] Avg| 1.30| 0.0337| 0.024 Peak| | 0.0337| 0.425 ---------------+--------+--------+--------- RxCan2[370] Avg| 0.90| 0.0194| 0.022 Peak| | 0.0194| 0.246 ---------------+--------+--------+--------- RxCan2[381] Avg| 3.20| 0.0684| 0.024 Peak| | 0.0684| 0.828 ---------------+--------+--------+--------- RxCan2[3a0] Avg| 16.60| 0.3734| 0.022 Peak| | 0.3734| 0.636 ---------------+--------+--------+--------- RxCan2[3d0] Avg| 10.00| 0.2262| 0.023 Peak| | 0.2262| 0.663 ---------------+--------+--------+--------- RxCan2[3d5] Avg| 5.60| 0.1335| 0.022 Peak| | 0.1335| 1.222 ---------------+--------+--------+--------- RxCan2[400] Avg| 4.00| 0.0949| 0.022 Peak| | 0.0949| 0.715 ---------------+--------+--------+--------- RxCan2[405] Avg| 3.70| 0.0861| 0.022 Peak| | 0.0861| 0.443 ---------------+--------+--------+--------- RxCan2[40a] Avg| 8.00| 0.1853| 0.021 Peak| | 0.1853| 0.552 ---------------+--------+--------+--------- RxCan2[415] Avg| 1.60| 0.0341| 0.021 Peak| | 0.0341| 0.273 ---------------+--------+--------+--------- RxCan2[435] Avg| 0.90| 0.0220| 0.025 Peak| | 0.0220| 0.354 ---------------+--------+--------+--------- RxCan2[440] Avg| 0.90| 0.0199| 0.021 Peak| | 0.0199| 0.266 ---------------+--------+--------+--------- RxCan2[465] Avg| 0.90| 0.0234| 0.028 Peak| | 0.0234| 0.633 ---------------+--------+--------+--------- RxCan2[466] Avg| 1.00| 0.0222| 0.021 Peak| | 0.0222| 0.322 ---------------+--------+--------+--------- RxCan2[467] Avg| 1.00| 0.0221| 0.020 Peak| | 0.0221| 0.355 ---------------+--------+--------+--------- RxCan2[501] Avg| 1.50| 0.0335| 0.023 Peak| | 0.0335| 0.393 ---------------+--------+--------+--------- RxCan2[503] Avg| 1.50| 0.0370| 0.022 Peak| | 0.0370| 0.546 ---------------+--------+--------+--------- RxCan2[504] Avg| 1.40| 0.0328| 0.022 Peak| | 0.0328| 0.489 ---------------+--------+--------+--------- RxCan2[505] Avg| 1.40| 0.0290| 0.021 Peak| | 0.0290| 0.354 ---------------+--------+--------+--------- RxCan2[508] Avg| 1.40| 0.0318| 0.023 Peak| | 0.0318| 0.408 ---------------+--------+--------+--------- RxCan2[511] Avg| 1.40| 0.0306| 0.022 Peak| | 0.0306| 0.328 ---------------+--------+--------+--------- RxCan2[51e] Avg| 1.40| 0.0310| 0.022 Peak| | 0.0310| 0.269 ---------------+--------+--------+--------- RxCan2[581] Avg| 1.00| 0.0222| 0.022 Peak| | 0.0222| 0.256 ---------------+--------+--------+--------- Cmd:State Avg| 0.00| 0.0000| 0.002 Peak| | 0.0000| 0.024 ===============+========+========+========= Total Avg| 2795.57| 82.7745| 40.174
Cheers, Simon
Am 17.01.2025 um 17:49 schrieb Michael Balzer via OvmsDev:
OK, I've got a new idea: CAN timing.
Comparing our esp32can bit timing to the esp-idf driver's, there seem to be some differences:
https://github.com/espressif/esp-idf/blob/master/components/hal/include/hal/...
Transceivers are normally tolerant to small timing offsets. Maybe being off a little bit has no effect under normal conditions, but it has when the transceiver has to cope with a filled RX queue. That could be causing the transceiver to slide just out of sync. If the timing gets garbled, the transceiver would signal errors in the packets to the bus, possibly so many the vehicle ECUs decide to raise an error condition.
Is that plausible?
On why the new poller could be causing this (in combination with too slow processing by the vehicle): as mentioned, the standard CAN listener mechanism doesn't care about queue overflows. The poller does. `OvmsPollers::Queue_PollerFrame()` does a log call when Tx/Rx tracing is enabled, that could even block, but tracing is optional and only meant for debugging. Not optional is the overflow counting using an atomic uint32.
The atomic types are said to be fast, but I never checked their actual implementation on the ESP32. Maybe they can block as well?
@Simon: it would be an option to try commenting out the overflow counting, to see if that's causing the issue.
Regards, Michael
Am 17.01.25 um 15:37 schrieb Chris Box via OvmsDev:
Yes, I can confirm I've had one experience of the Leaf switching to Neutral while driving, with a yellow warning symbol on the dash. It refused to reselect Drive until I had switched the car off and back on. Derek wasn't so lucky and he need to clear fault codes before the car would work.
On returning home, I found OVMS was not accessible over a network. I didn't try a USB cable. Unplugging and reinserting the OBD cable caused OVMS to rejoin Wi-Fi. However the SD logs showed nothing from the time of the event. CAN writes are enabled, so it can perform SOC limiting.
My car has been using this firmware since 21st November, based on the git master of that day. As a relatively new user of OVMS (only since October) I don't have much experience of older firmware.
Perhaps a safeguard should be implemented before releasing a new stable firmware that will be automatically downloaded by Leaf owners. But I don't have the expertise to know what that safeguard should be. Derek's suggestion of 'only CAN write when parked' appears to be a good idea.
Chris
On 2025-01-15 18:18, Derek Caudwell via OvmsDev wrote:
Since the following email I have high confidence the issue on the Leaf is related/caused by the poller as there has been no further occurrence and Chris has also experienced the car going to neutral on the new poller firmware.
.... I haven't ruled out it being a fault with my car yet. Shortly after it faulted the car was run into so has been off the road for sometime, my first step was to replace 12V battery. The ovms unit is now unplugged and if it does not fault over the next month while driving I'll be reasonably confident it's ovms related.
Not sure which firmware version the poller updates were included in but it was only after upgrading to it that the errors occurred (which could be coincidental however it has faulted twice more both on version 3.3.004-141-gf729d82c). For periods where I reverted to 3.3.003 it was fine.
It might be useful to have an extra option on the enable can write to only enable it when the car is parked/charging.
_______________________________________________ OvmsDev mailing listOvmsDev@lists.openvehicles.comhttp://lists.openvehicles.com/mailman/listinfo/ovmsdev
-- Michael Balzer * Am Rahmen 5 * D-58313 Herdecke <https://www.google.com/maps/search/Am+Rahmen+5+*+D-58313+Herdecke?entry=gmail&source=g> Fon 02330 9104094 * Handy 0176 20698926
_______________________________________________ OvmsDev mailing listOvmsDev@lists.openvehicles.comhttp://lists.openvehicles.com/mailman/listinfo/ovmsdev
_______________________________________________ OvmsDev mailing listOvmsDev@lists.openvehicles.comhttp://lists.openvehicles.com/mailman/listinfo/ovmsdev
_______________________________________________ OvmsDev mailing list OvmsDev@lists.openvehicles.com http://lists.openvehicles.com/mailman/listinfo/ovmsdev
I have commented out the line with the Atomic_Increment statement. Now I no longer receive any messages with “RX Task Queue Overflow Run” Here is the output of poller times status:
The main question is if you still get the CAN bus crash (vehicle running into issues) with that modification in active mode. Timing statistics were not expected to change. Nearly 2800 frames per second is quite a lot, and most is on can1 with many frame periods at 20 ms. Yet the total processing time averages at 30-40 ms, so there is no actual CPU capacity issue for that amount of frames. @Derek: can you please supply these statistics for the Leaf in drive mode as well? Am 18.01.25 um 02:42 schrieb Michael Geddes via OvmsDev:
Maybe try setting CONFIG_OVMS_VEHICLE_CAN_RX_QUEUE_SIZE = 160 and see if that reduces the overflow?
Simons car sends at least 91 process data frame IDs on can1 and 84 on can2. Worst case would be these come all in within the shortest possible time span, that would mean the queue needs to be able to hold 175 frames. I'd add some headroom and round up to 200. But keep in mind, if the Incoming processing actually occasionally gets blocked for up to 60 ms -- as indicated by Simons statistics --, the queue may need to be twice as large. Am 18.01.25 um 02:42 schrieb Michael Geddes via OvmsDev:
I was thinking that the frame filter would be here: void OvmsPollers::PollerRxCallback(const CAN_frame_t* frame, bool success) { Queue_PollerFrame(*frame, success, false); } which I guess is executed in the task handling the CAN queue. (we don't know how many frames get dropped there).
Actually we do know that, or at least have some indication, as we count the CAN transceiver queue overruns. That info is included as "Rx overflw" in the can status output & as "rxovr" in the logs. Adding a filter before queueing the frame would exclude the filtered IDs from all vehicle processing. I meant adding a filter just to exclude IDs from the timing statistics, assuming those are the culprits, as Simon wrote the issue only appears after enabling the timing statistics and printing them. That's why I asked if printing might need to lock the statistics for too long in case of such a long list. Completely blocking ID ranges from processing by the vehicle should normally not be necessary, unless the Incoming handler is written very poorly. Yet, if we add that, a mutex in the CAN RX callback must be avoided, or would need to be non-blocking:
The only real concern is thread safety between checking and adding to the filter - so the check itself might have to be mutexed. void OvmsPollers::PollerRxCallback(const CAN_frame_t* frame, bool success) { // Check filter { OvmsRecMutexLock lock(&m_filter_mutex); if (! m_filter->IsFiltered(frame)) return; } Queue_PollerFrame(*frame, success, false); }
A mutex like that could block the CAN task, which must be avoided at all cost. I introduced CAN callbacks for vehicles & applications that need to react to certain frames as fast as possible, e.g. to maintain control precedence, so cannot use the standard CAN listener mechanism (frame queueing). The current poller callback use is OK, if (!) the atomic type really isn't the culprit, ie doesn't block. So if (!) an ID filter needs to be added before queueing, it needs to be done in a way that needs no mutex. But I don't see an issue with the vehicle passing a fixed filter when registering with the poller/buses. The filter doesn't need to by mutable on the fly. Regards, Michael Am 17.01.25 um 19:42 schrieb Simon Ehlen via OvmsDev:
The poller statistics can help you track this down, but you need to have at least 10 seconds of statistics, the more the better. Rule of thumb: PRI average at 0.0/second means you don't have enough data yet.
There were again many messages with “RX Task Queue Overflow Run”. Here are the statistics of poller times status:
OVMS# poll times status Poller timing is: on Type | count | Utlztn | Time | per s | [%] | [ms] ---------------+--------+--------+--------- Poll:PRI Avg| 1.00| 0.0043| 0.004 Peak| | 0.0043| 0.052 ---------------+--------+--------+--------- RxCan1[010] Avg| 34.26| 1.6741| 0.015 Peak| | 1.6741| 1.182 ---------------+--------+--------+--------- RxCan1[030] Avg| 34.06| 1.7085| 0.020 Peak| | 1.7085| 1.390 ---------------+--------+--------+--------- RxCan1[041] Avg| 49.89| 0.8109| 0.016 Peak| | 0.8541| 1.098 ---------------+--------+--------+--------- RxCan1[049] Avg| 50.00| 1.5970| 0.019 Peak| | 1.7154| 32.233 ---------------+--------+--------+--------- RxCan1[04c] Avg| 49.92| 0.8340| 0.014 Peak| | 0.8933| 1.995 ---------------+--------+--------+--------- RxCan1[04d] Avg| 34.43| 1.6211| 0.014 Peak| | 1.6756| 1.318 ---------------+--------+--------+--------- RxCan1[076] Avg| 50.00| 0.8362| 0.024 Peak| | 0.8784| 2.185 ---------------+--------+--------+--------- RxCan1[077] Avg| 50.00| 0.7837| 0.014 Peak| | 0.8083| 1.156 ---------------+--------+--------+--------- RxCan1[07a] Avg| 34.31| 2.1870| 0.017 Peak| | 2.3252| 1.888 ---------------+--------+--------+--------- RxCan1[07d] Avg| 50.00| 0.8001| 0.013 Peak| | 0.8434| 1.150 ---------------+--------+--------+--------- RxCan1[0c8] Avg| 49.96| 0.8359| 0.013 Peak| | 0.8715| 1.171 ---------------+--------+--------+--------- RxCan1[11a] Avg| 34.35| 1.6701| 0.020 Peak| | 1.6981| 1.273 ---------------+--------+--------+--------- RxCan1[130] Avg| 50.00| 0.7902| 0.018 Peak| | 0.8513| 0.980 ---------------+--------+--------+--------- RxCan1[139] Avg| 49.92| 0.7872| 0.013 Peak| | 0.8219| 0.795 ---------------+--------+--------+--------- RxCan1[156] Avg| 10.00| 0.1620| 0.014 Peak| | 0.1729| 0.919 ---------------+--------+--------+--------- RxCan1[160] Avg| 50.04| 0.7977| 0.014 Peak| | 0.8232| 1.495 ---------------+--------+--------+--------- RxCan1[165] Avg| 49.85| 0.7976| 0.014 Peak| | 0.8486| 1.015 ---------------+--------+--------+--------- RxCan1[167] Avg| 34.39| 1.6025| 0.016 Peak| | 1.6888| 1.354 ---------------+--------+--------+--------- RxCan1[171] Avg| 50.00| 0.8150| 0.017 Peak| | 0.8488| 1.091 ---------------+--------+--------+--------- RxCan1[178] Avg| 10.00| 0.1614| 0.014 Peak| | 0.1702| 0.903 ---------------+--------+--------+--------- RxCan1[179] Avg| 10.00| 0.1630| 0.017 Peak| | 0.1663| 1.336 ---------------+--------+--------+--------- RxCan1[180] Avg| 50.00| 0.8137| 0.014 Peak| | 0.8605| 1.566 ---------------+--------+--------+--------- RxCan1[185] Avg| 50.04| 0.8033| 0.013 Peak| | 0.8393| 1.126 ---------------+--------+--------+--------- RxCan1[1a0] Avg| 49.92| 0.7748| 0.013 Peak| | 0.8169| 1.184 ---------------+--------+--------+--------- RxCan1[1e0] Avg| 49.92| 0.7738| 0.014 Peak| | 0.8028| 1.049 ---------------+--------+--------+--------- RxCan1[1e4] Avg| 49.89| 0.9692| 0.018 Peak| | 1.0096| 1.332 ---------------+--------+--------+--------- RxCan1[1f0] Avg| 33.22| 0.5544| 0.014 Peak| | 0.5855| 0.848 ---------------+--------+--------+--------- RxCan1[200] Avg| 49.92| 0.7879| 0.015 Peak| | 0.8345| 1.206 ---------------+--------+--------+--------- RxCan1[202] Avg| 34.28| 1.7075| 0.016 Peak| | 1.7874| 1.218 ---------------+--------+--------+--------- RxCan1[204] Avg| 34.35| 1.5641| 0.013 Peak| | 1.6427| 1.235 ---------------+--------+--------+--------- RxCan1[213] Avg| 49.89| 0.7814| 0.015 Peak| | 0.8232| 0.910 ---------------+--------+--------+--------- RxCan1[214] Avg| 49.92| 0.7736| 0.014 Peak| | 0.8216| 0.800 ---------------+--------+--------+--------- RxCan1[217] Avg| 34.31| 1.6294| 0.014 Peak| | 1.7165| 1.153 ---------------+--------+--------+--------- RxCan1[218] Avg| 49.86| 0.7877| 0.013 Peak| | 0.8290| 1.068 ---------------+--------+--------+--------- RxCan1[230] Avg| 50.00| 0.7596| 0.014 Peak| | 0.7660| 1.021 ---------------+--------+--------+--------- RxCan1[240] Avg| 10.00| 0.1669| 0.013 Peak| | 0.1835| 0.887 ---------------+--------+--------+--------- RxCan1[242] Avg| 24.96| 0.4764| 0.020 Peak| | 0.4963| 1.501 ---------------+--------+--------+--------- RxCan1[24a] Avg| 9.89| 0.1789| 0.015 Peak| | 0.2009| 0.874 ---------------+--------+--------+--------- RxCan1[24b] Avg| 9.89| 0.1702| 0.014 Peak| | 0.1870| 1.195 ---------------+--------+--------+--------- RxCan1[24c] Avg| 9.89| 0.2146| 0.019 Peak| | 0.2187| 1.242 ---------------+--------+--------+--------- RxCan1[25a] Avg| 10.00| 0.1603| 0.013 Peak| | 0.1667| 0.720 ---------------+--------+--------+--------- RxCan1[25b] Avg| 49.94| 0.7918| 0.017 Peak| | 0.8454| 1.666 ---------------+--------+--------+--------- RxCan1[25c] Avg| 34.24| 1.5331| 0.013 Peak| | 1.5997| 1.538 ---------------+--------+--------+--------- RxCan1[260] Avg| 10.00| 0.1626| 0.014 Peak| | 0.1682| 0.718 ---------------+--------+--------+--------- RxCan1[270] Avg| 49.90| 0.8120| 0.014 Peak| | 0.8460| 1.671 ---------------+--------+--------+--------- RxCan1[280] Avg| 49.92| 0.7777| 0.019 Peak| | 0.8447| 1.157 ---------------+--------+--------+--------- RxCan1[2e4] Avg| 19.89| 0.5778| 0.032 Peak| | 0.6648| 2.226 ---------------+--------+--------+--------- RxCan1[2ec] Avg| 10.00| 0.1701| 0.014 Peak| | 0.1755| 0.928 ---------------+--------+--------+--------- RxCan1[2ed] Avg| 10.00| 0.1650| 0.013 Peak| | 0.1747| 0.917 ---------------+--------+--------+--------- RxCan1[2ee] Avg| 9.98| 0.1544| 0.013 Peak| | 0.1588| 1.312 ---------------+--------+--------+--------- RxCan1[312] Avg| 10.00| 0.1648| 0.017 Peak| | 0.1690| 0.922 ---------------+--------+--------+--------- RxCan1[326] Avg| 9.89| 0.1603| 0.015 Peak| | 0.1833| 1.230 ---------------+--------+--------+--------- RxCan1[336] Avg| 1.00| 0.0146| 0.015 Peak| | 0.0150| 0.349 ---------------+--------+--------+--------- RxCan1[352] Avg| 6.66| 0.1223| 0.022 Peak| | 0.1338| 1.015 ---------------+--------+--------+--------- RxCan1[355] Avg| 2.00| 0.0424| 0.019 Peak| | 0.0431| 0.786 ---------------+--------+--------+--------- RxCan1[35e] Avg| 9.96| 0.1570| 0.013 Peak| | 0.1644| 0.579 ---------------+--------+--------+--------- RxCan1[365] Avg| 10.00| 0.1600| 0.014 Peak| | 0.1653| 0.961 ---------------+--------+--------+--------- RxCan1[366] Avg| 10.00| 0.1716| 0.013 Peak| | 0.1890| 0.987 ---------------+--------+--------+--------- RxCan1[367] Avg| 9.93| 0.1793| 0.015 Peak| | 0.1864| 0.984 ---------------+--------+--------+--------- RxCan1[368] Avg| 10.00| 0.1645| 0.014 Peak| | 0.1778| 0.768 ---------------+--------+--------+--------- RxCan1[369] Avg| 10.00| 0.1562| 0.016 Peak| | 0.1606| 0.724 ---------------+--------+--------+--------- RxCan1[380] Avg| 10.00| 0.1619| 0.014 Peak| | 0.1644| 0.605 ---------------+--------+--------+--------- RxCan1[38b] Avg| 25.00| 0.3991| 0.016 Peak| | 0.4280| 1.448 ---------------+--------+--------+--------- RxCan1[3b3] Avg| 10.00| 0.1537| 0.013 Peak| | 0.1610| 0.380 ---------------+--------+--------+--------- RxCan1[400] Avg| 4.00| 0.0626| 0.014 Peak| | 0.0626| 0.251 ---------------+--------+--------+--------- RxCan1[405] Avg| 3.90| 0.1019| 0.028 Peak| | 0.1019| 0.781 ---------------+--------+--------+--------- RxCan1[40a] Avg| 7.90| 0.1256| 0.020 Peak| | 0.1256| 0.991 ---------------+--------+--------+--------- RxCan1[410] Avg| 10.00| 0.1643| 0.016 Peak| | 0.1839| 1.634 ---------------+--------+--------+--------- RxCan1[411] Avg| 10.00| 0.1532| 0.013 Peak| | 0.1645| 0.824 ---------------+--------+--------+--------- RxCan1[416] Avg| 10.00| 0.1516| 0.016 Peak| | 0.1582| 0.807 ---------------+--------+--------+--------- RxCan1[421] Avg| 10.00| 0.1648| 0.013 Peak| | 0.1740| 0.839 ---------------+--------+--------+--------- RxCan1[42d] Avg| 10.00| 0.1548| 0.014 Peak| | 0.1658| 0.741 ---------------+--------+--------+--------- RxCan1[42f] Avg| 10.00| 0.1527| 0.013 Peak| | 0.1578| 0.667 ---------------+--------+--------+--------- RxCan1[430] Avg| 10.00| 0.1730| 0.016 Peak| | 0.1880| 1.209 ---------------+--------+--------+--------- RxCan1[434] Avg| 10.00| 0.1620| 0.021 Peak| | 0.1712| 1.140 ---------------+--------+--------+--------- RxCan1[435] Avg| 6.66| 0.1104| 0.014 Peak| | 0.1121| 1.011 ---------------+--------+--------+--------- RxCan1[43e] Avg| 20.00| 0.3194| 0.013 Peak| | 0.3434| 1.212 ---------------+--------+--------+--------- RxCan1[440] Avg| 1.00| 0.0160| 0.014 Peak| | 0.0175| 0.315 ---------------+--------+--------+--------- RxCan1[465] Avg| 1.00| 0.0172| 0.015 Peak| | 0.0194| 0.404 ---------------+--------+--------+--------- RxCan1[466] Avg| 1.00| 0.0198| 0.015 Peak| | 0.0252| 0.890 ---------------+--------+--------+--------- RxCan1[467] Avg| 1.00| 0.0152| 0.014 Peak| | 0.0160| 0.217 ---------------+--------+--------+--------- RxCan1[472] Avg| 0.70| 0.0533| 0.075 Peak| | 0.0546| 0.990 ---------------+--------+--------+--------- RxCan1[473] Avg| 0.65| 0.0325| 0.051 Peak| | 0.0361| 0.774 ---------------+--------+--------+--------- RxCan1[474] Avg| 1.00| 0.0146| 0.014 Peak| | 0.0151| 0.189 ---------------+--------+--------+--------- RxCan1[475] Avg| 2.00| 0.0332| 0.015 Peak| | 0.0362| 0.513 ---------------+--------+--------+--------- RxCan1[476] Avg| 2.00| 0.0305| 0.014 Peak| | 0.0307| 0.249 ---------------+--------+--------+--------- RxCan1[477] Avg| 2.00| 0.0309| 0.014 Peak| | 0.0311| 0.438 ---------------+--------+--------+--------- RxCan1[595] Avg| 1.00| 0.0151| 0.014 Peak| | 0.0160| 0.230 ---------------+--------+--------+--------- RxCan1[59e] Avg| 1.00| 0.0179| 0.015 Peak| | 0.0209| 0.716 ---------------+--------+--------+--------- RxCan1[5a2] Avg| 1.00| 0.0154| 0.016 Peak| | 0.0184| 0.699 ---------------+--------+--------+--------- RxCan1[5ba] Avg| 1.00| 0.0159| 0.017 Peak| | 0.0174| 0.485 ---------------+--------+--------+--------- RxCan2[010] Avg| 0.00| 0.0000| 0.015 Peak| | 0.0000| 0.146 ---------------+--------+--------+--------- RxCan2[020] Avg| 31.10| 0.5159| 0.015 Peak| | 0.5730| 0.992 ---------------+--------+--------+--------- RxCan2[030] Avg| 20.70| 0.3506| 0.016 Peak| | 0.3956| 1.055 ---------------+--------+--------+--------- RxCan2[03a] Avg| 18.65| 0.3157| 0.014 Peak| | 0.3292| 0.702 ---------------+--------+--------+--------- RxCan2[040] Avg| 18.60| 0.3111| 0.015 Peak| | 0.3474| 0.953 ---------------+--------+--------+--------- RxCan2[060] Avg| 18.60| 0.3182| 0.014 Peak| | 0.3569| 0.694 ---------------+--------+--------+--------- RxCan2[070] Avg| 15.55| 0.4581| 0.017 Peak| | 0.6859| 39.212 ---------------+--------+--------+--------- RxCan2[080] Avg| 15.50| 0.5041| 0.029 Peak| | 0.5414| 1.555 ---------------+--------+--------+--------- RxCan2[083] Avg| 18.70| 0.3083| 0.014 Peak| | 0.3325| 0.557 ---------------+--------+--------+--------- RxCan2[090] Avg| 23.40| 0.3961| 0.014 Peak| | 0.4445| 1.218 ---------------+--------+--------+--------- RxCan2[0a0] Avg| 15.55| 0.2734| 0.014 Peak| | 0.3144| 1.062 ---------------+--------+--------+--------- RxCan2[100] Avg| 15.50| 0.2645| 0.016 Peak| | 0.2875| 1.021 ---------------+--------+--------+--------- RxCan2[108] Avg| 23.40| 0.4231| 0.016 Peak| | 0.4680| 1.297 ---------------+--------+--------+--------- RxCan2[110] Avg| 15.55| 0.2467| 0.014 Peak| | 0.2684| 0.475 ---------------+--------+--------+--------- RxCan2[130] Avg| 13.30| 0.2231| 0.014 Peak| | 0.2447| 0.512 ---------------+--------+--------+--------- RxCan2[150] Avg| 15.50| 0.2533| 0.015 Peak| | 0.2836| 0.823 ---------------+--------+--------+--------- RxCan2[160] Avg| 4.70| 0.0784| 0.014 Peak| | 0.0863| 0.608 ---------------+--------+--------+--------- RxCan2[180] Avg| 15.55| 0.2713| 0.015 Peak| | 0.2841| 0.884 ---------------+--------+--------+--------- RxCan2[190] Avg| 15.50| 0.2596| 0.014 Peak| | 0.2825| 0.743 ---------------+--------+--------+--------- RxCan2[1a0] Avg| 0.95| 0.0164| 0.015 Peak| | 0.0164| 0.346 ---------------+--------+--------+--------- RxCan2[1a4] Avg| 18.65| 0.3232| 0.015 Peak| | 0.3515| 0.989 ---------------+--------+--------+--------- RxCan2[1a8] Avg| 11.60| 0.1911| 0.016 Peak| | 0.2012| 0.757 ---------------+--------+--------+--------- RxCan2[1b0] Avg| 9.35| 0.1558| 0.016 Peak| | 0.1641| 0.795 ---------------+--------+--------+--------- RxCan2[1b4] Avg| 9.35| 0.1543| 0.015 Peak| | 0.1617| 1.217 ---------------+--------+--------+--------- RxCan2[1b8] Avg| 11.65| 0.2003| 0.014 Peak| | 0.2236| 1.549 ---------------+--------+--------+--------- RxCan2[1c0] Avg| 9.40| 0.1532| 0.016 Peak| | 0.1673| 0.955 ---------------+--------+--------+--------- RxCan2[1e0] Avg| 9.30| 0.1582| 0.015 Peak| | 0.1708| 0.661 ---------------+--------+--------+--------- RxCan2[215] Avg| 7.80| 0.1409| 0.016 Peak| | 0.1531| 0.660 ---------------+--------+--------+--------- RxCan2[217] Avg| 7.80| 0.1239| 0.014 Peak| | 0.1333| 0.520 ---------------+--------+--------+--------- RxCan2[220] Avg| 6.20| 0.1041| 0.015 Peak| | 0.1094| 0.652 ---------------+--------+--------+--------- RxCan2[225] Avg| 23.40| 0.4648| 0.015 Peak| | 0.4696| 4.288 ---------------+--------+--------+--------- RxCan2[230] Avg| 6.20| 0.3120| 0.048 Peak| | 0.3377| 1.065 ---------------+--------+--------+--------- RxCan2[240] Avg| 7.70| 0.1248| 0.014 Peak| | 0.1364| 0.635 ---------------+--------+--------+--------- RxCan2[241] Avg| 18.60| 0.3258| 0.014 Peak| | 0.3343| 1.288 ---------------+--------+--------+--------- RxCan2[250] Avg| 4.70| 0.0761| 0.014 Peak| | 0.0809| 0.322 ---------------+--------+--------+--------- RxCan2[255] Avg| 11.75| 0.2058| 0.014 Peak| | 0.2283| 0.937 ---------------+--------+--------+--------- RxCan2[265] Avg| 11.65| 0.1964| 0.014 Peak| | 0.2068| 0.965 ---------------+--------+--------+--------- RxCan2[270] Avg| 4.70| 0.0808| 0.016 Peak| | 0.0949| 0.729 ---------------+--------+--------+--------- RxCan2[290] Avg| 3.15| 0.0498| 0.015 Peak| | 0.0504| 0.449 ---------------+--------+--------+--------- RxCan2[295] Avg| 6.25| 0.1019| 0.014 Peak| | 0.1094| 0.859 ---------------+--------+--------+--------- RxCan2[2a0] Avg| 3.15| 0.0550| 0.014 Peak| | 0.0551| 0.779 ---------------+--------+--------+--------- RxCan2[2a7] Avg| 11.65| 0.1929| 0.014 Peak| | 0.2080| 0.775 ---------------+--------+--------+--------- RxCan2[2b0] Avg| 3.00| 0.0497| 0.015 Peak| | 0.0562| 0.528 ---------------+--------+--------+--------- RxCan2[2c0] Avg| 3.10| 0.0534| 0.016 Peak| | 0.0592| 0.501 ---------------+--------+--------+--------- RxCan2[2e0] Avg| 1.55| 0.0247| 0.014 Peak| | 0.0289| 0.319 ---------------+--------+--------+--------- RxCan2[2f0] Avg| 1.55| 0.0244| 0.014 Peak| | 0.0273| 0.192 ---------------+--------+--------+--------- RxCan2[2f5] Avg| 11.65| 0.2078| 0.016 Peak| | 0.2333| 0.879 ---------------+--------+--------+--------- RxCan2[300] Avg| 1.60| 0.0266| 0.018 Peak| | 0.0278| 0.724 ---------------+--------+--------+--------- RxCan2[310] Avg| 1.55| 0.0276| 0.016 Peak| | 0.0285| 0.759 ---------------+--------+--------+--------- RxCan2[320] Avg| 1.60| 0.0240| 0.014 Peak| | 0.0258| 0.179 ---------------+--------+--------+--------- RxCan2[326] Avg| 9.30| 0.1550| 0.014 Peak| | 0.1582| 0.850 ---------------+--------+--------+--------- RxCan2[330] Avg| 29.95| 0.5311| 0.015 Peak| | 0.5565| 4.522 ---------------+--------+--------+--------- RxCan2[340] Avg| 7.75| 0.1693| 0.024 Peak| | 0.1868| 1.148 ---------------+--------+--------+--------- RxCan2[345] Avg| 1.60| 0.0292| 0.016 Peak| | 0.0316| 0.471 ---------------+--------+--------+--------- RxCan2[350] Avg| 0.00| 0.0000| 0.019 Peak| | 0.0000| 0.188 ---------------+--------+--------+--------- RxCan2[35e] Avg| 4.70| 0.0851| 0.019 Peak| | 0.0911| 1.023 ---------------+--------+--------+--------- RxCan2[360] Avg| 1.60| 0.0258| 0.015 Peak| | 0.0284| 0.306 ---------------+--------+--------+--------- RxCan2[361] Avg| 7.75| 0.1341| 0.017 Peak| | 0.1487| 0.761 ---------------+--------+--------+--------- RxCan2[363] Avg| 1.20| 0.0203| 0.016 Peak| | 0.0220| 0.421 ---------------+--------+--------+--------- RxCan2[370] Avg| 0.85| 0.0140| 0.016 Peak| | 0.0162| 0.354 ---------------+--------+--------+--------- RxCan2[381] Avg| 3.15| 0.0512| 0.016 Peak| | 0.0546| 0.416 ---------------+--------+--------+--------- RxCan2[3a0] Avg| 15.60| 0.2548| 0.015 Peak| | 0.2890| 0.976 ---------------+--------+--------+--------- RxCan2[3d0] Avg| 9.35| 0.1553| 0.019 Peak| | 0.1612| 1.115 ---------------+--------+--------+--------- RxCan2[3d5] Avg| 5.15| 0.0836| 0.016 Peak| | 0.0867| 0.479 ---------------+--------+--------+--------- RxCan2[3e0] Avg| 0.00| 0.0000| 0.014 Peak| | 0.0000| 0.142 ---------------+--------+--------+--------- RxCan2[400] Avg| 3.55| 0.0613| 0.017 Peak| | 0.0695| 0.501 ---------------+--------+--------+--------- RxCan2[405] Avg| 3.50| 0.0584| 0.018 Peak| | 0.0626| 0.686 ---------------+--------+--------+--------- RxCan2[40a] Avg| 7.10| 0.1278| 0.017 Peak| | 0.1389| 1.244 ---------------+--------+--------+--------- RxCan2[415] Avg| 1.60| 0.0258| 0.014 Peak| | 0.0287| 0.266 ---------------+--------+--------+--------- RxCan2[435] Avg| 0.85| 0.0165| 0.019 Peak| | 0.0167| 0.367 ---------------+--------+--------+--------- RxCan2[440] Avg| 0.85| 0.0128| 0.019 Peak| | 0.0141| 0.885 ---------------+--------+--------+--------- RxCan2[465] Avg| 0.95| 0.0177| 0.016 Peak| | 0.0195| 0.721 ---------------+--------+--------+--------- RxCan2[466] Avg| 0.95| 0.0147| 0.014 Peak| | 0.0160| 0.184 ---------------+--------+--------+--------- RxCan2[467] Avg| 0.95| 0.0172| 0.017 Peak| | 0.0188| 0.391 ---------------+--------+--------+--------- RxCan2[501] Avg| 1.45| 0.0273| 0.016 Peak| | 0.0327| 0.996 ---------------+--------+--------+--------- RxCan2[503] Avg| 1.45| 0.0288| 0.020 Peak| | 0.0338| 0.970 ---------------+--------+--------+--------- RxCan2[504] Avg| 1.40| 0.0241| 0.015 Peak| | 0.0263| 0.609 ---------------+--------+--------+--------- RxCan2[505] Avg| 1.40| 0.0255| 0.015 Peak| | 0.0296| 0.866 ---------------+--------+--------+--------- RxCan2[508] Avg| 1.35| 0.0237| 0.017 Peak| | 0.0237| 0.384 ---------------+--------+--------+--------- RxCan2[511] Avg| 1.35| 0.0226| 0.016 Peak| | 0.0228| 0.426 ---------------+--------+--------+--------- RxCan2[51e] Avg| 1.40| 0.0221| 0.014 Peak| | 0.0245| 0.211 ---------------+--------+--------+--------- RxCan2[581] Avg| 0.80| 0.0189| 0.019 Peak| | 0.0290| 1.217 ---------------+--------+--------+--------- RxCan2[606] Avg| 0.00| 0.0000| 0.014 Peak| | 0.0000| 0.142 ---------------+--------+--------+--------- RxCan2[657] Avg| 0.00| 0.0000| 0.014 Peak| | 0.0000| 0.137 ---------------+--------+--------+--------- Cmd:State Avg| 0.00| 0.0000| 0.002 Peak| | 0.0000| 0.024 ===============+========+========+========= Total Avg| 2748.42| 58.3344| 28.718
@Simon: it would be an option to try commenting out the overflow counting, to see if that's causing the issue.
I have commented out the line with the Atomic_Increment statement. Now I no longer receive any messages with “RX Task Queue Overflow Run” Here is the output of poller times status:
OVMS# poll time status Poller timing is: on Type | count | Utlztn | Time | per s | [%] | [ms] ---------------+--------+--------+--------- Poll:PRI Avg| 1.00| 0.0045| 0.004 Peak| | 0.0046| 0.064 ---------------+--------+--------+--------- RxCan1[010] Avg| 34.26| 2.2574| 0.021 Peak| | 2.2574| 4.609 ---------------+--------+--------+--------- RxCan1[030] Avg| 34.26| 2.3820| 0.021 Peak| | 2.3820| 1.135 ---------------+--------+--------+--------- RxCan1[041] Avg| 49.89| 1.2059| 0.021 Peak| | 1.2295| 5.331 ---------------+--------+--------+--------- RxCan1[049] Avg| 49.96| 1.2400| 0.030 Peak| | 1.2699| 1.402 ---------------+--------+--------+--------- RxCan1[04c] Avg| 49.92| 1.1752| 0.021 Peak| | 1.2072| 4.502 ---------------+--------+--------+--------- RxCan1[04d] Avg| 34.31| 2.4433| 0.022 Peak| | 2.4773| 1.368 ---------------+--------+--------+--------- RxCan1[076] Avg| 49.96| 1.2071| 0.024 Peak| | 1.2554| 2.007 ---------------+--------+--------+--------- RxCan1[077] Avg| 49.96| 1.2012| 0.022 Peak| | 1.2492| 1.955 ---------------+--------+--------+--------- RxCan1[07a] Avg| 34.35| 2.9251| 0.030 Peak| | 3.1103| 1.829 ---------------+--------+--------+--------- RxCan1[07d] Avg| 49.96| 1.1954| 0.022 Peak| | 1.2282| 1.074 ---------------+--------+--------+--------- RxCan1[0c8] Avg| 49.89| 1.2491| 0.021 Peak| | 1.3169| 1.181 ---------------+--------+--------+--------- RxCan1[11a] Avg| 34.39| 2.4423| 0.024 Peak| | 2.5693| 1.491 ---------------+--------+--------+--------- RxCan1[130] Avg| 49.95| 1.1312| 0.020 Peak| | 1.1684| 1.218 ---------------+--------+--------+--------- RxCan1[139] Avg| 49.92| 1.1547| 0.021 Peak| | 1.1778| 1.199 ---------------+--------+--------+--------- RxCan1[156] Avg| 9.96| 0.2391| 0.023 Peak| | 0.2591| 1.943 ---------------+--------+--------+--------- RxCan1[160] Avg| 49.96| 1.1657| 0.031 Peak| | 1.2017| 2.158 ---------------+--------+--------+--------- RxCan1[165] Avg| 49.96| 1.1257| 0.021 Peak| | 1.1652| 1.471 ---------------+--------+--------+--------- RxCan1[167] Avg| 34.31| 2.2871| 0.021 Peak| | 2.3374| 1.776 ---------------+--------+--------+--------- RxCan1[171] Avg| 49.96| 1.1879| 0.023 Peak| | 1.2268| 1.166 ---------------+--------+--------+--------- RxCan1[178] Avg| 10.00| 0.2371| 0.029 Peak| | 0.2459| 1.516 ---------------+--------+--------+--------- RxCan1[179] Avg| 10.00| 0.2196| 0.021 Peak| | 0.2260| 0.758 ---------------+--------+--------+--------- RxCan1[180] Avg| 49.96| 1.1703| 0.022 Peak| | 1.2103| 1.481 ---------------+--------+--------+--------- RxCan1[185] Avg| 49.95| 1.1127| 0.020 Peak| | 1.1636| 1.292 ---------------+--------+--------+--------- RxCan1[1a0] Avg| 49.96| 1.1009| 0.020 Peak| | 1.1468| 1.060 ---------------+--------+--------+--------- RxCan1[1e0] Avg| 49.96| 1.1744| 0.021 Peak| | 1.2027| 1.240 ---------------+--------+--------+--------- RxCan1[1e4] Avg| 49.96| 1.3733| 0.032 Peak| | 1.4085| 1.523 ---------------+--------+--------+--------- RxCan1[1f0] Avg| 33.30| 0.7625| 0.023 Peak| | 0.8004| 3.349 ---------------+--------+--------+--------- RxCan1[200] Avg| 49.92| 1.1462| 0.021 Peak| | 1.1809| 1.254 ---------------+--------+--------+--------- RxCan1[202] Avg| 34.39| 2.4034| 0.028 Peak| | 2.5611| 1.472 ---------------+--------+--------+--------- RxCan1[204] Avg| 34.30| 2.2541| 0.022 Peak| | 2.2924| 2.015 ---------------+--------+--------+--------- RxCan1[213] Avg| 49.96| 1.1599| 0.027 Peak| | 1.1794| 1.714 ---------------+--------+--------+--------- RxCan1[214] Avg| 49.96| 1.1537| 0.022 Peak| | 1.1941| 1.439 ---------------+--------+--------+--------- RxCan1[217] Avg| 34.39| 2.2490| 0.020 Peak| | 2.2856| 3.766 ---------------+--------+--------+--------- RxCan1[218] Avg| 49.96| 1.1291| 0.021 Peak| | 1.1646| 1.547 ---------------+--------+--------+--------- RxCan1[230] Avg| 49.96| 1.1272| 0.020 Peak| | 1.2237| 1.295 ---------------+--------+--------+--------- RxCan1[240] Avg| 10.00| 0.2191| 0.021 Peak| | 0.2226| 1.067 ---------------+--------+--------+--------- RxCan1[242] Avg| 24.96| 0.6911| 0.024 Peak| | 0.7161| 1.180 ---------------+--------+--------+--------- RxCan1[24a] Avg| 9.96| 0.2345| 0.024 Peak| | 0.2535| 0.779 ---------------+--------+--------+--------- RxCan1[24b] Avg| 9.96| 0.2433| 0.023 Peak| | 0.2697| 2.085 ---------------+--------+--------+--------- RxCan1[24c] Avg| 9.96| 0.3103| 0.029 Peak| | 0.3203| 0.809 ---------------+--------+--------+--------- RxCan1[25a] Avg| 10.00| 0.2346| 0.022 Peak| | 0.2405| 1.223 ---------------+--------+--------+--------- RxCan1[25b] Avg| 49.89| 1.2121| 0.020 Peak| | 1.3659| 19.523 ---------------+--------+--------+--------- RxCan1[25c] Avg| 34.31| 2.4193| 0.019 Peak| | 2.8022| 58.153 ---------------+--------+--------+--------- RxCan1[260] Avg| 9.93| 0.2149| 0.024 Peak| | 0.2174| 1.096 ---------------+--------+--------+--------- RxCan1[270] Avg| 49.96| 1.2042| 0.026 Peak| | 1.2755| 20.612 ---------------+--------+--------+--------- RxCan1[280] Avg| 49.96| 1.0922| 0.020 Peak| | 1.1312| 1.266 ---------------+--------+--------+--------- RxCan1[2e4] Avg| 19.96| 0.6942| 0.044 Peak| | 0.8604| 1.533 ---------------+--------+--------+--------- RxCan1[2ec] Avg| 10.00| 0.3727| 0.025 Peak| | 0.5154| 28.819 ---------------+--------+--------+--------- RxCan1[2ed] Avg| 10.00| 0.2298| 0.023 Peak| | 0.2378| 1.345 ---------------+--------+--------+--------- RxCan1[2ee] Avg| 9.96| 0.2172| 0.019 Peak| | 0.2210| 1.058 ---------------+--------+--------+--------- RxCan1[312] Avg| 10.00| 0.2206| 0.020 Peak| | 0.2396| 1.060 ---------------+--------+--------+--------- RxCan1[326] Avg| 9.96| 0.2099| 0.020 Peak| | 0.2158| 0.507 ---------------+--------+--------+--------- RxCan1[336] Avg| 1.00| 0.0212| 0.020 Peak| | 0.0233| 0.315 ---------------+--------+--------+--------- RxCan1[352] Avg| 6.64| 0.1675| 0.024 Peak| | 0.1818| 1.048 ---------------+--------+--------+--------- RxCan1[355] Avg| 2.00| 0.0540| 0.027 Peak| | 0.0619| 1.209 ---------------+--------+--------+--------- RxCan1[35e] Avg| 9.98| 0.2221| 0.021 Peak| | 0.2284| 1.186 ---------------+--------+--------+--------- RxCan1[365] Avg| 10.00| 0.2282| 0.023 Peak| | 0.2335| 0.769 ---------------+--------+--------+--------- RxCan1[366] Avg| 10.00| 0.3163| 0.022 Peak| | 0.6330| 23.587 ---------------+--------+--------+--------- RxCan1[367] Avg| 10.00| 0.2417| 0.021 Peak| | 0.2568| 1.417 ---------------+--------+--------+--------- RxCan1[368] Avg| 9.96| 0.2187| 0.019 Peak| | 0.2250| 1.135 ---------------+--------+--------+--------- RxCan1[369] Avg| 9.99| 0.2277| 0.021 Peak| | 0.2334| 0.667 ---------------+--------+--------+--------- RxCan1[380] Avg| 9.96| 0.2133| 0.020 Peak| | 0.2161| 0.560 ---------------+--------+--------+--------- RxCan1[38b] Avg| 24.92| 0.5622| 0.022 Peak| | 0.5716| 1.618 ---------------+--------+--------+--------- RxCan1[3b3] Avg| 10.00| 0.2132| 0.023 Peak| | 0.2194| 1.106 ---------------+--------+--------+--------- RxCan1[400] Avg| 4.00| 0.0885| 0.019 Peak| | 0.0885| 0.570 ---------------+--------+--------+--------- RxCan1[405] Avg| 3.70| 0.1414| 0.036 Peak| | 0.1414| 0.710 ---------------+--------+--------+--------- RxCan1[40a] Avg| 8.00| 0.1887| 0.021 Peak| | 0.1887| 1.027 ---------------+--------+--------+--------- RxCan1[410] Avg| 10.00| 0.2141| 0.023 Peak| | 0.2188| 0.984 ---------------+--------+--------+--------- RxCan1[411] Avg| 10.00| 0.2325| 0.023 Peak| | 0.2447| 0.660 ---------------+--------+--------+--------- RxCan1[416] Avg| 10.00| 0.2326| 0.022 Peak| | 0.2389| 0.774 ---------------+--------+--------+--------- RxCan1[421] Avg| 10.00| 0.2245| 0.021 Peak| | 0.2271| 1.160 ---------------+--------+--------+--------- RxCan1[42d] Avg| 10.00| 0.2315| 0.021 Peak| | 0.2411| 0.677 ---------------+--------+--------+--------- RxCan1[42f] Avg| 10.00| 0.2480| 0.020 Peak| | 0.2975| 8.093 ---------------+--------+--------+--------- RxCan1[430] Avg| 10.00| 0.2203| 0.019 Peak| | 0.2302| 0.847 ---------------+--------+--------+--------- RxCan1[434] Avg| 10.00| 0.2331| 0.019 Peak| | 0.2620| 1.150 ---------------+--------+--------+--------- RxCan1[435] Avg| 6.68| 0.1445| 0.020 Peak| | 0.1486| 1.063 ---------------+--------+--------+--------- RxCan1[43e] Avg| 20.00| 0.4515| 0.021 Peak| | 0.4632| 1.013 ---------------+--------+--------+--------- RxCan1[440] Avg| 1.00| 0.0210| 0.019 Peak| | 0.0218| 0.294 ---------------+--------+--------+--------- RxCan1[465] Avg| 0.95| 0.0214| 0.023 Peak| | 0.0215| 0.587 ---------------+--------+--------+--------- RxCan1[466] Avg| 0.95| 0.0211| 0.021 Peak| | 0.0215| 0.350 ---------------+--------+--------+--------- RxCan1[467] Avg| 0.95| 0.0191| 0.020 Peak| | 0.0201| 0.444 ---------------+--------+--------+--------- RxCan1[472] Avg| 0.68| 0.0588| 0.085 Peak| | 0.0606| 1.170 ---------------+--------+--------+--------- RxCan1[473] Avg| 0.66| 0.0407| 0.062 Peak| | 0.0492| 1.329 ---------------+--------+--------+--------- RxCan1[474] Avg| 1.00| 0.0218| 0.021 Peak| | 0.0237| 0.278 ---------------+--------+--------+--------- RxCan1[475] Avg| 1.96| 0.0466| 0.024 Peak| | 0.0570| 1.112 ---------------+--------+--------+--------- RxCan1[476] Avg| 2.00| 0.0454| 0.020 Peak| | 0.0497| 0.409 ---------------+--------+--------+--------- RxCan1[477] Avg| 2.00| 0.0497| 0.022 Peak| | 0.0595| 0.864 ---------------+--------+--------+--------- RxCan1[595] Avg| 1.00| 0.0223| 0.021 Peak| | 0.0241| 0.296 ---------------+--------+--------+--------- RxCan1[59e] Avg| 1.00| 0.0233| 0.024 Peak| | 0.0289| 0.713 ---------------+--------+--------+--------- RxCan1[5a2] Avg| 1.00| 0.0200| 0.020 Peak| | 0.0204| 0.264 ---------------+--------+--------+--------- RxCan1[5ba] Avg| 1.00| 0.0206| 0.021 Peak| | 0.0238| 0.515 ---------------+--------+--------+--------- RxCan2[020] Avg| 33.30| 0.7938| 0.022 Peak| | 0.7938| 4.793 ---------------+--------+--------+--------- RxCan2[030] Avg| 22.20| 0.5229| 0.022 Peak| | 0.5229| 0.985 ---------------+--------+--------+--------- RxCan2[03a] Avg| 19.90| 0.4700| 0.022 Peak| | 0.4700| 0.804 ---------------+--------+--------+--------- RxCan2[040] Avg| 19.90| 0.4678| 0.023 Peak| | 0.4678| 1.222 ---------------+--------+--------+--------- RxCan2[060] Avg| 20.00| 0.6480| 0.050 Peak| | 0.6480| 20.997 ---------------+--------+--------+--------- RxCan2[070] Avg| 16.60| 0.3944| 0.022 Peak| | 0.3944| 1.053 ---------------+--------+--------+--------- RxCan2[080] Avg| 16.70| 0.7032| 0.041 Peak| | 0.7032| 1.611 ---------------+--------+--------+--------- RxCan2[083] Avg| 20.10| 0.4329| 0.021 Peak| | 0.4329| 0.520 ---------------+--------+--------+--------- RxCan2[090] Avg| 24.90| 0.5674| 0.017 Peak| | 0.5674| 1.149 ---------------+--------+--------+--------- RxCan2[0a0] Avg| 16.60| 0.3836| 0.023 Peak| | 0.3836| 0.933 ---------------+--------+--------+--------- RxCan2[100] Avg| 16.50| 0.3661| 0.021 Peak| | 0.3661| 0.740 ---------------+--------+--------+--------- RxCan2[108] Avg| 24.90| 0.5923| 0.025 Peak| | 0.5923| 0.859 ---------------+--------+--------+--------- RxCan2[110] Avg| 16.70| 0.3906| 0.023 Peak| | 0.3906| 0.697 ---------------+--------+--------+--------- RxCan2[130] Avg| 14.40| 0.3341| 0.022 Peak| | 0.3341| 0.829 ---------------+--------+--------+--------- RxCan2[150] Avg| 16.50| 0.4025| 0.020 Peak| | 0.4025| 1.120 ---------------+--------+--------+--------- RxCan2[160] Avg| 4.90| 0.1252| 0.025 Peak| | 0.1252| 0.502 ---------------+--------+--------+--------- RxCan2[180] Avg| 16.60| 0.3899| 0.023 Peak| | 0.3899| 0.799 ---------------+--------+--------+--------- RxCan2[190] Avg| 16.60| 0.3892| 0.025 Peak| | 0.3892| 1.172 ---------------+--------+--------+--------- RxCan2[1a0] Avg| 1.00| 0.0281| 0.025 Peak| | 0.0281| 0.695 ---------------+--------+--------+--------- RxCan2[1a4] Avg| 20.00| 0.4525| 0.022 Peak| | 0.4525| 1.231 ---------------+--------+--------+--------- RxCan2[1a8] Avg| 12.50| 0.2886| 0.020 Peak| | 0.2886| 1.048 ---------------+--------+--------+--------- RxCan2[1b0] Avg| 10.00| 0.2300| 0.023 Peak| | 0.2300| 0.579 ---------------+--------+--------+--------- RxCan2[1b4] Avg| 10.00| 0.2334| 0.022 Peak| | 0.2334| 0.947 ---------------+--------+--------+--------- RxCan2[1b8] Avg| 12.40| 0.2970| 0.023 Peak| | 0.2970| 0.909 ---------------+--------+--------+--------- RxCan2[1c0] Avg| 10.00| 0.2257| 0.021 Peak| | 0.2257| 0.983 ---------------+--------+--------+--------- RxCan2[1e0] Avg| 10.00| 0.2141| 0.023 Peak| | 0.2141| 0.556 ---------------+--------+--------+--------- RxCan2[215] Avg| 8.30| 0.2047| 0.025 Peak| | 0.2047| 0.786 ---------------+--------+--------+--------- RxCan2[217] Avg| 8.30| 0.2033| 0.022 Peak| | 0.2033| 1.135 ---------------+--------+--------+--------- RxCan2[220] Avg| 6.70| 0.1647| 0.020 Peak| | 0.1647| 0.961 ---------------+--------+--------+--------- RxCan2[225] Avg| 24.90| 0.6136| 0.026 Peak| | 0.6136| 1.018 ---------------+--------+--------+--------- RxCan2[230] Avg| 6.70| 0.4045| 0.057 Peak| | 0.4045| 1.532 ---------------+--------+--------+--------- RxCan2[240] Avg| 8.20| 0.1849| 0.021 Peak| | 0.1849| 0.510 ---------------+--------+--------+--------- RxCan2[241] Avg| 20.00| 0.4312| 0.021 Peak| | 0.4312| 5.110 ---------------+--------+--------+--------- RxCan2[250] Avg| 5.00| 0.1072| 0.021 Peak| | 0.1072| 0.320 ---------------+--------+--------+--------- RxCan2[255] Avg| 12.50| 0.3091| 0.022 Peak| | 0.3091| 0.904 ---------------+--------+--------+--------- RxCan2[265] Avg| 12.50| 0.2819| 0.021 Peak| | 0.2819| 1.035 ---------------+--------+--------+--------- RxCan2[270] Avg| 5.00| 0.1189| 0.022 Peak| | 0.1189| 0.631 ---------------+--------+--------+--------- RxCan2[290] Avg| 3.30| 0.0740| 0.023 Peak| | 0.0740| 0.455 ---------------+--------+--------+--------- RxCan2[295] Avg| 6.60| 0.1431| 0.023 Peak| | 0.1431| 0.504 ---------------+--------+--------+--------- RxCan2[2a0] Avg| 3.30| 0.0686| 0.020 Peak| | 0.0686| 0.445 ---------------+--------+--------+--------- RxCan2[2a7] Avg| 12.50| 0.2869| 0.021 Peak| | 0.2869| 0.660 ---------------+--------+--------+--------- RxCan2[2b0] Avg| 3.20| 0.0707| 0.023 Peak| | 0.0707| 0.331 ---------------+--------+--------+--------- RxCan2[2c0] Avg| 3.20| 0.0988| 0.026 Peak| | 0.0988| 0.932 ---------------+--------+--------+--------- RxCan2[2e0] Avg| 1.60| 0.0388| 0.024 Peak| | 0.0388| 0.393 ---------------+--------+--------+--------- RxCan2[2f0] Avg| 1.70| 0.0376| 0.021 Peak| | 0.0376| 0.282 ---------------+--------+--------+--------- RxCan2[2f5] Avg| 12.50| 0.2833| 0.021 Peak| | 0.2833| 0.855 ---------------+--------+--------+--------- RxCan2[300] Avg| 1.70| 0.0398| 0.023 Peak| | 0.0398| 0.488 ---------------+--------+--------+--------- RxCan2[310] Avg| 1.60| 0.0480| 0.026 Peak| | 0.0480| 0.937 ---------------+--------+--------+--------- RxCan2[320] Avg| 1.70| 0.0346| 0.020 Peak| | 0.0346| 0.370 ---------------+--------+--------+--------- RxCan2[326] Avg| 9.90| 0.2200| 0.022 Peak| | 0.2200| 0.502 ---------------+--------+--------+--------- RxCan2[330] Avg| 32.30| 0.7323| 0.021 Peak| | 0.7323| 1.130 ---------------+--------+--------+--------- RxCan2[340] Avg| 8.20| 0.2375| 0.028 Peak| | 0.2375| 0.578 ---------------+--------+--------+--------- RxCan2[345] Avg| 1.60| 0.0393| 0.022 Peak| | 0.0393| 0.590 ---------------+--------+--------+--------- RxCan2[35e] Avg| 5.00| 0.1303| 0.023 Peak| | 0.1303| 0.943 ---------------+--------+--------+--------- RxCan2[360] Avg| 1.70| 0.0381| 0.025 Peak| | 0.0381| 0.922 ---------------+--------+--------+--------- RxCan2[361] Avg| 8.20| 0.1907| 0.023 Peak| | 0.1907| 1.119 ---------------+--------+--------+--------- RxCan2[363] Avg| 1.30| 0.0337| 0.024 Peak| | 0.0337| 0.425 ---------------+--------+--------+--------- RxCan2[370] Avg| 0.90| 0.0194| 0.022 Peak| | 0.0194| 0.246 ---------------+--------+--------+--------- RxCan2[381] Avg| 3.20| 0.0684| 0.024 Peak| | 0.0684| 0.828 ---------------+--------+--------+--------- RxCan2[3a0] Avg| 16.60| 0.3734| 0.022 Peak| | 0.3734| 0.636 ---------------+--------+--------+--------- RxCan2[3d0] Avg| 10.00| 0.2262| 0.023 Peak| | 0.2262| 0.663 ---------------+--------+--------+--------- RxCan2[3d5] Avg| 5.60| 0.1335| 0.022 Peak| | 0.1335| 1.222 ---------------+--------+--------+--------- RxCan2[400] Avg| 4.00| 0.0949| 0.022 Peak| | 0.0949| 0.715 ---------------+--------+--------+--------- RxCan2[405] Avg| 3.70| 0.0861| 0.022 Peak| | 0.0861| 0.443 ---------------+--------+--------+--------- RxCan2[40a] Avg| 8.00| 0.1853| 0.021 Peak| | 0.1853| 0.552 ---------------+--------+--------+--------- RxCan2[415] Avg| 1.60| 0.0341| 0.021 Peak| | 0.0341| 0.273 ---------------+--------+--------+--------- RxCan2[435] Avg| 0.90| 0.0220| 0.025 Peak| | 0.0220| 0.354 ---------------+--------+--------+--------- RxCan2[440] Avg| 0.90| 0.0199| 0.021 Peak| | 0.0199| 0.266 ---------------+--------+--------+--------- RxCan2[465] Avg| 0.90| 0.0234| 0.028 Peak| | 0.0234| 0.633 ---------------+--------+--------+--------- RxCan2[466] Avg| 1.00| 0.0222| 0.021 Peak| | 0.0222| 0.322 ---------------+--------+--------+--------- RxCan2[467] Avg| 1.00| 0.0221| 0.020 Peak| | 0.0221| 0.355 ---------------+--------+--------+--------- RxCan2[501] Avg| 1.50| 0.0335| 0.023 Peak| | 0.0335| 0.393 ---------------+--------+--------+--------- RxCan2[503] Avg| 1.50| 0.0370| 0.022 Peak| | 0.0370| 0.546 ---------------+--------+--------+--------- RxCan2[504] Avg| 1.40| 0.0328| 0.022 Peak| | 0.0328| 0.489 ---------------+--------+--------+--------- RxCan2[505] Avg| 1.40| 0.0290| 0.021 Peak| | 0.0290| 0.354 ---------------+--------+--------+--------- RxCan2[508] Avg| 1.40| 0.0318| 0.023 Peak| | 0.0318| 0.408 ---------------+--------+--------+--------- RxCan2[511] Avg| 1.40| 0.0306| 0.022 Peak| | 0.0306| 0.328 ---------------+--------+--------+--------- RxCan2[51e] Avg| 1.40| 0.0310| 0.022 Peak| | 0.0310| 0.269 ---------------+--------+--------+--------- RxCan2[581] Avg| 1.00| 0.0222| 0.022 Peak| | 0.0222| 0.256 ---------------+--------+--------+--------- Cmd:State Avg| 0.00| 0.0000| 0.002 Peak| | 0.0000| 0.024 ===============+========+========+========= Total Avg| 2795.57| 82.7745| 40.174
Cheers, Simon
Am 17.01.2025 um 17:49 schrieb Michael Balzer via OvmsDev:
OK, I've got a new idea: CAN timing.
Comparing our esp32can bit timing to the esp-idf driver's, there seem to be some differences: https://github.com/espressif/esp-idf/blob/master/components/hal/include/hal/...
Transceivers are normally tolerant to small timing offsets. Maybe being off a little bit has no effect under normal conditions, but it has when the transceiver has to cope with a filled RX queue. That could be causing the transceiver to slide just out of sync. If the timing gets garbled, the transceiver would signal errors in the packets to the bus, possibly so many the vehicle ECUs decide to raise an error condition.
Is that plausible?
On why the new poller could be causing this (in combination with too slow processing by the vehicle): as mentioned, the standard CAN listener mechanism doesn't care about queue overflows. The poller does. `OvmsPollers::Queue_PollerFrame()` does a log call when Tx/Rx tracing is enabled, that could even block, but tracing is optional and only meant for debugging. Not optional is the overflow counting using an atomic uint32.
The atomic types are said to be fast, but I never checked their actual implementation on the ESP32. Maybe they can block as well?
@Simon: it would be an option to try commenting out the overflow counting, to see if that's causing the issue.
Regards, Michael
Am 17.01.25 um 15:37 schrieb Chris Box via OvmsDev:
Yes, I can confirm I've had one experience of the Leaf switching to Neutral while driving, with a yellow warning symbol on the dash. It refused to reselect Drive until I had switched the car off and back on. Derek wasn't so lucky and he need to clear fault codes before the car would work.
On returning home, I found OVMS was not accessible over a network. I didn't try a USB cable. Unplugging and reinserting the OBD cable caused OVMS to rejoin Wi-Fi. However the SD logs showed nothing from the time of the event. CAN writes are enabled, so it can perform SOC limiting.
My car has been using this firmware since 21st November, based on the git master of that day. As a relatively new user of OVMS (only since October) I don't have much experience of older firmware.
Perhaps a safeguard should be implemented before releasing a new stable firmware that will be automatically downloaded by Leaf owners. But I don't have the expertise to know what that safeguard should be. Derek's suggestion of 'only CAN write when parked' appears to be a good idea.
Chris
On 2025-01-15 18:18, Derek Caudwell via OvmsDev wrote:
Since the following email I have high confidence the issue on the Leaf is related/caused by the poller as there has been no further occurrence and Chris has also experienced the car going to neutral on the new poller firmware.
.... I haven't ruled out it being a fault with my car yet. Shortly after it faulted the car was run into so has been off the road for sometime, my first step was to replace 12V battery. The ovms unit is now unplugged and if it does not fault over the next month while driving I'll be reasonably confident it's ovms related. Not sure which firmware version the poller updates were included in but it was only after upgrading to it that the errors occurred (which could be coincidental however it has faulted twice more both on version 3.3.004-141-gf729d82c). For periods where I reverted to 3.3.003 it was fine. It might be useful to have an extra option on the enable can write to only enable it when the car is parked/charging.
_______________________________________________ OvmsDev mailing list OvmsDev@lists.openvehicles.com http://lists.openvehicles.com/mailman/listinfo/ovmsdev
-- Michael Balzer * Am Rahmen 5 * D-58313 Herdecke Fon 02330 9104094 * Handy 0176 20698926
_______________________________________________ OvmsDev mailing list OvmsDev@lists.openvehicles.com http://lists.openvehicles.com/mailman/listinfo/ovmsdev
_______________________________________________ OvmsDev mailing list OvmsDev@lists.openvehicles.com http://lists.openvehicles.com/mailman/listinfo/ovmsdev
-- Michael Balzer * Am Rahmen 5 * D-58313 Herdecke Fon 02330 9104094 * Handy 0176 20698926
So I have realised there's no mutex on the timer which is not great. The main problem is in LoadTimesTrace() for reporting. I have a solution on hand.. keeping the lock to an absolute minimum for the LoadTimesTrace(). (lock, copy, then unlock and work on the copy). I wonder if skipping just the tracing of those control Rx frame types is going to cost more than it saves. The timer starts even before we know which control signal we are decoding and then it's all integer operations, a std::map lookup (integers only) and an integer smoothing. I guess I could check for that one message type and then filter the frame.. however if those frames are not going to be examined - we would be better off skipping the queueing of them and keep it simple. If we do something like this: void OvmsPollers::PollerRxCallback(const CAN_frame_t* frame, bool success) { { OvmsMutexLock lock(&m_filter_mutex, 0); // Don't block! (ever) // If not locked, just let it through. if (lock.IsLocked() && !m_filter.IsFiltered(frame)) return; } Queue_PollerFrame(*frame, success, false); } and blocking-mutex the calls to change the filtering... then the worst that happens is that a few frames get through while we are modifying the filtering. //.ichael On Sat, 18 Jan 2025 at 17:08, Michael Balzer via OvmsDev < ovmsdev@lists.openvehicles.com> wrote:
I have commented out the line with the Atomic_Increment statement. Now I no longer receive any messages with “RX Task Queue Overflow Run” Here is the output of poller times status:
The main question is if you still get the CAN bus crash (vehicle running into issues) with that modification in active mode. Timing statistics were not expected to change.
Nearly 2800 frames per second is quite a lot, and most is on can1 with many frame periods at 20 ms. Yet the total processing time averages at 30-40 ms, so there is no actual CPU capacity issue for that amount of frames.
@Derek: can you please supply these statistics for the Leaf in drive mode as well?
Am 18.01.25 um 02:42 schrieb Michael Geddes via OvmsDev:
Maybe try setting CONFIG_OVMS_VEHICLE_CAN_RX_QUEUE_SIZE = 160 and see if that reduces the overflow?
Simons car sends at least 91 process data frame IDs on can1 and 84 on can2. Worst case would be these come all in within the shortest possible time span, that would mean the queue needs to be able to hold 175 frames. I'd add some headroom and round up to 200.
But keep in mind, if the Incoming processing actually occasionally gets blocked for up to 60 ms -- as indicated by Simons statistics --, the queue may need to be twice as large.
Am 18.01.25 um 02:42 schrieb Michael Geddes via OvmsDev:
I was thinking that the frame filter would be here: void OvmsPollers::PollerRxCallback(const CAN_frame_t* frame, bool success) { Queue_PollerFrame(*frame, success, false); } which I guess is executed in the task handling the CAN queue. (we don't know how many frames get dropped there).
Actually we do know that, or at least have some indication, as we count the CAN transceiver queue overruns. That info is included as "Rx overflw" in the can status output & as "rxovr" in the logs.
Adding a filter before queueing the frame would exclude the filtered IDs from all vehicle processing. I meant adding a filter just to exclude IDs from the timing statistics, assuming those are the culprits, as Simon wrote the issue only appears after enabling the timing statistics and printing them. That's why I asked if printing might need to lock the statistics for too long in case of such a long list.
Completely blocking ID ranges from processing by the vehicle should normally not be necessary, unless the Incoming handler is written very poorly.
Yet, if we add that, a mutex in the CAN RX callback must be avoided, or would need to be non-blocking:
The only real concern is thread safety between checking and adding to the filter - so the check itself might have to be mutexed. void OvmsPollers::PollerRxCallback(const CAN_frame_t* frame, bool success) { // Check filter { OvmsRecMutexLock lock(&m_filter_mutex); if (! m_filter->IsFiltered(frame)) return; } Queue_PollerFrame(*frame, success, false); }
A mutex like that could block the CAN task, which must be avoided at all cost. I introduced CAN callbacks for vehicles & applications that need to react to certain frames as fast as possible, e.g. to maintain control precedence, so cannot use the standard CAN listener mechanism (frame queueing).
The current poller callback use is OK, if (!) the atomic type really isn't the culprit, ie doesn't block.
So if (!) an ID filter needs to be added before queueing, it needs to be done in a way that needs no mutex. But I don't see an issue with the vehicle passing a fixed filter when registering with the poller/buses. The filter doesn't need to by mutable on the fly.
Regards, Michael
Am 17.01.25 um 19:42 schrieb Simon Ehlen via OvmsDev:
The poller statistics can help you track this down, but you need to have at least 10 seconds of statistics, the more the better. Rule of thumb: PRI average at 0.0/second means you don't have enough data yet.
There were again many messages with “RX Task Queue Overflow Run”. Here are the statistics of poller times status:
OVMS# poll times status Poller timing is: on Type | count | Utlztn | Time | per s | [%] | [ms] ---------------+--------+--------+--------- Poll:PRI Avg| 1.00| 0.0043| 0.004 Peak| | 0.0043| 0.052 ---------------+--------+--------+--------- RxCan1[010] Avg| 34.26| 1.6741| 0.015 Peak| | 1.6741| 1.182 ---------------+--------+--------+--------- RxCan1[030] Avg| 34.06| 1.7085| 0.020 Peak| | 1.7085| 1.390 ---------------+--------+--------+--------- RxCan1[041] Avg| 49.89| 0.8109| 0.016 Peak| | 0.8541| 1.098 ---------------+--------+--------+--------- RxCan1[049] Avg| 50.00| 1.5970| 0.019 Peak| | 1.7154| 32.233 ---------------+--------+--------+--------- RxCan1[04c] Avg| 49.92| 0.8340| 0.014 Peak| | 0.8933| 1.995 ---------------+--------+--------+--------- RxCan1[04d] Avg| 34.43| 1.6211| 0.014 Peak| | 1.6756| 1.318 ---------------+--------+--------+--------- RxCan1[076] Avg| 50.00| 0.8362| 0.024 Peak| | 0.8784| 2.185 ---------------+--------+--------+--------- RxCan1[077] Avg| 50.00| 0.7837| 0.014 Peak| | 0.8083| 1.156 ---------------+--------+--------+--------- RxCan1[07a] Avg| 34.31| 2.1870| 0.017 Peak| | 2.3252| 1.888 ---------------+--------+--------+--------- RxCan1[07d] Avg| 50.00| 0.8001| 0.013 Peak| | 0.8434| 1.150 ---------------+--------+--------+--------- RxCan1[0c8] Avg| 49.96| 0.8359| 0.013 Peak| | 0.8715| 1.171 ---------------+--------+--------+--------- RxCan1[11a] Avg| 34.35| 1.6701| 0.020 Peak| | 1.6981| 1.273 ---------------+--------+--------+--------- RxCan1[130] Avg| 50.00| 0.7902| 0.018 Peak| | 0.8513| 0.980 ---------------+--------+--------+--------- RxCan1[139] Avg| 49.92| 0.7872| 0.013 Peak| | 0.8219| 0.795 ---------------+--------+--------+--------- RxCan1[156] Avg| 10.00| 0.1620| 0.014 Peak| | 0.1729| 0.919 ---------------+--------+--------+--------- RxCan1[160] Avg| 50.04| 0.7977| 0.014 Peak| | 0.8232| 1.495 ---------------+--------+--------+--------- RxCan1[165] Avg| 49.85| 0.7976| 0.014 Peak| | 0.8486| 1.015 ---------------+--------+--------+--------- RxCan1[167] Avg| 34.39| 1.6025| 0.016 Peak| | 1.6888| 1.354 ---------------+--------+--------+--------- RxCan1[171] Avg| 50.00| 0.8150| 0.017 Peak| | 0.8488| 1.091 ---------------+--------+--------+--------- RxCan1[178] Avg| 10.00| 0.1614| 0.014 Peak| | 0.1702| 0.903 ---------------+--------+--------+--------- RxCan1[179] Avg| 10.00| 0.1630| 0.017 Peak| | 0.1663| 1.336 ---------------+--------+--------+--------- RxCan1[180] Avg| 50.00| 0.8137| 0.014 Peak| | 0.8605| 1.566 ---------------+--------+--------+--------- RxCan1[185] Avg| 50.04| 0.8033| 0.013 Peak| | 0.8393| 1.126 ---------------+--------+--------+--------- RxCan1[1a0] Avg| 49.92| 0.7748| 0.013 Peak| | 0.8169| 1.184 ---------------+--------+--------+--------- RxCan1[1e0] Avg| 49.92| 0.7738| 0.014 Peak| | 0.8028| 1.049 ---------------+--------+--------+--------- RxCan1[1e4] Avg| 49.89| 0.9692| 0.018 Peak| | 1.0096| 1.332 ---------------+--------+--------+--------- RxCan1[1f0] Avg| 33.22| 0.5544| 0.014 Peak| | 0.5855| 0.848 ---------------+--------+--------+--------- RxCan1[200] Avg| 49.92| 0.7879| 0.015 Peak| | 0.8345| 1.206 ---------------+--------+--------+--------- RxCan1[202] Avg| 34.28| 1.7075| 0.016 Peak| | 1.7874| 1.218 ---------------+--------+--------+--------- RxCan1[204] Avg| 34.35| 1.5641| 0.013 Peak| | 1.6427| 1.235 ---------------+--------+--------+--------- RxCan1[213] Avg| 49.89| 0.7814| 0.015 Peak| | 0.8232| 0.910 ---------------+--------+--------+--------- RxCan1[214] Avg| 49.92| 0.7736| 0.014 Peak| | 0.8216| 0.800 ---------------+--------+--------+--------- RxCan1[217] Avg| 34.31| 1.6294| 0.014 Peak| | 1.7165| 1.153 ---------------+--------+--------+--------- RxCan1[218] Avg| 49.86| 0.7877| 0.013 Peak| | 0.8290| 1.068 ---------------+--------+--------+--------- RxCan1[230] Avg| 50.00| 0.7596| 0.014 Peak| | 0.7660| 1.021 ---------------+--------+--------+--------- RxCan1[240] Avg| 10.00| 0.1669| 0.013 Peak| | 0.1835| 0.887 ---------------+--------+--------+--------- RxCan1[242] Avg| 24.96| 0.4764| 0.020 Peak| | 0.4963| 1.501 ---------------+--------+--------+--------- RxCan1[24a] Avg| 9.89| 0.1789| 0.015 Peak| | 0.2009| 0.874 ---------------+--------+--------+--------- RxCan1[24b] Avg| 9.89| 0.1702| 0.014 Peak| | 0.1870| 1.195 ---------------+--------+--------+--------- RxCan1[24c] Avg| 9.89| 0.2146| 0.019 Peak| | 0.2187| 1.242 ---------------+--------+--------+--------- RxCan1[25a] Avg| 10.00| 0.1603| 0.013 Peak| | 0.1667| 0.720 ---------------+--------+--------+--------- RxCan1[25b] Avg| 49.94| 0.7918| 0.017 Peak| | 0.8454| 1.666 ---------------+--------+--------+--------- RxCan1[25c] Avg| 34.24| 1.5331| 0.013 Peak| | 1.5997| 1.538 ---------------+--------+--------+--------- RxCan1[260] Avg| 10.00| 0.1626| 0.014 Peak| | 0.1682| 0.718 ---------------+--------+--------+--------- RxCan1[270] Avg| 49.90| 0.8120| 0.014 Peak| | 0.8460| 1.671 ---------------+--------+--------+--------- RxCan1[280] Avg| 49.92| 0.7777| 0.019 Peak| | 0.8447| 1.157 ---------------+--------+--------+--------- RxCan1[2e4] Avg| 19.89| 0.5778| 0.032 Peak| | 0.6648| 2.226 ---------------+--------+--------+--------- RxCan1[2ec] Avg| 10.00| 0.1701| 0.014 Peak| | 0.1755| 0.928 ---------------+--------+--------+--------- RxCan1[2ed] Avg| 10.00| 0.1650| 0.013 Peak| | 0.1747| 0.917 ---------------+--------+--------+--------- RxCan1[2ee] Avg| 9.98| 0.1544| 0.013 Peak| | 0.1588| 1.312 ---------------+--------+--------+--------- RxCan1[312] Avg| 10.00| 0.1648| 0.017 Peak| | 0.1690| 0.922 ---------------+--------+--------+--------- RxCan1[326] Avg| 9.89| 0.1603| 0.015 Peak| | 0.1833| 1.230 ---------------+--------+--------+--------- RxCan1[336] Avg| 1.00| 0.0146| 0.015 Peak| | 0.0150| 0.349 ---------------+--------+--------+--------- RxCan1[352] Avg| 6.66| 0.1223| 0.022 Peak| | 0.1338| 1.015 ---------------+--------+--------+--------- RxCan1[355] Avg| 2.00| 0.0424| 0.019 Peak| | 0.0431| 0.786 ---------------+--------+--------+--------- RxCan1[35e] Avg| 9.96| 0.1570| 0.013 Peak| | 0.1644| 0.579 ---------------+--------+--------+--------- RxCan1[365] Avg| 10.00| 0.1600| 0.014 Peak| | 0.1653| 0.961 ---------------+--------+--------+--------- RxCan1[366] Avg| 10.00| 0.1716| 0.013 Peak| | 0.1890| 0.987 ---------------+--------+--------+--------- RxCan1[367] Avg| 9.93| 0.1793| 0.015 Peak| | 0.1864| 0.984 ---------------+--------+--------+--------- RxCan1[368] Avg| 10.00| 0.1645| 0.014 Peak| | 0.1778| 0.768 ---------------+--------+--------+--------- RxCan1[369] Avg| 10.00| 0.1562| 0.016 Peak| | 0.1606| 0.724 ---------------+--------+--------+--------- RxCan1[380] Avg| 10.00| 0.1619| 0.014 Peak| | 0.1644| 0.605 ---------------+--------+--------+--------- RxCan1[38b] Avg| 25.00| 0.3991| 0.016 Peak| | 0.4280| 1.448 ---------------+--------+--------+--------- RxCan1[3b3] Avg| 10.00| 0.1537| 0.013 Peak| | 0.1610| 0.380 ---------------+--------+--------+--------- RxCan1[400] Avg| 4.00| 0.0626| 0.014 Peak| | 0.0626| 0.251 ---------------+--------+--------+--------- RxCan1[405] Avg| 3.90| 0.1019| 0.028 Peak| | 0.1019| 0.781 ---------------+--------+--------+--------- RxCan1[40a] Avg| 7.90| 0.1256| 0.020 Peak| | 0.1256| 0.991 ---------------+--------+--------+--------- RxCan1[410] Avg| 10.00| 0.1643| 0.016 Peak| | 0.1839| 1.634 ---------------+--------+--------+--------- RxCan1[411] Avg| 10.00| 0.1532| 0.013 Peak| | 0.1645| 0.824 ---------------+--------+--------+--------- RxCan1[416] Avg| 10.00| 0.1516| 0.016 Peak| | 0.1582| 0.807 ---------------+--------+--------+--------- RxCan1[421] Avg| 10.00| 0.1648| 0.013 Peak| | 0.1740| 0.839 ---------------+--------+--------+--------- RxCan1[42d] Avg| 10.00| 0.1548| 0.014 Peak| | 0.1658| 0.741 ---------------+--------+--------+--------- RxCan1[42f] Avg| 10.00| 0.1527| 0.013 Peak| | 0.1578| 0.667 ---------------+--------+--------+--------- RxCan1[430] Avg| 10.00| 0.1730| 0.016 Peak| | 0.1880| 1.209 ---------------+--------+--------+--------- RxCan1[434] Avg| 10.00| 0.1620| 0.021 Peak| | 0.1712| 1.140 ---------------+--------+--------+--------- RxCan1[435] Avg| 6.66| 0.1104| 0.014 Peak| | 0.1121| 1.011 ---------------+--------+--------+--------- RxCan1[43e] Avg| 20.00| 0.3194| 0.013 Peak| | 0.3434| 1.212 ---------------+--------+--------+--------- RxCan1[440] Avg| 1.00| 0.0160| 0.014 Peak| | 0.0175| 0.315 ---------------+--------+--------+--------- RxCan1[465] Avg| 1.00| 0.0172| 0.015 Peak| | 0.0194| 0.404 ---------------+--------+--------+--------- RxCan1[466] Avg| 1.00| 0.0198| 0.015 Peak| | 0.0252| 0.890 ---------------+--------+--------+--------- RxCan1[467] Avg| 1.00| 0.0152| 0.014 Peak| | 0.0160| 0.217 ---------------+--------+--------+--------- RxCan1[472] Avg| 0.70| 0.0533| 0.075 Peak| | 0.0546| 0.990 ---------------+--------+--------+--------- RxCan1[473] Avg| 0.65| 0.0325| 0.051 Peak| | 0.0361| 0.774 ---------------+--------+--------+--------- RxCan1[474] Avg| 1.00| 0.0146| 0.014 Peak| | 0.0151| 0.189 ---------------+--------+--------+--------- RxCan1[475] Avg| 2.00| 0.0332| 0.015 Peak| | 0.0362| 0.513 ---------------+--------+--------+--------- RxCan1[476] Avg| 2.00| 0.0305| 0.014 Peak| | 0.0307| 0.249 ---------------+--------+--------+--------- RxCan1[477] Avg| 2.00| 0.0309| 0.014 Peak| | 0.0311| 0.438 ---------------+--------+--------+--------- RxCan1[595] Avg| 1.00| 0.0151| 0.014 Peak| | 0.0160| 0.230 ---------------+--------+--------+--------- RxCan1[59e] Avg| 1.00| 0.0179| 0.015 Peak| | 0.0209| 0.716 ---------------+--------+--------+--------- RxCan1[5a2] Avg| 1.00| 0.0154| 0.016 Peak| | 0.0184| 0.699 ---------------+--------+--------+--------- RxCan1[5ba] Avg| 1.00| 0.0159| 0.017 Peak| | 0.0174| 0.485 ---------------+--------+--------+--------- RxCan2[010] Avg| 0.00| 0.0000| 0.015 Peak| | 0.0000| 0.146 ---------------+--------+--------+--------- RxCan2[020] Avg| 31.10| 0.5159| 0.015 Peak| | 0.5730| 0.992 ---------------+--------+--------+--------- RxCan2[030] Avg| 20.70| 0.3506| 0.016 Peak| | 0.3956| 1.055 ---------------+--------+--------+--------- RxCan2[03a] Avg| 18.65| 0.3157| 0.014 Peak| | 0.3292| 0.702 ---------------+--------+--------+--------- RxCan2[040] Avg| 18.60| 0.3111| 0.015 Peak| | 0.3474| 0.953 ---------------+--------+--------+--------- RxCan2[060] Avg| 18.60| 0.3182| 0.014 Peak| | 0.3569| 0.694 ---------------+--------+--------+--------- RxCan2[070] Avg| 15.55| 0.4581| 0.017 Peak| | 0.6859| 39.212 ---------------+--------+--------+--------- RxCan2[080] Avg| 15.50| 0.5041| 0.029 Peak| | 0.5414| 1.555 ---------------+--------+--------+--------- RxCan2[083] Avg| 18.70| 0.3083| 0.014 Peak| | 0.3325| 0.557 ---------------+--------+--------+--------- RxCan2[090] Avg| 23.40| 0.3961| 0.014 Peak| | 0.4445| 1.218 ---------------+--------+--------+--------- RxCan2[0a0] Avg| 15.55| 0.2734| 0.014 Peak| | 0.3144| 1.062 ---------------+--------+--------+--------- RxCan2[100] Avg| 15.50| 0.2645| 0.016 Peak| | 0.2875| 1.021 ---------------+--------+--------+--------- RxCan2[108] Avg| 23.40| 0.4231| 0.016 Peak| | 0.4680| 1.297 ---------------+--------+--------+--------- RxCan2[110] Avg| 15.55| 0.2467| 0.014 Peak| | 0.2684| 0.475 ---------------+--------+--------+--------- RxCan2[130] Avg| 13.30| 0.2231| 0.014 Peak| | 0.2447| 0.512 ---------------+--------+--------+--------- RxCan2[150] Avg| 15.50| 0.2533| 0.015 Peak| | 0.2836| 0.823 ---------------+--------+--------+--------- RxCan2[160] Avg| 4.70| 0.0784| 0.014 Peak| | 0.0863| 0.608 ---------------+--------+--------+--------- RxCan2[180] Avg| 15.55| 0.2713| 0.015 Peak| | 0.2841| 0.884 ---------------+--------+--------+--------- RxCan2[190] Avg| 15.50| 0.2596| 0.014 Peak| | 0.2825| 0.743 ---------------+--------+--------+--------- RxCan2[1a0] Avg| 0.95| 0.0164| 0.015 Peak| | 0.0164| 0.346 ---------------+--------+--------+--------- RxCan2[1a4] Avg| 18.65| 0.3232| 0.015 Peak| | 0.3515| 0.989 ---------------+--------+--------+--------- RxCan2[1a8] Avg| 11.60| 0.1911| 0.016 Peak| | 0.2012| 0.757 ---------------+--------+--------+--------- RxCan2[1b0] Avg| 9.35| 0.1558| 0.016 Peak| | 0.1641| 0.795 ---------------+--------+--------+--------- RxCan2[1b4] Avg| 9.35| 0.1543| 0.015 Peak| | 0.1617| 1.217 ---------------+--------+--------+--------- RxCan2[1b8] Avg| 11.65| 0.2003| 0.014 Peak| | 0.2236| 1.549 ---------------+--------+--------+--------- RxCan2[1c0] Avg| 9.40| 0.1532| 0.016 Peak| | 0.1673| 0.955 ---------------+--------+--------+--------- RxCan2[1e0] Avg| 9.30| 0.1582| 0.015 Peak| | 0.1708| 0.661 ---------------+--------+--------+--------- RxCan2[215] Avg| 7.80| 0.1409| 0.016 Peak| | 0.1531| 0.660 ---------------+--------+--------+--------- RxCan2[217] Avg| 7.80| 0.1239| 0.014 Peak| | 0.1333| 0.520 ---------------+--------+--------+--------- RxCan2[220] Avg| 6.20| 0.1041| 0.015 Peak| | 0.1094| 0.652 ---------------+--------+--------+--------- RxCan2[225] Avg| 23.40| 0.4648| 0.015 Peak| | 0.4696| 4.288 ---------------+--------+--------+--------- RxCan2[230] Avg| 6.20| 0.3120| 0.048 Peak| | 0.3377| 1.065 ---------------+--------+--------+--------- RxCan2[240] Avg| 7.70| 0.1248| 0.014 Peak| | 0.1364| 0.635 ---------------+--------+--------+--------- RxCan2[241] Avg| 18.60| 0.3258| 0.014 Peak| | 0.3343| 1.288 ---------------+--------+--------+--------- RxCan2[250] Avg| 4.70| 0.0761| 0.014 Peak| | 0.0809| 0.322 ---------------+--------+--------+--------- RxCan2[255] Avg| 11.75| 0.2058| 0.014 Peak| | 0.2283| 0.937 ---------------+--------+--------+--------- RxCan2[265] Avg| 11.65| 0.1964| 0.014 Peak| | 0.2068| 0.965 ---------------+--------+--------+--------- RxCan2[270] Avg| 4.70| 0.0808| 0.016 Peak| | 0.0949| 0.729 ---------------+--------+--------+--------- RxCan2[290] Avg| 3.15| 0.0498| 0.015 Peak| | 0.0504| 0.449 ---------------+--------+--------+--------- RxCan2[295] Avg| 6.25| 0.1019| 0.014 Peak| | 0.1094| 0.859 ---------------+--------+--------+--------- RxCan2[2a0] Avg| 3.15| 0.0550| 0.014 Peak| | 0.0551| 0.779 ---------------+--------+--------+--------- RxCan2[2a7] Avg| 11.65| 0.1929| 0.014 Peak| | 0.2080| 0.775 ---------------+--------+--------+--------- RxCan2[2b0] Avg| 3.00| 0.0497| 0.015 Peak| | 0.0562| 0.528 ---------------+--------+--------+--------- RxCan2[2c0] Avg| 3.10| 0.0534| 0.016 Peak| | 0.0592| 0.501 ---------------+--------+--------+--------- RxCan2[2e0] Avg| 1.55| 0.0247| 0.014 Peak| | 0.0289| 0.319 ---------------+--------+--------+--------- RxCan2[2f0] Avg| 1.55| 0.0244| 0.014 Peak| | 0.0273| 0.192 ---------------+--------+--------+--------- RxCan2[2f5] Avg| 11.65| 0.2078| 0.016 Peak| | 0.2333| 0.879 ---------------+--------+--------+--------- RxCan2[300] Avg| 1.60| 0.0266| 0.018 Peak| | 0.0278| 0.724 ---------------+--------+--------+--------- RxCan2[310] Avg| 1.55| 0.0276| 0.016 Peak| | 0.0285| 0.759 ---------------+--------+--------+--------- RxCan2[320] Avg| 1.60| 0.0240| 0.014 Peak| | 0.0258| 0.179 ---------------+--------+--------+--------- RxCan2[326] Avg| 9.30| 0.1550| 0.014 Peak| | 0.1582| 0.850 ---------------+--------+--------+--------- RxCan2[330] Avg| 29.95| 0.5311| 0.015 Peak| | 0.5565| 4.522 ---------------+--------+--------+--------- RxCan2[340] Avg| 7.75| 0.1693| 0.024 Peak| | 0.1868| 1.148 ---------------+--------+--------+--------- RxCan2[345] Avg| 1.60| 0.0292| 0.016 Peak| | 0.0316| 0.471 ---------------+--------+--------+--------- RxCan2[350] Avg| 0.00| 0.0000| 0.019 Peak| | 0.0000| 0.188 ---------------+--------+--------+--------- RxCan2[35e] Avg| 4.70| 0.0851| 0.019 Peak| | 0.0911| 1.023 ---------------+--------+--------+--------- RxCan2[360] Avg| 1.60| 0.0258| 0.015 Peak| | 0.0284| 0.306 ---------------+--------+--------+--------- RxCan2[361] Avg| 7.75| 0.1341| 0.017 Peak| | 0.1487| 0.761 ---------------+--------+--------+--------- RxCan2[363] Avg| 1.20| 0.0203| 0.016 Peak| | 0.0220| 0.421 ---------------+--------+--------+--------- RxCan2[370] Avg| 0.85| 0.0140| 0.016 Peak| | 0.0162| 0.354 ---------------+--------+--------+--------- RxCan2[381] Avg| 3.15| 0.0512| 0.016 Peak| | 0.0546| 0.416 ---------------+--------+--------+--------- RxCan2[3a0] Avg| 15.60| 0.2548| 0.015 Peak| | 0.2890| 0.976 ---------------+--------+--------+--------- RxCan2[3d0] Avg| 9.35| 0.1553| 0.019 Peak| | 0.1612| 1.115 ---------------+--------+--------+--------- RxCan2[3d5] Avg| 5.15| 0.0836| 0.016 Peak| | 0.0867| 0.479 ---------------+--------+--------+--------- RxCan2[3e0] Avg| 0.00| 0.0000| 0.014 Peak| | 0.0000| 0.142 ---------------+--------+--------+--------- RxCan2[400] Avg| 3.55| 0.0613| 0.017 Peak| | 0.0695| 0.501 ---------------+--------+--------+--------- RxCan2[405] Avg| 3.50| 0.0584| 0.018 Peak| | 0.0626| 0.686 ---------------+--------+--------+--------- RxCan2[40a] Avg| 7.10| 0.1278| 0.017 Peak| | 0.1389| 1.244 ---------------+--------+--------+--------- RxCan2[415] Avg| 1.60| 0.0258| 0.014 Peak| | 0.0287| 0.266 ---------------+--------+--------+--------- RxCan2[435] Avg| 0.85| 0.0165| 0.019 Peak| | 0.0167| 0.367 ---------------+--------+--------+--------- RxCan2[440] Avg| 0.85| 0.0128| 0.019 Peak| | 0.0141| 0.885 ---------------+--------+--------+--------- RxCan2[465] Avg| 0.95| 0.0177| 0.016 Peak| | 0.0195| 0.721 ---------------+--------+--------+--------- RxCan2[466] Avg| 0.95| 0.0147| 0.014 Peak| | 0.0160| 0.184 ---------------+--------+--------+--------- RxCan2[467] Avg| 0.95| 0.0172| 0.017 Peak| | 0.0188| 0.391 ---------------+--------+--------+--------- RxCan2[501] Avg| 1.45| 0.0273| 0.016 Peak| | 0.0327| 0.996 ---------------+--------+--------+--------- RxCan2[503] Avg| 1.45| 0.0288| 0.020 Peak| | 0.0338| 0.970 ---------------+--------+--------+--------- RxCan2[504] Avg| 1.40| 0.0241| 0.015 Peak| | 0.0263| 0.609 ---------------+--------+--------+--------- RxCan2[505] Avg| 1.40| 0.0255| 0.015 Peak| | 0.0296| 0.866 ---------------+--------+--------+--------- RxCan2[508] Avg| 1.35| 0.0237| 0.017 Peak| | 0.0237| 0.384 ---------------+--------+--------+--------- RxCan2[511] Avg| 1.35| 0.0226| 0.016 Peak| | 0.0228| 0.426 ---------------+--------+--------+--------- RxCan2[51e] Avg| 1.40| 0.0221| 0.014 Peak| | 0.0245| 0.211 ---------------+--------+--------+--------- RxCan2[581] Avg| 0.80| 0.0189| 0.019 Peak| | 0.0290| 1.217 ---------------+--------+--------+--------- RxCan2[606] Avg| 0.00| 0.0000| 0.014 Peak| | 0.0000| 0.142 ---------------+--------+--------+--------- RxCan2[657] Avg| 0.00| 0.0000| 0.014 Peak| | 0.0000| 0.137 ---------------+--------+--------+--------- Cmd:State Avg| 0.00| 0.0000| 0.002 Peak| | 0.0000| 0.024 ===============+========+========+========= Total Avg| 2748.42| 58.3344| 28.718
@Simon: it would be an option to try commenting out the overflow counting, to see if that's causing the issue.
I have commented out the line with the Atomic_Increment statement. Now I no longer receive any messages with “RX Task Queue Overflow Run” Here is the output of poller times status:
OVMS# poll time status Poller timing is: on Type | count | Utlztn | Time | per s | [%] | [ms] ---------------+--------+--------+--------- Poll:PRI Avg| 1.00| 0.0045| 0.004 Peak| | 0.0046| 0.064 ---------------+--------+--------+--------- RxCan1[010] Avg| 34.26| 2.2574| 0.021 Peak| | 2.2574| 4.609 ---------------+--------+--------+--------- RxCan1[030] Avg| 34.26| 2.3820| 0.021 Peak| | 2.3820| 1.135 ---------------+--------+--------+--------- RxCan1[041] Avg| 49.89| 1.2059| 0.021 Peak| | 1.2295| 5.331 ---------------+--------+--------+--------- RxCan1[049] Avg| 49.96| 1.2400| 0.030 Peak| | 1.2699| 1.402 ---------------+--------+--------+--------- RxCan1[04c] Avg| 49.92| 1.1752| 0.021 Peak| | 1.2072| 4.502 ---------------+--------+--------+--------- RxCan1[04d] Avg| 34.31| 2.4433| 0.022 Peak| | 2.4773| 1.368 ---------------+--------+--------+--------- RxCan1[076] Avg| 49.96| 1.2071| 0.024 Peak| | 1.2554| 2.007 ---------------+--------+--------+--------- RxCan1[077] Avg| 49.96| 1.2012| 0.022 Peak| | 1.2492| 1.955 ---------------+--------+--------+--------- RxCan1[07a] Avg| 34.35| 2.9251| 0.030 Peak| | 3.1103| 1.829 ---------------+--------+--------+--------- RxCan1[07d] Avg| 49.96| 1.1954| 0.022 Peak| | 1.2282| 1.074 ---------------+--------+--------+--------- RxCan1[0c8] Avg| 49.89| 1.2491| 0.021 Peak| | 1.3169| 1.181 ---------------+--------+--------+--------- RxCan1[11a] Avg| 34.39| 2.4423| 0.024 Peak| | 2.5693| 1.491 ---------------+--------+--------+--------- RxCan1[130] Avg| 49.95| 1.1312| 0.020 Peak| | 1.1684| 1.218 ---------------+--------+--------+--------- RxCan1[139] Avg| 49.92| 1.1547| 0.021 Peak| | 1.1778| 1.199 ---------------+--------+--------+--------- RxCan1[156] Avg| 9.96| 0.2391| 0.023 Peak| | 0.2591| 1.943 ---------------+--------+--------+--------- RxCan1[160] Avg| 49.96| 1.1657| 0.031 Peak| | 1.2017| 2.158 ---------------+--------+--------+--------- RxCan1[165] Avg| 49.96| 1.1257| 0.021 Peak| | 1.1652| 1.471 ---------------+--------+--------+--------- RxCan1[167] Avg| 34.31| 2.2871| 0.021 Peak| | 2.3374| 1.776 ---------------+--------+--------+--------- RxCan1[171] Avg| 49.96| 1.1879| 0.023 Peak| | 1.2268| 1.166 ---------------+--------+--------+--------- RxCan1[178] Avg| 10.00| 0.2371| 0.029 Peak| | 0.2459| 1.516 ---------------+--------+--------+--------- RxCan1[179] Avg| 10.00| 0.2196| 0.021 Peak| | 0.2260| 0.758 ---------------+--------+--------+--------- RxCan1[180] Avg| 49.96| 1.1703| 0.022 Peak| | 1.2103| 1.481 ---------------+--------+--------+--------- RxCan1[185] Avg| 49.95| 1.1127| 0.020 Peak| | 1.1636| 1.292 ---------------+--------+--------+--------- RxCan1[1a0] Avg| 49.96| 1.1009| 0.020 Peak| | 1.1468| 1.060 ---------------+--------+--------+--------- RxCan1[1e0] Avg| 49.96| 1.1744| 0.021 Peak| | 1.2027| 1.240 ---------------+--------+--------+--------- RxCan1[1e4] Avg| 49.96| 1.3733| 0.032 Peak| | 1.4085| 1.523 ---------------+--------+--------+--------- RxCan1[1f0] Avg| 33.30| 0.7625| 0.023 Peak| | 0.8004| 3.349 ---------------+--------+--------+--------- RxCan1[200] Avg| 49.92| 1.1462| 0.021 Peak| | 1.1809| 1.254 ---------------+--------+--------+--------- RxCan1[202] Avg| 34.39| 2.4034| 0.028 Peak| | 2.5611| 1.472 ---------------+--------+--------+--------- RxCan1[204] Avg| 34.30| 2.2541| 0.022 Peak| | 2.2924| 2.015 ---------------+--------+--------+--------- RxCan1[213] Avg| 49.96| 1.1599| 0.027 Peak| | 1.1794| 1.714 ---------------+--------+--------+--------- RxCan1[214] Avg| 49.96| 1.1537| 0.022 Peak| | 1.1941| 1.439 ---------------+--------+--------+--------- RxCan1[217] Avg| 34.39| 2.2490| 0.020 Peak| | 2.2856| 3.766 ---------------+--------+--------+--------- RxCan1[218] Avg| 49.96| 1.1291| 0.021 Peak| | 1.1646| 1.547 ---------------+--------+--------+--------- RxCan1[230] Avg| 49.96| 1.1272| 0.020 Peak| | 1.2237| 1.295 ---------------+--------+--------+--------- RxCan1[240] Avg| 10.00| 0.2191| 0.021 Peak| | 0.2226| 1.067 ---------------+--------+--------+--------- RxCan1[242] Avg| 24.96| 0.6911| 0.024 Peak| | 0.7161| 1.180 ---------------+--------+--------+--------- RxCan1[24a] Avg| 9.96| 0.2345| 0.024 Peak| | 0.2535| 0.779 ---------------+--------+--------+--------- RxCan1[24b] Avg| 9.96| 0.2433| 0.023 Peak| | 0.2697| 2.085 ---------------+--------+--------+--------- RxCan1[24c] Avg| 9.96| 0.3103| 0.029 Peak| | 0.3203| 0.809 ---------------+--------+--------+--------- RxCan1[25a] Avg| 10.00| 0.2346| 0.022 Peak| | 0.2405| 1.223 ---------------+--------+--------+--------- RxCan1[25b] Avg| 49.89| 1.2121| 0.020 Peak| | 1.3659| 19.523 ---------------+--------+--------+--------- RxCan1[25c] Avg| 34.31| 2.4193| 0.019 Peak| | 2.8022| 58.153 ---------------+--------+--------+--------- RxCan1[260] Avg| 9.93| 0.2149| 0.024 Peak| | 0.2174| 1.096 ---------------+--------+--------+--------- RxCan1[270] Avg| 49.96| 1.2042| 0.026 Peak| | 1.2755| 20.612 ---------------+--------+--------+--------- RxCan1[280] Avg| 49.96| 1.0922| 0.020 Peak| | 1.1312| 1.266 ---------------+--------+--------+--------- RxCan1[2e4] Avg| 19.96| 0.6942| 0.044 Peak| | 0.8604| 1.533 ---------------+--------+--------+--------- RxCan1[2ec] Avg| 10.00| 0.3727| 0.025 Peak| | 0.5154| 28.819 ---------------+--------+--------+--------- RxCan1[2ed] Avg| 10.00| 0.2298| 0.023 Peak| | 0.2378| 1.345 ---------------+--------+--------+--------- RxCan1[2ee] Avg| 9.96| 0.2172| 0.019 Peak| | 0.2210| 1.058 ---------------+--------+--------+--------- RxCan1[312] Avg| 10.00| 0.2206| 0.020 Peak| | 0.2396| 1.060 ---------------+--------+--------+--------- RxCan1[326] Avg| 9.96| 0.2099| 0.020 Peak| | 0.2158| 0.507 ---------------+--------+--------+--------- RxCan1[336] Avg| 1.00| 0.0212| 0.020 Peak| | 0.0233| 0.315 ---------------+--------+--------+--------- RxCan1[352] Avg| 6.64| 0.1675| 0.024 Peak| | 0.1818| 1.048 ---------------+--------+--------+--------- RxCan1[355] Avg| 2.00| 0.0540| 0.027 Peak| | 0.0619| 1.209 ---------------+--------+--------+--------- RxCan1[35e] Avg| 9.98| 0.2221| 0.021 Peak| | 0.2284| 1.186 ---------------+--------+--------+--------- RxCan1[365] Avg| 10.00| 0.2282| 0.023 Peak| | 0.2335| 0.769 ---------------+--------+--------+--------- RxCan1[366] Avg| 10.00| 0.3163| 0.022 Peak| | 0.6330| 23.587 ---------------+--------+--------+--------- RxCan1[367] Avg| 10.00| 0.2417| 0.021 Peak| | 0.2568| 1.417 ---------------+--------+--------+--------- RxCan1[368] Avg| 9.96| 0.2187| 0.019 Peak| | 0.2250| 1.135 ---------------+--------+--------+--------- RxCan1[369] Avg| 9.99| 0.2277| 0.021 Peak| | 0.2334| 0.667 ---------------+--------+--------+--------- RxCan1[380] Avg| 9.96| 0.2133| 0.020 Peak| | 0.2161| 0.560 ---------------+--------+--------+--------- RxCan1[38b] Avg| 24.92| 0.5622| 0.022 Peak| | 0.5716| 1.618 ---------------+--------+--------+--------- RxCan1[3b3] Avg| 10.00| 0.2132| 0.023 Peak| | 0.2194| 1.106 ---------------+--------+--------+--------- RxCan1[400] Avg| 4.00| 0.0885| 0.019 Peak| | 0.0885| 0.570 ---------------+--------+--------+--------- RxCan1[405] Avg| 3.70| 0.1414| 0.036 Peak| | 0.1414| 0.710 ---------------+--------+--------+--------- RxCan1[40a] Avg| 8.00| 0.1887| 0.021 Peak| | 0.1887| 1.027 ---------------+--------+--------+--------- RxCan1[410] Avg| 10.00| 0.2141| 0.023 Peak| | 0.2188| 0.984 ---------------+--------+--------+--------- RxCan1[411] Avg| 10.00| 0.2325| 0.023 Peak| | 0.2447| 0.660 ---------------+--------+--------+--------- RxCan1[416] Avg| 10.00| 0.2326| 0.022 Peak| | 0.2389| 0.774 ---------------+--------+--------+--------- RxCan1[421] Avg| 10.00| 0.2245| 0.021 Peak| | 0.2271| 1.160 ---------------+--------+--------+--------- RxCan1[42d] Avg| 10.00| 0.2315| 0.021 Peak| | 0.2411| 0.677 ---------------+--------+--------+--------- RxCan1[42f] Avg| 10.00| 0.2480| 0.020 Peak| | 0.2975| 8.093 ---------------+--------+--------+--------- RxCan1[430] Avg| 10.00| 0.2203| 0.019 Peak| | 0.2302| 0.847 ---------------+--------+--------+--------- RxCan1[434] Avg| 10.00| 0.2331| 0.019 Peak| | 0.2620| 1.150 ---------------+--------+--------+--------- RxCan1[435] Avg| 6.68| 0.1445| 0.020 Peak| | 0.1486| 1.063 ---------------+--------+--------+--------- RxCan1[43e] Avg| 20.00| 0.4515| 0.021 Peak| | 0.4632| 1.013 ---------------+--------+--------+--------- RxCan1[440] Avg| 1.00| 0.0210| 0.019 Peak| | 0.0218| 0.294 ---------------+--------+--------+--------- RxCan1[465] Avg| 0.95| 0.0214| 0.023 Peak| | 0.0215| 0.587 ---------------+--------+--------+--------- RxCan1[466] Avg| 0.95| 0.0211| 0.021 Peak| | 0.0215| 0.350 ---------------+--------+--------+--------- RxCan1[467] Avg| 0.95| 0.0191| 0.020 Peak| | 0.0201| 0.444 ---------------+--------+--------+--------- RxCan1[472] Avg| 0.68| 0.0588| 0.085 Peak| | 0.0606| 1.170 ---------------+--------+--------+--------- RxCan1[473] Avg| 0.66| 0.0407| 0.062 Peak| | 0.0492| 1.329 ---------------+--------+--------+--------- RxCan1[474] Avg| 1.00| 0.0218| 0.021 Peak| | 0.0237| 0.278 ---------------+--------+--------+--------- RxCan1[475] Avg| 1.96| 0.0466| 0.024 Peak| | 0.0570| 1.112 ---------------+--------+--------+--------- RxCan1[476] Avg| 2.00| 0.0454| 0.020 Peak| | 0.0497| 0.409 ---------------+--------+--------+--------- RxCan1[477] Avg| 2.00| 0.0497| 0.022 Peak| | 0.0595| 0.864 ---------------+--------+--------+--------- RxCan1[595] Avg| 1.00| 0.0223| 0.021 Peak| | 0.0241| 0.296 ---------------+--------+--------+--------- RxCan1[59e] Avg| 1.00| 0.0233| 0.024 Peak| | 0.0289| 0.713 ---------------+--------+--------+--------- RxCan1[5a2] Avg| 1.00| 0.0200| 0.020 Peak| | 0.0204| 0.264 ---------------+--------+--------+--------- RxCan1[5ba] Avg| 1.00| 0.0206| 0.021 Peak| | 0.0238| 0.515 ---------------+--------+--------+--------- RxCan2[020] Avg| 33.30| 0.7938| 0.022 Peak| | 0.7938| 4.793 ---------------+--------+--------+--------- RxCan2[030] Avg| 22.20| 0.5229| 0.022 Peak| | 0.5229| 0.985 ---------------+--------+--------+--------- RxCan2[03a] Avg| 19.90| 0.4700| 0.022 Peak| | 0.4700| 0.804 ---------------+--------+--------+--------- RxCan2[040] Avg| 19.90| 0.4678| 0.023 Peak| | 0.4678| 1.222 ---------------+--------+--------+--------- RxCan2[060] Avg| 20.00| 0.6480| 0.050 Peak| | 0.6480| 20.997 ---------------+--------+--------+--------- RxCan2[070] Avg| 16.60| 0.3944| 0.022 Peak| | 0.3944| 1.053 ---------------+--------+--------+--------- RxCan2[080] Avg| 16.70| 0.7032| 0.041 Peak| | 0.7032| 1.611 ---------------+--------+--------+--------- RxCan2[083] Avg| 20.10| 0.4329| 0.021 Peak| | 0.4329| 0.520 ---------------+--------+--------+--------- RxCan2[090] Avg| 24.90| 0.5674| 0.017 Peak| | 0.5674| 1.149 ---------------+--------+--------+--------- RxCan2[0a0] Avg| 16.60| 0.3836| 0.023 Peak| | 0.3836| 0.933 ---------------+--------+--------+--------- RxCan2[100] Avg| 16.50| 0.3661| 0.021 Peak| | 0.3661| 0.740 ---------------+--------+--------+--------- RxCan2[108] Avg| 24.90| 0.5923| 0.025 Peak| | 0.5923| 0.859 ---------------+--------+--------+--------- RxCan2[110] Avg| 16.70| 0.3906| 0.023 Peak| | 0.3906| 0.697 ---------------+--------+--------+--------- RxCan2[130] Avg| 14.40| 0.3341| 0.022 Peak| | 0.3341| 0.829 ---------------+--------+--------+--------- RxCan2[150] Avg| 16.50| 0.4025| 0.020 Peak| | 0.4025| 1.120 ---------------+--------+--------+--------- RxCan2[160] Avg| 4.90| 0.1252| 0.025 Peak| | 0.1252| 0.502 ---------------+--------+--------+--------- RxCan2[180] Avg| 16.60| 0.3899| 0.023 Peak| | 0.3899| 0.799 ---------------+--------+--------+--------- RxCan2[190] Avg| 16.60| 0.3892| 0.025 Peak| | 0.3892| 1.172 ---------------+--------+--------+--------- RxCan2[1a0] Avg| 1.00| 0.0281| 0.025 Peak| | 0.0281| 0.695 ---------------+--------+--------+--------- RxCan2[1a4] Avg| 20.00| 0.4525| 0.022 Peak| | 0.4525| 1.231 ---------------+--------+--------+--------- RxCan2[1a8] Avg| 12.50| 0.2886| 0.020 Peak| | 0.2886| 1.048 ---------------+--------+--------+--------- RxCan2[1b0] Avg| 10.00| 0.2300| 0.023 Peak| | 0.2300| 0.579 ---------------+--------+--------+--------- RxCan2[1b4] Avg| 10.00| 0.2334| 0.022 Peak| | 0.2334| 0.947 ---------------+--------+--------+--------- RxCan2[1b8] Avg| 12.40| 0.2970| 0.023 Peak| | 0.2970| 0.909 ---------------+--------+--------+--------- RxCan2[1c0] Avg| 10.00| 0.2257| 0.021 Peak| | 0.2257| 0.983 ---------------+--------+--------+--------- RxCan2[1e0] Avg| 10.00| 0.2141| 0.023 Peak| | 0.2141| 0.556 ---------------+--------+--------+--------- RxCan2[215] Avg| 8.30| 0.2047| 0.025 Peak| | 0.2047| 0.786 ---------------+--------+--------+--------- RxCan2[217] Avg| 8.30| 0.2033| 0.022 Peak| | 0.2033| 1.135 ---------------+--------+--------+--------- RxCan2[220] Avg| 6.70| 0.1647| 0.020 Peak| | 0.1647| 0.961 ---------------+--------+--------+--------- RxCan2[225] Avg| 24.90| 0.6136| 0.026 Peak| | 0.6136| 1.018 ---------------+--------+--------+--------- RxCan2[230] Avg| 6.70| 0.4045| 0.057 Peak| | 0.4045| 1.532 ---------------+--------+--------+--------- RxCan2[240] Avg| 8.20| 0.1849| 0.021 Peak| | 0.1849| 0.510 ---------------+--------+--------+--------- RxCan2[241] Avg| 20.00| 0.4312| 0.021 Peak| | 0.4312| 5.110 ---------------+--------+--------+--------- RxCan2[250] Avg| 5.00| 0.1072| 0.021 Peak| | 0.1072| 0.320 ---------------+--------+--------+--------- RxCan2[255] Avg| 12.50| 0.3091| 0.022 Peak| | 0.3091| 0.904 ---------------+--------+--------+--------- RxCan2[265] Avg| 12.50| 0.2819| 0.021 Peak| | 0.2819| 1.035 ---------------+--------+--------+--------- RxCan2[270] Avg| 5.00| 0.1189| 0.022 Peak| | 0.1189| 0.631 ---------------+--------+--------+--------- RxCan2[290] Avg| 3.30| 0.0740| 0.023 Peak| | 0.0740| 0.455 ---------------+--------+--------+--------- RxCan2[295] Avg| 6.60| 0.1431| 0.023 Peak| | 0.1431| 0.504 ---------------+--------+--------+--------- RxCan2[2a0] Avg| 3.30| 0.0686| 0.020 Peak| | 0.0686| 0.445 ---------------+--------+--------+--------- RxCan2[2a7] Avg| 12.50| 0.2869| 0.021 Peak| | 0.2869| 0.660 ---------------+--------+--------+--------- RxCan2[2b0] Avg| 3.20| 0.0707| 0.023 Peak| | 0.0707| 0.331 ---------------+--------+--------+--------- RxCan2[2c0] Avg| 3.20| 0.0988| 0.026 Peak| | 0.0988| 0.932 ---------------+--------+--------+--------- RxCan2[2e0] Avg| 1.60| 0.0388| 0.024 Peak| | 0.0388| 0.393 ---------------+--------+--------+--------- RxCan2[2f0] Avg| 1.70| 0.0376| 0.021 Peak| | 0.0376| 0.282 ---------------+--------+--------+--------- RxCan2[2f5] Avg| 12.50| 0.2833| 0.021 Peak| | 0.2833| 0.855 ---------------+--------+--------+--------- RxCan2[300] Avg| 1.70| 0.0398| 0.023 Peak| | 0.0398| 0.488 ---------------+--------+--------+--------- RxCan2[310] Avg| 1.60| 0.0480| 0.026 Peak| | 0.0480| 0.937 ---------------+--------+--------+--------- RxCan2[320] Avg| 1.70| 0.0346| 0.020 Peak| | 0.0346| 0.370 ---------------+--------+--------+--------- RxCan2[326] Avg| 9.90| 0.2200| 0.022 Peak| | 0.2200| 0.502 ---------------+--------+--------+--------- RxCan2[330] Avg| 32.30| 0.7323| 0.021 Peak| | 0.7323| 1.130 ---------------+--------+--------+--------- RxCan2[340] Avg| 8.20| 0.2375| 0.028 Peak| | 0.2375| 0.578 ---------------+--------+--------+--------- RxCan2[345] Avg| 1.60| 0.0393| 0.022 Peak| | 0.0393| 0.590 ---------------+--------+--------+--------- RxCan2[35e] Avg| 5.00| 0.1303| 0.023 Peak| | 0.1303| 0.943 ---------------+--------+--------+--------- RxCan2[360] Avg| 1.70| 0.0381| 0.025 Peak| | 0.0381| 0.922 ---------------+--------+--------+--------- RxCan2[361] Avg| 8.20| 0.1907| 0.023 Peak| | 0.1907| 1.119 ---------------+--------+--------+--------- RxCan2[363] Avg| 1.30| 0.0337| 0.024 Peak| | 0.0337| 0.425 ---------------+--------+--------+--------- RxCan2[370] Avg| 0.90| 0.0194| 0.022 Peak| | 0.0194| 0.246 ---------------+--------+--------+--------- RxCan2[381] Avg| 3.20| 0.0684| 0.024 Peak| | 0.0684| 0.828 ---------------+--------+--------+--------- RxCan2[3a0] Avg| 16.60| 0.3734| 0.022 Peak| | 0.3734| 0.636 ---------------+--------+--------+--------- RxCan2[3d0] Avg| 10.00| 0.2262| 0.023 Peak| | 0.2262| 0.663 ---------------+--------+--------+--------- RxCan2[3d5] Avg| 5.60| 0.1335| 0.022 Peak| | 0.1335| 1.222 ---------------+--------+--------+--------- RxCan2[400] Avg| 4.00| 0.0949| 0.022 Peak| | 0.0949| 0.715 ---------------+--------+--------+--------- RxCan2[405] Avg| 3.70| 0.0861| 0.022 Peak| | 0.0861| 0.443 ---------------+--------+--------+--------- RxCan2[40a] Avg| 8.00| 0.1853| 0.021 Peak| | 0.1853| 0.552 ---------------+--------+--------+--------- RxCan2[415] Avg| 1.60| 0.0341| 0.021 Peak| | 0.0341| 0.273 ---------------+--------+--------+--------- RxCan2[435] Avg| 0.90| 0.0220| 0.025 Peak| | 0.0220| 0.354 ---------------+--------+--------+--------- RxCan2[440] Avg| 0.90| 0.0199| 0.021 Peak| | 0.0199| 0.266 ---------------+--------+--------+--------- RxCan2[465] Avg| 0.90| 0.0234| 0.028 Peak| | 0.0234| 0.633 ---------------+--------+--------+--------- RxCan2[466] Avg| 1.00| 0.0222| 0.021 Peak| | 0.0222| 0.322 ---------------+--------+--------+--------- RxCan2[467] Avg| 1.00| 0.0221| 0.020 Peak| | 0.0221| 0.355 ---------------+--------+--------+--------- RxCan2[501] Avg| 1.50| 0.0335| 0.023 Peak| | 0.0335| 0.393 ---------------+--------+--------+--------- RxCan2[503] Avg| 1.50| 0.0370| 0.022 Peak| | 0.0370| 0.546 ---------------+--------+--------+--------- RxCan2[504] Avg| 1.40| 0.0328| 0.022 Peak| | 0.0328| 0.489 ---------------+--------+--------+--------- RxCan2[505] Avg| 1.40| 0.0290| 0.021 Peak| | 0.0290| 0.354 ---------------+--------+--------+--------- RxCan2[508] Avg| 1.40| 0.0318| 0.023 Peak| | 0.0318| 0.408 ---------------+--------+--------+--------- RxCan2[511] Avg| 1.40| 0.0306| 0.022 Peak| | 0.0306| 0.328 ---------------+--------+--------+--------- RxCan2[51e] Avg| 1.40| 0.0310| 0.022 Peak| | 0.0310| 0.269 ---------------+--------+--------+--------- RxCan2[581] Avg| 1.00| 0.0222| 0.022 Peak| | 0.0222| 0.256 ---------------+--------+--------+--------- Cmd:State Avg| 0.00| 0.0000| 0.002 Peak| | 0.0000| 0.024 ===============+========+========+========= Total Avg| 2795.57| 82.7745| 40.174
Cheers, Simon
Am 17.01.2025 um 17:49 schrieb Michael Balzer via OvmsDev:
OK, I've got a new idea: CAN timing.
Comparing our esp32can bit timing to the esp-idf driver's, there seem to be some differences:
https://github.com/espressif/esp-idf/blob/master/components/hal/include/hal/...
Transceivers are normally tolerant to small timing offsets. Maybe being off a little bit has no effect under normal conditions, but it has when the transceiver has to cope with a filled RX queue. That could be causing the transceiver to slide just out of sync. If the timing gets garbled, the transceiver would signal errors in the packets to the bus, possibly so many the vehicle ECUs decide to raise an error condition.
Is that plausible?
On why the new poller could be causing this (in combination with too slow processing by the vehicle): as mentioned, the standard CAN listener mechanism doesn't care about queue overflows. The poller does. `OvmsPollers::Queue_PollerFrame()` does a log call when Tx/Rx tracing is enabled, that could even block, but tracing is optional and only meant for debugging. Not optional is the overflow counting using an atomic uint32.
The atomic types are said to be fast, but I never checked their actual implementation on the ESP32. Maybe they can block as well?
@Simon: it would be an option to try commenting out the overflow counting, to see if that's causing the issue.
Regards, Michael
Am 17.01.25 um 15:37 schrieb Chris Box via OvmsDev:
Yes, I can confirm I've had one experience of the Leaf switching to Neutral while driving, with a yellow warning symbol on the dash. It refused to reselect Drive until I had switched the car off and back on. Derek wasn't so lucky and he need to clear fault codes before the car would work.
On returning home, I found OVMS was not accessible over a network. I didn't try a USB cable. Unplugging and reinserting the OBD cable caused OVMS to rejoin Wi-Fi. However the SD logs showed nothing from the time of the event. CAN writes are enabled, so it can perform SOC limiting.
My car has been using this firmware since 21st November, based on the git master of that day. As a relatively new user of OVMS (only since October) I don't have much experience of older firmware.
Perhaps a safeguard should be implemented before releasing a new stable firmware that will be automatically downloaded by Leaf owners. But I don't have the expertise to know what that safeguard should be. Derek's suggestion of 'only CAN write when parked' appears to be a good idea.
Chris
On 2025-01-15 18:18, Derek Caudwell via OvmsDev wrote:
Since the following email I have high confidence the issue on the Leaf is related/caused by the poller as there has been no further occurrence and Chris has also experienced the car going to neutral on the new poller firmware.
.... I haven't ruled out it being a fault with my car yet. Shortly after it faulted the car was run into so has been off the road for sometime, my first step was to replace 12V battery. The ovms unit is now unplugged and if it does not fault over the next month while driving I'll be reasonably confident it's ovms related.
Not sure which firmware version the poller updates were included in but it was only after upgrading to it that the errors occurred (which could be coincidental however it has faulted twice more both on version 3.3.004-141-gf729d82c). For periods where I reverted to 3.3.003 it was fine.
It might be useful to have an extra option on the enable can write to only enable it when the car is parked/charging.
_______________________________________________ OvmsDev mailing listOvmsDev@lists.openvehicles.comhttp://lists.openvehicles.com/mailman/listinfo/ovmsdev
-- Michael Balzer * Am Rahmen 5 * D-58313 Herdecke Fon 02330 9104094 * Handy 0176 20698926
_______________________________________________ OvmsDev mailing listOvmsDev@lists.openvehicles.comhttp://lists.openvehicles.com/mailman/listinfo/ovmsdev
_______________________________________________ OvmsDev mailing listOvmsDev@lists.openvehicles.comhttp://lists.openvehicles.com/mailman/listinfo/ovmsdev
-- Michael Balzer * Am Rahmen 5 * D-58313 Herdecke Fon 02330 9104094 * Handy 0176 20698926
_______________________________________________ OvmsDev mailing list OvmsDev@lists.openvehicles.com http://lists.openvehicles.com/mailman/listinfo/ovmsdev
On Sat, 18 Jan 2025 at 17:08, Michael Balzer via OvmsDev < ovmsdev@lists.openvehicles.com> wrote:
I have commented out the line with the Atomic_Increment statement. Now I no longer receive any messages with “RX Task Queue Overflow Run” Here is the output of poller times status:
The main question is if you still get the CAN bus crash (vehicle running into issues) with that modification in active mode. Timing statistics were not expected to change.
I have a feeling that the atomic operations are along the lines of: * Set Interrupts off * atomic operation * Set interrupts on Which means no real 'blocking' .. just not allowing interrupts and therefor task switching for a couple of instructions.
Nearly 2800 frames per second is quite a lot, and most is on can1 with many frame periods at 20 ms. Yet the total processing time averages at 30-40 ms, so there is no actual CPU capacity issue for that amount of frames.
@Derek: can you please supply these statistics for the Leaf in drive mode as well?
Am 18.01.25 um 02:42 schrieb Michael Geddes via OvmsDev:
Maybe try setting CONFIG_OVMS_VEHICLE_CAN_RX_QUEUE_SIZE = 160 and see if that reduces the overflow?
Simons car sends at least 91 process data frame IDs on can1 and 84 on can2. Worst case would be these come all in within the shortest possible time span, that would mean the queue needs to be able to hold 175 frames. I'd add some headroom and round up to 200.
But keep in mind, if the Incoming processing actually occasionally gets blocked for up to 60 ms -- as indicated by Simons statistics --, the queue may need to be twice as large.
Am 18.01.25 um 02:42 schrieb Michael Geddes via OvmsDev:
I was thinking that the frame filter would be here: void OvmsPollers::PollerRxCallback(const CAN_frame_t* frame, bool success) { Queue_PollerFrame(*frame, success, false); } which I guess is executed in the task handling the CAN queue. (we don't know how many frames get dropped there).
Actually we do know that, or at least have some indication, as we count the CAN transceiver queue overruns. That info is included as "Rx overflw" in the can status output & as "rxovr" in the logs.
Adding a filter before queueing the frame would exclude the filtered IDs from all vehicle processing. I meant adding a filter just to exclude IDs from the timing statistics, assuming those are the culprits, as Simon wrote the issue only appears after enabling the timing statistics and printing them. That's why I asked if printing might need to lock the statistics for too long in case of such a long list.
Completely blocking ID ranges from processing by the vehicle should normally not be necessary, unless the Incoming handler is written very poorly.
Yet, if we add that, a mutex in the CAN RX callback must be avoided, or would need to be non-blocking:
The only real concern is thread safety between checking and adding to the filter - so the check itself might have to be mutexed. void OvmsPollers::PollerRxCallback(const CAN_frame_t* frame, bool success) { // Check filter { OvmsRecMutexLock lock(&m_filter_mutex); if (! m_filter->IsFiltered(frame)) return; } Queue_PollerFrame(*frame, success, false); }
A mutex like that could block the CAN task, which must be avoided at all cost. I introduced CAN callbacks for vehicles & applications that need to react to certain frames as fast as possible, e.g. to maintain control precedence, so cannot use the standard CAN listener mechanism (frame queueing).
The current poller callback use is OK, if (!) the atomic type really isn't the culprit, ie doesn't block.
So if (!) an ID filter needs to be added before queueing, it needs to be done in a way that needs no mutex. But I don't see an issue with the vehicle passing a fixed filter when registering with the poller/buses. The filter doesn't need to by mutable on the fly.
Regards, Michael
Am 17.01.25 um 19:42 schrieb Simon Ehlen via OvmsDev:
The poller statistics can help you track this down, but you need to have at least 10 seconds of statistics, the more the better. Rule of thumb: PRI average at 0.0/second means you don't have enough data yet.
There were again many messages with “RX Task Queue Overflow Run”. Here are the statistics of poller times status:
OVMS# poll times status Poller timing is: on Type | count | Utlztn | Time | per s | [%] | [ms] ---------------+--------+--------+--------- Poll:PRI Avg| 1.00| 0.0043| 0.004 Peak| | 0.0043| 0.052 ---------------+--------+--------+--------- RxCan1[010] Avg| 34.26| 1.6741| 0.015 Peak| | 1.6741| 1.182 ---------------+--------+--------+--------- RxCan1[030] Avg| 34.06| 1.7085| 0.020 Peak| | 1.7085| 1.390 ---------------+--------+--------+--------- RxCan1[041] Avg| 49.89| 0.8109| 0.016 Peak| | 0.8541| 1.098 ---------------+--------+--------+--------- RxCan1[049] Avg| 50.00| 1.5970| 0.019 Peak| | 1.7154| 32.233 ---------------+--------+--------+--------- RxCan1[04c] Avg| 49.92| 0.8340| 0.014 Peak| | 0.8933| 1.995 ---------------+--------+--------+--------- RxCan1[04d] Avg| 34.43| 1.6211| 0.014 Peak| | 1.6756| 1.318 ---------------+--------+--------+--------- RxCan1[076] Avg| 50.00| 0.8362| 0.024 Peak| | 0.8784| 2.185 ---------------+--------+--------+--------- RxCan1[077] Avg| 50.00| 0.7837| 0.014 Peak| | 0.8083| 1.156 ---------------+--------+--------+--------- RxCan1[07a] Avg| 34.31| 2.1870| 0.017 Peak| | 2.3252| 1.888 ---------------+--------+--------+--------- RxCan1[07d] Avg| 50.00| 0.8001| 0.013 Peak| | 0.8434| 1.150 ---------------+--------+--------+--------- RxCan1[0c8] Avg| 49.96| 0.8359| 0.013 Peak| | 0.8715| 1.171 ---------------+--------+--------+--------- RxCan1[11a] Avg| 34.35| 1.6701| 0.020 Peak| | 1.6981| 1.273 ---------------+--------+--------+--------- RxCan1[130] Avg| 50.00| 0.7902| 0.018 Peak| | 0.8513| 0.980 ---------------+--------+--------+--------- RxCan1[139] Avg| 49.92| 0.7872| 0.013 Peak| | 0.8219| 0.795 ---------------+--------+--------+--------- RxCan1[156] Avg| 10.00| 0.1620| 0.014 Peak| | 0.1729| 0.919 ---------------+--------+--------+--------- RxCan1[160] Avg| 50.04| 0.7977| 0.014 Peak| | 0.8232| 1.495 ---------------+--------+--------+--------- RxCan1[165] Avg| 49.85| 0.7976| 0.014 Peak| | 0.8486| 1.015 ---------------+--------+--------+--------- RxCan1[167] Avg| 34.39| 1.6025| 0.016 Peak| | 1.6888| 1.354 ---------------+--------+--------+--------- RxCan1[171] Avg| 50.00| 0.8150| 0.017 Peak| | 0.8488| 1.091 ---------------+--------+--------+--------- RxCan1[178] Avg| 10.00| 0.1614| 0.014 Peak| | 0.1702| 0.903 ---------------+--------+--------+--------- RxCan1[179] Avg| 10.00| 0.1630| 0.017 Peak| | 0.1663| 1.336 ---------------+--------+--------+--------- RxCan1[180] Avg| 50.00| 0.8137| 0.014 Peak| | 0.8605| 1.566 ---------------+--------+--------+--------- RxCan1[185] Avg| 50.04| 0.8033| 0.013 Peak| | 0.8393| 1.126 ---------------+--------+--------+--------- RxCan1[1a0] Avg| 49.92| 0.7748| 0.013 Peak| | 0.8169| 1.184 ---------------+--------+--------+--------- RxCan1[1e0] Avg| 49.92| 0.7738| 0.014 Peak| | 0.8028| 1.049 ---------------+--------+--------+--------- RxCan1[1e4] Avg| 49.89| 0.9692| 0.018 Peak| | 1.0096| 1.332 ---------------+--------+--------+--------- RxCan1[1f0] Avg| 33.22| 0.5544| 0.014 Peak| | 0.5855| 0.848 ---------------+--------+--------+--------- RxCan1[200] Avg| 49.92| 0.7879| 0.015 Peak| | 0.8345| 1.206 ---------------+--------+--------+--------- RxCan1[202] Avg| 34.28| 1.7075| 0.016 Peak| | 1.7874| 1.218 ---------------+--------+--------+--------- RxCan1[204] Avg| 34.35| 1.5641| 0.013 Peak| | 1.6427| 1.235 ---------------+--------+--------+--------- RxCan1[213] Avg| 49.89| 0.7814| 0.015 Peak| | 0.8232| 0.910 ---------------+--------+--------+--------- RxCan1[214] Avg| 49.92| 0.7736| 0.014 Peak| | 0.8216| 0.800 ---------------+--------+--------+--------- RxCan1[217] Avg| 34.31| 1.6294| 0.014 Peak| | 1.7165| 1.153 ---------------+--------+--------+--------- RxCan1[218] Avg| 49.86| 0.7877| 0.013 Peak| | 0.8290| 1.068 ---------------+--------+--------+--------- RxCan1[230] Avg| 50.00| 0.7596| 0.014 Peak| | 0.7660| 1.021 ---------------+--------+--------+--------- RxCan1[240] Avg| 10.00| 0.1669| 0.013 Peak| | 0.1835| 0.887 ---------------+--------+--------+--------- RxCan1[242] Avg| 24.96| 0.4764| 0.020 Peak| | 0.4963| 1.501 ---------------+--------+--------+--------- RxCan1[24a] Avg| 9.89| 0.1789| 0.015 Peak| | 0.2009| 0.874 ---------------+--------+--------+--------- RxCan1[24b] Avg| 9.89| 0.1702| 0.014 Peak| | 0.1870| 1.195 ---------------+--------+--------+--------- RxCan1[24c] Avg| 9.89| 0.2146| 0.019 Peak| | 0.2187| 1.242 ---------------+--------+--------+--------- RxCan1[25a] Avg| 10.00| 0.1603| 0.013 Peak| | 0.1667| 0.720 ---------------+--------+--------+--------- RxCan1[25b] Avg| 49.94| 0.7918| 0.017 Peak| | 0.8454| 1.666 ---------------+--------+--------+--------- RxCan1[25c] Avg| 34.24| 1.5331| 0.013 Peak| | 1.5997| 1.538 ---------------+--------+--------+--------- RxCan1[260] Avg| 10.00| 0.1626| 0.014 Peak| | 0.1682| 0.718 ---------------+--------+--------+--------- RxCan1[270] Avg| 49.90| 0.8120| 0.014 Peak| | 0.8460| 1.671 ---------------+--------+--------+--------- RxCan1[280] Avg| 49.92| 0.7777| 0.019 Peak| | 0.8447| 1.157 ---------------+--------+--------+--------- RxCan1[2e4] Avg| 19.89| 0.5778| 0.032 Peak| | 0.6648| 2.226 ---------------+--------+--------+--------- RxCan1[2ec] Avg| 10.00| 0.1701| 0.014 Peak| | 0.1755| 0.928 ---------------+--------+--------+--------- RxCan1[2ed] Avg| 10.00| 0.1650| 0.013 Peak| | 0.1747| 0.917 ---------------+--------+--------+--------- RxCan1[2ee] Avg| 9.98| 0.1544| 0.013 Peak| | 0.1588| 1.312 ---------------+--------+--------+--------- RxCan1[312] Avg| 10.00| 0.1648| 0.017 Peak| | 0.1690| 0.922 ---------------+--------+--------+--------- RxCan1[326] Avg| 9.89| 0.1603| 0.015 Peak| | 0.1833| 1.230 ---------------+--------+--------+--------- RxCan1[336] Avg| 1.00| 0.0146| 0.015 Peak| | 0.0150| 0.349 ---------------+--------+--------+--------- RxCan1[352] Avg| 6.66| 0.1223| 0.022 Peak| | 0.1338| 1.015 ---------------+--------+--------+--------- RxCan1[355] Avg| 2.00| 0.0424| 0.019 Peak| | 0.0431| 0.786 ---------------+--------+--------+--------- RxCan1[35e] Avg| 9.96| 0.1570| 0.013 Peak| | 0.1644| 0.579 ---------------+--------+--------+--------- RxCan1[365] Avg| 10.00| 0.1600| 0.014 Peak| | 0.1653| 0.961 ---------------+--------+--------+--------- RxCan1[366] Avg| 10.00| 0.1716| 0.013 Peak| | 0.1890| 0.987 ---------------+--------+--------+--------- RxCan1[367] Avg| 9.93| 0.1793| 0.015 Peak| | 0.1864| 0.984 ---------------+--------+--------+--------- RxCan1[368] Avg| 10.00| 0.1645| 0.014 Peak| | 0.1778| 0.768 ---------------+--------+--------+--------- RxCan1[369] Avg| 10.00| 0.1562| 0.016 Peak| | 0.1606| 0.724 ---------------+--------+--------+--------- RxCan1[380] Avg| 10.00| 0.1619| 0.014 Peak| | 0.1644| 0.605 ---------------+--------+--------+--------- RxCan1[38b] Avg| 25.00| 0.3991| 0.016 Peak| | 0.4280| 1.448 ---------------+--------+--------+--------- RxCan1[3b3] Avg| 10.00| 0.1537| 0.013 Peak| | 0.1610| 0.380 ---------------+--------+--------+--------- RxCan1[400] Avg| 4.00| 0.0626| 0.014 Peak| | 0.0626| 0.251 ---------------+--------+--------+--------- RxCan1[405] Avg| 3.90| 0.1019| 0.028 Peak| | 0.1019| 0.781 ---------------+--------+--------+--------- RxCan1[40a] Avg| 7.90| 0.1256| 0.020 Peak| | 0.1256| 0.991 ---------------+--------+--------+--------- RxCan1[410] Avg| 10.00| 0.1643| 0.016 Peak| | 0.1839| 1.634 ---------------+--------+--------+--------- RxCan1[411] Avg| 10.00| 0.1532| 0.013 Peak| | 0.1645| 0.824 ---------------+--------+--------+--------- RxCan1[416] Avg| 10.00| 0.1516| 0.016 Peak| | 0.1582| 0.807 ---------------+--------+--------+--------- RxCan1[421] Avg| 10.00| 0.1648| 0.013 Peak| | 0.1740| 0.839 ---------------+--------+--------+--------- RxCan1[42d] Avg| 10.00| 0.1548| 0.014 Peak| | 0.1658| 0.741 ---------------+--------+--------+--------- RxCan1[42f] Avg| 10.00| 0.1527| 0.013 Peak| | 0.1578| 0.667 ---------------+--------+--------+--------- RxCan1[430] Avg| 10.00| 0.1730| 0.016 Peak| | 0.1880| 1.209 ---------------+--------+--------+--------- RxCan1[434] Avg| 10.00| 0.1620| 0.021 Peak| | 0.1712| 1.140 ---------------+--------+--------+--------- RxCan1[435] Avg| 6.66| 0.1104| 0.014 Peak| | 0.1121| 1.011 ---------------+--------+--------+--------- RxCan1[43e] Avg| 20.00| 0.3194| 0.013 Peak| | 0.3434| 1.212 ---------------+--------+--------+--------- RxCan1[440] Avg| 1.00| 0.0160| 0.014 Peak| | 0.0175| 0.315 ---------------+--------+--------+--------- RxCan1[465] Avg| 1.00| 0.0172| 0.015 Peak| | 0.0194| 0.404 ---------------+--------+--------+--------- RxCan1[466] Avg| 1.00| 0.0198| 0.015 Peak| | 0.0252| 0.890 ---------------+--------+--------+--------- RxCan1[467] Avg| 1.00| 0.0152| 0.014 Peak| | 0.0160| 0.217 ---------------+--------+--------+--------- RxCan1[472] Avg| 0.70| 0.0533| 0.075 Peak| | 0.0546| 0.990 ---------------+--------+--------+--------- RxCan1[473] Avg| 0.65| 0.0325| 0.051 Peak| | 0.0361| 0.774 ---------------+--------+--------+--------- RxCan1[474] Avg| 1.00| 0.0146| 0.014 Peak| | 0.0151| 0.189 ---------------+--------+--------+--------- RxCan1[475] Avg| 2.00| 0.0332| 0.015 Peak| | 0.0362| 0.513 ---------------+--------+--------+--------- RxCan1[476] Avg| 2.00| 0.0305| 0.014 Peak| | 0.0307| 0.249 ---------------+--------+--------+--------- RxCan1[477] Avg| 2.00| 0.0309| 0.014 Peak| | 0.0311| 0.438 ---------------+--------+--------+--------- RxCan1[595] Avg| 1.00| 0.0151| 0.014 Peak| | 0.0160| 0.230 ---------------+--------+--------+--------- RxCan1[59e] Avg| 1.00| 0.0179| 0.015 Peak| | 0.0209| 0.716 ---------------+--------+--------+--------- RxCan1[5a2] Avg| 1.00| 0.0154| 0.016 Peak| | 0.0184| 0.699 ---------------+--------+--------+--------- RxCan1[5ba] Avg| 1.00| 0.0159| 0.017 Peak| | 0.0174| 0.485 ---------------+--------+--------+--------- RxCan2[010] Avg| 0.00| 0.0000| 0.015 Peak| | 0.0000| 0.146 ---------------+--------+--------+--------- RxCan2[020] Avg| 31.10| 0.5159| 0.015 Peak| | 0.5730| 0.992 ---------------+--------+--------+--------- RxCan2[030] Avg| 20.70| 0.3506| 0.016 Peak| | 0.3956| 1.055 ---------------+--------+--------+--------- RxCan2[03a] Avg| 18.65| 0.3157| 0.014 Peak| | 0.3292| 0.702 ---------------+--------+--------+--------- RxCan2[040] Avg| 18.60| 0.3111| 0.015 Peak| | 0.3474| 0.953 ---------------+--------+--------+--------- RxCan2[060] Avg| 18.60| 0.3182| 0.014 Peak| | 0.3569| 0.694 ---------------+--------+--------+--------- RxCan2[070] Avg| 15.55| 0.4581| 0.017 Peak| | 0.6859| 39.212 ---------------+--------+--------+--------- RxCan2[080] Avg| 15.50| 0.5041| 0.029 Peak| | 0.5414| 1.555 ---------------+--------+--------+--------- RxCan2[083] Avg| 18.70| 0.3083| 0.014 Peak| | 0.3325| 0.557 ---------------+--------+--------+--------- RxCan2[090] Avg| 23.40| 0.3961| 0.014 Peak| | 0.4445| 1.218 ---------------+--------+--------+--------- RxCan2[0a0] Avg| 15.55| 0.2734| 0.014 Peak| | 0.3144| 1.062 ---------------+--------+--------+--------- RxCan2[100] Avg| 15.50| 0.2645| 0.016 Peak| | 0.2875| 1.021 ---------------+--------+--------+--------- RxCan2[108] Avg| 23.40| 0.4231| 0.016 Peak| | 0.4680| 1.297 ---------------+--------+--------+--------- RxCan2[110] Avg| 15.55| 0.2467| 0.014 Peak| | 0.2684| 0.475 ---------------+--------+--------+--------- RxCan2[130] Avg| 13.30| 0.2231| 0.014 Peak| | 0.2447| 0.512 ---------------+--------+--------+--------- RxCan2[150] Avg| 15.50| 0.2533| 0.015 Peak| | 0.2836| 0.823 ---------------+--------+--------+--------- RxCan2[160] Avg| 4.70| 0.0784| 0.014 Peak| | 0.0863| 0.608 ---------------+--------+--------+--------- RxCan2[180] Avg| 15.55| 0.2713| 0.015 Peak| | 0.2841| 0.884 ---------------+--------+--------+--------- RxCan2[190] Avg| 15.50| 0.2596| 0.014 Peak| | 0.2825| 0.743 ---------------+--------+--------+--------- RxCan2[1a0] Avg| 0.95| 0.0164| 0.015 Peak| | 0.0164| 0.346 ---------------+--------+--------+--------- RxCan2[1a4] Avg| 18.65| 0.3232| 0.015 Peak| | 0.3515| 0.989 ---------------+--------+--------+--------- RxCan2[1a8] Avg| 11.60| 0.1911| 0.016 Peak| | 0.2012| 0.757 ---------------+--------+--------+--------- RxCan2[1b0] Avg| 9.35| 0.1558| 0.016 Peak| | 0.1641| 0.795 ---------------+--------+--------+--------- RxCan2[1b4] Avg| 9.35| 0.1543| 0.015 Peak| | 0.1617| 1.217 ---------------+--------+--------+--------- RxCan2[1b8] Avg| 11.65| 0.2003| 0.014 Peak| | 0.2236| 1.549 ---------------+--------+--------+--------- RxCan2[1c0] Avg| 9.40| 0.1532| 0.016 Peak| | 0.1673| 0.955 ---------------+--------+--------+--------- RxCan2[1e0] Avg| 9.30| 0.1582| 0.015 Peak| | 0.1708| 0.661 ---------------+--------+--------+--------- RxCan2[215] Avg| 7.80| 0.1409| 0.016 Peak| | 0.1531| 0.660 ---------------+--------+--------+--------- RxCan2[217] Avg| 7.80| 0.1239| 0.014 Peak| | 0.1333| 0.520 ---------------+--------+--------+--------- RxCan2[220] Avg| 6.20| 0.1041| 0.015 Peak| | 0.1094| 0.652 ---------------+--------+--------+--------- RxCan2[225] Avg| 23.40| 0.4648| 0.015 Peak| | 0.4696| 4.288 ---------------+--------+--------+--------- RxCan2[230] Avg| 6.20| 0.3120| 0.048 Peak| | 0.3377| 1.065 ---------------+--------+--------+--------- RxCan2[240] Avg| 7.70| 0.1248| 0.014 Peak| | 0.1364| 0.635 ---------------+--------+--------+--------- RxCan2[241] Avg| 18.60| 0.3258| 0.014 Peak| | 0.3343| 1.288 ---------------+--------+--------+--------- RxCan2[250] Avg| 4.70| 0.0761| 0.014 Peak| | 0.0809| 0.322 ---------------+--------+--------+--------- RxCan2[255] Avg| 11.75| 0.2058| 0.014 Peak| | 0.2283| 0.937 ---------------+--------+--------+--------- RxCan2[265] Avg| 11.65| 0.1964| 0.014 Peak| | 0.2068| 0.965 ---------------+--------+--------+--------- RxCan2[270] Avg| 4.70| 0.0808| 0.016 Peak| | 0.0949| 0.729 ---------------+--------+--------+--------- RxCan2[290] Avg| 3.15| 0.0498| 0.015 Peak| | 0.0504| 0.449 ---------------+--------+--------+--------- RxCan2[295] Avg| 6.25| 0.1019| 0.014 Peak| | 0.1094| 0.859 ---------------+--------+--------+--------- RxCan2[2a0] Avg| 3.15| 0.0550| 0.014 Peak| | 0.0551| 0.779 ---------------+--------+--------+--------- RxCan2[2a7] Avg| 11.65| 0.1929| 0.014 Peak| | 0.2080| 0.775 ---------------+--------+--------+--------- RxCan2[2b0] Avg| 3.00| 0.0497| 0.015 Peak| | 0.0562| 0.528 ---------------+--------+--------+--------- RxCan2[2c0] Avg| 3.10| 0.0534| 0.016 Peak| | 0.0592| 0.501 ---------------+--------+--------+--------- RxCan2[2e0] Avg| 1.55| 0.0247| 0.014 Peak| | 0.0289| 0.319 ---------------+--------+--------+--------- RxCan2[2f0] Avg| 1.55| 0.0244| 0.014 Peak| | 0.0273| 0.192 ---------------+--------+--------+--------- RxCan2[2f5] Avg| 11.65| 0.2078| 0.016 Peak| | 0.2333| 0.879 ---------------+--------+--------+--------- RxCan2[300] Avg| 1.60| 0.0266| 0.018 Peak| | 0.0278| 0.724 ---------------+--------+--------+--------- RxCan2[310] Avg| 1.55| 0.0276| 0.016 Peak| | 0.0285| 0.759 ---------------+--------+--------+--------- RxCan2[320] Avg| 1.60| 0.0240| 0.014 Peak| | 0.0258| 0.179 ---------------+--------+--------+--------- RxCan2[326] Avg| 9.30| 0.1550| 0.014 Peak| | 0.1582| 0.850 ---------------+--------+--------+--------- RxCan2[330] Avg| 29.95| 0.5311| 0.015 Peak| | 0.5565| 4.522 ---------------+--------+--------+--------- RxCan2[340] Avg| 7.75| 0.1693| 0.024 Peak| | 0.1868| 1.148 ---------------+--------+--------+--------- RxCan2[345] Avg| 1.60| 0.0292| 0.016 Peak| | 0.0316| 0.471 ---------------+--------+--------+--------- RxCan2[350] Avg| 0.00| 0.0000| 0.019 Peak| | 0.0000| 0.188 ---------------+--------+--------+--------- RxCan2[35e] Avg| 4.70| 0.0851| 0.019 Peak| | 0.0911| 1.023 ---------------+--------+--------+--------- RxCan2[360] Avg| 1.60| 0.0258| 0.015 Peak| | 0.0284| 0.306 ---------------+--------+--------+--------- RxCan2[361] Avg| 7.75| 0.1341| 0.017 Peak| | 0.1487| 0.761 ---------------+--------+--------+--------- RxCan2[363] Avg| 1.20| 0.0203| 0.016 Peak| | 0.0220| 0.421 ---------------+--------+--------+--------- RxCan2[370] Avg| 0.85| 0.0140| 0.016 Peak| | 0.0162| 0.354 ---------------+--------+--------+--------- RxCan2[381] Avg| 3.15| 0.0512| 0.016 Peak| | 0.0546| 0.416 ---------------+--------+--------+--------- RxCan2[3a0] Avg| 15.60| 0.2548| 0.015 Peak| | 0.2890| 0.976 ---------------+--------+--------+--------- RxCan2[3d0] Avg| 9.35| 0.1553| 0.019 Peak| | 0.1612| 1.115 ---------------+--------+--------+--------- RxCan2[3d5] Avg| 5.15| 0.0836| 0.016 Peak| | 0.0867| 0.479 ---------------+--------+--------+--------- RxCan2[3e0] Avg| 0.00| 0.0000| 0.014 Peak| | 0.0000| 0.142 ---------------+--------+--------+--------- RxCan2[400] Avg| 3.55| 0.0613| 0.017 Peak| | 0.0695| 0.501 ---------------+--------+--------+--------- RxCan2[405] Avg| 3.50| 0.0584| 0.018 Peak| | 0.0626| 0.686 ---------------+--------+--------+--------- RxCan2[40a] Avg| 7.10| 0.1278| 0.017 Peak| | 0.1389| 1.244 ---------------+--------+--------+--------- RxCan2[415] Avg| 1.60| 0.0258| 0.014 Peak| | 0.0287| 0.266 ---------------+--------+--------+--------- RxCan2[435] Avg| 0.85| 0.0165| 0.019 Peak| | 0.0167| 0.367 ---------------+--------+--------+--------- RxCan2[440] Avg| 0.85| 0.0128| 0.019 Peak| | 0.0141| 0.885 ---------------+--------+--------+--------- RxCan2[465] Avg| 0.95| 0.0177| 0.016 Peak| | 0.0195| 0.721 ---------------+--------+--------+--------- RxCan2[466] Avg| 0.95| 0.0147| 0.014 Peak| | 0.0160| 0.184 ---------------+--------+--------+--------- RxCan2[467] Avg| 0.95| 0.0172| 0.017 Peak| | 0.0188| 0.391 ---------------+--------+--------+--------- RxCan2[501] Avg| 1.45| 0.0273| 0.016 Peak| | 0.0327| 0.996 ---------------+--------+--------+--------- RxCan2[503] Avg| 1.45| 0.0288| 0.020 Peak| | 0.0338| 0.970 ---------------+--------+--------+--------- RxCan2[504] Avg| 1.40| 0.0241| 0.015 Peak| | 0.0263| 0.609 ---------------+--------+--------+--------- RxCan2[505] Avg| 1.40| 0.0255| 0.015 Peak| | 0.0296| 0.866 ---------------+--------+--------+--------- RxCan2[508] Avg| 1.35| 0.0237| 0.017 Peak| | 0.0237| 0.384 ---------------+--------+--------+--------- RxCan2[511] Avg| 1.35| 0.0226| 0.016 Peak| | 0.0228| 0.426 ---------------+--------+--------+--------- RxCan2[51e] Avg| 1.40| 0.0221| 0.014 Peak| | 0.0245| 0.211 ---------------+--------+--------+--------- RxCan2[581] Avg| 0.80| 0.0189| 0.019 Peak| | 0.0290| 1.217 ---------------+--------+--------+--------- RxCan2[606] Avg| 0.00| 0.0000| 0.014 Peak| | 0.0000| 0.142 ---------------+--------+--------+--------- RxCan2[657] Avg| 0.00| 0.0000| 0.014 Peak| | 0.0000| 0.137 ---------------+--------+--------+--------- Cmd:State Avg| 0.00| 0.0000| 0.002 Peak| | 0.0000| 0.024 ===============+========+========+========= Total Avg| 2748.42| 58.3344| 28.718
@Simon: it would be an option to try commenting out the overflow counting, to see if that's causing the issue.
I have commented out the line with the Atomic_Increment statement. Now I no longer receive any messages with “RX Task Queue Overflow Run” Here is the output of poller times status:
OVMS# poll time status Poller timing is: on Type | count | Utlztn | Time | per s | [%] | [ms] ---------------+--------+--------+--------- Poll:PRI Avg| 1.00| 0.0045| 0.004 Peak| | 0.0046| 0.064 ---------------+--------+--------+--------- RxCan1[010] Avg| 34.26| 2.2574| 0.021 Peak| | 2.2574| 4.609 ---------------+--------+--------+--------- RxCan1[030] Avg| 34.26| 2.3820| 0.021 Peak| | 2.3820| 1.135 ---------------+--------+--------+--------- RxCan1[041] Avg| 49.89| 1.2059| 0.021 Peak| | 1.2295| 5.331 ---------------+--------+--------+--------- RxCan1[049] Avg| 49.96| 1.2400| 0.030 Peak| | 1.2699| 1.402 ---------------+--------+--------+--------- RxCan1[04c] Avg| 49.92| 1.1752| 0.021 Peak| | 1.2072| 4.502 ---------------+--------+--------+--------- RxCan1[04d] Avg| 34.31| 2.4433| 0.022 Peak| | 2.4773| 1.368 ---------------+--------+--------+--------- RxCan1[076] Avg| 49.96| 1.2071| 0.024 Peak| | 1.2554| 2.007 ---------------+--------+--------+--------- RxCan1[077] Avg| 49.96| 1.2012| 0.022 Peak| | 1.2492| 1.955 ---------------+--------+--------+--------- RxCan1[07a] Avg| 34.35| 2.9251| 0.030 Peak| | 3.1103| 1.829 ---------------+--------+--------+--------- RxCan1[07d] Avg| 49.96| 1.1954| 0.022 Peak| | 1.2282| 1.074 ---------------+--------+--------+--------- RxCan1[0c8] Avg| 49.89| 1.2491| 0.021 Peak| | 1.3169| 1.181 ---------------+--------+--------+--------- RxCan1[11a] Avg| 34.39| 2.4423| 0.024 Peak| | 2.5693| 1.491 ---------------+--------+--------+--------- RxCan1[130] Avg| 49.95| 1.1312| 0.020 Peak| | 1.1684| 1.218 ---------------+--------+--------+--------- RxCan1[139] Avg| 49.92| 1.1547| 0.021 Peak| | 1.1778| 1.199 ---------------+--------+--------+--------- RxCan1[156] Avg| 9.96| 0.2391| 0.023 Peak| | 0.2591| 1.943 ---------------+--------+--------+--------- RxCan1[160] Avg| 49.96| 1.1657| 0.031 Peak| | 1.2017| 2.158 ---------------+--------+--------+--------- RxCan1[165] Avg| 49.96| 1.1257| 0.021 Peak| | 1.1652| 1.471 ---------------+--------+--------+--------- RxCan1[167] Avg| 34.31| 2.2871| 0.021 Peak| | 2.3374| 1.776 ---------------+--------+--------+--------- RxCan1[171] Avg| 49.96| 1.1879| 0.023 Peak| | 1.2268| 1.166 ---------------+--------+--------+--------- RxCan1[178] Avg| 10.00| 0.2371| 0.029 Peak| | 0.2459| 1.516 ---------------+--------+--------+--------- RxCan1[179] Avg| 10.00| 0.2196| 0.021 Peak| | 0.2260| 0.758 ---------------+--------+--------+--------- RxCan1[180] Avg| 49.96| 1.1703| 0.022 Peak| | 1.2103| 1.481 ---------------+--------+--------+--------- RxCan1[185] Avg| 49.95| 1.1127| 0.020 Peak| | 1.1636| 1.292 ---------------+--------+--------+--------- RxCan1[1a0] Avg| 49.96| 1.1009| 0.020 Peak| | 1.1468| 1.060 ---------------+--------+--------+--------- RxCan1[1e0] Avg| 49.96| 1.1744| 0.021 Peak| | 1.2027| 1.240 ---------------+--------+--------+--------- RxCan1[1e4] Avg| 49.96| 1.3733| 0.032 Peak| | 1.4085| 1.523 ---------------+--------+--------+--------- RxCan1[1f0] Avg| 33.30| 0.7625| 0.023 Peak| | 0.8004| 3.349 ---------------+--------+--------+--------- RxCan1[200] Avg| 49.92| 1.1462| 0.021 Peak| | 1.1809| 1.254 ---------------+--------+--------+--------- RxCan1[202] Avg| 34.39| 2.4034| 0.028 Peak| | 2.5611| 1.472 ---------------+--------+--------+--------- RxCan1[204] Avg| 34.30| 2.2541| 0.022 Peak| | 2.2924| 2.015 ---------------+--------+--------+--------- RxCan1[213] Avg| 49.96| 1.1599| 0.027 Peak| | 1.1794| 1.714 ---------------+--------+--------+--------- RxCan1[214] Avg| 49.96| 1.1537| 0.022 Peak| | 1.1941| 1.439 ---------------+--------+--------+--------- RxCan1[217] Avg| 34.39| 2.2490| 0.020 Peak| | 2.2856| 3.766 ---------------+--------+--------+--------- RxCan1[218] Avg| 49.96| 1.1291| 0.021 Peak| | 1.1646| 1.547 ---------------+--------+--------+--------- RxCan1[230] Avg| 49.96| 1.1272| 0.020 Peak| | 1.2237| 1.295 ---------------+--------+--------+--------- RxCan1[240] Avg| 10.00| 0.2191| 0.021 Peak| | 0.2226| 1.067 ---------------+--------+--------+--------- RxCan1[242] Avg| 24.96| 0.6911| 0.024 Peak| | 0.7161| 1.180 ---------------+--------+--------+--------- RxCan1[24a] Avg| 9.96| 0.2345| 0.024 Peak| | 0.2535| 0.779 ---------------+--------+--------+--------- RxCan1[24b] Avg| 9.96| 0.2433| 0.023 Peak| | 0.2697| 2.085 ---------------+--------+--------+--------- RxCan1[24c] Avg| 9.96| 0.3103| 0.029 Peak| | 0.3203| 0.809 ---------------+--------+--------+--------- RxCan1[25a] Avg| 10.00| 0.2346| 0.022 Peak| | 0.2405| 1.223 ---------------+--------+--------+--------- RxCan1[25b] Avg| 49.89| 1.2121| 0.020 Peak| | 1.3659| 19.523 ---------------+--------+--------+--------- RxCan1[25c] Avg| 34.31| 2.4193| 0.019 Peak| | 2.8022| 58.153 ---------------+--------+--------+--------- RxCan1[260] Avg| 9.93| 0.2149| 0.024 Peak| | 0.2174| 1.096 ---------------+--------+--------+--------- RxCan1[270] Avg| 49.96| 1.2042| 0.026 Peak| | 1.2755| 20.612 ---------------+--------+--------+--------- RxCan1[280] Avg| 49.96| 1.0922| 0.020 Peak| | 1.1312| 1.266 ---------------+--------+--------+--------- RxCan1[2e4] Avg| 19.96| 0.6942| 0.044 Peak| | 0.8604| 1.533 ---------------+--------+--------+--------- RxCan1[2ec] Avg| 10.00| 0.3727| 0.025 Peak| | 0.5154| 28.819 ---------------+--------+--------+--------- RxCan1[2ed] Avg| 10.00| 0.2298| 0.023 Peak| | 0.2378| 1.345 ---------------+--------+--------+--------- RxCan1[2ee] Avg| 9.96| 0.2172| 0.019 Peak| | 0.2210| 1.058 ---------------+--------+--------+--------- RxCan1[312] Avg| 10.00| 0.2206| 0.020 Peak| | 0.2396| 1.060 ---------------+--------+--------+--------- RxCan1[326] Avg| 9.96| 0.2099| 0.020 Peak| | 0.2158| 0.507 ---------------+--------+--------+--------- RxCan1[336] Avg| 1.00| 0.0212| 0.020 Peak| | 0.0233| 0.315 ---------------+--------+--------+--------- RxCan1[352] Avg| 6.64| 0.1675| 0.024 Peak| | 0.1818| 1.048 ---------------+--------+--------+--------- RxCan1[355] Avg| 2.00| 0.0540| 0.027 Peak| | 0.0619| 1.209 ---------------+--------+--------+--------- RxCan1[35e] Avg| 9.98| 0.2221| 0.021 Peak| | 0.2284| 1.186 ---------------+--------+--------+--------- RxCan1[365] Avg| 10.00| 0.2282| 0.023 Peak| | 0.2335| 0.769 ---------------+--------+--------+--------- RxCan1[366] Avg| 10.00| 0.3163| 0.022 Peak| | 0.6330| 23.587 ---------------+--------+--------+--------- RxCan1[367] Avg| 10.00| 0.2417| 0.021 Peak| | 0.2568| 1.417 ---------------+--------+--------+--------- RxCan1[368] Avg| 9.96| 0.2187| 0.019 Peak| | 0.2250| 1.135 ---------------+--------+--------+--------- RxCan1[369] Avg| 9.99| 0.2277| 0.021 Peak| | 0.2334| 0.667 ---------------+--------+--------+--------- RxCan1[380] Avg| 9.96| 0.2133| 0.020 Peak| | 0.2161| 0.560 ---------------+--------+--------+--------- RxCan1[38b] Avg| 24.92| 0.5622| 0.022 Peak| | 0.5716| 1.618 ---------------+--------+--------+--------- RxCan1[3b3] Avg| 10.00| 0.2132| 0.023 Peak| | 0.2194| 1.106 ---------------+--------+--------+--------- RxCan1[400] Avg| 4.00| 0.0885| 0.019 Peak| | 0.0885| 0.570 ---------------+--------+--------+--------- RxCan1[405] Avg| 3.70| 0.1414| 0.036 Peak| | 0.1414| 0.710 ---------------+--------+--------+--------- RxCan1[40a] Avg| 8.00| 0.1887| 0.021 Peak| | 0.1887| 1.027 ---------------+--------+--------+--------- RxCan1[410] Avg| 10.00| 0.2141| 0.023 Peak| | 0.2188| 0.984 ---------------+--------+--------+--------- RxCan1[411] Avg| 10.00| 0.2325| 0.023 Peak| | 0.2447| 0.660 ---------------+--------+--------+--------- RxCan1[416] Avg| 10.00| 0.2326| 0.022 Peak| | 0.2389| 0.774 ---------------+--------+--------+--------- RxCan1[421] Avg| 10.00| 0.2245| 0.021 Peak| | 0.2271| 1.160 ---------------+--------+--------+--------- RxCan1[42d] Avg| 10.00| 0.2315| 0.021 Peak| | 0.2411| 0.677 ---------------+--------+--------+--------- RxCan1[42f] Avg| 10.00| 0.2480| 0.020 Peak| | 0.2975| 8.093 ---------------+--------+--------+--------- RxCan1[430] Avg| 10.00| 0.2203| 0.019 Peak| | 0.2302| 0.847 ---------------+--------+--------+--------- RxCan1[434] Avg| 10.00| 0.2331| 0.019 Peak| | 0.2620| 1.150 ---------------+--------+--------+--------- RxCan1[435] Avg| 6.68| 0.1445| 0.020 Peak| | 0.1486| 1.063 ---------------+--------+--------+--------- RxCan1[43e] Avg| 20.00| 0.4515| 0.021 Peak| | 0.4632| 1.013 ---------------+--------+--------+--------- RxCan1[440] Avg| 1.00| 0.0210| 0.019 Peak| | 0.0218| 0.294 ---------------+--------+--------+--------- RxCan1[465] Avg| 0.95| 0.0214| 0.023 Peak| | 0.0215| 0.587 ---------------+--------+--------+--------- RxCan1[466] Avg| 0.95| 0.0211| 0.021 Peak| | 0.0215| 0.350 ---------------+--------+--------+--------- RxCan1[467] Avg| 0.95| 0.0191| 0.020 Peak| | 0.0201| 0.444 ---------------+--------+--------+--------- RxCan1[472] Avg| 0.68| 0.0588| 0.085 Peak| | 0.0606| 1.170 ---------------+--------+--------+--------- RxCan1[473] Avg| 0.66| 0.0407| 0.062 Peak| | 0.0492| 1.329 ---------------+--------+--------+--------- RxCan1[474] Avg| 1.00| 0.0218| 0.021 Peak| | 0.0237| 0.278 ---------------+--------+--------+--------- RxCan1[475] Avg| 1.96| 0.0466| 0.024 Peak| | 0.0570| 1.112 ---------------+--------+--------+--------- RxCan1[476] Avg| 2.00| 0.0454| 0.020 Peak| | 0.0497| 0.409 ---------------+--------+--------+--------- RxCan1[477] Avg| 2.00| 0.0497| 0.022 Peak| | 0.0595| 0.864 ---------------+--------+--------+--------- RxCan1[595] Avg| 1.00| 0.0223| 0.021 Peak| | 0.0241| 0.296 ---------------+--------+--------+--------- RxCan1[59e] Avg| 1.00| 0.0233| 0.024 Peak| | 0.0289| 0.713 ---------------+--------+--------+--------- RxCan1[5a2] Avg| 1.00| 0.0200| 0.020 Peak| | 0.0204| 0.264 ---------------+--------+--------+--------- RxCan1[5ba] Avg| 1.00| 0.0206| 0.021 Peak| | 0.0238| 0.515 ---------------+--------+--------+--------- RxCan2[020] Avg| 33.30| 0.7938| 0.022 Peak| | 0.7938| 4.793 ---------------+--------+--------+--------- RxCan2[030] Avg| 22.20| 0.5229| 0.022 Peak| | 0.5229| 0.985 ---------------+--------+--------+--------- RxCan2[03a] Avg| 19.90| 0.4700| 0.022 Peak| | 0.4700| 0.804 ---------------+--------+--------+--------- RxCan2[040] Avg| 19.90| 0.4678| 0.023 Peak| | 0.4678| 1.222 ---------------+--------+--------+--------- RxCan2[060] Avg| 20.00| 0.6480| 0.050 Peak| | 0.6480| 20.997 ---------------+--------+--------+--------- RxCan2[070] Avg| 16.60| 0.3944| 0.022 Peak| | 0.3944| 1.053 ---------------+--------+--------+--------- RxCan2[080] Avg| 16.70| 0.7032| 0.041 Peak| | 0.7032| 1.611 ---------------+--------+--------+--------- RxCan2[083] Avg| 20.10| 0.4329| 0.021 Peak| | 0.4329| 0.520 ---------------+--------+--------+--------- RxCan2[090] Avg| 24.90| 0.5674| 0.017 Peak| | 0.5674| 1.149 ---------------+--------+--------+--------- RxCan2[0a0] Avg| 16.60| 0.3836| 0.023 Peak| | 0.3836| 0.933 ---------------+--------+--------+--------- RxCan2[100] Avg| 16.50| 0.3661| 0.021 Peak| | 0.3661| 0.740 ---------------+--------+--------+--------- RxCan2[108] Avg| 24.90| 0.5923| 0.025 Peak| | 0.5923| 0.859 ---------------+--------+--------+--------- RxCan2[110] Avg| 16.70| 0.3906| 0.023 Peak| | 0.3906| 0.697 ---------------+--------+--------+--------- RxCan2[130] Avg| 14.40| 0.3341| 0.022 Peak| | 0.3341| 0.829 ---------------+--------+--------+--------- RxCan2[150] Avg| 16.50| 0.4025| 0.020 Peak| | 0.4025| 1.120 ---------------+--------+--------+--------- RxCan2[160] Avg| 4.90| 0.1252| 0.025 Peak| | 0.1252| 0.502 ---------------+--------+--------+--------- RxCan2[180] Avg| 16.60| 0.3899| 0.023 Peak| | 0.3899| 0.799 ---------------+--------+--------+--------- RxCan2[190] Avg| 16.60| 0.3892| 0.025 Peak| | 0.3892| 1.172 ---------------+--------+--------+--------- RxCan2[1a0] Avg| 1.00| 0.0281| 0.025 Peak| | 0.0281| 0.695 ---------------+--------+--------+--------- RxCan2[1a4] Avg| 20.00| 0.4525| 0.022 Peak| | 0.4525| 1.231 ---------------+--------+--------+--------- RxCan2[1a8] Avg| 12.50| 0.2886| 0.020 Peak| | 0.2886| 1.048 ---------------+--------+--------+--------- RxCan2[1b0] Avg| 10.00| 0.2300| 0.023 Peak| | 0.2300| 0.579 ---------------+--------+--------+--------- RxCan2[1b4] Avg| 10.00| 0.2334| 0.022 Peak| | 0.2334| 0.947 ---------------+--------+--------+--------- RxCan2[1b8] Avg| 12.40| 0.2970| 0.023 Peak| | 0.2970| 0.909 ---------------+--------+--------+--------- RxCan2[1c0] Avg| 10.00| 0.2257| 0.021 Peak| | 0.2257| 0.983 ---------------+--------+--------+--------- RxCan2[1e0] Avg| 10.00| 0.2141| 0.023 Peak| | 0.2141| 0.556 ---------------+--------+--------+--------- RxCan2[215] Avg| 8.30| 0.2047| 0.025 Peak| | 0.2047| 0.786 ---------------+--------+--------+--------- RxCan2[217] Avg| 8.30| 0.2033| 0.022 Peak| | 0.2033| 1.135 ---------------+--------+--------+--------- RxCan2[220] Avg| 6.70| 0.1647| 0.020 Peak| | 0.1647| 0.961 ---------------+--------+--------+--------- RxCan2[225] Avg| 24.90| 0.6136| 0.026 Peak| | 0.6136| 1.018 ---------------+--------+--------+--------- RxCan2[230] Avg| 6.70| 0.4045| 0.057 Peak| | 0.4045| 1.532 ---------------+--------+--------+--------- RxCan2[240] Avg| 8.20| 0.1849| 0.021 Peak| | 0.1849| 0.510 ---------------+--------+--------+--------- RxCan2[241] Avg| 20.00| 0.4312| 0.021 Peak| | 0.4312| 5.110 ---------------+--------+--------+--------- RxCan2[250] Avg| 5.00| 0.1072| 0.021 Peak| | 0.1072| 0.320 ---------------+--------+--------+--------- RxCan2[255] Avg| 12.50| 0.3091| 0.022 Peak| | 0.3091| 0.904 ---------------+--------+--------+--------- RxCan2[265] Avg| 12.50| 0.2819| 0.021 Peak| | 0.2819| 1.035 ---------------+--------+--------+--------- RxCan2[270] Avg| 5.00| 0.1189| 0.022 Peak| | 0.1189| 0.631 ---------------+--------+--------+--------- RxCan2[290] Avg| 3.30| 0.0740| 0.023 Peak| | 0.0740| 0.455 ---------------+--------+--------+--------- RxCan2[295] Avg| 6.60| 0.1431| 0.023 Peak| | 0.1431| 0.504 ---------------+--------+--------+--------- RxCan2[2a0] Avg| 3.30| 0.0686| 0.020 Peak| | 0.0686| 0.445 ---------------+--------+--------+--------- RxCan2[2a7] Avg| 12.50| 0.2869| 0.021 Peak| | 0.2869| 0.660 ---------------+--------+--------+--------- RxCan2[2b0] Avg| 3.20| 0.0707| 0.023 Peak| | 0.0707| 0.331 ---------------+--------+--------+--------- RxCan2[2c0] Avg| 3.20| 0.0988| 0.026 Peak| | 0.0988| 0.932 ---------------+--------+--------+--------- RxCan2[2e0] Avg| 1.60| 0.0388| 0.024 Peak| | 0.0388| 0.393 ---------------+--------+--------+--------- RxCan2[2f0] Avg| 1.70| 0.0376| 0.021 Peak| | 0.0376| 0.282 ---------------+--------+--------+--------- RxCan2[2f5] Avg| 12.50| 0.2833| 0.021 Peak| | 0.2833| 0.855 ---------------+--------+--------+--------- RxCan2[300] Avg| 1.70| 0.0398| 0.023 Peak| | 0.0398| 0.488 ---------------+--------+--------+--------- RxCan2[310] Avg| 1.60| 0.0480| 0.026 Peak| | 0.0480| 0.937 ---------------+--------+--------+--------- RxCan2[320] Avg| 1.70| 0.0346| 0.020 Peak| | 0.0346| 0.370 ---------------+--------+--------+--------- RxCan2[326] Avg| 9.90| 0.2200| 0.022 Peak| | 0.2200| 0.502 ---------------+--------+--------+--------- RxCan2[330] Avg| 32.30| 0.7323| 0.021 Peak| | 0.7323| 1.130 ---------------+--------+--------+--------- RxCan2[340] Avg| 8.20| 0.2375| 0.028 Peak| | 0.2375| 0.578 ---------------+--------+--------+--------- RxCan2[345] Avg| 1.60| 0.0393| 0.022 Peak| | 0.0393| 0.590 ---------------+--------+--------+--------- RxCan2[35e] Avg| 5.00| 0.1303| 0.023 Peak| | 0.1303| 0.943 ---------------+--------+--------+--------- RxCan2[360] Avg| 1.70| 0.0381| 0.025 Peak| | 0.0381| 0.922 ---------------+--------+--------+--------- RxCan2[361] Avg| 8.20| 0.1907| 0.023 Peak| | 0.1907| 1.119 ---------------+--------+--------+--------- RxCan2[363] Avg| 1.30| 0.0337| 0.024 Peak| | 0.0337| 0.425 ---------------+--------+--------+--------- RxCan2[370] Avg| 0.90| 0.0194| 0.022 Peak| | 0.0194| 0.246 ---------------+--------+--------+--------- RxCan2[381] Avg| 3.20| 0.0684| 0.024 Peak| | 0.0684| 0.828 ---------------+--------+--------+--------- RxCan2[3a0] Avg| 16.60| 0.3734| 0.022 Peak| | 0.3734| 0.636 ---------------+--------+--------+--------- RxCan2[3d0] Avg| 10.00| 0.2262| 0.023 Peak| | 0.2262| 0.663 ---------------+--------+--------+--------- RxCan2[3d5] Avg| 5.60| 0.1335| 0.022 Peak| | 0.1335| 1.222 ---------------+--------+--------+--------- RxCan2[400] Avg| 4.00| 0.0949| 0.022 Peak| | 0.0949| 0.715 ---------------+--------+--------+--------- RxCan2[405] Avg| 3.70| 0.0861| 0.022 Peak| | 0.0861| 0.443 ---------------+--------+--------+--------- RxCan2[40a] Avg| 8.00| 0.1853| 0.021 Peak| | 0.1853| 0.552 ---------------+--------+--------+--------- RxCan2[415] Avg| 1.60| 0.0341| 0.021 Peak| | 0.0341| 0.273 ---------------+--------+--------+--------- RxCan2[435] Avg| 0.90| 0.0220| 0.025 Peak| | 0.0220| 0.354 ---------------+--------+--------+--------- RxCan2[440] Avg| 0.90| 0.0199| 0.021 Peak| | 0.0199| 0.266 ---------------+--------+--------+--------- RxCan2[465] Avg| 0.90| 0.0234| 0.028 Peak| | 0.0234| 0.633 ---------------+--------+--------+--------- RxCan2[466] Avg| 1.00| 0.0222| 0.021 Peak| | 0.0222| 0.322 ---------------+--------+--------+--------- RxCan2[467] Avg| 1.00| 0.0221| 0.020 Peak| | 0.0221| 0.355 ---------------+--------+--------+--------- RxCan2[501] Avg| 1.50| 0.0335| 0.023 Peak| | 0.0335| 0.393 ---------------+--------+--------+--------- RxCan2[503] Avg| 1.50| 0.0370| 0.022 Peak| | 0.0370| 0.546 ---------------+--------+--------+--------- RxCan2[504] Avg| 1.40| 0.0328| 0.022 Peak| | 0.0328| 0.489 ---------------+--------+--------+--------- RxCan2[505] Avg| 1.40| 0.0290| 0.021 Peak| | 0.0290| 0.354 ---------------+--------+--------+--------- RxCan2[508] Avg| 1.40| 0.0318| 0.023 Peak| | 0.0318| 0.408 ---------------+--------+--------+--------- RxCan2[511] Avg| 1.40| 0.0306| 0.022 Peak| | 0.0306| 0.328 ---------------+--------+--------+--------- RxCan2[51e] Avg| 1.40| 0.0310| 0.022 Peak| | 0.0310| 0.269 ---------------+--------+--------+--------- RxCan2[581] Avg| 1.00| 0.0222| 0.022 Peak| | 0.0222| 0.256 ---------------+--------+--------+--------- Cmd:State Avg| 0.00| 0.0000| 0.002 Peak| | 0.0000| 0.024 ===============+========+========+========= Total Avg| 2795.57| 82.7745| 40.174
Cheers, Simon
Am 17.01.2025 um 17:49 schrieb Michael Balzer via OvmsDev:
OK, I've got a new idea: CAN timing.
Comparing our esp32can bit timing to the esp-idf driver's, there seem to be some differences:
https://github.com/espressif/esp-idf/blob/master/components/hal/include/hal/...
Transceivers are normally tolerant to small timing offsets. Maybe being off a little bit has no effect under normal conditions, but it has when the transceiver has to cope with a filled RX queue. That could be causing the transceiver to slide just out of sync. If the timing gets garbled, the transceiver would signal errors in the packets to the bus, possibly so many the vehicle ECUs decide to raise an error condition.
Is that plausible?
On why the new poller could be causing this (in combination with too slow processing by the vehicle): as mentioned, the standard CAN listener mechanism doesn't care about queue overflows. The poller does. `OvmsPollers::Queue_PollerFrame()` does a log call when Tx/Rx tracing is enabled, that could even block, but tracing is optional and only meant for debugging. Not optional is the overflow counting using an atomic uint32.
The atomic types are said to be fast, but I never checked their actual implementation on the ESP32. Maybe they can block as well?
@Simon: it would be an option to try commenting out the overflow counting, to see if that's causing the issue.
Regards, Michael
Am 17.01.25 um 15:37 schrieb Chris Box via OvmsDev:
Yes, I can confirm I've had one experience of the Leaf switching to Neutral while driving, with a yellow warning symbol on the dash. It refused to reselect Drive until I had switched the car off and back on. Derek wasn't so lucky and he need to clear fault codes before the car would work.
On returning home, I found OVMS was not accessible over a network. I didn't try a USB cable. Unplugging and reinserting the OBD cable caused OVMS to rejoin Wi-Fi. However the SD logs showed nothing from the time of the event. CAN writes are enabled, so it can perform SOC limiting.
My car has been using this firmware since 21st November, based on the git master of that day. As a relatively new user of OVMS (only since October) I don't have much experience of older firmware.
Perhaps a safeguard should be implemented before releasing a new stable firmware that will be automatically downloaded by Leaf owners. But I don't have the expertise to know what that safeguard should be. Derek's suggestion of 'only CAN write when parked' appears to be a good idea.
Chris
On 2025-01-15 18:18, Derek Caudwell via OvmsDev wrote:
Since the following email I have high confidence the issue on the Leaf is related/caused by the poller as there has been no further occurrence and Chris has also experienced the car going to neutral on the new poller firmware.
.... I haven't ruled out it being a fault with my car yet. Shortly after it faulted the car was run into so has been off the road for sometime, my first step was to replace 12V battery. The ovms unit is now unplugged and if it does not fault over the next month while driving I'll be reasonably confident it's ovms related.
Not sure which firmware version the poller updates were included in but it was only after upgrading to it that the errors occurred (which could be coincidental however it has faulted twice more both on version 3.3.004-141-gf729d82c). For periods where I reverted to 3.3.003 it was fine.
It might be useful to have an extra option on the enable can write to only enable it when the car is parked/charging.
_______________________________________________ OvmsDev mailing listOvmsDev@lists.openvehicles.comhttp://lists.openvehicles.com/mailman/listinfo/ovmsdev
-- Michael Balzer * Am Rahmen 5 * D-58313 Herdecke Fon 02330 9104094 * Handy 0176 20698926
_______________________________________________ OvmsDev mailing listOvmsDev@lists.openvehicles.comhttp://lists.openvehicles.com/mailman/listinfo/ovmsdev
_______________________________________________ OvmsDev mailing listOvmsDev@lists.openvehicles.comhttp://lists.openvehicles.com/mailman/listinfo/ovmsdev
-- Michael Balzer * Am Rahmen 5 * D-58313 Herdecke Fon 02330 9104094 * Handy 0176 20698926
_______________________________________________ OvmsDev mailing list OvmsDev@lists.openvehicles.com http://lists.openvehicles.com/mailman/listinfo/ovmsdev
P/R Created https://github.com/openvehicles/Open-Vehicle-Monitoring-System-3/pull/1100 Let me know if you want me to split it up or ANY changes and I'll get onto it asap. Maybe somebody could grab the code and check it out in the context of specifying some filters. This will prevent those messages from coming to the vehicle implementation at all.. and even from going through the poller queue. It is non-blocking meaning that the filter is briefly inopperational while the filter is being modified. //. On Sun, 19 Jan 2025 at 11:02, Michael Geddes <frog@bunyip.wheelycreek.net> wrote:
On Sat, 18 Jan 2025 at 17:08, Michael Balzer via OvmsDev < ovmsdev@lists.openvehicles.com> wrote:
I have commented out the line with the Atomic_Increment statement. Now I no longer receive any messages with “RX Task Queue Overflow Run” Here is the output of poller times status:
The main question is if you still get the CAN bus crash (vehicle running into issues) with that modification in active mode. Timing statistics were not expected to change.
I have a feeling that the atomic operations are along the lines of:
* Set Interrupts off * atomic operation * Set interrupts on
Which means no real 'blocking' .. just not allowing interrupts and therefor task switching for a couple of instructions.
Nearly 2800 frames per second is quite a lot, and most is on can1 with many frame periods at 20 ms. Yet the total processing time averages at 30-40 ms, so there is no actual CPU capacity issue for that amount of frames.
@Derek: can you please supply these statistics for the Leaf in drive mode as well?
Am 18.01.25 um 02:42 schrieb Michael Geddes via OvmsDev:
Maybe try setting CONFIG_OVMS_VEHICLE_CAN_RX_QUEUE_SIZE = 160 and see if that reduces the overflow?
Simons car sends at least 91 process data frame IDs on can1 and 84 on can2. Worst case would be these come all in within the shortest possible time span, that would mean the queue needs to be able to hold 175 frames. I'd add some headroom and round up to 200.
But keep in mind, if the Incoming processing actually occasionally gets blocked for up to 60 ms -- as indicated by Simons statistics --, the queue may need to be twice as large.
Am 18.01.25 um 02:42 schrieb Michael Geddes via OvmsDev:
I was thinking that the frame filter would be here: void OvmsPollers::PollerRxCallback(const CAN_frame_t* frame, bool success) { Queue_PollerFrame(*frame, success, false); } which I guess is executed in the task handling the CAN queue. (we don't know how many frames get dropped there).
Actually we do know that, or at least have some indication, as we count the CAN transceiver queue overruns. That info is included as "Rx overflw" in the can status output & as "rxovr" in the logs.
Adding a filter before queueing the frame would exclude the filtered IDs from all vehicle processing. I meant adding a filter just to exclude IDs from the timing statistics, assuming those are the culprits, as Simon wrote the issue only appears after enabling the timing statistics and printing them. That's why I asked if printing might need to lock the statistics for too long in case of such a long list.
Completely blocking ID ranges from processing by the vehicle should normally not be necessary, unless the Incoming handler is written very poorly.
Yet, if we add that, a mutex in the CAN RX callback must be avoided, or would need to be non-blocking:
The only real concern is thread safety between checking and adding to the filter - so the check itself might have to be mutexed. void OvmsPollers::PollerRxCallback(const CAN_frame_t* frame, bool success) { // Check filter { OvmsRecMutexLock lock(&m_filter_mutex); if (! m_filter->IsFiltered(frame)) return; } Queue_PollerFrame(*frame, success, false); }
A mutex like that could block the CAN task, which must be avoided at all cost. I introduced CAN callbacks for vehicles & applications that need to react to certain frames as fast as possible, e.g. to maintain control precedence, so cannot use the standard CAN listener mechanism (frame queueing).
The current poller callback use is OK, if (!) the atomic type really isn't the culprit, ie doesn't block.
So if (!) an ID filter needs to be added before queueing, it needs to be done in a way that needs no mutex. But I don't see an issue with the vehicle passing a fixed filter when registering with the poller/buses. The filter doesn't need to by mutable on the fly.
Regards, Michael
Am 17.01.25 um 19:42 schrieb Simon Ehlen via OvmsDev:
The poller statistics can help you track this down, but you need to have at least 10 seconds of statistics, the more the better. Rule of thumb: PRI average at 0.0/second means you don't have enough data yet.
There were again many messages with “RX Task Queue Overflow Run”. Here are the statistics of poller times status:
OVMS# poll times status Poller timing is: on Type | count | Utlztn | Time | per s | [%] | [ms] ---------------+--------+--------+--------- Poll:PRI Avg| 1.00| 0.0043| 0.004 Peak| | 0.0043| 0.052 ---------------+--------+--------+--------- RxCan1[010] Avg| 34.26| 1.6741| 0.015 Peak| | 1.6741| 1.182 ---------------+--------+--------+--------- RxCan1[030] Avg| 34.06| 1.7085| 0.020 Peak| | 1.7085| 1.390 ---------------+--------+--------+--------- RxCan1[041] Avg| 49.89| 0.8109| 0.016 Peak| | 0.8541| 1.098 ---------------+--------+--------+--------- RxCan1[049] Avg| 50.00| 1.5970| 0.019 Peak| | 1.7154| 32.233 ---------------+--------+--------+--------- RxCan1[04c] Avg| 49.92| 0.8340| 0.014 Peak| | 0.8933| 1.995 ---------------+--------+--------+--------- RxCan1[04d] Avg| 34.43| 1.6211| 0.014 Peak| | 1.6756| 1.318 ---------------+--------+--------+--------- RxCan1[076] Avg| 50.00| 0.8362| 0.024 Peak| | 0.8784| 2.185 ---------------+--------+--------+--------- RxCan1[077] Avg| 50.00| 0.7837| 0.014 Peak| | 0.8083| 1.156 ---------------+--------+--------+--------- RxCan1[07a] Avg| 34.31| 2.1870| 0.017 Peak| | 2.3252| 1.888 ---------------+--------+--------+--------- RxCan1[07d] Avg| 50.00| 0.8001| 0.013 Peak| | 0.8434| 1.150 ---------------+--------+--------+--------- RxCan1[0c8] Avg| 49.96| 0.8359| 0.013 Peak| | 0.8715| 1.171 ---------------+--------+--------+--------- RxCan1[11a] Avg| 34.35| 1.6701| 0.020 Peak| | 1.6981| 1.273 ---------------+--------+--------+--------- RxCan1[130] Avg| 50.00| 0.7902| 0.018 Peak| | 0.8513| 0.980 ---------------+--------+--------+--------- RxCan1[139] Avg| 49.92| 0.7872| 0.013 Peak| | 0.8219| 0.795 ---------------+--------+--------+--------- RxCan1[156] Avg| 10.00| 0.1620| 0.014 Peak| | 0.1729| 0.919 ---------------+--------+--------+--------- RxCan1[160] Avg| 50.04| 0.7977| 0.014 Peak| | 0.8232| 1.495 ---------------+--------+--------+--------- RxCan1[165] Avg| 49.85| 0.7976| 0.014 Peak| | 0.8486| 1.015 ---------------+--------+--------+--------- RxCan1[167] Avg| 34.39| 1.6025| 0.016 Peak| | 1.6888| 1.354 ---------------+--------+--------+--------- RxCan1[171] Avg| 50.00| 0.8150| 0.017 Peak| | 0.8488| 1.091 ---------------+--------+--------+--------- RxCan1[178] Avg| 10.00| 0.1614| 0.014 Peak| | 0.1702| 0.903 ---------------+--------+--------+--------- RxCan1[179] Avg| 10.00| 0.1630| 0.017 Peak| | 0.1663| 1.336 ---------------+--------+--------+--------- RxCan1[180] Avg| 50.00| 0.8137| 0.014 Peak| | 0.8605| 1.566 ---------------+--------+--------+--------- RxCan1[185] Avg| 50.04| 0.8033| 0.013 Peak| | 0.8393| 1.126 ---------------+--------+--------+--------- RxCan1[1a0] Avg| 49.92| 0.7748| 0.013 Peak| | 0.8169| 1.184 ---------------+--------+--------+--------- RxCan1[1e0] Avg| 49.92| 0.7738| 0.014 Peak| | 0.8028| 1.049 ---------------+--------+--------+--------- RxCan1[1e4] Avg| 49.89| 0.9692| 0.018 Peak| | 1.0096| 1.332 ---------------+--------+--------+--------- RxCan1[1f0] Avg| 33.22| 0.5544| 0.014 Peak| | 0.5855| 0.848 ---------------+--------+--------+--------- RxCan1[200] Avg| 49.92| 0.7879| 0.015 Peak| | 0.8345| 1.206 ---------------+--------+--------+--------- RxCan1[202] Avg| 34.28| 1.7075| 0.016 Peak| | 1.7874| 1.218 ---------------+--------+--------+--------- RxCan1[204] Avg| 34.35| 1.5641| 0.013 Peak| | 1.6427| 1.235 ---------------+--------+--------+--------- RxCan1[213] Avg| 49.89| 0.7814| 0.015 Peak| | 0.8232| 0.910 ---------------+--------+--------+--------- RxCan1[214] Avg| 49.92| 0.7736| 0.014 Peak| | 0.8216| 0.800 ---------------+--------+--------+--------- RxCan1[217] Avg| 34.31| 1.6294| 0.014 Peak| | 1.7165| 1.153 ---------------+--------+--------+--------- RxCan1[218] Avg| 49.86| 0.7877| 0.013 Peak| | 0.8290| 1.068 ---------------+--------+--------+--------- RxCan1[230] Avg| 50.00| 0.7596| 0.014 Peak| | 0.7660| 1.021 ---------------+--------+--------+--------- RxCan1[240] Avg| 10.00| 0.1669| 0.013 Peak| | 0.1835| 0.887 ---------------+--------+--------+--------- RxCan1[242] Avg| 24.96| 0.4764| 0.020 Peak| | 0.4963| 1.501 ---------------+--------+--------+--------- RxCan1[24a] Avg| 9.89| 0.1789| 0.015 Peak| | 0.2009| 0.874 ---------------+--------+--------+--------- RxCan1[24b] Avg| 9.89| 0.1702| 0.014 Peak| | 0.1870| 1.195 ---------------+--------+--------+--------- RxCan1[24c] Avg| 9.89| 0.2146| 0.019 Peak| | 0.2187| 1.242 ---------------+--------+--------+--------- RxCan1[25a] Avg| 10.00| 0.1603| 0.013 Peak| | 0.1667| 0.720 ---------------+--------+--------+--------- RxCan1[25b] Avg| 49.94| 0.7918| 0.017 Peak| | 0.8454| 1.666 ---------------+--------+--------+--------- RxCan1[25c] Avg| 34.24| 1.5331| 0.013 Peak| | 1.5997| 1.538 ---------------+--------+--------+--------- RxCan1[260] Avg| 10.00| 0.1626| 0.014 Peak| | 0.1682| 0.718 ---------------+--------+--------+--------- RxCan1[270] Avg| 49.90| 0.8120| 0.014 Peak| | 0.8460| 1.671 ---------------+--------+--------+--------- RxCan1[280] Avg| 49.92| 0.7777| 0.019 Peak| | 0.8447| 1.157 ---------------+--------+--------+--------- RxCan1[2e4] Avg| 19.89| 0.5778| 0.032 Peak| | 0.6648| 2.226 ---------------+--------+--------+--------- RxCan1[2ec] Avg| 10.00| 0.1701| 0.014 Peak| | 0.1755| 0.928 ---------------+--------+--------+--------- RxCan1[2ed] Avg| 10.00| 0.1650| 0.013 Peak| | 0.1747| 0.917 ---------------+--------+--------+--------- RxCan1[2ee] Avg| 9.98| 0.1544| 0.013 Peak| | 0.1588| 1.312 ---------------+--------+--------+--------- RxCan1[312] Avg| 10.00| 0.1648| 0.017 Peak| | 0.1690| 0.922 ---------------+--------+--------+--------- RxCan1[326] Avg| 9.89| 0.1603| 0.015 Peak| | 0.1833| 1.230 ---------------+--------+--------+--------- RxCan1[336] Avg| 1.00| 0.0146| 0.015 Peak| | 0.0150| 0.349 ---------------+--------+--------+--------- RxCan1[352] Avg| 6.66| 0.1223| 0.022 Peak| | 0.1338| 1.015 ---------------+--------+--------+--------- RxCan1[355] Avg| 2.00| 0.0424| 0.019 Peak| | 0.0431| 0.786 ---------------+--------+--------+--------- RxCan1[35e] Avg| 9.96| 0.1570| 0.013 Peak| | 0.1644| 0.579 ---------------+--------+--------+--------- RxCan1[365] Avg| 10.00| 0.1600| 0.014 Peak| | 0.1653| 0.961 ---------------+--------+--------+--------- RxCan1[366] Avg| 10.00| 0.1716| 0.013 Peak| | 0.1890| 0.987 ---------------+--------+--------+--------- RxCan1[367] Avg| 9.93| 0.1793| 0.015 Peak| | 0.1864| 0.984 ---------------+--------+--------+--------- RxCan1[368] Avg| 10.00| 0.1645| 0.014 Peak| | 0.1778| 0.768 ---------------+--------+--------+--------- RxCan1[369] Avg| 10.00| 0.1562| 0.016 Peak| | 0.1606| 0.724 ---------------+--------+--------+--------- RxCan1[380] Avg| 10.00| 0.1619| 0.014 Peak| | 0.1644| 0.605 ---------------+--------+--------+--------- RxCan1[38b] Avg| 25.00| 0.3991| 0.016 Peak| | 0.4280| 1.448 ---------------+--------+--------+--------- RxCan1[3b3] Avg| 10.00| 0.1537| 0.013 Peak| | 0.1610| 0.380 ---------------+--------+--------+--------- RxCan1[400] Avg| 4.00| 0.0626| 0.014 Peak| | 0.0626| 0.251 ---------------+--------+--------+--------- RxCan1[405] Avg| 3.90| 0.1019| 0.028 Peak| | 0.1019| 0.781 ---------------+--------+--------+--------- RxCan1[40a] Avg| 7.90| 0.1256| 0.020 Peak| | 0.1256| 0.991 ---------------+--------+--------+--------- RxCan1[410] Avg| 10.00| 0.1643| 0.016 Peak| | 0.1839| 1.634 ---------------+--------+--------+--------- RxCan1[411] Avg| 10.00| 0.1532| 0.013 Peak| | 0.1645| 0.824 ---------------+--------+--------+--------- RxCan1[416] Avg| 10.00| 0.1516| 0.016 Peak| | 0.1582| 0.807 ---------------+--------+--------+--------- RxCan1[421] Avg| 10.00| 0.1648| 0.013 Peak| | 0.1740| 0.839 ---------------+--------+--------+--------- RxCan1[42d] Avg| 10.00| 0.1548| 0.014 Peak| | 0.1658| 0.741 ---------------+--------+--------+--------- RxCan1[42f] Avg| 10.00| 0.1527| 0.013 Peak| | 0.1578| 0.667 ---------------+--------+--------+--------- RxCan1[430] Avg| 10.00| 0.1730| 0.016 Peak| | 0.1880| 1.209 ---------------+--------+--------+--------- RxCan1[434] Avg| 10.00| 0.1620| 0.021 Peak| | 0.1712| 1.140 ---------------+--------+--------+--------- RxCan1[435] Avg| 6.66| 0.1104| 0.014 Peak| | 0.1121| 1.011 ---------------+--------+--------+--------- RxCan1[43e] Avg| 20.00| 0.3194| 0.013 Peak| | 0.3434| 1.212 ---------------+--------+--------+--------- RxCan1[440] Avg| 1.00| 0.0160| 0.014 Peak| | 0.0175| 0.315 ---------------+--------+--------+--------- RxCan1[465] Avg| 1.00| 0.0172| 0.015 Peak| | 0.0194| 0.404 ---------------+--------+--------+--------- RxCan1[466] Avg| 1.00| 0.0198| 0.015 Peak| | 0.0252| 0.890 ---------------+--------+--------+--------- RxCan1[467] Avg| 1.00| 0.0152| 0.014 Peak| | 0.0160| 0.217 ---------------+--------+--------+--------- RxCan1[472] Avg| 0.70| 0.0533| 0.075 Peak| | 0.0546| 0.990 ---------------+--------+--------+--------- RxCan1[473] Avg| 0.65| 0.0325| 0.051 Peak| | 0.0361| 0.774 ---------------+--------+--------+--------- RxCan1[474] Avg| 1.00| 0.0146| 0.014 Peak| | 0.0151| 0.189 ---------------+--------+--------+--------- RxCan1[475] Avg| 2.00| 0.0332| 0.015 Peak| | 0.0362| 0.513 ---------------+--------+--------+--------- RxCan1[476] Avg| 2.00| 0.0305| 0.014 Peak| | 0.0307| 0.249 ---------------+--------+--------+--------- RxCan1[477] Avg| 2.00| 0.0309| 0.014 Peak| | 0.0311| 0.438 ---------------+--------+--------+--------- RxCan1[595] Avg| 1.00| 0.0151| 0.014 Peak| | 0.0160| 0.230 ---------------+--------+--------+--------- RxCan1[59e] Avg| 1.00| 0.0179| 0.015 Peak| | 0.0209| 0.716 ---------------+--------+--------+--------- RxCan1[5a2] Avg| 1.00| 0.0154| 0.016 Peak| | 0.0184| 0.699 ---------------+--------+--------+--------- RxCan1[5ba] Avg| 1.00| 0.0159| 0.017 Peak| | 0.0174| 0.485 ---------------+--------+--------+--------- RxCan2[010] Avg| 0.00| 0.0000| 0.015 Peak| | 0.0000| 0.146 ---------------+--------+--------+--------- RxCan2[020] Avg| 31.10| 0.5159| 0.015 Peak| | 0.5730| 0.992 ---------------+--------+--------+--------- RxCan2[030] Avg| 20.70| 0.3506| 0.016 Peak| | 0.3956| 1.055 ---------------+--------+--------+--------- RxCan2[03a] Avg| 18.65| 0.3157| 0.014 Peak| | 0.3292| 0.702 ---------------+--------+--------+--------- RxCan2[040] Avg| 18.60| 0.3111| 0.015 Peak| | 0.3474| 0.953 ---------------+--------+--------+--------- RxCan2[060] Avg| 18.60| 0.3182| 0.014 Peak| | 0.3569| 0.694 ---------------+--------+--------+--------- RxCan2[070] Avg| 15.55| 0.4581| 0.017 Peak| | 0.6859| 39.212 ---------------+--------+--------+--------- RxCan2[080] Avg| 15.50| 0.5041| 0.029 Peak| | 0.5414| 1.555 ---------------+--------+--------+--------- RxCan2[083] Avg| 18.70| 0.3083| 0.014 Peak| | 0.3325| 0.557 ---------------+--------+--------+--------- RxCan2[090] Avg| 23.40| 0.3961| 0.014 Peak| | 0.4445| 1.218 ---------------+--------+--------+--------- RxCan2[0a0] Avg| 15.55| 0.2734| 0.014 Peak| | 0.3144| 1.062 ---------------+--------+--------+--------- RxCan2[100] Avg| 15.50| 0.2645| 0.016 Peak| | 0.2875| 1.021 ---------------+--------+--------+--------- RxCan2[108] Avg| 23.40| 0.4231| 0.016 Peak| | 0.4680| 1.297 ---------------+--------+--------+--------- RxCan2[110] Avg| 15.55| 0.2467| 0.014 Peak| | 0.2684| 0.475 ---------------+--------+--------+--------- RxCan2[130] Avg| 13.30| 0.2231| 0.014 Peak| | 0.2447| 0.512 ---------------+--------+--------+--------- RxCan2[150] Avg| 15.50| 0.2533| 0.015 Peak| | 0.2836| 0.823 ---------------+--------+--------+--------- RxCan2[160] Avg| 4.70| 0.0784| 0.014 Peak| | 0.0863| 0.608 ---------------+--------+--------+--------- RxCan2[180] Avg| 15.55| 0.2713| 0.015 Peak| | 0.2841| 0.884 ---------------+--------+--------+--------- RxCan2[190] Avg| 15.50| 0.2596| 0.014 Peak| | 0.2825| 0.743 ---------------+--------+--------+--------- RxCan2[1a0] Avg| 0.95| 0.0164| 0.015 Peak| | 0.0164| 0.346 ---------------+--------+--------+--------- RxCan2[1a4] Avg| 18.65| 0.3232| 0.015 Peak| | 0.3515| 0.989 ---------------+--------+--------+--------- RxCan2[1a8] Avg| 11.60| 0.1911| 0.016 Peak| | 0.2012| 0.757 ---------------+--------+--------+--------- RxCan2[1b0] Avg| 9.35| 0.1558| 0.016 Peak| | 0.1641| 0.795 ---------------+--------+--------+--------- RxCan2[1b4] Avg| 9.35| 0.1543| 0.015 Peak| | 0.1617| 1.217 ---------------+--------+--------+--------- RxCan2[1b8] Avg| 11.65| 0.2003| 0.014 Peak| | 0.2236| 1.549 ---------------+--------+--------+--------- RxCan2[1c0] Avg| 9.40| 0.1532| 0.016 Peak| | 0.1673| 0.955 ---------------+--------+--------+--------- RxCan2[1e0] Avg| 9.30| 0.1582| 0.015 Peak| | 0.1708| 0.661 ---------------+--------+--------+--------- RxCan2[215] Avg| 7.80| 0.1409| 0.016 Peak| | 0.1531| 0.660 ---------------+--------+--------+--------- RxCan2[217] Avg| 7.80| 0.1239| 0.014 Peak| | 0.1333| 0.520 ---------------+--------+--------+--------- RxCan2[220] Avg| 6.20| 0.1041| 0.015 Peak| | 0.1094| 0.652 ---------------+--------+--------+--------- RxCan2[225] Avg| 23.40| 0.4648| 0.015 Peak| | 0.4696| 4.288 ---------------+--------+--------+--------- RxCan2[230] Avg| 6.20| 0.3120| 0.048 Peak| | 0.3377| 1.065 ---------------+--------+--------+--------- RxCan2[240] Avg| 7.70| 0.1248| 0.014 Peak| | 0.1364| 0.635 ---------------+--------+--------+--------- RxCan2[241] Avg| 18.60| 0.3258| 0.014 Peak| | 0.3343| 1.288 ---------------+--------+--------+--------- RxCan2[250] Avg| 4.70| 0.0761| 0.014 Peak| | 0.0809| 0.322 ---------------+--------+--------+--------- RxCan2[255] Avg| 11.75| 0.2058| 0.014 Peak| | 0.2283| 0.937 ---------------+--------+--------+--------- RxCan2[265] Avg| 11.65| 0.1964| 0.014 Peak| | 0.2068| 0.965 ---------------+--------+--------+--------- RxCan2[270] Avg| 4.70| 0.0808| 0.016 Peak| | 0.0949| 0.729 ---------------+--------+--------+--------- RxCan2[290] Avg| 3.15| 0.0498| 0.015 Peak| | 0.0504| 0.449 ---------------+--------+--------+--------- RxCan2[295] Avg| 6.25| 0.1019| 0.014 Peak| | 0.1094| 0.859 ---------------+--------+--------+--------- RxCan2[2a0] Avg| 3.15| 0.0550| 0.014 Peak| | 0.0551| 0.779 ---------------+--------+--------+--------- RxCan2[2a7] Avg| 11.65| 0.1929| 0.014 Peak| | 0.2080| 0.775 ---------------+--------+--------+--------- RxCan2[2b0] Avg| 3.00| 0.0497| 0.015 Peak| | 0.0562| 0.528 ---------------+--------+--------+--------- RxCan2[2c0] Avg| 3.10| 0.0534| 0.016 Peak| | 0.0592| 0.501 ---------------+--------+--------+--------- RxCan2[2e0] Avg| 1.55| 0.0247| 0.014 Peak| | 0.0289| 0.319 ---------------+--------+--------+--------- RxCan2[2f0] Avg| 1.55| 0.0244| 0.014 Peak| | 0.0273| 0.192 ---------------+--------+--------+--------- RxCan2[2f5] Avg| 11.65| 0.2078| 0.016 Peak| | 0.2333| 0.879 ---------------+--------+--------+--------- RxCan2[300] Avg| 1.60| 0.0266| 0.018 Peak| | 0.0278| 0.724 ---------------+--------+--------+--------- RxCan2[310] Avg| 1.55| 0.0276| 0.016 Peak| | 0.0285| 0.759 ---------------+--------+--------+--------- RxCan2[320] Avg| 1.60| 0.0240| 0.014 Peak| | 0.0258| 0.179 ---------------+--------+--------+--------- RxCan2[326] Avg| 9.30| 0.1550| 0.014 Peak| | 0.1582| 0.850 ---------------+--------+--------+--------- RxCan2[330] Avg| 29.95| 0.5311| 0.015 Peak| | 0.5565| 4.522 ---------------+--------+--------+--------- RxCan2[340] Avg| 7.75| 0.1693| 0.024 Peak| | 0.1868| 1.148 ---------------+--------+--------+--------- RxCan2[345] Avg| 1.60| 0.0292| 0.016 Peak| | 0.0316| 0.471 ---------------+--------+--------+--------- RxCan2[350] Avg| 0.00| 0.0000| 0.019 Peak| | 0.0000| 0.188 ---------------+--------+--------+--------- RxCan2[35e] Avg| 4.70| 0.0851| 0.019 Peak| | 0.0911| 1.023 ---------------+--------+--------+--------- RxCan2[360] Avg| 1.60| 0.0258| 0.015 Peak| | 0.0284| 0.306 ---------------+--------+--------+--------- RxCan2[361] Avg| 7.75| 0.1341| 0.017 Peak| | 0.1487| 0.761 ---------------+--------+--------+--------- RxCan2[363] Avg| 1.20| 0.0203| 0.016 Peak| | 0.0220| 0.421 ---------------+--------+--------+--------- RxCan2[370] Avg| 0.85| 0.0140| 0.016 Peak| | 0.0162| 0.354 ---------------+--------+--------+--------- RxCan2[381] Avg| 3.15| 0.0512| 0.016 Peak| | 0.0546| 0.416 ---------------+--------+--------+--------- RxCan2[3a0] Avg| 15.60| 0.2548| 0.015 Peak| | 0.2890| 0.976 ---------------+--------+--------+--------- RxCan2[3d0] Avg| 9.35| 0.1553| 0.019 Peak| | 0.1612| 1.115 ---------------+--------+--------+--------- RxCan2[3d5] Avg| 5.15| 0.0836| 0.016 Peak| | 0.0867| 0.479 ---------------+--------+--------+--------- RxCan2[3e0] Avg| 0.00| 0.0000| 0.014 Peak| | 0.0000| 0.142 ---------------+--------+--------+--------- RxCan2[400] Avg| 3.55| 0.0613| 0.017 Peak| | 0.0695| 0.501 ---------------+--------+--------+--------- RxCan2[405] Avg| 3.50| 0.0584| 0.018 Peak| | 0.0626| 0.686 ---------------+--------+--------+--------- RxCan2[40a] Avg| 7.10| 0.1278| 0.017 Peak| | 0.1389| 1.244 ---------------+--------+--------+--------- RxCan2[415] Avg| 1.60| 0.0258| 0.014 Peak| | 0.0287| 0.266 ---------------+--------+--------+--------- RxCan2[435] Avg| 0.85| 0.0165| 0.019 Peak| | 0.0167| 0.367 ---------------+--------+--------+--------- RxCan2[440] Avg| 0.85| 0.0128| 0.019 Peak| | 0.0141| 0.885 ---------------+--------+--------+--------- RxCan2[465] Avg| 0.95| 0.0177| 0.016 Peak| | 0.0195| 0.721 ---------------+--------+--------+--------- RxCan2[466] Avg| 0.95| 0.0147| 0.014 Peak| | 0.0160| 0.184 ---------------+--------+--------+--------- RxCan2[467] Avg| 0.95| 0.0172| 0.017 Peak| | 0.0188| 0.391 ---------------+--------+--------+--------- RxCan2[501] Avg| 1.45| 0.0273| 0.016 Peak| | 0.0327| 0.996 ---------------+--------+--------+--------- RxCan2[503] Avg| 1.45| 0.0288| 0.020 Peak| | 0.0338| 0.970 ---------------+--------+--------+--------- RxCan2[504] Avg| 1.40| 0.0241| 0.015 Peak| | 0.0263| 0.609 ---------------+--------+--------+--------- RxCan2[505] Avg| 1.40| 0.0255| 0.015 Peak| | 0.0296| 0.866 ---------------+--------+--------+--------- RxCan2[508] Avg| 1.35| 0.0237| 0.017 Peak| | 0.0237| 0.384 ---------------+--------+--------+--------- RxCan2[511] Avg| 1.35| 0.0226| 0.016 Peak| | 0.0228| 0.426 ---------------+--------+--------+--------- RxCan2[51e] Avg| 1.40| 0.0221| 0.014 Peak| | 0.0245| 0.211 ---------------+--------+--------+--------- RxCan2[581] Avg| 0.80| 0.0189| 0.019 Peak| | 0.0290| 1.217 ---------------+--------+--------+--------- RxCan2[606] Avg| 0.00| 0.0000| 0.014 Peak| | 0.0000| 0.142 ---------------+--------+--------+--------- RxCan2[657] Avg| 0.00| 0.0000| 0.014 Peak| | 0.0000| 0.137 ---------------+--------+--------+--------- Cmd:State Avg| 0.00| 0.0000| 0.002 Peak| | 0.0000| 0.024 ===============+========+========+========= Total Avg| 2748.42| 58.3344| 28.718
@Simon: it would be an option to try commenting out the overflow counting, to see if that's causing the issue.
I have commented out the line with the Atomic_Increment statement. Now I no longer receive any messages with “RX Task Queue Overflow Run” Here is the output of poller times status:
OVMS# poll time status Poller timing is: on Type | count | Utlztn | Time | per s | [%] | [ms] ---------------+--------+--------+--------- Poll:PRI Avg| 1.00| 0.0045| 0.004 Peak| | 0.0046| 0.064 ---------------+--------+--------+--------- RxCan1[010] Avg| 34.26| 2.2574| 0.021 Peak| | 2.2574| 4.609 ---------------+--------+--------+--------- RxCan1[030] Avg| 34.26| 2.3820| 0.021 Peak| | 2.3820| 1.135 ---------------+--------+--------+--------- RxCan1[041] Avg| 49.89| 1.2059| 0.021 Peak| | 1.2295| 5.331 ---------------+--------+--------+--------- RxCan1[049] Avg| 49.96| 1.2400| 0.030 Peak| | 1.2699| 1.402 ---------------+--------+--------+--------- RxCan1[04c] Avg| 49.92| 1.1752| 0.021 Peak| | 1.2072| 4.502 ---------------+--------+--------+--------- RxCan1[04d] Avg| 34.31| 2.4433| 0.022 Peak| | 2.4773| 1.368 ---------------+--------+--------+--------- RxCan1[076] Avg| 49.96| 1.2071| 0.024 Peak| | 1.2554| 2.007 ---------------+--------+--------+--------- RxCan1[077] Avg| 49.96| 1.2012| 0.022 Peak| | 1.2492| 1.955 ---------------+--------+--------+--------- RxCan1[07a] Avg| 34.35| 2.9251| 0.030 Peak| | 3.1103| 1.829 ---------------+--------+--------+--------- RxCan1[07d] Avg| 49.96| 1.1954| 0.022 Peak| | 1.2282| 1.074 ---------------+--------+--------+--------- RxCan1[0c8] Avg| 49.89| 1.2491| 0.021 Peak| | 1.3169| 1.181 ---------------+--------+--------+--------- RxCan1[11a] Avg| 34.39| 2.4423| 0.024 Peak| | 2.5693| 1.491 ---------------+--------+--------+--------- RxCan1[130] Avg| 49.95| 1.1312| 0.020 Peak| | 1.1684| 1.218 ---------------+--------+--------+--------- RxCan1[139] Avg| 49.92| 1.1547| 0.021 Peak| | 1.1778| 1.199 ---------------+--------+--------+--------- RxCan1[156] Avg| 9.96| 0.2391| 0.023 Peak| | 0.2591| 1.943 ---------------+--------+--------+--------- RxCan1[160] Avg| 49.96| 1.1657| 0.031 Peak| | 1.2017| 2.158 ---------------+--------+--------+--------- RxCan1[165] Avg| 49.96| 1.1257| 0.021 Peak| | 1.1652| 1.471 ---------------+--------+--------+--------- RxCan1[167] Avg| 34.31| 2.2871| 0.021 Peak| | 2.3374| 1.776 ---------------+--------+--------+--------- RxCan1[171] Avg| 49.96| 1.1879| 0.023 Peak| | 1.2268| 1.166 ---------------+--------+--------+--------- RxCan1[178] Avg| 10.00| 0.2371| 0.029 Peak| | 0.2459| 1.516 ---------------+--------+--------+--------- RxCan1[179] Avg| 10.00| 0.2196| 0.021 Peak| | 0.2260| 0.758 ---------------+--------+--------+--------- RxCan1[180] Avg| 49.96| 1.1703| 0.022 Peak| | 1.2103| 1.481 ---------------+--------+--------+--------- RxCan1[185] Avg| 49.95| 1.1127| 0.020 Peak| | 1.1636| 1.292 ---------------+--------+--------+--------- RxCan1[1a0] Avg| 49.96| 1.1009| 0.020 Peak| | 1.1468| 1.060 ---------------+--------+--------+--------- RxCan1[1e0] Avg| 49.96| 1.1744| 0.021 Peak| | 1.2027| 1.240 ---------------+--------+--------+--------- RxCan1[1e4] Avg| 49.96| 1.3733| 0.032 Peak| | 1.4085| 1.523 ---------------+--------+--------+--------- RxCan1[1f0] Avg| 33.30| 0.7625| 0.023 Peak| | 0.8004| 3.349 ---------------+--------+--------+--------- RxCan1[200] Avg| 49.92| 1.1462| 0.021 Peak| | 1.1809| 1.254 ---------------+--------+--------+--------- RxCan1[202] Avg| 34.39| 2.4034| 0.028 Peak| | 2.5611| 1.472 ---------------+--------+--------+--------- RxCan1[204] Avg| 34.30| 2.2541| 0.022 Peak| | 2.2924| 2.015 ---------------+--------+--------+--------- RxCan1[213] Avg| 49.96| 1.1599| 0.027 Peak| | 1.1794| 1.714 ---------------+--------+--------+--------- RxCan1[214] Avg| 49.96| 1.1537| 0.022 Peak| | 1.1941| 1.439 ---------------+--------+--------+--------- RxCan1[217] Avg| 34.39| 2.2490| 0.020 Peak| | 2.2856| 3.766 ---------------+--------+--------+--------- RxCan1[218] Avg| 49.96| 1.1291| 0.021 Peak| | 1.1646| 1.547 ---------------+--------+--------+--------- RxCan1[230] Avg| 49.96| 1.1272| 0.020 Peak| | 1.2237| 1.295 ---------------+--------+--------+--------- RxCan1[240] Avg| 10.00| 0.2191| 0.021 Peak| | 0.2226| 1.067 ---------------+--------+--------+--------- RxCan1[242] Avg| 24.96| 0.6911| 0.024 Peak| | 0.7161| 1.180 ---------------+--------+--------+--------- RxCan1[24a] Avg| 9.96| 0.2345| 0.024 Peak| | 0.2535| 0.779 ---------------+--------+--------+--------- RxCan1[24b] Avg| 9.96| 0.2433| 0.023 Peak| | 0.2697| 2.085 ---------------+--------+--------+--------- RxCan1[24c] Avg| 9.96| 0.3103| 0.029 Peak| | 0.3203| 0.809 ---------------+--------+--------+--------- RxCan1[25a] Avg| 10.00| 0.2346| 0.022 Peak| | 0.2405| 1.223 ---------------+--------+--------+--------- RxCan1[25b] Avg| 49.89| 1.2121| 0.020 Peak| | 1.3659| 19.523 ---------------+--------+--------+--------- RxCan1[25c] Avg| 34.31| 2.4193| 0.019 Peak| | 2.8022| 58.153 ---------------+--------+--------+--------- RxCan1[260] Avg| 9.93| 0.2149| 0.024 Peak| | 0.2174| 1.096 ---------------+--------+--------+--------- RxCan1[270] Avg| 49.96| 1.2042| 0.026 Peak| | 1.2755| 20.612 ---------------+--------+--------+--------- RxCan1[280] Avg| 49.96| 1.0922| 0.020 Peak| | 1.1312| 1.266 ---------------+--------+--------+--------- RxCan1[2e4] Avg| 19.96| 0.6942| 0.044 Peak| | 0.8604| 1.533 ---------------+--------+--------+--------- RxCan1[2ec] Avg| 10.00| 0.3727| 0.025 Peak| | 0.5154| 28.819 ---------------+--------+--------+--------- RxCan1[2ed] Avg| 10.00| 0.2298| 0.023 Peak| | 0.2378| 1.345 ---------------+--------+--------+--------- RxCan1[2ee] Avg| 9.96| 0.2172| 0.019 Peak| | 0.2210| 1.058 ---------------+--------+--------+--------- RxCan1[312] Avg| 10.00| 0.2206| 0.020 Peak| | 0.2396| 1.060 ---------------+--------+--------+--------- RxCan1[326] Avg| 9.96| 0.2099| 0.020 Peak| | 0.2158| 0.507 ---------------+--------+--------+--------- RxCan1[336] Avg| 1.00| 0.0212| 0.020 Peak| | 0.0233| 0.315 ---------------+--------+--------+--------- RxCan1[352] Avg| 6.64| 0.1675| 0.024 Peak| | 0.1818| 1.048 ---------------+--------+--------+--------- RxCan1[355] Avg| 2.00| 0.0540| 0.027 Peak| | 0.0619| 1.209 ---------------+--------+--------+--------- RxCan1[35e] Avg| 9.98| 0.2221| 0.021 Peak| | 0.2284| 1.186 ---------------+--------+--------+--------- RxCan1[365] Avg| 10.00| 0.2282| 0.023 Peak| | 0.2335| 0.769 ---------------+--------+--------+--------- RxCan1[366] Avg| 10.00| 0.3163| 0.022 Peak| | 0.6330| 23.587 ---------------+--------+--------+--------- RxCan1[367] Avg| 10.00| 0.2417| 0.021 Peak| | 0.2568| 1.417 ---------------+--------+--------+--------- RxCan1[368] Avg| 9.96| 0.2187| 0.019 Peak| | 0.2250| 1.135 ---------------+--------+--------+--------- RxCan1[369] Avg| 9.99| 0.2277| 0.021 Peak| | 0.2334| 0.667 ---------------+--------+--------+--------- RxCan1[380] Avg| 9.96| 0.2133| 0.020 Peak| | 0.2161| 0.560 ---------------+--------+--------+--------- RxCan1[38b] Avg| 24.92| 0.5622| 0.022 Peak| | 0.5716| 1.618 ---------------+--------+--------+--------- RxCan1[3b3] Avg| 10.00| 0.2132| 0.023 Peak| | 0.2194| 1.106 ---------------+--------+--------+--------- RxCan1[400] Avg| 4.00| 0.0885| 0.019 Peak| | 0.0885| 0.570 ---------------+--------+--------+--------- RxCan1[405] Avg| 3.70| 0.1414| 0.036 Peak| | 0.1414| 0.710 ---------------+--------+--------+--------- RxCan1[40a] Avg| 8.00| 0.1887| 0.021 Peak| | 0.1887| 1.027 ---------------+--------+--------+--------- RxCan1[410] Avg| 10.00| 0.2141| 0.023 Peak| | 0.2188| 0.984 ---------------+--------+--------+--------- RxCan1[411] Avg| 10.00| 0.2325| 0.023 Peak| | 0.2447| 0.660 ---------------+--------+--------+--------- RxCan1[416] Avg| 10.00| 0.2326| 0.022 Peak| | 0.2389| 0.774 ---------------+--------+--------+--------- RxCan1[421] Avg| 10.00| 0.2245| 0.021 Peak| | 0.2271| 1.160 ---------------+--------+--------+--------- RxCan1[42d] Avg| 10.00| 0.2315| 0.021 Peak| | 0.2411| 0.677 ---------------+--------+--------+--------- RxCan1[42f] Avg| 10.00| 0.2480| 0.020 Peak| | 0.2975| 8.093 ---------------+--------+--------+--------- RxCan1[430] Avg| 10.00| 0.2203| 0.019 Peak| | 0.2302| 0.847 ---------------+--------+--------+--------- RxCan1[434] Avg| 10.00| 0.2331| 0.019 Peak| | 0.2620| 1.150 ---------------+--------+--------+--------- RxCan1[435] Avg| 6.68| 0.1445| 0.020 Peak| | 0.1486| 1.063 ---------------+--------+--------+--------- RxCan1[43e] Avg| 20.00| 0.4515| 0.021 Peak| | 0.4632| 1.013 ---------------+--------+--------+--------- RxCan1[440] Avg| 1.00| 0.0210| 0.019 Peak| | 0.0218| 0.294 ---------------+--------+--------+--------- RxCan1[465] Avg| 0.95| 0.0214| 0.023 Peak| | 0.0215| 0.587 ---------------+--------+--------+--------- RxCan1[466] Avg| 0.95| 0.0211| 0.021 Peak| | 0.0215| 0.350 ---------------+--------+--------+--------- RxCan1[467] Avg| 0.95| 0.0191| 0.020 Peak| | 0.0201| 0.444 ---------------+--------+--------+--------- RxCan1[472] Avg| 0.68| 0.0588| 0.085 Peak| | 0.0606| 1.170 ---------------+--------+--------+--------- RxCan1[473] Avg| 0.66| 0.0407| 0.062 Peak| | 0.0492| 1.329 ---------------+--------+--------+--------- RxCan1[474] Avg| 1.00| 0.0218| 0.021 Peak| | 0.0237| 0.278 ---------------+--------+--------+--------- RxCan1[475] Avg| 1.96| 0.0466| 0.024 Peak| | 0.0570| 1.112 ---------------+--------+--------+--------- RxCan1[476] Avg| 2.00| 0.0454| 0.020 Peak| | 0.0497| 0.409 ---------------+--------+--------+--------- RxCan1[477] Avg| 2.00| 0.0497| 0.022 Peak| | 0.0595| 0.864 ---------------+--------+--------+--------- RxCan1[595] Avg| 1.00| 0.0223| 0.021 Peak| | 0.0241| 0.296 ---------------+--------+--------+--------- RxCan1[59e] Avg| 1.00| 0.0233| 0.024 Peak| | 0.0289| 0.713 ---------------+--------+--------+--------- RxCan1[5a2] Avg| 1.00| 0.0200| 0.020 Peak| | 0.0204| 0.264 ---------------+--------+--------+--------- RxCan1[5ba] Avg| 1.00| 0.0206| 0.021 Peak| | 0.0238| 0.515 ---------------+--------+--------+--------- RxCan2[020] Avg| 33.30| 0.7938| 0.022 Peak| | 0.7938| 4.793 ---------------+--------+--------+--------- RxCan2[030] Avg| 22.20| 0.5229| 0.022 Peak| | 0.5229| 0.985 ---------------+--------+--------+--------- RxCan2[03a] Avg| 19.90| 0.4700| 0.022 Peak| | 0.4700| 0.804 ---------------+--------+--------+--------- RxCan2[040] Avg| 19.90| 0.4678| 0.023 Peak| | 0.4678| 1.222 ---------------+--------+--------+--------- RxCan2[060] Avg| 20.00| 0.6480| 0.050 Peak| | 0.6480| 20.997 ---------------+--------+--------+--------- RxCan2[070] Avg| 16.60| 0.3944| 0.022 Peak| | 0.3944| 1.053 ---------------+--------+--------+--------- RxCan2[080] Avg| 16.70| 0.7032| 0.041 Peak| | 0.7032| 1.611 ---------------+--------+--------+--------- RxCan2[083] Avg| 20.10| 0.4329| 0.021 Peak| | 0.4329| 0.520 ---------------+--------+--------+--------- RxCan2[090] Avg| 24.90| 0.5674| 0.017 Peak| | 0.5674| 1.149 ---------------+--------+--------+--------- RxCan2[0a0] Avg| 16.60| 0.3836| 0.023 Peak| | 0.3836| 0.933 ---------------+--------+--------+--------- RxCan2[100] Avg| 16.50| 0.3661| 0.021 Peak| | 0.3661| 0.740 ---------------+--------+--------+--------- RxCan2[108] Avg| 24.90| 0.5923| 0.025 Peak| | 0.5923| 0.859 ---------------+--------+--------+--------- RxCan2[110] Avg| 16.70| 0.3906| 0.023 Peak| | 0.3906| 0.697 ---------------+--------+--------+--------- RxCan2[130] Avg| 14.40| 0.3341| 0.022 Peak| | 0.3341| 0.829 ---------------+--------+--------+--------- RxCan2[150] Avg| 16.50| 0.4025| 0.020 Peak| | 0.4025| 1.120 ---------------+--------+--------+--------- RxCan2[160] Avg| 4.90| 0.1252| 0.025 Peak| | 0.1252| 0.502 ---------------+--------+--------+--------- RxCan2[180] Avg| 16.60| 0.3899| 0.023 Peak| | 0.3899| 0.799 ---------------+--------+--------+--------- RxCan2[190] Avg| 16.60| 0.3892| 0.025 Peak| | 0.3892| 1.172 ---------------+--------+--------+--------- RxCan2[1a0] Avg| 1.00| 0.0281| 0.025 Peak| | 0.0281| 0.695 ---------------+--------+--------+--------- RxCan2[1a4] Avg| 20.00| 0.4525| 0.022 Peak| | 0.4525| 1.231 ---------------+--------+--------+--------- RxCan2[1a8] Avg| 12.50| 0.2886| 0.020 Peak| | 0.2886| 1.048 ---------------+--------+--------+--------- RxCan2[1b0] Avg| 10.00| 0.2300| 0.023 Peak| | 0.2300| 0.579 ---------------+--------+--------+--------- RxCan2[1b4] Avg| 10.00| 0.2334| 0.022 Peak| | 0.2334| 0.947 ---------------+--------+--------+--------- RxCan2[1b8] Avg| 12.40| 0.2970| 0.023 Peak| | 0.2970| 0.909 ---------------+--------+--------+--------- RxCan2[1c0] Avg| 10.00| 0.2257| 0.021 Peak| | 0.2257| 0.983 ---------------+--------+--------+--------- RxCan2[1e0] Avg| 10.00| 0.2141| 0.023 Peak| | 0.2141| 0.556 ---------------+--------+--------+--------- RxCan2[215] Avg| 8.30| 0.2047| 0.025 Peak| | 0.2047| 0.786 ---------------+--------+--------+--------- RxCan2[217] Avg| 8.30| 0.2033| 0.022 Peak| | 0.2033| 1.135 ---------------+--------+--------+--------- RxCan2[220] Avg| 6.70| 0.1647| 0.020 Peak| | 0.1647| 0.961 ---------------+--------+--------+--------- RxCan2[225] Avg| 24.90| 0.6136| 0.026 Peak| | 0.6136| 1.018 ---------------+--------+--------+--------- RxCan2[230] Avg| 6.70| 0.4045| 0.057 Peak| | 0.4045| 1.532 ---------------+--------+--------+--------- RxCan2[240] Avg| 8.20| 0.1849| 0.021 Peak| | 0.1849| 0.510 ---------------+--------+--------+--------- RxCan2[241] Avg| 20.00| 0.4312| 0.021 Peak| | 0.4312| 5.110 ---------------+--------+--------+--------- RxCan2[250] Avg| 5.00| 0.1072| 0.021 Peak| | 0.1072| 0.320 ---------------+--------+--------+--------- RxCan2[255] Avg| 12.50| 0.3091| 0.022 Peak| | 0.3091| 0.904 ---------------+--------+--------+--------- RxCan2[265] Avg| 12.50| 0.2819| 0.021 Peak| | 0.2819| 1.035 ---------------+--------+--------+--------- RxCan2[270] Avg| 5.00| 0.1189| 0.022 Peak| | 0.1189| 0.631 ---------------+--------+--------+--------- RxCan2[290] Avg| 3.30| 0.0740| 0.023 Peak| | 0.0740| 0.455 ---------------+--------+--------+--------- RxCan2[295] Avg| 6.60| 0.1431| 0.023 Peak| | 0.1431| 0.504 ---------------+--------+--------+--------- RxCan2[2a0] Avg| 3.30| 0.0686| 0.020 Peak| | 0.0686| 0.445 ---------------+--------+--------+--------- RxCan2[2a7] Avg| 12.50| 0.2869| 0.021 Peak| | 0.2869| 0.660 ---------------+--------+--------+--------- RxCan2[2b0] Avg| 3.20| 0.0707| 0.023 Peak| | 0.0707| 0.331 ---------------+--------+--------+--------- RxCan2[2c0] Avg| 3.20| 0.0988| 0.026 Peak| | 0.0988| 0.932 ---------------+--------+--------+--------- RxCan2[2e0] Avg| 1.60| 0.0388| 0.024 Peak| | 0.0388| 0.393 ---------------+--------+--------+--------- RxCan2[2f0] Avg| 1.70| 0.0376| 0.021 Peak| | 0.0376| 0.282 ---------------+--------+--------+--------- RxCan2[2f5] Avg| 12.50| 0.2833| 0.021 Peak| | 0.2833| 0.855 ---------------+--------+--------+--------- RxCan2[300] Avg| 1.70| 0.0398| 0.023 Peak| | 0.0398| 0.488 ---------------+--------+--------+--------- RxCan2[310] Avg| 1.60| 0.0480| 0.026 Peak| | 0.0480| 0.937 ---------------+--------+--------+--------- RxCan2[320] Avg| 1.70| 0.0346| 0.020 Peak| | 0.0346| 0.370 ---------------+--------+--------+--------- RxCan2[326] Avg| 9.90| 0.2200| 0.022 Peak| | 0.2200| 0.502 ---------------+--------+--------+--------- RxCan2[330] Avg| 32.30| 0.7323| 0.021 Peak| | 0.7323| 1.130 ---------------+--------+--------+--------- RxCan2[340] Avg| 8.20| 0.2375| 0.028 Peak| | 0.2375| 0.578 ---------------+--------+--------+--------- RxCan2[345] Avg| 1.60| 0.0393| 0.022 Peak| | 0.0393| 0.590 ---------------+--------+--------+--------- RxCan2[35e] Avg| 5.00| 0.1303| 0.023 Peak| | 0.1303| 0.943 ---------------+--------+--------+--------- RxCan2[360] Avg| 1.70| 0.0381| 0.025 Peak| | 0.0381| 0.922 ---------------+--------+--------+--------- RxCan2[361] Avg| 8.20| 0.1907| 0.023 Peak| | 0.1907| 1.119 ---------------+--------+--------+--------- RxCan2[363] Avg| 1.30| 0.0337| 0.024 Peak| | 0.0337| 0.425 ---------------+--------+--------+--------- RxCan2[370] Avg| 0.90| 0.0194| 0.022 Peak| | 0.0194| 0.246 ---------------+--------+--------+--------- RxCan2[381] Avg| 3.20| 0.0684| 0.024 Peak| | 0.0684| 0.828 ---------------+--------+--------+--------- RxCan2[3a0] Avg| 16.60| 0.3734| 0.022 Peak| | 0.3734| 0.636 ---------------+--------+--------+--------- RxCan2[3d0] Avg| 10.00| 0.2262| 0.023 Peak| | 0.2262| 0.663 ---------------+--------+--------+--------- RxCan2[3d5] Avg| 5.60| 0.1335| 0.022 Peak| | 0.1335| 1.222 ---------------+--------+--------+--------- RxCan2[400] Avg| 4.00| 0.0949| 0.022 Peak| | 0.0949| 0.715 ---------------+--------+--------+--------- RxCan2[405] Avg| 3.70| 0.0861| 0.022 Peak| | 0.0861| 0.443 ---------------+--------+--------+--------- RxCan2[40a] Avg| 8.00| 0.1853| 0.021 Peak| | 0.1853| 0.552 ---------------+--------+--------+--------- RxCan2[415] Avg| 1.60| 0.0341| 0.021 Peak| | 0.0341| 0.273 ---------------+--------+--------+--------- RxCan2[435] Avg| 0.90| 0.0220| 0.025 Peak| | 0.0220| 0.354 ---------------+--------+--------+--------- RxCan2[440] Avg| 0.90| 0.0199| 0.021 Peak| | 0.0199| 0.266 ---------------+--------+--------+--------- RxCan2[465] Avg| 0.90| 0.0234| 0.028 Peak| | 0.0234| 0.633 ---------------+--------+--------+--------- RxCan2[466] Avg| 1.00| 0.0222| 0.021 Peak| | 0.0222| 0.322 ---------------+--------+--------+--------- RxCan2[467] Avg| 1.00| 0.0221| 0.020 Peak| | 0.0221| 0.355 ---------------+--------+--------+--------- RxCan2[501] Avg| 1.50| 0.0335| 0.023 Peak| | 0.0335| 0.393 ---------------+--------+--------+--------- RxCan2[503] Avg| 1.50| 0.0370| 0.022 Peak| | 0.0370| 0.546 ---------------+--------+--------+--------- RxCan2[504] Avg| 1.40| 0.0328| 0.022 Peak| | 0.0328| 0.489 ---------------+--------+--------+--------- RxCan2[505] Avg| 1.40| 0.0290| 0.021 Peak| | 0.0290| 0.354 ---------------+--------+--------+--------- RxCan2[508] Avg| 1.40| 0.0318| 0.023 Peak| | 0.0318| 0.408 ---------------+--------+--------+--------- RxCan2[511] Avg| 1.40| 0.0306| 0.022 Peak| | 0.0306| 0.328 ---------------+--------+--------+--------- RxCan2[51e] Avg| 1.40| 0.0310| 0.022 Peak| | 0.0310| 0.269 ---------------+--------+--------+--------- RxCan2[581] Avg| 1.00| 0.0222| 0.022 Peak| | 0.0222| 0.256 ---------------+--------+--------+--------- Cmd:State Avg| 0.00| 0.0000| 0.002 Peak| | 0.0000| 0.024 ===============+========+========+========= Total Avg| 2795.57| 82.7745| 40.174
Cheers, Simon
Am 17.01.2025 um 17:49 schrieb Michael Balzer via OvmsDev:
OK, I've got a new idea: CAN timing.
Comparing our esp32can bit timing to the esp-idf driver's, there seem to be some differences:
https://github.com/espressif/esp-idf/blob/master/components/hal/include/hal/...
Transceivers are normally tolerant to small timing offsets. Maybe being off a little bit has no effect under normal conditions, but it has when the transceiver has to cope with a filled RX queue. That could be causing the transceiver to slide just out of sync. If the timing gets garbled, the transceiver would signal errors in the packets to the bus, possibly so many the vehicle ECUs decide to raise an error condition.
Is that plausible?
On why the new poller could be causing this (in combination with too slow processing by the vehicle): as mentioned, the standard CAN listener mechanism doesn't care about queue overflows. The poller does. `OvmsPollers::Queue_PollerFrame()` does a log call when Tx/Rx tracing is enabled, that could even block, but tracing is optional and only meant for debugging. Not optional is the overflow counting using an atomic uint32.
The atomic types are said to be fast, but I never checked their actual implementation on the ESP32. Maybe they can block as well?
@Simon: it would be an option to try commenting out the overflow counting, to see if that's causing the issue.
Regards, Michael
Am 17.01.25 um 15:37 schrieb Chris Box via OvmsDev:
Yes, I can confirm I've had one experience of the Leaf switching to Neutral while driving, with a yellow warning symbol on the dash. It refused to reselect Drive until I had switched the car off and back on. Derek wasn't so lucky and he need to clear fault codes before the car would work.
On returning home, I found OVMS was not accessible over a network. I didn't try a USB cable. Unplugging and reinserting the OBD cable caused OVMS to rejoin Wi-Fi. However the SD logs showed nothing from the time of the event. CAN writes are enabled, so it can perform SOC limiting.
My car has been using this firmware since 21st November, based on the git master of that day. As a relatively new user of OVMS (only since October) I don't have much experience of older firmware.
Perhaps a safeguard should be implemented before releasing a new stable firmware that will be automatically downloaded by Leaf owners. But I don't have the expertise to know what that safeguard should be. Derek's suggestion of 'only CAN write when parked' appears to be a good idea.
Chris
On 2025-01-15 18:18, Derek Caudwell via OvmsDev wrote:
Since the following email I have high confidence the issue on the Leaf is related/caused by the poller as there has been no further occurrence and Chris has also experienced the car going to neutral on the new poller firmware.
.... I haven't ruled out it being a fault with my car yet. Shortly after it faulted the car was run into so has been off the road for sometime, my first step was to replace 12V battery. The ovms unit is now unplugged and if it does not fault over the next month while driving I'll be reasonably confident it's ovms related.
Not sure which firmware version the poller updates were included in but it was only after upgrading to it that the errors occurred (which could be coincidental however it has faulted twice more both on version 3.3.004-141-gf729d82c). For periods where I reverted to 3.3.003 it was fine.
It might be useful to have an extra option on the enable can write to only enable it when the car is parked/charging.
_______________________________________________ OvmsDev mailing listOvmsDev@lists.openvehicles.comhttp://lists.openvehicles.com/mailman/listinfo/ovmsdev
-- Michael Balzer * Am Rahmen 5 * D-58313 Herdecke Fon 02330 9104094 * Handy 0176 20698926
_______________________________________________ OvmsDev mailing listOvmsDev@lists.openvehicles.comhttp://lists.openvehicles.com/mailman/listinfo/ovmsdev
_______________________________________________ OvmsDev mailing listOvmsDev@lists.openvehicles.comhttp://lists.openvehicles.com/mailman/listinfo/ovmsdev
-- Michael Balzer * Am Rahmen 5 * D-58313 Herdecke Fon 02330 9104094 * Handy 0176 20698926
_______________________________________________ OvmsDev mailing list OvmsDev@lists.openvehicles.com http://lists.openvehicles.com/mailman/listinfo/ovmsdev
Michael, I suggest adding a standard bool member variable to reflect if any filter is defined, so `PollerRxCallback()` can just skip the filter test while that is false. A mutex has some overhead, even if used non-blocking, and a bool variable only read there will be sufficient to signal "apply filtering" to the callback. With the simple bool test, all vehicles that don't need filtering (i.e. most vehicles) will have a neglectible impact from this. Regarding the overhead: the GCC atomic implementation should use the xtensa CPU builtin atomic support (SCOMPARE1 register & S32C1I instruction), so should be pretty fast and not use any interrupt disabling, see: * https://gcc.gnu.org/wiki/Atomic (xtensa atomic support since gcc 4.4.0) * https://www.cadence.com/content/dam/cadence-www/global/en_US/documents/tools... (section 4.3.13) So I still doubt the queue overflow is the real culprit. But having the filter option doesn't hurt (with my suggestion above), and your changes to the queue processing look promising as well. @Derek: what was your poller tracing & timing setup when you had the bus issue on the Leaf? I still think that was something related to your car or setup. There are currently 11 Leafs on my server running "edge" releases including the new poller, all without (reported) issues. Regards, Michael Am 19.01.25 um 04:26 schrieb Michael Geddes:
P/R Created https://github.com/openvehicles/Open-Vehicle-Monitoring-System-3/pull/1100 Let me know if you want me to split it up or ANY changes and I'll get onto it asap.
Maybe somebody could grab the code and check it out in the context of specifying some filters. This will prevent those messages from coming to the vehicle implementation at all.. and even from going through the poller queue. It is non-blocking meaning that the filter is briefly inopperational while the filter is being modified. //.
On Sun, 19 Jan 2025 at 11:02, Michael Geddes <frog@bunyip.wheelycreek.net> wrote:
On Sat, 18 Jan 2025 at 17:08, Michael Balzer via OvmsDev <ovmsdev@lists.openvehicles.com> wrote:
I have commented out the line with the Atomic_Increment statement. Now I no longer receive any messages with “RX Task Queue Overflow Run” Here is the output of poller times status:
The main question is if you still get the CAN bus crash (vehicle running into issues) with that modification in active mode. Timing statistics were not expected to change.
I have a feeling that the atomic operations are along the lines of:
* Set Interrupts off * atomic operation * Set interrupts on
Which means no real 'blocking' .. just not allowing interrupts and therefor task switching for a couple of instructions.
Nearly 2800 frames per second is quite a lot, and most is on can1 with many frame periods at 20 ms. Yet the total processing time averages at 30-40 ms, so there is no actual CPU capacity issue for that amount of frames.
@Derek: can you please supply these statistics for the Leaf in drive mode as well?
Am 18.01.25 um 02:42 schrieb Michael Geddes via OvmsDev:
Maybe try setting CONFIG_OVMS_VEHICLE_CAN_RX_QUEUE_SIZE = 160 and see if that reduces the overflow?
Simons car sends at least 91 process data frame IDs on can1 and 84 on can2. Worst case would be these come all in within the shortest possible time span, that would mean the queue needs to be able to hold 175 frames. I'd add some headroom and round up to 200.
But keep in mind, if the Incoming processing actually occasionally gets blocked for up to 60 ms -- as indicated by Simons statistics --, the queue may need to be twice as large.
Am 18.01.25 um 02:42 schrieb Michael Geddes via OvmsDev:
I was thinking that the frame filter would be here: void OvmsPollers::PollerRxCallback(const CAN_frame_t* frame, bool success) { Queue_PollerFrame(*frame, success, false); } which I guess is executed in the task handling the CAN queue. (we don't know how many frames get dropped there).
Actually we do know that, or at least have some indication, as we count the CAN transceiver queue overruns. That info is included as "Rx overflw" in the can status output & as "rxovr" in the logs.
Adding a filter before queueing the frame would exclude the filtered IDs from all vehicle processing. I meant adding a filter just to exclude IDs from the timing statistics, assuming those are the culprits, as Simon wrote the issue only appears after enabling the timing statistics and printing them. That's why I asked if printing might need to lock the statistics for too long in case of such a long list.
Completely blocking ID ranges from processing by the vehicle should normally not be necessary, unless the Incoming handler is written very poorly.
Yet, if we add that, a mutex in the CAN RX callback must be avoided, or would need to be non-blocking:
The only real concern is thread safety between checking and adding to the filter - so the check itself might have to be mutexed. void OvmsPollers::PollerRxCallback(const CAN_frame_t* frame, bool success) { // Check filter { OvmsRecMutexLock lock(&m_filter_mutex); if (! m_filter->IsFiltered(frame)) return; } Queue_PollerFrame(*frame, success, false); }
A mutex like that could block the CAN task, which must be avoided at all cost. I introduced CAN callbacks for vehicles & applications that need to react to certain frames as fast as possible, e.g. to maintain control precedence, so cannot use the standard CAN listener mechanism (frame queueing).
The current poller callback use is OK, if (!) the atomic type really isn't the culprit, ie doesn't block.
So if (!) an ID filter needs to be added before queueing, it needs to be done in a way that needs no mutex. But I don't see an issue with the vehicle passing a fixed filter when registering with the poller/buses. The filter doesn't need to by mutable on the fly.
Regards, Michael
Am 17.01.25 um 19:42 schrieb Simon Ehlen via OvmsDev:
The poller statistics can help you track this down, but you need to have at least 10 seconds of statistics, the more the better. Rule of thumb: PRI average at 0.0/second means you don't have enough data yet.
There were again many messages with “RX Task Queue Overflow Run”. Here are the statistics of poller times status:
OVMS# poll times status Poller timing is: on Type | count | Utlztn | Time | per s | [%] | [ms] ---------------+--------+--------+--------- Poll:PRI Avg| 1.00| 0.0043| 0.004 Peak| | 0.0043| 0.052 ---------------+--------+--------+--------- RxCan1[010] Avg| 34.26| 1.6741| 0.015 Peak| | 1.6741| 1.182 ---------------+--------+--------+--------- RxCan1[030] Avg| 34.06| 1.7085| 0.020 Peak| | 1.7085| 1.390 ---------------+--------+--------+--------- RxCan1[041] Avg| 49.89| 0.8109| 0.016 Peak| | 0.8541| 1.098 ---------------+--------+--------+--------- RxCan1[049] Avg| 50.00| 1.5970| 0.019 Peak| | 1.7154| 32.233 ---------------+--------+--------+--------- RxCan1[04c] Avg| 49.92| 0.8340| 0.014 Peak| | 0.8933| 1.995 ---------------+--------+--------+--------- RxCan1[04d] Avg| 34.43| 1.6211| 0.014 Peak| | 1.6756| 1.318 ---------------+--------+--------+--------- RxCan1[076] Avg| 50.00| 0.8362| 0.024 Peak| | 0.8784| 2.185 ---------------+--------+--------+--------- RxCan1[077] Avg| 50.00| 0.7837| 0.014 Peak| | 0.8083| 1.156 ---------------+--------+--------+--------- RxCan1[07a] Avg| 34.31| 2.1870| 0.017 Peak| | 2.3252| 1.888 ---------------+--------+--------+--------- RxCan1[07d] Avg| 50.00| 0.8001| 0.013 Peak| | 0.8434| 1.150 ---------------+--------+--------+--------- RxCan1[0c8] Avg| 49.96| 0.8359| 0.013 Peak| | 0.8715| 1.171 ---------------+--------+--------+--------- RxCan1[11a] Avg| 34.35| 1.6701| 0.020 Peak| | 1.6981| 1.273 ---------------+--------+--------+--------- RxCan1[130] Avg| 50.00| 0.7902| 0.018 Peak| | 0.8513| 0.980 ---------------+--------+--------+--------- RxCan1[139] Avg| 49.92| 0.7872| 0.013 Peak| | 0.8219| 0.795 ---------------+--------+--------+--------- RxCan1[156] Avg| 10.00| 0.1620| 0.014 Peak| | 0.1729| 0.919 ---------------+--------+--------+--------- RxCan1[160] Avg| 50.04| 0.7977| 0.014 Peak| | 0.8232| 1.495 ---------------+--------+--------+--------- RxCan1[165] Avg| 49.85| 0.7976| 0.014 Peak| | 0.8486| 1.015 ---------------+--------+--------+--------- RxCan1[167] Avg| 34.39| 1.6025| 0.016 Peak| | 1.6888| 1.354 ---------------+--------+--------+--------- RxCan1[171] Avg| 50.00| 0.8150| 0.017 Peak| | 0.8488| 1.091 ---------------+--------+--------+--------- RxCan1[178] Avg| 10.00| 0.1614| 0.014 Peak| | 0.1702| 0.903 ---------------+--------+--------+--------- RxCan1[179] Avg| 10.00| 0.1630| 0.017 Peak| | 0.1663| 1.336 ---------------+--------+--------+--------- RxCan1[180] Avg| 50.00| 0.8137| 0.014 Peak| | 0.8605| 1.566 ---------------+--------+--------+--------- RxCan1[185] Avg| 50.04| 0.8033| 0.013 Peak| | 0.8393| 1.126 ---------------+--------+--------+--------- RxCan1[1a0] Avg| 49.92| 0.7748| 0.013 Peak| | 0.8169| 1.184 ---------------+--------+--------+--------- RxCan1[1e0] Avg| 49.92| 0.7738| 0.014 Peak| | 0.8028| 1.049 ---------------+--------+--------+--------- RxCan1[1e4] Avg| 49.89| 0.9692| 0.018 Peak| | 1.0096| 1.332 ---------------+--------+--------+--------- RxCan1[1f0] Avg| 33.22| 0.5544| 0.014 Peak| | 0.5855| 0.848 ---------------+--------+--------+--------- RxCan1[200] Avg| 49.92| 0.7879| 0.015 Peak| | 0.8345| 1.206 ---------------+--------+--------+--------- RxCan1[202] Avg| 34.28| 1.7075| 0.016 Peak| | 1.7874| 1.218 ---------------+--------+--------+--------- RxCan1[204] Avg| 34.35| 1.5641| 0.013 Peak| | 1.6427| 1.235 ---------------+--------+--------+--------- RxCan1[213] Avg| 49.89| 0.7814| 0.015 Peak| | 0.8232| 0.910 ---------------+--------+--------+--------- RxCan1[214] Avg| 49.92| 0.7736| 0.014 Peak| | 0.8216| 0.800 ---------------+--------+--------+--------- RxCan1[217] Avg| 34.31| 1.6294| 0.014 Peak| | 1.7165| 1.153 ---------------+--------+--------+--------- RxCan1[218] Avg| 49.86| 0.7877| 0.013 Peak| | 0.8290| 1.068 ---------------+--------+--------+--------- RxCan1[230] Avg| 50.00| 0.7596| 0.014 Peak| | 0.7660| 1.021 ---------------+--------+--------+--------- RxCan1[240] Avg| 10.00| 0.1669| 0.013 Peak| | 0.1835| 0.887 ---------------+--------+--------+--------- RxCan1[242] Avg| 24.96| 0.4764| 0.020 Peak| | 0.4963| 1.501 ---------------+--------+--------+--------- RxCan1[24a] Avg| 9.89| 0.1789| 0.015 Peak| | 0.2009| 0.874 ---------------+--------+--------+--------- RxCan1[24b] Avg| 9.89| 0.1702| 0.014 Peak| | 0.1870| 1.195 ---------------+--------+--------+--------- RxCan1[24c] Avg| 9.89| 0.2146| 0.019 Peak| | 0.2187| 1.242 ---------------+--------+--------+--------- RxCan1[25a] Avg| 10.00| 0.1603| 0.013 Peak| | 0.1667| 0.720 ---------------+--------+--------+--------- RxCan1[25b] Avg| 49.94| 0.7918| 0.017 Peak| | 0.8454| 1.666 ---------------+--------+--------+--------- RxCan1[25c] Avg| 34.24| 1.5331| 0.013 Peak| | 1.5997| 1.538 ---------------+--------+--------+--------- RxCan1[260] Avg| 10.00| 0.1626| 0.014 Peak| | 0.1682| 0.718 ---------------+--------+--------+--------- RxCan1[270] Avg| 49.90| 0.8120| 0.014 Peak| | 0.8460| 1.671 ---------------+--------+--------+--------- RxCan1[280] Avg| 49.92| 0.7777| 0.019 Peak| | 0.8447| 1.157 ---------------+--------+--------+--------- RxCan1[2e4] Avg| 19.89| 0.5778| 0.032 Peak| | 0.6648| 2.226 ---------------+--------+--------+--------- RxCan1[2ec] Avg| 10.00| 0.1701| 0.014 Peak| | 0.1755| 0.928 ---------------+--------+--------+--------- RxCan1[2ed] Avg| 10.00| 0.1650| 0.013 Peak| | 0.1747| 0.917 ---------------+--------+--------+--------- RxCan1[2ee] Avg| 9.98| 0.1544| 0.013 Peak| | 0.1588| 1.312 ---------------+--------+--------+--------- RxCan1[312] Avg| 10.00| 0.1648| 0.017 Peak| | 0.1690| 0.922 ---------------+--------+--------+--------- RxCan1[326] Avg| 9.89| 0.1603| 0.015 Peak| | 0.1833| 1.230 ---------------+--------+--------+--------- RxCan1[336] Avg| 1.00| 0.0146| 0.015 Peak| | 0.0150| 0.349 ---------------+--------+--------+--------- RxCan1[352] Avg| 6.66| 0.1223| 0.022 Peak| | 0.1338| 1.015 ---------------+--------+--------+--------- RxCan1[355] Avg| 2.00| 0.0424| 0.019 Peak| | 0.0431| 0.786 ---------------+--------+--------+--------- RxCan1[35e] Avg| 9.96| 0.1570| 0.013 Peak| | 0.1644| 0.579 ---------------+--------+--------+--------- RxCan1[365] Avg| 10.00| 0.1600| 0.014 Peak| | 0.1653| 0.961 ---------------+--------+--------+--------- RxCan1[366] Avg| 10.00| 0.1716| 0.013 Peak| | 0.1890| 0.987 ---------------+--------+--------+--------- RxCan1[367] Avg| 9.93| 0.1793| 0.015 Peak| | 0.1864| 0.984 ---------------+--------+--------+--------- RxCan1[368] Avg| 10.00| 0.1645| 0.014 Peak| | 0.1778| 0.768 ---------------+--------+--------+--------- RxCan1[369] Avg| 10.00| 0.1562| 0.016 Peak| | 0.1606| 0.724 ---------------+--------+--------+--------- RxCan1[380] Avg| 10.00| 0.1619| 0.014 Peak| | 0.1644| 0.605 ---------------+--------+--------+--------- RxCan1[38b] Avg| 25.00| 0.3991| 0.016 Peak| | 0.4280| 1.448 ---------------+--------+--------+--------- RxCan1[3b3] Avg| 10.00| 0.1537| 0.013 Peak| | 0.1610| 0.380 ---------------+--------+--------+--------- RxCan1[400] Avg| 4.00| 0.0626| 0.014 Peak| | 0.0626| 0.251 ---------------+--------+--------+--------- RxCan1[405] Avg| 3.90| 0.1019| 0.028 Peak| | 0.1019| 0.781 ---------------+--------+--------+--------- RxCan1[40a] Avg| 7.90| 0.1256| 0.020 Peak| | 0.1256| 0.991 ---------------+--------+--------+--------- RxCan1[410] Avg| 10.00| 0.1643| 0.016 Peak| | 0.1839| 1.634 ---------------+--------+--------+--------- RxCan1[411] Avg| 10.00| 0.1532| 0.013 Peak| | 0.1645| 0.824 ---------------+--------+--------+--------- RxCan1[416] Avg| 10.00| 0.1516| 0.016 Peak| | 0.1582| 0.807 ---------------+--------+--------+--------- RxCan1[421] Avg| 10.00| 0.1648| 0.013 Peak| | 0.1740| 0.839 ---------------+--------+--------+--------- RxCan1[42d] Avg| 10.00| 0.1548| 0.014 Peak| | 0.1658| 0.741 ---------------+--------+--------+--------- RxCan1[42f] Avg| 10.00| 0.1527| 0.013 Peak| | 0.1578| 0.667 ---------------+--------+--------+--------- RxCan1[430] Avg| 10.00| 0.1730| 0.016 Peak| | 0.1880| 1.209 ---------------+--------+--------+--------- RxCan1[434] Avg| 10.00| 0.1620| 0.021 Peak| | 0.1712| 1.140 ---------------+--------+--------+--------- RxCan1[435] Avg| 6.66| 0.1104| 0.014 Peak| | 0.1121| 1.011 ---------------+--------+--------+--------- RxCan1[43e] Avg| 20.00| 0.3194| 0.013 Peak| | 0.3434| 1.212 ---------------+--------+--------+--------- RxCan1[440] Avg| 1.00| 0.0160| 0.014 Peak| | 0.0175| 0.315 ---------------+--------+--------+--------- RxCan1[465] Avg| 1.00| 0.0172| 0.015 Peak| | 0.0194| 0.404 ---------------+--------+--------+--------- RxCan1[466] Avg| 1.00| 0.0198| 0.015 Peak| | 0.0252| 0.890 ---------------+--------+--------+--------- RxCan1[467] Avg| 1.00| 0.0152| 0.014 Peak| | 0.0160| 0.217 ---------------+--------+--------+--------- RxCan1[472] Avg| 0.70| 0.0533| 0.075 Peak| | 0.0546| 0.990 ---------------+--------+--------+--------- RxCan1[473] Avg| 0.65| 0.0325| 0.051 Peak| | 0.0361| 0.774 ---------------+--------+--------+--------- RxCan1[474] Avg| 1.00| 0.0146| 0.014 Peak| | 0.0151| 0.189 ---------------+--------+--------+--------- RxCan1[475] Avg| 2.00| 0.0332| 0.015 Peak| | 0.0362| 0.513 ---------------+--------+--------+--------- RxCan1[476] Avg| 2.00| 0.0305| 0.014 Peak| | 0.0307| 0.249 ---------------+--------+--------+--------- RxCan1[477] Avg| 2.00| 0.0309| 0.014 Peak| | 0.0311| 0.438 ---------------+--------+--------+--------- RxCan1[595] Avg| 1.00| 0.0151| 0.014 Peak| | 0.0160| 0.230 ---------------+--------+--------+--------- RxCan1[59e] Avg| 1.00| 0.0179| 0.015 Peak| | 0.0209| 0.716 ---------------+--------+--------+--------- RxCan1[5a2] Avg| 1.00| 0.0154| 0.016 Peak| | 0.0184| 0.699 ---------------+--------+--------+--------- RxCan1[5ba] Avg| 1.00| 0.0159| 0.017 Peak| | 0.0174| 0.485 ---------------+--------+--------+--------- RxCan2[010] Avg| 0.00| 0.0000| 0.015 Peak| | 0.0000| 0.146 ---------------+--------+--------+--------- RxCan2[020] Avg| 31.10| 0.5159| 0.015 Peak| | 0.5730| 0.992 ---------------+--------+--------+--------- RxCan2[030] Avg| 20.70| 0.3506| 0.016 Peak| | 0.3956| 1.055 ---------------+--------+--------+--------- RxCan2[03a] Avg| 18.65| 0.3157| 0.014 Peak| | 0.3292| 0.702 ---------------+--------+--------+--------- RxCan2[040] Avg| 18.60| 0.3111| 0.015 Peak| | 0.3474| 0.953 ---------------+--------+--------+--------- RxCan2[060] Avg| 18.60| 0.3182| 0.014 Peak| | 0.3569| 0.694 ---------------+--------+--------+--------- RxCan2[070] Avg| 15.55| 0.4581| 0.017 Peak| | 0.6859| 39.212 ---------------+--------+--------+--------- RxCan2[080] Avg| 15.50| 0.5041| 0.029 Peak| | 0.5414| 1.555 ---------------+--------+--------+--------- RxCan2[083] Avg| 18.70| 0.3083| 0.014 Peak| | 0.3325| 0.557 ---------------+--------+--------+--------- RxCan2[090] Avg| 23.40| 0.3961| 0.014 Peak| | 0.4445| 1.218 ---------------+--------+--------+--------- RxCan2[0a0] Avg| 15.55| 0.2734| 0.014 Peak| | 0.3144| 1.062 ---------------+--------+--------+--------- RxCan2[100] Avg| 15.50| 0.2645| 0.016 Peak| | 0.2875| 1.021 ---------------+--------+--------+--------- RxCan2[108] Avg| 23.40| 0.4231| 0.016 Peak| | 0.4680| 1.297 ---------------+--------+--------+--------- RxCan2[110] Avg| 15.55| 0.2467| 0.014 Peak| | 0.2684| 0.475 ---------------+--------+--------+--------- RxCan2[130] Avg| 13.30| 0.2231| 0.014 Peak| | 0.2447| 0.512 ---------------+--------+--------+--------- RxCan2[150] Avg| 15.50| 0.2533| 0.015 Peak| | 0.2836| 0.823 ---------------+--------+--------+--------- RxCan2[160] Avg| 4.70| 0.0784| 0.014 Peak| | 0.0863| 0.608 ---------------+--------+--------+--------- RxCan2[180] Avg| 15.55| 0.2713| 0.015 Peak| | 0.2841| 0.884 ---------------+--------+--------+--------- RxCan2[190] Avg| 15.50| 0.2596| 0.014 Peak| | 0.2825| 0.743 ---------------+--------+--------+--------- RxCan2[1a0] Avg| 0.95| 0.0164| 0.015 Peak| | 0.0164| 0.346 ---------------+--------+--------+--------- RxCan2[1a4] Avg| 18.65| 0.3232| 0.015 Peak| | 0.3515| 0.989 ---------------+--------+--------+--------- RxCan2[1a8] Avg| 11.60| 0.1911| 0.016 Peak| | 0.2012| 0.757 ---------------+--------+--------+--------- RxCan2[1b0] Avg| 9.35| 0.1558| 0.016 Peak| | 0.1641| 0.795 ---------------+--------+--------+--------- RxCan2[1b4] Avg| 9.35| 0.1543| 0.015 Peak| | 0.1617| 1.217 ---------------+--------+--------+--------- RxCan2[1b8] Avg| 11.65| 0.2003| 0.014 Peak| | 0.2236| 1.549 ---------------+--------+--------+--------- RxCan2[1c0] Avg| 9.40| 0.1532| 0.016 Peak| | 0.1673| 0.955 ---------------+--------+--------+--------- RxCan2[1e0] Avg| 9.30| 0.1582| 0.015 Peak| | 0.1708| 0.661 ---------------+--------+--------+--------- RxCan2[215] Avg| 7.80| 0.1409| 0.016 Peak| | 0.1531| 0.660 ---------------+--------+--------+--------- RxCan2[217] Avg| 7.80| 0.1239| 0.014 Peak| | 0.1333| 0.520 ---------------+--------+--------+--------- RxCan2[220] Avg| 6.20| 0.1041| 0.015 Peak| | 0.1094| 0.652 ---------------+--------+--------+--------- RxCan2[225] Avg| 23.40| 0.4648| 0.015 Peak| | 0.4696| 4.288 ---------------+--------+--------+--------- RxCan2[230] Avg| 6.20| 0.3120| 0.048 Peak| | 0.3377| 1.065 ---------------+--------+--------+--------- RxCan2[240] Avg| 7.70| 0.1248| 0.014 Peak| | 0.1364| 0.635 ---------------+--------+--------+--------- RxCan2[241] Avg| 18.60| 0.3258| 0.014 Peak| | 0.3343| 1.288 ---------------+--------+--------+--------- RxCan2[250] Avg| 4.70| 0.0761| 0.014 Peak| | 0.0809| 0.322 ---------------+--------+--------+--------- RxCan2[255] Avg| 11.75| 0.2058| 0.014 Peak| | 0.2283| 0.937 ---------------+--------+--------+--------- RxCan2[265] Avg| 11.65| 0.1964| 0.014 Peak| | 0.2068| 0.965 ---------------+--------+--------+--------- RxCan2[270] Avg| 4.70| 0.0808| 0.016 Peak| | 0.0949| 0.729 ---------------+--------+--------+--------- RxCan2[290] Avg| 3.15| 0.0498| 0.015 Peak| | 0.0504| 0.449 ---------------+--------+--------+--------- RxCan2[295] Avg| 6.25| 0.1019| 0.014 Peak| | 0.1094| 0.859 ---------------+--------+--------+--------- RxCan2[2a0] Avg| 3.15| 0.0550| 0.014 Peak| | 0.0551| 0.779 ---------------+--------+--------+--------- RxCan2[2a7] Avg| 11.65| 0.1929| 0.014 Peak| | 0.2080| 0.775 ---------------+--------+--------+--------- RxCan2[2b0] Avg| 3.00| 0.0497| 0.015 Peak| | 0.0562| 0.528 ---------------+--------+--------+--------- RxCan2[2c0] Avg| 3.10| 0.0534| 0.016 Peak| | 0.0592| 0.501 ---------------+--------+--------+--------- RxCan2[2e0] Avg| 1.55| 0.0247| 0.014 Peak| | 0.0289| 0.319 ---------------+--------+--------+--------- RxCan2[2f0] Avg| 1.55| 0.0244| 0.014 Peak| | 0.0273| 0.192 ---------------+--------+--------+--------- RxCan2[2f5] Avg| 11.65| 0.2078| 0.016 Peak| | 0.2333| 0.879 ---------------+--------+--------+--------- RxCan2[300] Avg| 1.60| 0.0266| 0.018 Peak| | 0.0278| 0.724 ---------------+--------+--------+--------- RxCan2[310] Avg| 1.55| 0.0276| 0.016 Peak| | 0.0285| 0.759 ---------------+--------+--------+--------- RxCan2[320] Avg| 1.60| 0.0240| 0.014 Peak| | 0.0258| 0.179 ---------------+--------+--------+--------- RxCan2[326] Avg| 9.30| 0.1550| 0.014 Peak| | 0.1582| 0.850 ---------------+--------+--------+--------- RxCan2[330] Avg| 29.95| 0.5311| 0.015 Peak| | 0.5565| 4.522 ---------------+--------+--------+--------- RxCan2[340] Avg| 7.75| 0.1693| 0.024 Peak| | 0.1868| 1.148 ---------------+--------+--------+--------- RxCan2[345] Avg| 1.60| 0.0292| 0.016 Peak| | 0.0316| 0.471 ---------------+--------+--------+--------- RxCan2[350] Avg| 0.00| 0.0000| 0.019 Peak| | 0.0000| 0.188 ---------------+--------+--------+--------- RxCan2[35e] Avg| 4.70| 0.0851| 0.019 Peak| | 0.0911| 1.023 ---------------+--------+--------+--------- RxCan2[360] Avg| 1.60| 0.0258| 0.015 Peak| | 0.0284| 0.306 ---------------+--------+--------+--------- RxCan2[361] Avg| 7.75| 0.1341| 0.017 Peak| | 0.1487| 0.761 ---------------+--------+--------+--------- RxCan2[363] Avg| 1.20| 0.0203| 0.016 Peak| | 0.0220| 0.421 ---------------+--------+--------+--------- RxCan2[370] Avg| 0.85| 0.0140| 0.016 Peak| | 0.0162| 0.354 ---------------+--------+--------+--------- RxCan2[381] Avg| 3.15| 0.0512| 0.016 Peak| | 0.0546| 0.416 ---------------+--------+--------+--------- RxCan2[3a0] Avg| 15.60| 0.2548| 0.015 Peak| | 0.2890| 0.976 ---------------+--------+--------+--------- RxCan2[3d0] Avg| 9.35| 0.1553| 0.019 Peak| | 0.1612| 1.115 ---------------+--------+--------+--------- RxCan2[3d5] Avg| 5.15| 0.0836| 0.016 Peak| | 0.0867| 0.479 ---------------+--------+--------+--------- RxCan2[3e0] Avg| 0.00| 0.0000| 0.014 Peak| | 0.0000| 0.142 ---------------+--------+--------+--------- RxCan2[400] Avg| 3.55| 0.0613| 0.017 Peak| | 0.0695| 0.501 ---------------+--------+--------+--------- RxCan2[405] Avg| 3.50| 0.0584| 0.018 Peak| | 0.0626| 0.686 ---------------+--------+--------+--------- RxCan2[40a] Avg| 7.10| 0.1278| 0.017 Peak| | 0.1389| 1.244 ---------------+--------+--------+--------- RxCan2[415] Avg| 1.60| 0.0258| 0.014 Peak| | 0.0287| 0.266 ---------------+--------+--------+--------- RxCan2[435] Avg| 0.85| 0.0165| 0.019 Peak| | 0.0167| 0.367 ---------------+--------+--------+--------- RxCan2[440] Avg| 0.85| 0.0128| 0.019 Peak| | 0.0141| 0.885 ---------------+--------+--------+--------- RxCan2[465] Avg| 0.95| 0.0177| 0.016 Peak| | 0.0195| 0.721 ---------------+--------+--------+--------- RxCan2[466] Avg| 0.95| 0.0147| 0.014 Peak| | 0.0160| 0.184 ---------------+--------+--------+--------- RxCan2[467] Avg| 0.95| 0.0172| 0.017 Peak| | 0.0188| 0.391 ---------------+--------+--------+--------- RxCan2[501] Avg| 1.45| 0.0273| 0.016 Peak| | 0.0327| 0.996 ---------------+--------+--------+--------- RxCan2[503] Avg| 1.45| 0.0288| 0.020 Peak| | 0.0338| 0.970 ---------------+--------+--------+--------- RxCan2[504] Avg| 1.40| 0.0241| 0.015 Peak| | 0.0263| 0.609 ---------------+--------+--------+--------- RxCan2[505] Avg| 1.40| 0.0255| 0.015 Peak| | 0.0296| 0.866 ---------------+--------+--------+--------- RxCan2[508] Avg| 1.35| 0.0237| 0.017 Peak| | 0.0237| 0.384 ---------------+--------+--------+--------- RxCan2[511] Avg| 1.35| 0.0226| 0.016 Peak| | 0.0228| 0.426 ---------------+--------+--------+--------- RxCan2[51e] Avg| 1.40| 0.0221| 0.014 Peak| | 0.0245| 0.211 ---------------+--------+--------+--------- RxCan2[581] Avg| 0.80| 0.0189| 0.019 Peak| | 0.0290| 1.217 ---------------+--------+--------+--------- RxCan2[606] Avg| 0.00| 0.0000| 0.014 Peak| | 0.0000| 0.142 ---------------+--------+--------+--------- RxCan2[657] Avg| 0.00| 0.0000| 0.014 Peak| | 0.0000| 0.137 ---------------+--------+--------+--------- Cmd:State Avg| 0.00| 0.0000| 0.002 Peak| | 0.0000| 0.024 ===============+========+========+========= Total Avg| 2748.42| 58.3344| 28.718
@Simon: it would be an option to try commenting out the overflow counting, to see if that's causing the issue.
I have commented out the line with the Atomic_Increment statement. Now I no longer receive any messages with “RX Task Queue Overflow Run” Here is the output of poller times status:
OVMS# poll time status Poller timing is: on Type | count | Utlztn | Time | per s | [%] | [ms] ---------------+--------+--------+--------- Poll:PRI Avg| 1.00| 0.0045| 0.004 Peak| | 0.0046| 0.064 ---------------+--------+--------+--------- RxCan1[010] Avg| 34.26| 2.2574| 0.021 Peak| | 2.2574| 4.609 ---------------+--------+--------+--------- RxCan1[030] Avg| 34.26| 2.3820| 0.021 Peak| | 2.3820| 1.135 ---------------+--------+--------+--------- RxCan1[041] Avg| 49.89| 1.2059| 0.021 Peak| | 1.2295| 5.331 ---------------+--------+--------+--------- RxCan1[049] Avg| 49.96| 1.2400| 0.030 Peak| | 1.2699| 1.402 ---------------+--------+--------+--------- RxCan1[04c] Avg| 49.92| 1.1752| 0.021 Peak| | 1.2072| 4.502 ---------------+--------+--------+--------- RxCan1[04d] Avg| 34.31| 2.4433| 0.022 Peak| | 2.4773| 1.368 ---------------+--------+--------+--------- RxCan1[076] Avg| 49.96| 1.2071| 0.024 Peak| | 1.2554| 2.007 ---------------+--------+--------+--------- RxCan1[077] Avg| 49.96| 1.2012| 0.022 Peak| | 1.2492| 1.955 ---------------+--------+--------+--------- RxCan1[07a] Avg| 34.35| 2.9251| 0.030 Peak| | 3.1103| 1.829 ---------------+--------+--------+--------- RxCan1[07d] Avg| 49.96| 1.1954| 0.022 Peak| | 1.2282| 1.074 ---------------+--------+--------+--------- RxCan1[0c8] Avg| 49.89| 1.2491| 0.021 Peak| | 1.3169| 1.181 ---------------+--------+--------+--------- RxCan1[11a] Avg| 34.39| 2.4423| 0.024 Peak| | 2.5693| 1.491 ---------------+--------+--------+--------- RxCan1[130] Avg| 49.95| 1.1312| 0.020 Peak| | 1.1684| 1.218 ---------------+--------+--------+--------- RxCan1[139] Avg| 49.92| 1.1547| 0.021 Peak| | 1.1778| 1.199 ---------------+--------+--------+--------- RxCan1[156] Avg| 9.96| 0.2391| 0.023 Peak| | 0.2591| 1.943 ---------------+--------+--------+--------- RxCan1[160] Avg| 49.96| 1.1657| 0.031 Peak| | 1.2017| 2.158 ---------------+--------+--------+--------- RxCan1[165] Avg| 49.96| 1.1257| 0.021 Peak| | 1.1652| 1.471 ---------------+--------+--------+--------- RxCan1[167] Avg| 34.31| 2.2871| 0.021 Peak| | 2.3374| 1.776 ---------------+--------+--------+--------- RxCan1[171] Avg| 49.96| 1.1879| 0.023 Peak| | 1.2268| 1.166 ---------------+--------+--------+--------- RxCan1[178] Avg| 10.00| 0.2371| 0.029 Peak| | 0.2459| 1.516 ---------------+--------+--------+--------- RxCan1[179] Avg| 10.00| 0.2196| 0.021 Peak| | 0.2260| 0.758 ---------------+--------+--------+--------- RxCan1[180] Avg| 49.96| 1.1703| 0.022 Peak| | 1.2103| 1.481 ---------------+--------+--------+--------- RxCan1[185] Avg| 49.95| 1.1127| 0.020 Peak| | 1.1636| 1.292 ---------------+--------+--------+--------- RxCan1[1a0] Avg| 49.96| 1.1009| 0.020 Peak| | 1.1468| 1.060 ---------------+--------+--------+--------- RxCan1[1e0] Avg| 49.96| 1.1744| 0.021 Peak| | 1.2027| 1.240 ---------------+--------+--------+--------- RxCan1[1e4] Avg| 49.96| 1.3733| 0.032 Peak| | 1.4085| 1.523 ---------------+--------+--------+--------- RxCan1[1f0] Avg| 33.30| 0.7625| 0.023 Peak| | 0.8004| 3.349 ---------------+--------+--------+--------- RxCan1[200] Avg| 49.92| 1.1462| 0.021 Peak| | 1.1809| 1.254 ---------------+--------+--------+--------- RxCan1[202] Avg| 34.39| 2.4034| 0.028 Peak| | 2.5611| 1.472 ---------------+--------+--------+--------- RxCan1[204] Avg| 34.30| 2.2541| 0.022 Peak| | 2.2924| 2.015 ---------------+--------+--------+--------- RxCan1[213] Avg| 49.96| 1.1599| 0.027 Peak| | 1.1794| 1.714 ---------------+--------+--------+--------- RxCan1[214] Avg| 49.96| 1.1537| 0.022 Peak| | 1.1941| 1.439 ---------------+--------+--------+--------- RxCan1[217] Avg| 34.39| 2.2490| 0.020 Peak| | 2.2856| 3.766 ---------------+--------+--------+--------- RxCan1[218] Avg| 49.96| 1.1291| 0.021 Peak| | 1.1646| 1.547 ---------------+--------+--------+--------- RxCan1[230] Avg| 49.96| 1.1272| 0.020 Peak| | 1.2237| 1.295 ---------------+--------+--------+--------- RxCan1[240] Avg| 10.00| 0.2191| 0.021 Peak| | 0.2226| 1.067 ---------------+--------+--------+--------- RxCan1[242] Avg| 24.96| 0.6911| 0.024 Peak| | 0.7161| 1.180 ---------------+--------+--------+--------- RxCan1[24a] Avg| 9.96| 0.2345| 0.024 Peak| | 0.2535| 0.779 ---------------+--------+--------+--------- RxCan1[24b] Avg| 9.96| 0.2433| 0.023 Peak| | 0.2697| 2.085 ---------------+--------+--------+--------- RxCan1[24c] Avg| 9.96| 0.3103| 0.029 Peak| | 0.3203| 0.809 ---------------+--------+--------+--------- RxCan1[25a] Avg| 10.00| 0.2346| 0.022 Peak| | 0.2405| 1.223 ---------------+--------+--------+--------- RxCan1[25b] Avg| 49.89| 1.2121| 0.020 Peak| | 1.3659| 19.523 ---------------+--------+--------+--------- RxCan1[25c] Avg| 34.31| 2.4193| 0.019 Peak| | 2.8022| 58.153 ---------------+--------+--------+--------- RxCan1[260] Avg| 9.93| 0.2149| 0.024 Peak| | 0.2174| 1.096 ---------------+--------+--------+--------- RxCan1[270] Avg| 49.96| 1.2042| 0.026 Peak| | 1.2755| 20.612 ---------------+--------+--------+--------- RxCan1[280] Avg| 49.96| 1.0922| 0.020 Peak| | 1.1312| 1.266 ---------------+--------+--------+--------- RxCan1[2e4] Avg| 19.96| 0.6942| 0.044 Peak| | 0.8604| 1.533 ---------------+--------+--------+--------- RxCan1[2ec] Avg| 10.00| 0.3727| 0.025 Peak| | 0.5154| 28.819 ---------------+--------+--------+--------- RxCan1[2ed] Avg| 10.00| 0.2298| 0.023 Peak| | 0.2378| 1.345 ---------------+--------+--------+--------- RxCan1[2ee] Avg| 9.96| 0.2172| 0.019 Peak| | 0.2210| 1.058 ---------------+--------+--------+--------- RxCan1[312] Avg| 10.00| 0.2206| 0.020 Peak| | 0.2396| 1.060 ---------------+--------+--------+--------- RxCan1[326] Avg| 9.96| 0.2099| 0.020 Peak| | 0.2158| 0.507 ---------------+--------+--------+--------- RxCan1[336] Avg| 1.00| 0.0212| 0.020 Peak| | 0.0233| 0.315 ---------------+--------+--------+--------- RxCan1[352] Avg| 6.64| 0.1675| 0.024 Peak| | 0.1818| 1.048 ---------------+--------+--------+--------- RxCan1[355] Avg| 2.00| 0.0540| 0.027 Peak| | 0.0619| 1.209 ---------------+--------+--------+--------- RxCan1[35e] Avg| 9.98| 0.2221| 0.021 Peak| | 0.2284| 1.186 ---------------+--------+--------+--------- RxCan1[365] Avg| 10.00| 0.2282| 0.023 Peak| | 0.2335| 0.769 ---------------+--------+--------+--------- RxCan1[366] Avg| 10.00| 0.3163| 0.022 Peak| | 0.6330| 23.587 ---------------+--------+--------+--------- RxCan1[367] Avg| 10.00| 0.2417| 0.021 Peak| | 0.2568| 1.417 ---------------+--------+--------+--------- RxCan1[368] Avg| 9.96| 0.2187| 0.019 Peak| | 0.2250| 1.135 ---------------+--------+--------+--------- RxCan1[369] Avg| 9.99| 0.2277| 0.021 Peak| | 0.2334| 0.667 ---------------+--------+--------+--------- RxCan1[380] Avg| 9.96| 0.2133| 0.020 Peak| | 0.2161| 0.560 ---------------+--------+--------+--------- RxCan1[38b] Avg| 24.92| 0.5622| 0.022 Peak| | 0.5716| 1.618 ---------------+--------+--------+--------- RxCan1[3b3] Avg| 10.00| 0.2132| 0.023 Peak| | 0.2194| 1.106 ---------------+--------+--------+--------- RxCan1[400] Avg| 4.00| 0.0885| 0.019 Peak| | 0.0885| 0.570 ---------------+--------+--------+--------- RxCan1[405] Avg| 3.70| 0.1414| 0.036 Peak| | 0.1414| 0.710 ---------------+--------+--------+--------- RxCan1[40a] Avg| 8.00| 0.1887| 0.021 Peak| | 0.1887| 1.027 ---------------+--------+--------+--------- RxCan1[410] Avg| 10.00| 0.2141| 0.023 Peak| | 0.2188| 0.984 ---------------+--------+--------+--------- RxCan1[411] Avg| 10.00| 0.2325| 0.023 Peak| | 0.2447| 0.660 ---------------+--------+--------+--------- RxCan1[416] Avg| 10.00| 0.2326| 0.022 Peak| | 0.2389| 0.774 ---------------+--------+--------+--------- RxCan1[421] Avg| 10.00| 0.2245| 0.021 Peak| | 0.2271| 1.160 ---------------+--------+--------+--------- RxCan1[42d] Avg| 10.00| 0.2315| 0.021 Peak| | 0.2411| 0.677 ---------------+--------+--------+--------- RxCan1[42f] Avg| 10.00| 0.2480| 0.020 Peak| | 0.2975| 8.093 ---------------+--------+--------+--------- RxCan1[430] Avg| 10.00| 0.2203| 0.019 Peak| | 0.2302| 0.847 ---------------+--------+--------+--------- RxCan1[434] Avg| 10.00| 0.2331| 0.019 Peak| | 0.2620| 1.150 ---------------+--------+--------+--------- RxCan1[435] Avg| 6.68| 0.1445| 0.020 Peak| | 0.1486| 1.063 ---------------+--------+--------+--------- RxCan1[43e] Avg| 20.00| 0.4515| 0.021 Peak| | 0.4632| 1.013 ---------------+--------+--------+--------- RxCan1[440] Avg| 1.00| 0.0210| 0.019 Peak| | 0.0218| 0.294 ---------------+--------+--------+--------- RxCan1[465] Avg| 0.95| 0.0214| 0.023 Peak| | 0.0215| 0.587 ---------------+--------+--------+--------- RxCan1[466] Avg| 0.95| 0.0211| 0.021 Peak| | 0.0215| 0.350 ---------------+--------+--------+--------- RxCan1[467] Avg| 0.95| 0.0191| 0.020 Peak| | 0.0201| 0.444 ---------------+--------+--------+--------- RxCan1[472] Avg| 0.68| 0.0588| 0.085 Peak| | 0.0606| 1.170 ---------------+--------+--------+--------- RxCan1[473] Avg| 0.66| 0.0407| 0.062 Peak| | 0.0492| 1.329 ---------------+--------+--------+--------- RxCan1[474] Avg| 1.00| 0.0218| 0.021 Peak| | 0.0237| 0.278 ---------------+--------+--------+--------- RxCan1[475] Avg| 1.96| 0.0466| 0.024 Peak| | 0.0570| 1.112 ---------------+--------+--------+--------- RxCan1[476] Avg| 2.00| 0.0454| 0.020 Peak| | 0.0497| 0.409 ---------------+--------+--------+--------- RxCan1[477] Avg| 2.00| 0.0497| 0.022 Peak| | 0.0595| 0.864 ---------------+--------+--------+--------- RxCan1[595] Avg| 1.00| 0.0223| 0.021 Peak| | 0.0241| 0.296 ---------------+--------+--------+--------- RxCan1[59e] Avg| 1.00| 0.0233| 0.024 Peak| | 0.0289| 0.713 ---------------+--------+--------+--------- RxCan1[5a2] Avg| 1.00| 0.0200| 0.020 Peak| | 0.0204| 0.264 ---------------+--------+--------+--------- RxCan1[5ba] Avg| 1.00| 0.0206| 0.021 Peak| | 0.0238| 0.515 ---------------+--------+--------+--------- RxCan2[020] Avg| 33.30| 0.7938| 0.022 Peak| | 0.7938| 4.793 ---------------+--------+--------+--------- RxCan2[030] Avg| 22.20| 0.5229| 0.022 Peak| | 0.5229| 0.985 ---------------+--------+--------+--------- RxCan2[03a] Avg| 19.90| 0.4700| 0.022 Peak| | 0.4700| 0.804 ---------------+--------+--------+--------- RxCan2[040] Avg| 19.90| 0.4678| 0.023 Peak| | 0.4678| 1.222 ---------------+--------+--------+--------- RxCan2[060] Avg| 20.00| 0.6480| 0.050 Peak| | 0.6480| 20.997 ---------------+--------+--------+--------- RxCan2[070] Avg| 16.60| 0.3944| 0.022 Peak| | 0.3944| 1.053 ---------------+--------+--------+--------- RxCan2[080] Avg| 16.70| 0.7032| 0.041 Peak| | 0.7032| 1.611 ---------------+--------+--------+--------- RxCan2[083] Avg| 20.10| 0.4329| 0.021 Peak| | 0.4329| 0.520 ---------------+--------+--------+--------- RxCan2[090] Avg| 24.90| 0.5674| 0.017 Peak| | 0.5674| 1.149 ---------------+--------+--------+--------- RxCan2[0a0] Avg| 16.60| 0.3836| 0.023 Peak| | 0.3836| 0.933 ---------------+--------+--------+--------- RxCan2[100] Avg| 16.50| 0.3661| 0.021 Peak| | 0.3661| 0.740 ---------------+--------+--------+--------- RxCan2[108] Avg| 24.90| 0.5923| 0.025 Peak| | 0.5923| 0.859 ---------------+--------+--------+--------- RxCan2[110] Avg| 16.70| 0.3906| 0.023 Peak| | 0.3906| 0.697 ---------------+--------+--------+--------- RxCan2[130] Avg| 14.40| 0.3341| 0.022 Peak| | 0.3341| 0.829 ---------------+--------+--------+--------- RxCan2[150] Avg| 16.50| 0.4025| 0.020 Peak| | 0.4025| 1.120 ---------------+--------+--------+--------- RxCan2[160] Avg| 4.90| 0.1252| 0.025 Peak| | 0.1252| 0.502 ---------------+--------+--------+--------- RxCan2[180] Avg| 16.60| 0.3899| 0.023 Peak| | 0.3899| 0.799 ---------------+--------+--------+--------- RxCan2[190] Avg| 16.60| 0.3892| 0.025 Peak| | 0.3892| 1.172 ---------------+--------+--------+--------- RxCan2[1a0] Avg| 1.00| 0.0281| 0.025 Peak| | 0.0281| 0.695 ---------------+--------+--------+--------- RxCan2[1a4] Avg| 20.00| 0.4525| 0.022 Peak| | 0.4525| 1.231 ---------------+--------+--------+--------- RxCan2[1a8] Avg| 12.50| 0.2886| 0.020 Peak| | 0.2886| 1.048 ---------------+--------+--------+--------- RxCan2[1b0] Avg| 10.00| 0.2300| 0.023 Peak| | 0.2300| 0.579 ---------------+--------+--------+--------- RxCan2[1b4] Avg| 10.00| 0.2334| 0.022 Peak| | 0.2334| 0.947 ---------------+--------+--------+--------- RxCan2[1b8] Avg| 12.40| 0.2970| 0.023 Peak| | 0.2970| 0.909 ---------------+--------+--------+--------- RxCan2[1c0] Avg| 10.00| 0.2257| 0.021 Peak| | 0.2257| 0.983 ---------------+--------+--------+--------- RxCan2[1e0] Avg| 10.00| 0.2141| 0.023 Peak| | 0.2141| 0.556 ---------------+--------+--------+--------- RxCan2[215] Avg| 8.30| 0.2047| 0.025 Peak| | 0.2047| 0.786 ---------------+--------+--------+--------- RxCan2[217] Avg| 8.30| 0.2033| 0.022 Peak| | 0.2033| 1.135 ---------------+--------+--------+--------- RxCan2[220] Avg| 6.70| 0.1647| 0.020 Peak| | 0.1647| 0.961 ---------------+--------+--------+--------- RxCan2[225] Avg| 24.90| 0.6136| 0.026 Peak| | 0.6136| 1.018 ---------------+--------+--------+--------- RxCan2[230] Avg| 6.70| 0.4045| 0.057 Peak| | 0.4045| 1.532 ---------------+--------+--------+--------- RxCan2[240] Avg| 8.20| 0.1849| 0.021 Peak| | 0.1849| 0.510 ---------------+--------+--------+--------- RxCan2[241] Avg| 20.00| 0.4312| 0.021 Peak| | 0.4312| 5.110 ---------------+--------+--------+--------- RxCan2[250] Avg| 5.00| 0.1072| 0.021 Peak| | 0.1072| 0.320 ---------------+--------+--------+--------- RxCan2[255] Avg| 12.50| 0.3091| 0.022 Peak| | 0.3091| 0.904 ---------------+--------+--------+--------- RxCan2[265] Avg| 12.50| 0.2819| 0.021 Peak| | 0.2819| 1.035 ---------------+--------+--------+--------- RxCan2[270] Avg| 5.00| 0.1189| 0.022 Peak| | 0.1189| 0.631 ---------------+--------+--------+--------- RxCan2[290] Avg| 3.30| 0.0740| 0.023 Peak| | 0.0740| 0.455 ---------------+--------+--------+--------- RxCan2[295] Avg| 6.60| 0.1431| 0.023 Peak| | 0.1431| 0.504 ---------------+--------+--------+--------- RxCan2[2a0] Avg| 3.30| 0.0686| 0.020 Peak| | 0.0686| 0.445 ---------------+--------+--------+--------- RxCan2[2a7] Avg| 12.50| 0.2869| 0.021 Peak| | 0.2869| 0.660 ---------------+--------+--------+--------- RxCan2[2b0] Avg| 3.20| 0.0707| 0.023 Peak| | 0.0707| 0.331 ---------------+--------+--------+--------- RxCan2[2c0] Avg| 3.20| 0.0988| 0.026 Peak| | 0.0988| 0.932 ---------------+--------+--------+--------- RxCan2[2e0] Avg| 1.60| 0.0388| 0.024 Peak| | 0.0388| 0.393 ---------------+--------+--------+--------- RxCan2[2f0] Avg| 1.70| 0.0376| 0.021 Peak| | 0.0376| 0.282 ---------------+--------+--------+--------- RxCan2[2f5] Avg| 12.50| 0.2833| 0.021 Peak| | 0.2833| 0.855 ---------------+--------+--------+--------- RxCan2[300] Avg| 1.70| 0.0398| 0.023 Peak| | 0.0398| 0.488 ---------------+--------+--------+--------- RxCan2[310] Avg| 1.60| 0.0480| 0.026 Peak| | 0.0480| 0.937 ---------------+--------+--------+--------- RxCan2[320] Avg| 1.70| 0.0346| 0.020 Peak| | 0.0346| 0.370 ---------------+--------+--------+--------- RxCan2[326] Avg| 9.90| 0.2200| 0.022 Peak| | 0.2200| 0.502 ---------------+--------+--------+--------- RxCan2[330] Avg| 32.30| 0.7323| 0.021 Peak| | 0.7323| 1.130 ---------------+--------+--------+--------- RxCan2[340] Avg| 8.20| 0.2375| 0.028 Peak| | 0.2375| 0.578 ---------------+--------+--------+--------- RxCan2[345] Avg| 1.60| 0.0393| 0.022 Peak| | 0.0393| 0.590 ---------------+--------+--------+--------- RxCan2[35e] Avg| 5.00| 0.1303| 0.023 Peak| | 0.1303| 0.943 ---------------+--------+--------+--------- RxCan2[360] Avg| 1.70| 0.0381| 0.025 Peak| | 0.0381| 0.922 ---------------+--------+--------+--------- RxCan2[361] Avg| 8.20| 0.1907| 0.023 Peak| | 0.1907| 1.119 ---------------+--------+--------+--------- RxCan2[363] Avg| 1.30| 0.0337| 0.024 Peak| | 0.0337| 0.425 ---------------+--------+--------+--------- RxCan2[370] Avg| 0.90| 0.0194| 0.022 Peak| | 0.0194| 0.246 ---------------+--------+--------+--------- RxCan2[381] Avg| 3.20| 0.0684| 0.024 Peak| | 0.0684| 0.828 ---------------+--------+--------+--------- RxCan2[3a0] Avg| 16.60| 0.3734| 0.022 Peak| | 0.3734| 0.636 ---------------+--------+--------+--------- RxCan2[3d0] Avg| 10.00| 0.2262| 0.023 Peak| | 0.2262| 0.663 ---------------+--------+--------+--------- RxCan2[3d5] Avg| 5.60| 0.1335| 0.022 Peak| | 0.1335| 1.222 ---------------+--------+--------+--------- RxCan2[400] Avg| 4.00| 0.0949| 0.022 Peak| | 0.0949| 0.715 ---------------+--------+--------+--------- RxCan2[405] Avg| 3.70| 0.0861| 0.022 Peak| | 0.0861| 0.443 ---------------+--------+--------+--------- RxCan2[40a] Avg| 8.00| 0.1853| 0.021 Peak| | 0.1853| 0.552 ---------------+--------+--------+--------- RxCan2[415] Avg| 1.60| 0.0341| 0.021 Peak| | 0.0341| 0.273 ---------------+--------+--------+--------- RxCan2[435] Avg| 0.90| 0.0220| 0.025 Peak| | 0.0220| 0.354 ---------------+--------+--------+--------- RxCan2[440] Avg| 0.90| 0.0199| 0.021 Peak| | 0.0199| 0.266 ---------------+--------+--------+--------- RxCan2[465] Avg| 0.90| 0.0234| 0.028 Peak| | 0.0234| 0.633 ---------------+--------+--------+--------- RxCan2[466] Avg| 1.00| 0.0222| 0.021 Peak| | 0.0222| 0.322 ---------------+--------+--------+--------- RxCan2[467] Avg| 1.00| 0.0221| 0.020 Peak| | 0.0221| 0.355 ---------------+--------+--------+--------- RxCan2[501] Avg| 1.50| 0.0335| 0.023 Peak| | 0.0335| 0.393 ---------------+--------+--------+--------- RxCan2[503] Avg| 1.50| 0.0370| 0.022 Peak| | 0.0370| 0.546 ---------------+--------+--------+--------- RxCan2[504] Avg| 1.40| 0.0328| 0.022 Peak| | 0.0328| 0.489 ---------------+--------+--------+--------- RxCan2[505] Avg| 1.40| 0.0290| 0.021 Peak| | 0.0290| 0.354 ---------------+--------+--------+--------- RxCan2[508] Avg| 1.40| 0.0318| 0.023 Peak| | 0.0318| 0.408 ---------------+--------+--------+--------- RxCan2[511] Avg| 1.40| 0.0306| 0.022 Peak| | 0.0306| 0.328 ---------------+--------+--------+--------- RxCan2[51e] Avg| 1.40| 0.0310| 0.022 Peak| | 0.0310| 0.269 ---------------+--------+--------+--------- RxCan2[581] Avg| 1.00| 0.0222| 0.022 Peak| | 0.0222| 0.256 ---------------+--------+--------+--------- Cmd:State Avg| 0.00| 0.0000| 0.002 Peak| | 0.0000| 0.024 ===============+========+========+========= Total Avg| 2795.57| 82.7745| 40.174
Cheers, Simon
Am 17.01.2025 um 17:49 schrieb Michael Balzer via OvmsDev:
OK, I've got a new idea: CAN timing.
Comparing our esp32can bit timing to the esp-idf driver's, there seem to be some differences: https://github.com/espressif/esp-idf/blob/master/components/hal/include/hal/...
Transceivers are normally tolerant to small timing offsets. Maybe being off a little bit has no effect under normal conditions, but it has when the transceiver has to cope with a filled RX queue. That could be causing the transceiver to slide just out of sync. If the timing gets garbled, the transceiver would signal errors in the packets to the bus, possibly so many the vehicle ECUs decide to raise an error condition.
Is that plausible?
On why the new poller could be causing this (in combination with too slow processing by the vehicle): as mentioned, the standard CAN listener mechanism doesn't care about queue overflows. The poller does. `OvmsPollers::Queue_PollerFrame()` does a log call when Tx/Rx tracing is enabled, that could even block, but tracing is optional and only meant for debugging. Not optional is the overflow counting using an atomic uint32.
The atomic types are said to be fast, but I never checked their actual implementation on the ESP32. Maybe they can block as well?
@Simon: it would be an option to try commenting out the overflow counting, to see if that's causing the issue.
Regards, Michael
Am 17.01.25 um 15:37 schrieb Chris Box via OvmsDev:
Yes, I can confirm I've had one experience of the Leaf switching to Neutral while driving, with a yellow warning symbol on the dash. It refused to reselect Drive until I had switched the car off and back on. Derek wasn't so lucky and he need to clear fault codes before the car would work.
On returning home, I found OVMS was not accessible over a network. I didn't try a USB cable. Unplugging and reinserting the OBD cable caused OVMS to rejoin Wi-Fi. However the SD logs showed nothing from the time of the event. CAN writes are enabled, so it can perform SOC limiting.
My car has been using this firmware since 21st November, based on the git master of that day. As a relatively new user of OVMS (only since October) I don't have much experience of older firmware.
Perhaps a safeguard should be implemented before releasing a new stable firmware that will be automatically downloaded by Leaf owners. But I don't have the expertise to know what that safeguard should be. Derek's suggestion of 'only CAN write when parked' appears to be a good idea.
Chris
On 2025-01-15 18:18, Derek Caudwell via OvmsDev wrote:
Since the following email I have high confidence the issue on the Leaf is related/caused by the poller as there has been no further occurrence and Chris has also experienced the car going to neutral on the new poller firmware.
.... I haven't ruled out it being a fault with my car yet. Shortly after it faulted the car was run into so has been off the road for sometime, my first step was to replace 12V battery. The ovms unit is now unplugged and if it does not fault over the next month while driving I'll be reasonably confident it's ovms related. Not sure which firmware version the poller updates were included in but it was only after upgrading to it that the errors occurred (which could be coincidental however it has faulted twice more both on version 3.3.004-141-gf729d82c). For periods where I reverted to 3.3.003 it was fine. It might be useful to have an extra option on the enable can write to only enable it when the car is parked/charging.
_______________________________________________ OvmsDev mailing list OvmsDev@lists.openvehicles.com http://lists.openvehicles.com/mailman/listinfo/ovmsdev
-- Michael Balzer * Am Rahmen 5 * D-58313 Herdecke Fon 02330 9104094 * Handy 0176 20698926
_______________________________________________ OvmsDev mailing list OvmsDev@lists.openvehicles.com http://lists.openvehicles.com/mailman/listinfo/ovmsdev
_______________________________________________ OvmsDev mailing list OvmsDev@lists.openvehicles.com http://lists.openvehicles.com/mailman/listinfo/ovmsdev
-- Michael Balzer * Am Rahmen 5 * D-58313 Herdecke Fon 02330 9104094 * Handy 0176 20698926
_______________________________________________ OvmsDev mailing list OvmsDev@lists.openvehicles.com http://lists.openvehicles.com/mailman/listinfo/ovmsdev
-- Michael Balzer * Am Rahmen 5 * D-58313 Herdecke Fon 02330 9104094 * Handy 0176 20698926
Ahh yes. That makes sense. I'll add that in and push it up to that p/r //. On Sun, 19 Jan 2025, 17:15 Michael Balzer, <dexter@expeedo.de> wrote:
Michael,
I suggest adding a standard bool member variable to reflect if any filter is defined, so `PollerRxCallback()` can just skip the filter test while that is false. A mutex has some overhead, even if used non-blocking, and a bool variable only read there will be sufficient to signal "apply filtering" to the callback. With the simple bool test, all vehicles that don't need filtering (i.e. most vehicles) will have a neglectible impact from this.
Regarding the overhead: the GCC atomic implementation should use the xtensa CPU builtin atomic support (SCOMPARE1 register & S32C1I instruction), so should be pretty fast and not use any interrupt disabling, see:
- https://gcc.gnu.org/wiki/Atomic (xtensa atomic support since gcc 4.4.0) - https://www.cadence.com/content/dam/cadence-www/global/en_US/documents/tools... (section 4.3.13)
So I still doubt the queue overflow is the real culprit.
But having the filter option doesn't hurt (with my suggestion above), and your changes to the queue processing look promising as well.
@Derek: what was your poller tracing & timing setup when you had the bus issue on the Leaf? I still think that was something related to your car or setup. There are currently 11 Leafs on my server running "edge" releases including the new poller, all without (reported) issues.
Regards, Michael
Am 19.01.25 um 04:26 schrieb Michael Geddes:
P/R Created https://github.com/openvehicles/Open-Vehicle-Monitoring-System-3/pull/1100 Let me know if you want me to split it up or ANY changes and I'll get onto it asap.
Maybe somebody could grab the code and check it out in the context of specifying some filters. This will prevent those messages from coming to the vehicle implementation at all.. and even from going through the poller queue. It is non-blocking meaning that the filter is briefly inopperational while the filter is being modified.
//.
On Sun, 19 Jan 2025 at 11:02, Michael Geddes <frog@bunyip.wheelycreek.net> wrote:
On Sat, 18 Jan 2025 at 17:08, Michael Balzer via OvmsDev < ovmsdev@lists.openvehicles.com> wrote:
I have commented out the line with the Atomic_Increment statement. Now I no longer receive any messages with “RX Task Queue Overflow Run” Here is the output of poller times status:
The main question is if you still get the CAN bus crash (vehicle running into issues) with that modification in active mode. Timing statistics were not expected to change.
I have a feeling that the atomic operations are along the lines of:
* Set Interrupts off * atomic operation * Set interrupts on
Which means no real 'blocking' .. just not allowing interrupts and therefor task switching for a couple of instructions.
Nearly 2800 frames per second is quite a lot, and most is on can1 with many frame periods at 20 ms. Yet the total processing time averages at 30-40 ms, so there is no actual CPU capacity issue for that amount of frames.
@Derek: can you please supply these statistics for the Leaf in drive mode as well?
Am 18.01.25 um 02:42 schrieb Michael Geddes via OvmsDev:
Maybe try setting CONFIG_OVMS_VEHICLE_CAN_RX_QUEUE_SIZE = 160 and see if that reduces the overflow?
Simons car sends at least 91 process data frame IDs on can1 and 84 on can2. Worst case would be these come all in within the shortest possible time span, that would mean the queue needs to be able to hold 175 frames. I'd add some headroom and round up to 200.
But keep in mind, if the Incoming processing actually occasionally gets blocked for up to 60 ms -- as indicated by Simons statistics --, the queue may need to be twice as large.
Am 18.01.25 um 02:42 schrieb Michael Geddes via OvmsDev:
I was thinking that the frame filter would be here: void OvmsPollers::PollerRxCallback(const CAN_frame_t* frame, bool success) { Queue_PollerFrame(*frame, success, false); } which I guess is executed in the task handling the CAN queue. (we don't know how many frames get dropped there).
Actually we do know that, or at least have some indication, as we count the CAN transceiver queue overruns. That info is included as "Rx overflw" in the can status output & as "rxovr" in the logs.
Adding a filter before queueing the frame would exclude the filtered IDs from all vehicle processing. I meant adding a filter just to exclude IDs from the timing statistics, assuming those are the culprits, as Simon wrote the issue only appears after enabling the timing statistics and printing them. That's why I asked if printing might need to lock the statistics for too long in case of such a long list.
Completely blocking ID ranges from processing by the vehicle should normally not be necessary, unless the Incoming handler is written very poorly.
Yet, if we add that, a mutex in the CAN RX callback must be avoided, or would need to be non-blocking:
The only real concern is thread safety between checking and adding to the filter - so the check itself might have to be mutexed. void OvmsPollers::PollerRxCallback(const CAN_frame_t* frame, bool success) { // Check filter { OvmsRecMutexLock lock(&m_filter_mutex); if (! m_filter->IsFiltered(frame)) return; } Queue_PollerFrame(*frame, success, false); }
A mutex like that could block the CAN task, which must be avoided at all cost. I introduced CAN callbacks for vehicles & applications that need to react to certain frames as fast as possible, e.g. to maintain control precedence, so cannot use the standard CAN listener mechanism (frame queueing).
The current poller callback use is OK, if (!) the atomic type really isn't the culprit, ie doesn't block.
So if (!) an ID filter needs to be added before queueing, it needs to be done in a way that needs no mutex. But I don't see an issue with the vehicle passing a fixed filter when registering with the poller/buses. The filter doesn't need to by mutable on the fly.
Regards, Michael
Am 17.01.25 um 19:42 schrieb Simon Ehlen via OvmsDev:
The poller statistics can help you track this down, but you need to have at least 10 seconds of statistics, the more the better. Rule of thumb: PRI average at 0.0/second means you don't have enough data yet.
There were again many messages with “RX Task Queue Overflow Run”. Here are the statistics of poller times status:
OVMS# poll times status Poller timing is: on Type | count | Utlztn | Time | per s | [%] | [ms] ---------------+--------+--------+--------- Poll:PRI Avg| 1.00| 0.0043| 0.004 Peak| | 0.0043| 0.052 ---------------+--------+--------+--------- RxCan1[010] Avg| 34.26| 1.6741| 0.015 Peak| | 1.6741| 1.182 ---------------+--------+--------+--------- RxCan1[030] Avg| 34.06| 1.7085| 0.020 Peak| | 1.7085| 1.390 ---------------+--------+--------+--------- RxCan1[041] Avg| 49.89| 0.8109| 0.016 Peak| | 0.8541| 1.098 ---------------+--------+--------+--------- RxCan1[049] Avg| 50.00| 1.5970| 0.019 Peak| | 1.7154| 32.233 ---------------+--------+--------+--------- RxCan1[04c] Avg| 49.92| 0.8340| 0.014 Peak| | 0.8933| 1.995 ---------------+--------+--------+--------- RxCan1[04d] Avg| 34.43| 1.6211| 0.014 Peak| | 1.6756| 1.318 ---------------+--------+--------+--------- RxCan1[076] Avg| 50.00| 0.8362| 0.024 Peak| | 0.8784| 2.185 ---------------+--------+--------+--------- RxCan1[077] Avg| 50.00| 0.7837| 0.014 Peak| | 0.8083| 1.156 ---------------+--------+--------+--------- RxCan1[07a] Avg| 34.31| 2.1870| 0.017 Peak| | 2.3252| 1.888 ---------------+--------+--------+--------- RxCan1[07d] Avg| 50.00| 0.8001| 0.013 Peak| | 0.8434| 1.150 ---------------+--------+--------+--------- RxCan1[0c8] Avg| 49.96| 0.8359| 0.013 Peak| | 0.8715| 1.171 ---------------+--------+--------+--------- RxCan1[11a] Avg| 34.35| 1.6701| 0.020 Peak| | 1.6981| 1.273 ---------------+--------+--------+--------- RxCan1[130] Avg| 50.00| 0.7902| 0.018 Peak| | 0.8513| 0.980 ---------------+--------+--------+--------- RxCan1[139] Avg| 49.92| 0.7872| 0.013 Peak| | 0.8219| 0.795 ---------------+--------+--------+--------- RxCan1[156] Avg| 10.00| 0.1620| 0.014 Peak| | 0.1729| 0.919 ---------------+--------+--------+--------- RxCan1[160] Avg| 50.04| 0.7977| 0.014 Peak| | 0.8232| 1.495 ---------------+--------+--------+--------- RxCan1[165] Avg| 49.85| 0.7976| 0.014 Peak| | 0.8486| 1.015 ---------------+--------+--------+--------- RxCan1[167] Avg| 34.39| 1.6025| 0.016 Peak| | 1.6888| 1.354 ---------------+--------+--------+--------- RxCan1[171] Avg| 50.00| 0.8150| 0.017 Peak| | 0.8488| 1.091 ---------------+--------+--------+--------- RxCan1[178] Avg| 10.00| 0.1614| 0.014 Peak| | 0.1702| 0.903 ---------------+--------+--------+--------- RxCan1[179] Avg| 10.00| 0.1630| 0.017 Peak| | 0.1663| 1.336 ---------------+--------+--------+--------- RxCan1[180] Avg| 50.00| 0.8137| 0.014 Peak| | 0.8605| 1.566 ---------------+--------+--------+--------- RxCan1[185] Avg| 50.04| 0.8033| 0.013 Peak| | 0.8393| 1.126 ---------------+--------+--------+--------- RxCan1[1a0] Avg| 49.92| 0.7748| 0.013 Peak| | 0.8169| 1.184 ---------------+--------+--------+--------- RxCan1[1e0] Avg| 49.92| 0.7738| 0.014 Peak| | 0.8028| 1.049 ---------------+--------+--------+--------- RxCan1[1e4] Avg| 49.89| 0.9692| 0.018 Peak| | 1.0096| 1.332 ---------------+--------+--------+--------- RxCan1[1f0] Avg| 33.22| 0.5544| 0.014 Peak| | 0.5855| 0.848 ---------------+--------+--------+--------- RxCan1[200] Avg| 49.92| 0.7879| 0.015 Peak| | 0.8345| 1.206 ---------------+--------+--------+--------- RxCan1[202] Avg| 34.28| 1.7075| 0.016 Peak| | 1.7874| 1.218 ---------------+--------+--------+--------- RxCan1[204] Avg| 34.35| 1.5641| 0.013 Peak| | 1.6427| 1.235 ---------------+--------+--------+--------- RxCan1[213] Avg| 49.89| 0.7814| 0.015 Peak| | 0.8232| 0.910 ---------------+--------+--------+--------- RxCan1[214] Avg| 49.92| 0.7736| 0.014 Peak| | 0.8216| 0.800 ---------------+--------+--------+--------- RxCan1[217] Avg| 34.31| 1.6294| 0.014 Peak| | 1.7165| 1.153 ---------------+--------+--------+--------- RxCan1[218] Avg| 49.86| 0.7877| 0.013 Peak| | 0.8290| 1.068 ---------------+--------+--------+--------- RxCan1[230] Avg| 50.00| 0.7596| 0.014 Peak| | 0.7660| 1.021 ---------------+--------+--------+--------- RxCan1[240] Avg| 10.00| 0.1669| 0.013 Peak| | 0.1835| 0.887 ---------------+--------+--------+--------- RxCan1[242] Avg| 24.96| 0.4764| 0.020 Peak| | 0.4963| 1.501 ---------------+--------+--------+--------- RxCan1[24a] Avg| 9.89| 0.1789| 0.015 Peak| | 0.2009| 0.874 ---------------+--------+--------+--------- RxCan1[24b] Avg| 9.89| 0.1702| 0.014 Peak| | 0.1870| 1.195 ---------------+--------+--------+--------- RxCan1[24c] Avg| 9.89| 0.2146| 0.019 Peak| | 0.2187| 1.242 ---------------+--------+--------+--------- RxCan1[25a] Avg| 10.00| 0.1603| 0.013 Peak| | 0.1667| 0.720 ---------------+--------+--------+--------- RxCan1[25b] Avg| 49.94| 0.7918| 0.017 Peak| | 0.8454| 1.666 ---------------+--------+--------+--------- RxCan1[25c] Avg| 34.24| 1.5331| 0.013 Peak| | 1.5997| 1.538 ---------------+--------+--------+--------- RxCan1[260] Avg| 10.00| 0.1626| 0.014 Peak| | 0.1682| 0.718 ---------------+--------+--------+--------- RxCan1[270] Avg| 49.90| 0.8120| 0.014 Peak| | 0.8460| 1.671 ---------------+--------+--------+--------- RxCan1[280] Avg| 49.92| 0.7777| 0.019 Peak| | 0.8447| 1.157 ---------------+--------+--------+--------- RxCan1[2e4] Avg| 19.89| 0.5778| 0.032 Peak| | 0.6648| 2.226 ---------------+--------+--------+--------- RxCan1[2ec] Avg| 10.00| 0.1701| 0.014 Peak| | 0.1755| 0.928 ---------------+--------+--------+--------- RxCan1[2ed] Avg| 10.00| 0.1650| 0.013 Peak| | 0.1747| 0.917 ---------------+--------+--------+--------- RxCan1[2ee] Avg| 9.98| 0.1544| 0.013 Peak| | 0.1588| 1.312 ---------------+--------+--------+--------- RxCan1[312] Avg| 10.00| 0.1648| 0.017 Peak| | 0.1690| 0.922 ---------------+--------+--------+--------- RxCan1[326] Avg| 9.89| 0.1603| 0.015 Peak| | 0.1833| 1.230 ---------------+--------+--------+--------- RxCan1[336] Avg| 1.00| 0.0146| 0.015 Peak| | 0.0150| 0.349 ---------------+--------+--------+--------- RxCan1[352] Avg| 6.66| 0.1223| 0.022 Peak| | 0.1338| 1.015 ---------------+--------+--------+--------- RxCan1[355] Avg| 2.00| 0.0424| 0.019 Peak| | 0.0431| 0.786 ---------------+--------+--------+--------- RxCan1[35e] Avg| 9.96| 0.1570| 0.013 Peak| | 0.1644| 0.579 ---------------+--------+--------+--------- RxCan1[365] Avg| 10.00| 0.1600| 0.014 Peak| | 0.1653| 0.961 ---------------+--------+--------+--------- RxCan1[366] Avg| 10.00| 0.1716| 0.013 Peak| | 0.1890| 0.987 ---------------+--------+--------+--------- RxCan1[367] Avg| 9.93| 0.1793| 0.015 Peak| | 0.1864| 0.984 ---------------+--------+--------+--------- RxCan1[368] Avg| 10.00| 0.1645| 0.014 Peak| | 0.1778| 0.768 ---------------+--------+--------+--------- RxCan1[369] Avg| 10.00| 0.1562| 0.016 Peak| | 0.1606| 0.724 ---------------+--------+--------+--------- RxCan1[380] Avg| 10.00| 0.1619| 0.014 Peak| | 0.1644| 0.605 ---------------+--------+--------+--------- RxCan1[38b] Avg| 25.00| 0.3991| 0.016 Peak| | 0.4280| 1.448 ---------------+--------+--------+--------- RxCan1[3b3] Avg| 10.00| 0.1537| 0.013 Peak| | 0.1610| 0.380 ---------------+--------+--------+--------- RxCan1[400] Avg| 4.00| 0.0626| 0.014 Peak| | 0.0626| 0.251 ---------------+--------+--------+--------- RxCan1[405] Avg| 3.90| 0.1019| 0.028 Peak| | 0.1019| 0.781 ---------------+--------+--------+--------- RxCan1[40a] Avg| 7.90| 0.1256| 0.020 Peak| | 0.1256| 0.991 ---------------+--------+--------+--------- RxCan1[410] Avg| 10.00| 0.1643| 0.016 Peak| | 0.1839| 1.634 ---------------+--------+--------+--------- RxCan1[411] Avg| 10.00| 0.1532| 0.013 Peak| | 0.1645| 0.824 ---------------+--------+--------+--------- RxCan1[416] Avg| 10.00| 0.1516| 0.016 Peak| | 0.1582| 0.807 ---------------+--------+--------+--------- RxCan1[421] Avg| 10.00| 0.1648| 0.013 Peak| | 0.1740| 0.839 ---------------+--------+--------+--------- RxCan1[42d] Avg| 10.00| 0.1548| 0.014 Peak| | 0.1658| 0.741 ---------------+--------+--------+--------- RxCan1[42f] Avg| 10.00| 0.1527| 0.013 Peak| | 0.1578| 0.667 ---------------+--------+--------+--------- RxCan1[430] Avg| 10.00| 0.1730| 0.016 Peak| | 0.1880| 1.209 ---------------+--------+--------+--------- RxCan1[434] Avg| 10.00| 0.1620| 0.021 Peak| | 0.1712| 1.140 ---------------+--------+--------+--------- RxCan1[435] Avg| 6.66| 0.1104| 0.014 Peak| | 0.1121| 1.011 ---------------+--------+--------+--------- RxCan1[43e] Avg| 20.00| 0.3194| 0.013 Peak| | 0.3434| 1.212 ---------------+--------+--------+--------- RxCan1[440] Avg| 1.00| 0.0160| 0.014 Peak| | 0.0175| 0.315 ---------------+--------+--------+--------- RxCan1[465] Avg| 1.00| 0.0172| 0.015 Peak| | 0.0194| 0.404 ---------------+--------+--------+--------- RxCan1[466] Avg| 1.00| 0.0198| 0.015 Peak| | 0.0252| 0.890 ---------------+--------+--------+--------- RxCan1[467] Avg| 1.00| 0.0152| 0.014 Peak| | 0.0160| 0.217 ---------------+--------+--------+--------- RxCan1[472] Avg| 0.70| 0.0533| 0.075 Peak| | 0.0546| 0.990 ---------------+--------+--------+--------- RxCan1[473] Avg| 0.65| 0.0325| 0.051 Peak| | 0.0361| 0.774 ---------------+--------+--------+--------- RxCan1[474] Avg| 1.00| 0.0146| 0.014 Peak| | 0.0151| 0.189 ---------------+--------+--------+--------- RxCan1[475] Avg| 2.00| 0.0332| 0.015 Peak| | 0.0362| 0.513 ---------------+--------+--------+--------- RxCan1[476] Avg| 2.00| 0.0305| 0.014 Peak| | 0.0307| 0.249 ---------------+--------+--------+--------- RxCan1[477] Avg| 2.00| 0.0309| 0.014 Peak| | 0.0311| 0.438 ---------------+--------+--------+--------- RxCan1[595] Avg| 1.00| 0.0151| 0.014 Peak| | 0.0160| 0.230 ---------------+--------+--------+--------- RxCan1[59e] Avg| 1.00| 0.0179| 0.015 Peak| | 0.0209| 0.716 ---------------+--------+--------+--------- RxCan1[5a2] Avg| 1.00| 0.0154| 0.016 Peak| | 0.0184| 0.699 ---------------+--------+--------+--------- RxCan1[5ba] Avg| 1.00| 0.0159| 0.017 Peak| | 0.0174| 0.485 ---------------+--------+--------+--------- RxCan2[010] Avg| 0.00| 0.0000| 0.015 Peak| | 0.0000| 0.146 ---------------+--------+--------+--------- RxCan2[020] Avg| 31.10| 0.5159| 0.015 Peak| | 0.5730| 0.992 ---------------+--------+--------+--------- RxCan2[030] Avg| 20.70| 0.3506| 0.016 Peak| | 0.3956| 1.055 ---------------+--------+--------+--------- RxCan2[03a] Avg| 18.65| 0.3157| 0.014 Peak| | 0.3292| 0.702 ---------------+--------+--------+--------- RxCan2[040] Avg| 18.60| 0.3111| 0.015 Peak| | 0.3474| 0.953 ---------------+--------+--------+--------- RxCan2[060] Avg| 18.60| 0.3182| 0.014 Peak| | 0.3569| 0.694 ---------------+--------+--------+--------- RxCan2[070] Avg| 15.55| 0.4581| 0.017 Peak| | 0.6859| 39.212 ---------------+--------+--------+--------- RxCan2[080] Avg| 15.50| 0.5041| 0.029 Peak| | 0.5414| 1.555 ---------------+--------+--------+--------- RxCan2[083] Avg| 18.70| 0.3083| 0.014 Peak| | 0.3325| 0.557 ---------------+--------+--------+--------- RxCan2[090] Avg| 23.40| 0.3961| 0.014 Peak| | 0.4445| 1.218 ---------------+--------+--------+--------- RxCan2[0a0] Avg| 15.55| 0.2734| 0.014 Peak| | 0.3144| 1.062 ---------------+--------+--------+--------- RxCan2[100] Avg| 15.50| 0.2645| 0.016 Peak| | 0.2875| 1.021 ---------------+--------+--------+--------- RxCan2[108] Avg| 23.40| 0.4231| 0.016 Peak| | 0.4680| 1.297 ---------------+--------+--------+--------- RxCan2[110] Avg| 15.55| 0.2467| 0.014 Peak| | 0.2684| 0.475 ---------------+--------+--------+--------- RxCan2[130] Avg| 13.30| 0.2231| 0.014 Peak| | 0.2447| 0.512 ---------------+--------+--------+--------- RxCan2[150] Avg| 15.50| 0.2533| 0.015 Peak| | 0.2836| 0.823 ---------------+--------+--------+--------- RxCan2[160] Avg| 4.70| 0.0784| 0.014 Peak| | 0.0863| 0.608 ---------------+--------+--------+--------- RxCan2[180] Avg| 15.55| 0.2713| 0.015 Peak| | 0.2841| 0.884 ---------------+--------+--------+--------- RxCan2[190] Avg| 15.50| 0.2596| 0.014 Peak| | 0.2825| 0.743 ---------------+--------+--------+--------- RxCan2[1a0] Avg| 0.95| 0.0164| 0.015 Peak| | 0.0164| 0.346 ---------------+--------+--------+--------- RxCan2[1a4] Avg| 18.65| 0.3232| 0.015 Peak| | 0.3515| 0.989 ---------------+--------+--------+--------- RxCan2[1a8] Avg| 11.60| 0.1911| 0.016 Peak| | 0.2012| 0.757 ---------------+--------+--------+--------- RxCan2[1b0] Avg| 9.35| 0.1558| 0.016 Peak| | 0.1641| 0.795 ---------------+--------+--------+--------- RxCan2[1b4] Avg| 9.35| 0.1543| 0.015 Peak| | 0.1617| 1.217 ---------------+--------+--------+--------- RxCan2[1b8] Avg| 11.65| 0.2003| 0.014 Peak| | 0.2236| 1.549 ---------------+--------+--------+--------- RxCan2[1c0] Avg| 9.40| 0.1532| 0.016 Peak| | 0.1673| 0.955 ---------------+--------+--------+--------- RxCan2[1e0] Avg| 9.30| 0.1582| 0.015 Peak| | 0.1708| 0.661 ---------------+--------+--------+--------- RxCan2[215] Avg| 7.80| 0.1409| 0.016 Peak| | 0.1531| 0.660 ---------------+--------+--------+--------- RxCan2[217] Avg| 7.80| 0.1239| 0.014 Peak| | 0.1333| 0.520 ---------------+--------+--------+--------- RxCan2[220] Avg| 6.20| 0.1041| 0.015 Peak| | 0.1094| 0.652 ---------------+--------+--------+--------- RxCan2[225] Avg| 23.40| 0.4648| 0.015 Peak| | 0.4696| 4.288 ---------------+--------+--------+--------- RxCan2[230] Avg| 6.20| 0.3120| 0.048 Peak| | 0.3377| 1.065 ---------------+--------+--------+--------- RxCan2[240] Avg| 7.70| 0.1248| 0.014 Peak| | 0.1364| 0.635 ---------------+--------+--------+--------- RxCan2[241] Avg| 18.60| 0.3258| 0.014 Peak| | 0.3343| 1.288 ---------------+--------+--------+--------- RxCan2[250] Avg| 4.70| 0.0761| 0.014 Peak| | 0.0809| 0.322 ---------------+--------+--------+--------- RxCan2[255] Avg| 11.75| 0.2058| 0.014 Peak| | 0.2283| 0.937 ---------------+--------+--------+--------- RxCan2[265] Avg| 11.65| 0.1964| 0.014 Peak| | 0.2068| 0.965 ---------------+--------+--------+--------- RxCan2[270] Avg| 4.70| 0.0808| 0.016 Peak| | 0.0949| 0.729 ---------------+--------+--------+--------- RxCan2[290] Avg| 3.15| 0.0498| 0.015 Peak| | 0.0504| 0.449 ---------------+--------+--------+--------- RxCan2[295] Avg| 6.25| 0.1019| 0.014 Peak| | 0.1094| 0.859 ---------------+--------+--------+--------- RxCan2[2a0] Avg| 3.15| 0.0550| 0.014 Peak| | 0.0551| 0.779 ---------------+--------+--------+--------- RxCan2[2a7] Avg| 11.65| 0.1929| 0.014 Peak| | 0.2080| 0.775 ---------------+--------+--------+--------- RxCan2[2b0] Avg| 3.00| 0.0497| 0.015 Peak| | 0.0562| 0.528 ---------------+--------+--------+--------- RxCan2[2c0] Avg| 3.10| 0.0534| 0.016 Peak| | 0.0592| 0.501 ---------------+--------+--------+--------- RxCan2[2e0] Avg| 1.55| 0.0247| 0.014 Peak| | 0.0289| 0.319 ---------------+--------+--------+--------- RxCan2[2f0] Avg| 1.55| 0.0244| 0.014 Peak| | 0.0273| 0.192 ---------------+--------+--------+--------- RxCan2[2f5] Avg| 11.65| 0.2078| 0.016 Peak| | 0.2333| 0.879 ---------------+--------+--------+--------- RxCan2[300] Avg| 1.60| 0.0266| 0.018 Peak| | 0.0278| 0.724 ---------------+--------+--------+--------- RxCan2[310] Avg| 1.55| 0.0276| 0.016 Peak| | 0.0285| 0.759 ---------------+--------+--------+--------- RxCan2[320] Avg| 1.60| 0.0240| 0.014 Peak| | 0.0258| 0.179 ---------------+--------+--------+--------- RxCan2[326] Avg| 9.30| 0.1550| 0.014 Peak| | 0.1582| 0.850 ---------------+--------+--------+--------- RxCan2[330] Avg| 29.95| 0.5311| 0.015 Peak| | 0.5565| 4.522 ---------------+--------+--------+--------- RxCan2[340] Avg| 7.75| 0.1693| 0.024 Peak| | 0.1868| 1.148 ---------------+--------+--------+--------- RxCan2[345] Avg| 1.60| 0.0292| 0.016 Peak| | 0.0316| 0.471 ---------------+--------+--------+--------- RxCan2[350] Avg| 0.00| 0.0000| 0.019 Peak| | 0.0000| 0.188 ---------------+--------+--------+--------- RxCan2[35e] Avg| 4.70| 0.0851| 0.019 Peak| | 0.0911| 1.023 ---------------+--------+--------+--------- RxCan2[360] Avg| 1.60| 0.0258| 0.015 Peak| | 0.0284| 0.306 ---------------+--------+--------+--------- RxCan2[361] Avg| 7.75| 0.1341| 0.017 Peak| | 0.1487| 0.761 ---------------+--------+--------+--------- RxCan2[363] Avg| 1.20| 0.0203| 0.016 Peak| | 0.0220| 0.421 ---------------+--------+--------+--------- RxCan2[370] Avg| 0.85| 0.0140| 0.016 Peak| | 0.0162| 0.354 ---------------+--------+--------+--------- RxCan2[381] Avg| 3.15| 0.0512| 0.016 Peak| | 0.0546| 0.416 ---------------+--------+--------+--------- RxCan2[3a0] Avg| 15.60| 0.2548| 0.015 Peak| | 0.2890| 0.976 ---------------+--------+--------+--------- RxCan2[3d0] Avg| 9.35| 0.1553| 0.019 Peak| | 0.1612| 1.115 ---------------+--------+--------+--------- RxCan2[3d5] Avg| 5.15| 0.0836| 0.016 Peak| | 0.0867| 0.479 ---------------+--------+--------+--------- RxCan2[3e0] Avg| 0.00| 0.0000| 0.014 Peak| | 0.0000| 0.142 ---------------+--------+--------+--------- RxCan2[400] Avg| 3.55| 0.0613| 0.017 Peak| | 0.0695| 0.501 ---------------+--------+--------+--------- RxCan2[405] Avg| 3.50| 0.0584| 0.018 Peak| | 0.0626| 0.686 ---------------+--------+--------+--------- RxCan2[40a] Avg| 7.10| 0.1278| 0.017 Peak| | 0.1389| 1.244 ---------------+--------+--------+--------- RxCan2[415] Avg| 1.60| 0.0258| 0.014 Peak| | 0.0287| 0.266 ---------------+--------+--------+--------- RxCan2[435] Avg| 0.85| 0.0165| 0.019 Peak| | 0.0167| 0.367 ---------------+--------+--------+--------- RxCan2[440] Avg| 0.85| 0.0128| 0.019 Peak| | 0.0141| 0.885 ---------------+--------+--------+--------- RxCan2[465] Avg| 0.95| 0.0177| 0.016 Peak| | 0.0195| 0.721 ---------------+--------+--------+--------- RxCan2[466] Avg| 0.95| 0.0147| 0.014 Peak| | 0.0160| 0.184 ---------------+--------+--------+--------- RxCan2[467] Avg| 0.95| 0.0172| 0.017 Peak| | 0.0188| 0.391 ---------------+--------+--------+--------- RxCan2[501] Avg| 1.45| 0.0273| 0.016 Peak| | 0.0327| 0.996 ---------------+--------+--------+--------- RxCan2[503] Avg| 1.45| 0.0288| 0.020 Peak| | 0.0338| 0.970 ---------------+--------+--------+--------- RxCan2[504] Avg| 1.40| 0.0241| 0.015 Peak| | 0.0263| 0.609 ---------------+--------+--------+--------- RxCan2[505] Avg| 1.40| 0.0255| 0.015 Peak| | 0.0296| 0.866 ---------------+--------+--------+--------- RxCan2[508] Avg| 1.35| 0.0237| 0.017 Peak| | 0.0237| 0.384 ---------------+--------+--------+--------- RxCan2[511] Avg| 1.35| 0.0226| 0.016 Peak| | 0.0228| 0.426 ---------------+--------+--------+--------- RxCan2[51e] Avg| 1.40| 0.0221| 0.014 Peak| | 0.0245| 0.211 ---------------+--------+--------+--------- RxCan2[581] Avg| 0.80| 0.0189| 0.019 Peak| | 0.0290| 1.217 ---------------+--------+--------+--------- RxCan2[606] Avg| 0.00| 0.0000| 0.014 Peak| | 0.0000| 0.142 ---------------+--------+--------+--------- RxCan2[657] Avg| 0.00| 0.0000| 0.014 Peak| | 0.0000| 0.137 ---------------+--------+--------+--------- Cmd:State Avg| 0.00| 0.0000| 0.002 Peak| | 0.0000| 0.024 ===============+========+========+========= Total Avg| 2748.42| 58.3344| 28.718
@Simon: it would be an option to try commenting out the overflow counting, to see if that's causing the issue.
I have commented out the line with the Atomic_Increment statement. Now I no longer receive any messages with “RX Task Queue Overflow Run” Here is the output of poller times status:
OVMS# poll time status Poller timing is: on Type | count | Utlztn | Time | per s | [%] | [ms] ---------------+--------+--------+--------- Poll:PRI Avg| 1.00| 0.0045| 0.004 Peak| | 0.0046| 0.064 ---------------+--------+--------+--------- RxCan1[010] Avg| 34.26| 2.2574| 0.021 Peak| | 2.2574| 4.609 ---------------+--------+--------+--------- RxCan1[030] Avg| 34.26| 2.3820| 0.021 Peak| | 2.3820| 1.135 ---------------+--------+--------+--------- RxCan1[041] Avg| 49.89| 1.2059| 0.021 Peak| | 1.2295| 5.331 ---------------+--------+--------+--------- RxCan1[049] Avg| 49.96| 1.2400| 0.030 Peak| | 1.2699| 1.402 ---------------+--------+--------+--------- RxCan1[04c] Avg| 49.92| 1.1752| 0.021 Peak| | 1.2072| 4.502 ---------------+--------+--------+--------- RxCan1[04d] Avg| 34.31| 2.4433| 0.022 Peak| | 2.4773| 1.368 ---------------+--------+--------+--------- RxCan1[076] Avg| 49.96| 1.2071| 0.024 Peak| | 1.2554| 2.007 ---------------+--------+--------+--------- RxCan1[077] Avg| 49.96| 1.2012| 0.022 Peak| | 1.2492| 1.955 ---------------+--------+--------+--------- RxCan1[07a] Avg| 34.35| 2.9251| 0.030 Peak| | 3.1103| 1.829 ---------------+--------+--------+--------- RxCan1[07d] Avg| 49.96| 1.1954| 0.022 Peak| | 1.2282| 1.074 ---------------+--------+--------+--------- RxCan1[0c8] Avg| 49.89| 1.2491| 0.021 Peak| | 1.3169| 1.181 ---------------+--------+--------+--------- RxCan1[11a] Avg| 34.39| 2.4423| 0.024 Peak| | 2.5693| 1.491 ---------------+--------+--------+--------- RxCan1[130] Avg| 49.95| 1.1312| 0.020 Peak| | 1.1684| 1.218 ---------------+--------+--------+--------- RxCan1[139] Avg| 49.92| 1.1547| 0.021 Peak| | 1.1778| 1.199 ---------------+--------+--------+--------- RxCan1[156] Avg| 9.96| 0.2391| 0.023 Peak| | 0.2591| 1.943 ---------------+--------+--------+--------- RxCan1[160] Avg| 49.96| 1.1657| 0.031 Peak| | 1.2017| 2.158 ---------------+--------+--------+--------- RxCan1[165] Avg| 49.96| 1.1257| 0.021 Peak| | 1.1652| 1.471 ---------------+--------+--------+--------- RxCan1[167] Avg| 34.31| 2.2871| 0.021 Peak| | 2.3374| 1.776 ---------------+--------+--------+--------- RxCan1[171] Avg| 49.96| 1.1879| 0.023 Peak| | 1.2268| 1.166 ---------------+--------+--------+--------- RxCan1[178] Avg| 10.00| 0.2371| 0.029 Peak| | 0.2459| 1.516 ---------------+--------+--------+--------- RxCan1[179] Avg| 10.00| 0.2196| 0.021 Peak| | 0.2260| 0.758 ---------------+--------+--------+--------- RxCan1[180] Avg| 49.96| 1.1703| 0.022 Peak| | 1.2103| 1.481 ---------------+--------+--------+--------- RxCan1[185] Avg| 49.95| 1.1127| 0.020 Peak| | 1.1636| 1.292 ---------------+--------+--------+--------- RxCan1[1a0] Avg| 49.96| 1.1009| 0.020 Peak| | 1.1468| 1.060 ---------------+--------+--------+--------- RxCan1[1e0] Avg| 49.96| 1.1744| 0.021 Peak| | 1.2027| 1.240 ---------------+--------+--------+--------- RxCan1[1e4] Avg| 49.96| 1.3733| 0.032 Peak| | 1.4085| 1.523 ---------------+--------+--------+--------- RxCan1[1f0] Avg| 33.30| 0.7625| 0.023 Peak| | 0.8004| 3.349 ---------------+--------+--------+--------- RxCan1[200] Avg| 49.92| 1.1462| 0.021 Peak| | 1.1809| 1.254 ---------------+--------+--------+--------- RxCan1[202] Avg| 34.39| 2.4034| 0.028 Peak| | 2.5611| 1.472 ---------------+--------+--------+--------- RxCan1[204] Avg| 34.30| 2.2541| 0.022 Peak| | 2.2924| 2.015 ---------------+--------+--------+--------- RxCan1[213] Avg| 49.96| 1.1599| 0.027 Peak| | 1.1794| 1.714 ---------------+--------+--------+--------- RxCan1[214] Avg| 49.96| 1.1537| 0.022 Peak| | 1.1941| 1.439 ---------------+--------+--------+--------- RxCan1[217] Avg| 34.39| 2.2490| 0.020 Peak| | 2.2856| 3.766 ---------------+--------+--------+--------- RxCan1[218] Avg| 49.96| 1.1291| 0.021 Peak| | 1.1646| 1.547 ---------------+--------+--------+--------- RxCan1[230] Avg| 49.96| 1.1272| 0.020 Peak| | 1.2237| 1.295 ---------------+--------+--------+--------- RxCan1[240] Avg| 10.00| 0.2191| 0.021 Peak| | 0.2226| 1.067 ---------------+--------+--------+--------- RxCan1[242] Avg| 24.96| 0.6911| 0.024 Peak| | 0.7161| 1.180 ---------------+--------+--------+--------- RxCan1[24a] Avg| 9.96| 0.2345| 0.024 Peak| | 0.2535| 0.779 ---------------+--------+--------+--------- RxCan1[24b] Avg| 9.96| 0.2433| 0.023 Peak| | 0.2697| 2.085 ---------------+--------+--------+--------- RxCan1[24c] Avg| 9.96| 0.3103| 0.029 Peak| | 0.3203| 0.809 ---------------+--------+--------+--------- RxCan1[25a] Avg| 10.00| 0.2346| 0.022 Peak| | 0.2405| 1.223 ---------------+--------+--------+--------- RxCan1[25b] Avg| 49.89| 1.2121| 0.020 Peak| | 1.3659| 19.523 ---------------+--------+--------+--------- RxCan1[25c] Avg| 34.31| 2.4193| 0.019 Peak| | 2.8022| 58.153 ---------------+--------+--------+--------- RxCan1[260] Avg| 9.93| 0.2149| 0.024 Peak| | 0.2174| 1.096 ---------------+--------+--------+--------- RxCan1[270] Avg| 49.96| 1.2042| 0.026 Peak| | 1.2755| 20.612 ---------------+--------+--------+--------- RxCan1[280] Avg| 49.96| 1.0922| 0.020 Peak| | 1.1312| 1.266 ---------------+--------+--------+--------- RxCan1[2e4] Avg| 19.96| 0.6942| 0.044 Peak| | 0.8604| 1.533 ---------------+--------+--------+--------- RxCan1[2ec] Avg| 10.00| 0.3727| 0.025 Peak| | 0.5154| 28.819 ---------------+--------+--------+--------- RxCan1[2ed] Avg| 10.00| 0.2298| 0.023 Peak| | 0.2378| 1.345 ---------------+--------+--------+--------- RxCan1[2ee] Avg| 9.96| 0.2172| 0.019 Peak| | 0.2210| 1.058 ---------------+--------+--------+--------- RxCan1[312] Avg| 10.00| 0.2206| 0.020 Peak| | 0.2396| 1.060 ---------------+--------+--------+--------- RxCan1[326] Avg| 9.96| 0.2099| 0.020 Peak| | 0.2158| 0.507 ---------------+--------+--------+--------- RxCan1[336] Avg| 1.00| 0.0212| 0.020 Peak| | 0.0233| 0.315 ---------------+--------+--------+--------- RxCan1[352] Avg| 6.64| 0.1675| 0.024 Peak| | 0.1818| 1.048 ---------------+--------+--------+--------- RxCan1[355] Avg| 2.00| 0.0540| 0.027 Peak| | 0.0619| 1.209 ---------------+--------+--------+--------- RxCan1[35e] Avg| 9.98| 0.2221| 0.021 Peak| | 0.2284| 1.186 ---------------+--------+--------+--------- RxCan1[365] Avg| 10.00| 0.2282| 0.023 Peak| | 0.2335| 0.769 ---------------+--------+--------+--------- RxCan1[366] Avg| 10.00| 0.3163| 0.022 Peak| | 0.6330| 23.587 ---------------+--------+--------+--------- RxCan1[367] Avg| 10.00| 0.2417| 0.021 Peak| | 0.2568| 1.417 ---------------+--------+--------+--------- RxCan1[368] Avg| 9.96| 0.2187| 0.019 Peak| | 0.2250| 1.135 ---------------+--------+--------+--------- RxCan1[369] Avg| 9.99| 0.2277| 0.021 Peak| | 0.2334| 0.667 ---------------+--------+--------+--------- RxCan1[380] Avg| 9.96| 0.2133| 0.020 Peak| | 0.2161| 0.560 ---------------+--------+--------+--------- RxCan1[38b] Avg| 24.92| 0.5622| 0.022 Peak| | 0.5716| 1.618 ---------------+--------+--------+--------- RxCan1[3b3] Avg| 10.00| 0.2132| 0.023 Peak| | 0.2194| 1.106 ---------------+--------+--------+--------- RxCan1[400] Avg| 4.00| 0.0885| 0.019 Peak| | 0.0885| 0.570 ---------------+--------+--------+--------- RxCan1[405] Avg| 3.70| 0.1414| 0.036 Peak| | 0.1414| 0.710 ---------------+--------+--------+--------- RxCan1[40a] Avg| 8.00| 0.1887| 0.021 Peak| | 0.1887| 1.027 ---------------+--------+--------+--------- RxCan1[410] Avg| 10.00| 0.2141| 0.023 Peak| | 0.2188| 0.984 ---------------+--------+--------+--------- RxCan1[411] Avg| 10.00| 0.2325| 0.023 Peak| | 0.2447| 0.660 ---------------+--------+--------+--------- RxCan1[416] Avg| 10.00| 0.2326| 0.022 Peak| | 0.2389| 0.774 ---------------+--------+--------+--------- RxCan1[421] Avg| 10.00| 0.2245| 0.021 Peak| | 0.2271| 1.160 ---------------+--------+--------+--------- RxCan1[42d] Avg| 10.00| 0.2315| 0.021 Peak| | 0.2411| 0.677 ---------------+--------+--------+--------- RxCan1[42f] Avg| 10.00| 0.2480| 0.020 Peak| | 0.2975| 8.093 ---------------+--------+--------+--------- RxCan1[430] Avg| 10.00| 0.2203| 0.019 Peak| | 0.2302| 0.847 ---------------+--------+--------+--------- RxCan1[434] Avg| 10.00| 0.2331| 0.019 Peak| | 0.2620| 1.150 ---------------+--------+--------+--------- RxCan1[435] Avg| 6.68| 0.1445| 0.020 Peak| | 0.1486| 1.063 ---------------+--------+--------+--------- RxCan1[43e] Avg| 20.00| 0.4515| 0.021 Peak| | 0.4632| 1.013 ---------------+--------+--------+--------- RxCan1[440] Avg| 1.00| 0.0210| 0.019 Peak| | 0.0218| 0.294 ---------------+--------+--------+--------- RxCan1[465] Avg| 0.95| 0.0214| 0.023 Peak| | 0.0215| 0.587 ---------------+--------+--------+--------- RxCan1[466] Avg| 0.95| 0.0211| 0.021 Peak| | 0.0215| 0.350 ---------------+--------+--------+--------- RxCan1[467] Avg| 0.95| 0.0191| 0.020 Peak| | 0.0201| 0.444 ---------------+--------+--------+--------- RxCan1[472] Avg| 0.68| 0.0588| 0.085 Peak| | 0.0606| 1.170 ---------------+--------+--------+--------- RxCan1[473] Avg| 0.66| 0.0407| 0.062 Peak| | 0.0492| 1.329 ---------------+--------+--------+--------- RxCan1[474] Avg| 1.00| 0.0218| 0.021 Peak| | 0.0237| 0.278 ---------------+--------+--------+--------- RxCan1[475] Avg| 1.96| 0.0466| 0.024 Peak| | 0.0570| 1.112 ---------------+--------+--------+--------- RxCan1[476] Avg| 2.00| 0.0454| 0.020 Peak| | 0.0497| 0.409 ---------------+--------+--------+--------- RxCan1[477] Avg| 2.00| 0.0497| 0.022 Peak| | 0.0595| 0.864 ---------------+--------+--------+--------- RxCan1[595] Avg| 1.00| 0.0223| 0.021 Peak| | 0.0241| 0.296 ---------------+--------+--------+--------- RxCan1[59e] Avg| 1.00| 0.0233| 0.024 Peak| | 0.0289| 0.713 ---------------+--------+--------+--------- RxCan1[5a2] Avg| 1.00| 0.0200| 0.020 Peak| | 0.0204| 0.264 ---------------+--------+--------+--------- RxCan1[5ba] Avg| 1.00| 0.0206| 0.021 Peak| | 0.0238| 0.515 ---------------+--------+--------+--------- RxCan2[020] Avg| 33.30| 0.7938| 0.022 Peak| | 0.7938| 4.793 ---------------+--------+--------+--------- RxCan2[030] Avg| 22.20| 0.5229| 0.022 Peak| | 0.5229| 0.985 ---------------+--------+--------+--------- RxCan2[03a] Avg| 19.90| 0.4700| 0.022 Peak| | 0.4700| 0.804 ---------------+--------+--------+--------- RxCan2[040] Avg| 19.90| 0.4678| 0.023 Peak| | 0.4678| 1.222 ---------------+--------+--------+--------- RxCan2[060] Avg| 20.00| 0.6480| 0.050 Peak| | 0.6480| 20.997 ---------------+--------+--------+--------- RxCan2[070] Avg| 16.60| 0.3944| 0.022 Peak| | 0.3944| 1.053 ---------------+--------+--------+--------- RxCan2[080] Avg| 16.70| 0.7032| 0.041 Peak| | 0.7032| 1.611 ---------------+--------+--------+--------- RxCan2[083] Avg| 20.10| 0.4329| 0.021 Peak| | 0.4329| 0.520 ---------------+--------+--------+--------- RxCan2[090] Avg| 24.90| 0.5674| 0.017 Peak| | 0.5674| 1.149 ---------------+--------+--------+--------- RxCan2[0a0] Avg| 16.60| 0.3836| 0.023 Peak| | 0.3836| 0.933 ---------------+--------+--------+--------- RxCan2[100] Avg| 16.50| 0.3661| 0.021 Peak| | 0.3661| 0.740 ---------------+--------+--------+--------- RxCan2[108] Avg| 24.90| 0.5923| 0.025 Peak| | 0.5923| 0.859 ---------------+--------+--------+--------- RxCan2[110] Avg| 16.70| 0.3906| 0.023 Peak| | 0.3906| 0.697 ---------------+--------+--------+--------- RxCan2[130] Avg| 14.40| 0.3341| 0.022 Peak| | 0.3341| 0.829 ---------------+--------+--------+--------- RxCan2[150] Avg| 16.50| 0.4025| 0.020 Peak| | 0.4025| 1.120 ---------------+--------+--------+--------- RxCan2[160] Avg| 4.90| 0.1252| 0.025 Peak| | 0.1252| 0.502 ---------------+--------+--------+--------- RxCan2[180] Avg| 16.60| 0.3899| 0.023 Peak| | 0.3899| 0.799 ---------------+--------+--------+--------- RxCan2[190] Avg| 16.60| 0.3892| 0.025 Peak| | 0.3892| 1.172 ---------------+--------+--------+--------- RxCan2[1a0] Avg| 1.00| 0.0281| 0.025 Peak| | 0.0281| 0.695 ---------------+--------+--------+--------- RxCan2[1a4] Avg| 20.00| 0.4525| 0.022 Peak| | 0.4525| 1.231 ---------------+--------+--------+--------- RxCan2[1a8] Avg| 12.50| 0.2886| 0.020 Peak| | 0.2886| 1.048 ---------------+--------+--------+--------- RxCan2[1b0] Avg| 10.00| 0.2300| 0.023 Peak| | 0.2300| 0.579 ---------------+--------+--------+--------- RxCan2[1b4] Avg| 10.00| 0.2334| 0.022 Peak| | 0.2334| 0.947 ---------------+--------+--------+--------- RxCan2[1b8] Avg| 12.40| 0.2970| 0.023 Peak| | 0.2970| 0.909 ---------------+--------+--------+--------- RxCan2[1c0] Avg| 10.00| 0.2257| 0.021 Peak| | 0.2257| 0.983 ---------------+--------+--------+--------- RxCan2[1e0] Avg| 10.00| 0.2141| 0.023 Peak| | 0.2141| 0.556 ---------------+--------+--------+--------- RxCan2[215] Avg| 8.30| 0.2047| 0.025 Peak| | 0.2047| 0.786 ---------------+--------+--------+--------- RxCan2[217] Avg| 8.30| 0.2033| 0.022 Peak| | 0.2033| 1.135 ---------------+--------+--------+--------- RxCan2[220] Avg| 6.70| 0.1647| 0.020 Peak| | 0.1647| 0.961 ---------------+--------+--------+--------- RxCan2[225] Avg| 24.90| 0.6136| 0.026 Peak| | 0.6136| 1.018 ---------------+--------+--------+--------- RxCan2[230] Avg| 6.70| 0.4045| 0.057 Peak| | 0.4045| 1.532 ---------------+--------+--------+--------- RxCan2[240] Avg| 8.20| 0.1849| 0.021 Peak| | 0.1849| 0.510 ---------------+--------+--------+--------- RxCan2[241] Avg| 20.00| 0.4312| 0.021 Peak| | 0.4312| 5.110 ---------------+--------+--------+--------- RxCan2[250] Avg| 5.00| 0.1072| 0.021 Peak| | 0.1072| 0.320 ---------------+--------+--------+--------- RxCan2[255] Avg| 12.50| 0.3091| 0.022 Peak| | 0.3091| 0.904 ---------------+--------+--------+--------- RxCan2[265] Avg| 12.50| 0.2819| 0.021 Peak| | 0.2819| 1.035 ---------------+--------+--------+--------- RxCan2[270] Avg| 5.00| 0.1189| 0.022 Peak| | 0.1189| 0.631 ---------------+--------+--------+--------- RxCan2[290] Avg| 3.30| 0.0740| 0.023 Peak| | 0.0740| 0.455 ---------------+--------+--------+--------- RxCan2[295] Avg| 6.60| 0.1431| 0.023 Peak| | 0.1431| 0.504 ---------------+--------+--------+--------- RxCan2[2a0] Avg| 3.30| 0.0686| 0.020 Peak| | 0.0686| 0.445 ---------------+--------+--------+--------- RxCan2[2a7] Avg| 12.50| 0.2869| 0.021 Peak| | 0.2869| 0.660 ---------------+--------+--------+--------- RxCan2[2b0] Avg| 3.20| 0.0707| 0.023 Peak| | 0.0707| 0.331 ---------------+--------+--------+--------- RxCan2[2c0] Avg| 3.20| 0.0988| 0.026 Peak| | 0.0988| 0.932 ---------------+--------+--------+--------- RxCan2[2e0] Avg| 1.60| 0.0388| 0.024 Peak| | 0.0388| 0.393 ---------------+--------+--------+--------- RxCan2[2f0] Avg| 1.70| 0.0376| 0.021 Peak| | 0.0376| 0.282 ---------------+--------+--------+--------- RxCan2[2f5] Avg| 12.50| 0.2833| 0.021 Peak| | 0.2833| 0.855 ---------------+--------+--------+--------- RxCan2[300] Avg| 1.70| 0.0398| 0.023 Peak| | 0.0398| 0.488 ---------------+--------+--------+--------- RxCan2[310] Avg| 1.60| 0.0480| 0.026 Peak| | 0.0480| 0.937 ---------------+--------+--------+--------- RxCan2[320] Avg| 1.70| 0.0346| 0.020 Peak| | 0.0346| 0.370 ---------------+--------+--------+--------- RxCan2[326] Avg| 9.90| 0.2200| 0.022 Peak| | 0.2200| 0.502 ---------------+--------+--------+--------- RxCan2[330] Avg| 32.30| 0.7323| 0.021 Peak| | 0.7323| 1.130 ---------------+--------+--------+--------- RxCan2[340] Avg| 8.20| 0.2375| 0.028 Peak| | 0.2375| 0.578 ---------------+--------+--------+--------- RxCan2[345] Avg| 1.60| 0.0393| 0.022 Peak| | 0.0393| 0.590 ---------------+--------+--------+--------- RxCan2[35e] Avg| 5.00| 0.1303| 0.023 Peak| | 0.1303| 0.943 ---------------+--------+--------+--------- RxCan2[360] Avg| 1.70| 0.0381| 0.025 Peak| | 0.0381| 0.922 ---------------+--------+--------+--------- RxCan2[361] Avg| 8.20| 0.1907| 0.023 Peak| | 0.1907| 1.119 ---------------+--------+--------+--------- RxCan2[363] Avg| 1.30| 0.0337| 0.024 Peak| | 0.0337| 0.425 ---------------+--------+--------+--------- RxCan2[370] Avg| 0.90| 0.0194| 0.022 Peak| | 0.0194| 0.246 ---------------+--------+--------+--------- RxCan2[381] Avg| 3.20| 0.0684| 0.024 Peak| | 0.0684| 0.828 ---------------+--------+--------+--------- RxCan2[3a0] Avg| 16.60| 0.3734| 0.022 Peak| | 0.3734| 0.636 ---------------+--------+--------+--------- RxCan2[3d0] Avg| 10.00| 0.2262| 0.023 Peak| | 0.2262| 0.663 ---------------+--------+--------+--------- RxCan2[3d5] Avg| 5.60| 0.1335| 0.022 Peak| | 0.1335| 1.222 ---------------+--------+--------+--------- RxCan2[400] Avg| 4.00| 0.0949| 0.022 Peak| | 0.0949| 0.715 ---------------+--------+--------+--------- RxCan2[405] Avg| 3.70| 0.0861| 0.022 Peak| | 0.0861| 0.443 ---------------+--------+--------+--------- RxCan2[40a] Avg| 8.00| 0.1853| 0.021 Peak| | 0.1853| 0.552 ---------------+--------+--------+--------- RxCan2[415] Avg| 1.60| 0.0341| 0.021 Peak| | 0.0341| 0.273 ---------------+--------+--------+--------- RxCan2[435] Avg| 0.90| 0.0220| 0.025 Peak| | 0.0220| 0.354 ---------------+--------+--------+--------- RxCan2[440] Avg| 0.90| 0.0199| 0.021 Peak| | 0.0199| 0.266 ---------------+--------+--------+--------- RxCan2[465] Avg| 0.90| 0.0234| 0.028 Peak| | 0.0234| 0.633 ---------------+--------+--------+--------- RxCan2[466] Avg| 1.00| 0.0222| 0.021 Peak| | 0.0222| 0.322 ---------------+--------+--------+--------- RxCan2[467] Avg| 1.00| 0.0221| 0.020 Peak| | 0.0221| 0.355 ---------------+--------+--------+--------- RxCan2[501] Avg| 1.50| 0.0335| 0.023 Peak| | 0.0335| 0.393 ---------------+--------+--------+--------- RxCan2[503] Avg| 1.50| 0.0370| 0.022 Peak| | 0.0370| 0.546 ---------------+--------+--------+--------- RxCan2[504] Avg| 1.40| 0.0328| 0.022 Peak| | 0.0328| 0.489 ---------------+--------+--------+--------- RxCan2[505] Avg| 1.40| 0.0290| 0.021 Peak| | 0.0290| 0.354 ---------------+--------+--------+--------- RxCan2[508] Avg| 1.40| 0.0318| 0.023 Peak| | 0.0318| 0.408 ---------------+--------+--------+--------- RxCan2[511] Avg| 1.40| 0.0306| 0.022 Peak| | 0.0306| 0.328 ---------------+--------+--------+--------- RxCan2[51e] Avg| 1.40| 0.0310| 0.022 Peak| | 0.0310| 0.269 ---------------+--------+--------+--------- RxCan2[581] Avg| 1.00| 0.0222| 0.022 Peak| | 0.0222| 0.256 ---------------+--------+--------+--------- Cmd:State Avg| 0.00| 0.0000| 0.002 Peak| | 0.0000| 0.024 ===============+========+========+========= Total Avg| 2795.57| 82.7745| 40.174
Cheers, Simon
Am 17.01.2025 um 17:49 schrieb Michael Balzer via OvmsDev:
OK, I've got a new idea: CAN timing.
Comparing our esp32can bit timing to the esp-idf driver's, there seem to be some differences:
https://github.com/espressif/esp-idf/blob/master/components/hal/include/hal/...
Transceivers are normally tolerant to small timing offsets. Maybe being off a little bit has no effect under normal conditions, but it has when the transceiver has to cope with a filled RX queue. That could be causing the transceiver to slide just out of sync. If the timing gets garbled, the transceiver would signal errors in the packets to the bus, possibly so many the vehicle ECUs decide to raise an error condition.
Is that plausible?
On why the new poller could be causing this (in combination with too slow processing by the vehicle): as mentioned, the standard CAN listener mechanism doesn't care about queue overflows. The poller does. `OvmsPollers::Queue_PollerFrame()` does a log call when Tx/Rx tracing is enabled, that could even block, but tracing is optional and only meant for debugging. Not optional is the overflow counting using an atomic uint32.
The atomic types are said to be fast, but I never checked their actual implementation on the ESP32. Maybe they can block as well?
@Simon: it would be an option to try commenting out the overflow counting, to see if that's causing the issue.
Regards, Michael
Am 17.01.25 um 15:37 schrieb Chris Box via OvmsDev:
Yes, I can confirm I've had one experience of the Leaf switching to Neutral while driving, with a yellow warning symbol on the dash. It refused to reselect Drive until I had switched the car off and back on. Derek wasn't so lucky and he need to clear fault codes before the car would work.
On returning home, I found OVMS was not accessible over a network. I didn't try a USB cable. Unplugging and reinserting the OBD cable caused OVMS to rejoin Wi-Fi. However the SD logs showed nothing from the time of the event. CAN writes are enabled, so it can perform SOC limiting.
My car has been using this firmware since 21st November, based on the git master of that day. As a relatively new user of OVMS (only since October) I don't have much experience of older firmware.
Perhaps a safeguard should be implemented before releasing a new stable firmware that will be automatically downloaded by Leaf owners. But I don't have the expertise to know what that safeguard should be. Derek's suggestion of 'only CAN write when parked' appears to be a good idea.
Chris
On 2025-01-15 18:18, Derek Caudwell via OvmsDev wrote:
Since the following email I have high confidence the issue on the Leaf is related/caused by the poller as there has been no further occurrence and Chris has also experienced the car going to neutral on the new poller firmware.
.... I haven't ruled out it being a fault with my car yet. Shortly after it faulted the car was run into so has been off the road for sometime, my first step was to replace 12V battery. The ovms unit is now unplugged and if it does not fault over the next month while driving I'll be reasonably confident
Hi Michael I just used the firmware stock with no changes to the poller settings. The Leaf is using high speeds on both buses: RegisterCanBus(1,CAN_MODE_ACTIVE,CAN_SPEED_500KBPS); RegisterCanBus(2,CAN_MODE_ACTIVE,CAN_SPEED_500KBPS); On Sun, 19 Jan 2025, 10:15 pm Michael Balzer via OvmsDev, < ovmsdev@lists.openvehicles.com> wrote:
Michael,
I suggest adding a standard bool member variable to reflect if any filter is defined, so `PollerRxCallback()` can just skip the filter test while that is false. A mutex has some overhead, even if used non-blocking, and a bool variable only read there will be sufficient to signal "apply filtering" to the callback. With the simple bool test, all vehicles that don't need filtering (i.e. most vehicles) will have a neglectible impact from this.
Regarding the overhead: the GCC atomic implementation should use the xtensa CPU builtin atomic support (SCOMPARE1 register & S32C1I instruction), so should be pretty fast and not use any interrupt disabling, see:
- https://gcc.gnu.org/wiki/Atomic (xtensa atomic support since gcc 4.4.0) - https://www.cadence.com/content/dam/cadence-www/global/en_US/documents/tools... (section 4.3.13)
So I still doubt the queue overflow is the real culprit.
But having the filter option doesn't hurt (with my suggestion above), and your changes to the queue processing look promising as well.
@Derek: what was your poller tracing & timing setup when you had the bus issue on the Leaf? I still think that was something related to your car or setup. There are currently 11 Leafs on my server running "edge" releases including the new poller, all without (reported) issues.
Regards, Michael
Am 19.01.25 um 04:26 schrieb Michael Geddes:
P/R Created https://github.com/openvehicles/Open-Vehicle-Monitoring-System-3/pull/1100 Let me know if you want me to split it up or ANY changes and I'll get onto it asap.
Maybe somebody could grab the code and check it out in the context of specifying some filters. This will prevent those messages from coming to the vehicle implementation at all.. and even from going through the poller queue. It is non-blocking meaning that the filter is briefly inopperational while the filter is being modified.
//.
On Sun, 19 Jan 2025 at 11:02, Michael Geddes <frog@bunyip.wheelycreek.net> wrote:
On Sat, 18 Jan 2025 at 17:08, Michael Balzer via OvmsDev < ovmsdev@lists.openvehicles.com> wrote:
I have commented out the line with the Atomic_Increment statement. Now I no longer receive any messages with “RX Task Queue Overflow Run” Here is the output of poller times status:
The main question is if you still get the CAN bus crash (vehicle running into issues) with that modification in active mode. Timing statistics were not expected to change.
I have a feeling that the atomic operations are along the lines of:
* Set Interrupts off * atomic operation * Set interrupts on
Which means no real 'blocking' .. just not allowing interrupts and therefor task switching for a couple of instructions.
Nearly 2800 frames per second is quite a lot, and most is on can1 with many frame periods at 20 ms. Yet the total processing time averages at 30-40 ms, so there is no actual CPU capacity issue for that amount of frames.
@Derek: can you please supply these statistics for the Leaf in drive mode as well?
Am 18.01.25 um 02:42 schrieb Michael Geddes via OvmsDev:
Maybe try setting CONFIG_OVMS_VEHICLE_CAN_RX_QUEUE_SIZE = 160 and see if that reduces the overflow?
Simons car sends at least 91 process data frame IDs on can1 and 84 on can2. Worst case would be these come all in within the shortest possible time span, that would mean the queue needs to be able to hold 175 frames. I'd add some headroom and round up to 200.
But keep in mind, if the Incoming processing actually occasionally gets blocked for up to 60 ms -- as indicated by Simons statistics --, the queue may need to be twice as large.
Am 18.01.25 um 02:42 schrieb Michael Geddes via OvmsDev:
I was thinking that the frame filter would be here: void OvmsPollers::PollerRxCallback(const CAN_frame_t* frame, bool success) { Queue_PollerFrame(*frame, success, false); } which I guess is executed in the task handling the CAN queue. (we don't know how many frames get dropped there).
Actually we do know that, or at least have some indication, as we count the CAN transceiver queue overruns. That info is included as "Rx overflw" in the can status output & as "rxovr" in the logs.
Adding a filter before queueing the frame would exclude the filtered IDs from all vehicle processing. I meant adding a filter just to exclude IDs from the timing statistics, assuming those are the culprits, as Simon wrote the issue only appears after enabling the timing statistics and printing them. That's why I asked if printing might need to lock the statistics for too long in case of such a long list.
Completely blocking ID ranges from processing by the vehicle should normally not be necessary, unless the Incoming handler is written very poorly.
Yet, if we add that, a mutex in the CAN RX callback must be avoided, or would need to be non-blocking:
The only real concern is thread safety between checking and adding to the filter - so the check itself might have to be mutexed. void OvmsPollers::PollerRxCallback(const CAN_frame_t* frame, bool success) { // Check filter { OvmsRecMutexLock lock(&m_filter_mutex); if (! m_filter->IsFiltered(frame)) return; } Queue_PollerFrame(*frame, success, false); }
A mutex like that could block the CAN task, which must be avoided at all cost. I introduced CAN callbacks for vehicles & applications that need to react to certain frames as fast as possible, e.g. to maintain control precedence, so cannot use the standard CAN listener mechanism (frame queueing).
The current poller callback use is OK, if (!) the atomic type really isn't the culprit, ie doesn't block.
So if (!) an ID filter needs to be added before queueing, it needs to be done in a way that needs no mutex. But I don't see an issue with the vehicle passing a fixed filter when registering with the poller/buses. The filter doesn't need to by mutable on the fly.
Regards, Michael
Am 17.01.25 um 19:42 schrieb Simon Ehlen via OvmsDev:
The poller statistics can help you track this down, but you need to have at least 10 seconds of statistics, the more the better. Rule of thumb: PRI average at 0.0/second means you don't have enough data yet.
There were again many messages with “RX Task Queue Overflow Run”. Here are the statistics of poller times status:
OVMS# poll times status Poller timing is: on Type | count | Utlztn | Time | per s | [%] | [ms] ---------------+--------+--------+--------- Poll:PRI Avg| 1.00| 0.0043| 0.004 Peak| | 0.0043| 0.052 ---------------+--------+--------+--------- RxCan1[010] Avg| 34.26| 1.6741| 0.015 Peak| | 1.6741| 1.182 ---------------+--------+--------+--------- RxCan1[030] Avg| 34.06| 1.7085| 0.020 Peak| | 1.7085| 1.390 ---------------+--------+--------+--------- RxCan1[041] Avg| 49.89| 0.8109| 0.016 Peak| | 0.8541| 1.098 ---------------+--------+--------+--------- RxCan1[049] Avg| 50.00| 1.5970| 0.019 Peak| | 1.7154| 32.233 ---------------+--------+--------+--------- RxCan1[04c] Avg| 49.92| 0.8340| 0.014 Peak| | 0.8933| 1.995 ---------------+--------+--------+--------- RxCan1[04d] Avg| 34.43| 1.6211| 0.014 Peak| | 1.6756| 1.318 ---------------+--------+--------+--------- RxCan1[076] Avg| 50.00| 0.8362| 0.024 Peak| | 0.8784| 2.185 ---------------+--------+--------+--------- RxCan1[077] Avg| 50.00| 0.7837| 0.014 Peak| | 0.8083| 1.156 ---------------+--------+--------+--------- RxCan1[07a] Avg| 34.31| 2.1870| 0.017 Peak| | 2.3252| 1.888 ---------------+--------+--------+--------- RxCan1[07d] Avg| 50.00| 0.8001| 0.013 Peak| | 0.8434| 1.150 ---------------+--------+--------+--------- RxCan1[0c8] Avg| 49.96| 0.8359| 0.013 Peak| | 0.8715| 1.171 ---------------+--------+--------+--------- RxCan1[11a] Avg| 34.35| 1.6701| 0.020 Peak| | 1.6981| 1.273 ---------------+--------+--------+--------- RxCan1[130] Avg| 50.00| 0.7902| 0.018 Peak| | 0.8513| 0.980 ---------------+--------+--------+--------- RxCan1[139] Avg| 49.92| 0.7872| 0.013 Peak| | 0.8219| 0.795 ---------------+--------+--------+--------- RxCan1[156] Avg| 10.00| 0.1620| 0.014 Peak| | 0.1729| 0.919 ---------------+--------+--------+--------- RxCan1[160] Avg| 50.04| 0.7977| 0.014 Peak| | 0.8232| 1.495 ---------------+--------+--------+--------- RxCan1[165] Avg| 49.85| 0.7976| 0.014 Peak| | 0.8486| 1.015 ---------------+--------+--------+--------- RxCan1[167] Avg| 34.39| 1.6025| 0.016 Peak| | 1.6888| 1.354 ---------------+--------+--------+--------- RxCan1[171] Avg| 50.00| 0.8150| 0.017 Peak| | 0.8488| 1.091 ---------------+--------+--------+--------- RxCan1[178] Avg| 10.00| 0.1614| 0.014 Peak| | 0.1702| 0.903 ---------------+--------+--------+--------- RxCan1[179] Avg| 10.00| 0.1630| 0.017 Peak| | 0.1663| 1.336 ---------------+--------+--------+--------- RxCan1[180] Avg| 50.00| 0.8137| 0.014 Peak| | 0.8605| 1.566 ---------------+--------+--------+--------- RxCan1[185] Avg| 50.04| 0.8033| 0.013 Peak| | 0.8393| 1.126 ---------------+--------+--------+--------- RxCan1[1a0] Avg| 49.92| 0.7748| 0.013 Peak| | 0.8169| 1.184 ---------------+--------+--------+--------- RxCan1[1e0] Avg| 49.92| 0.7738| 0.014 Peak| | 0.8028| 1.049 ---------------+--------+--------+--------- RxCan1[1e4] Avg| 49.89| 0.9692| 0.018 Peak| | 1.0096| 1.332 ---------------+--------+--------+--------- RxCan1[1f0] Avg| 33.22| 0.5544| 0.014 Peak| | 0.5855| 0.848 ---------------+--------+--------+--------- RxCan1[200] Avg| 49.92| 0.7879| 0.015 Peak| | 0.8345| 1.206 ---------------+--------+--------+--------- RxCan1[202] Avg| 34.28| 1.7075| 0.016 Peak| | 1.7874| 1.218 ---------------+--------+--------+--------- RxCan1[204] Avg| 34.35| 1.5641| 0.013 Peak| | 1.6427| 1.235 ---------------+--------+--------+--------- RxCan1[213] Avg| 49.89| 0.7814| 0.015 Peak| | 0.8232| 0.910 ---------------+--------+--------+--------- RxCan1[214] Avg| 49.92| 0.7736| 0.014 Peak| | 0.8216| 0.800 ---------------+--------+--------+--------- RxCan1[217] Avg| 34.31| 1.6294| 0.014 Peak| | 1.7165| 1.153 ---------------+--------+--------+--------- RxCan1[218] Avg| 49.86| 0.7877| 0.013 Peak| | 0.8290| 1.068 ---------------+--------+--------+--------- RxCan1[230] Avg| 50.00| 0.7596| 0.014 Peak| | 0.7660| 1.021 ---------------+--------+--------+--------- RxCan1[240] Avg| 10.00| 0.1669| 0.013 Peak| | 0.1835| 0.887 ---------------+--------+--------+--------- RxCan1[242] Avg| 24.96| 0.4764| 0.020 Peak| | 0.4963| 1.501 ---------------+--------+--------+--------- RxCan1[24a] Avg| 9.89| 0.1789| 0.015 Peak| | 0.2009| 0.874 ---------------+--------+--------+--------- RxCan1[24b] Avg| 9.89| 0.1702| 0.014 Peak| | 0.1870| 1.195 ---------------+--------+--------+--------- RxCan1[24c] Avg| 9.89| 0.2146| 0.019 Peak| | 0.2187| 1.242 ---------------+--------+--------+--------- RxCan1[25a] Avg| 10.00| 0.1603| 0.013 Peak| | 0.1667| 0.720 ---------------+--------+--------+--------- RxCan1[25b] Avg| 49.94| 0.7918| 0.017 Peak| | 0.8454| 1.666 ---------------+--------+--------+--------- RxCan1[25c] Avg| 34.24| 1.5331| 0.013 Peak| | 1.5997| 1.538 ---------------+--------+--------+--------- RxCan1[260] Avg| 10.00| 0.1626| 0.014 Peak| | 0.1682| 0.718 ---------------+--------+--------+--------- RxCan1[270] Avg| 49.90| 0.8120| 0.014 Peak| | 0.8460| 1.671 ---------------+--------+--------+--------- RxCan1[280] Avg| 49.92| 0.7777| 0.019 Peak| | 0.8447| 1.157 ---------------+--------+--------+--------- RxCan1[2e4] Avg| 19.89| 0.5778| 0.032 Peak| | 0.6648| 2.226 ---------------+--------+--------+--------- RxCan1[2ec] Avg| 10.00| 0.1701| 0.014 Peak| | 0.1755| 0.928 ---------------+--------+--------+--------- RxCan1[2ed] Avg| 10.00| 0.1650| 0.013 Peak| | 0.1747| 0.917 ---------------+--------+--------+--------- RxCan1[2ee] Avg| 9.98| 0.1544| 0.013 Peak| | 0.1588| 1.312 ---------------+--------+--------+--------- RxCan1[312] Avg| 10.00| 0.1648| 0.017 Peak| | 0.1690| 0.922 ---------------+--------+--------+--------- RxCan1[326] Avg| 9.89| 0.1603| 0.015 Peak| | 0.1833| 1.230 ---------------+--------+--------+--------- RxCan1[336] Avg| 1.00| 0.0146| 0.015 Peak| | 0.0150| 0.349 ---------------+--------+--------+--------- RxCan1[352] Avg| 6.66| 0.1223| 0.022 Peak| | 0.1338| 1.015 ---------------+--------+--------+--------- RxCan1[355] Avg| 2.00| 0.0424| 0.019 Peak| | 0.0431| 0.786 ---------------+--------+--------+--------- RxCan1[35e] Avg| 9.96| 0.1570| 0.013 Peak| | 0.1644| 0.579 ---------------+--------+--------+--------- RxCan1[365] Avg| 10.00| 0.1600| 0.014 Peak| | 0.1653| 0.961 ---------------+--------+--------+--------- RxCan1[366] Avg| 10.00| 0.1716| 0.013 Peak| | 0.1890| 0.987 ---------------+--------+--------+--------- RxCan1[367] Avg| 9.93| 0.1793| 0.015 Peak| | 0.1864| 0.984 ---------------+--------+--------+--------- RxCan1[368] Avg| 10.00| 0.1645| 0.014 Peak| | 0.1778| 0.768 ---------------+--------+--------+--------- RxCan1[369] Avg| 10.00| 0.1562| 0.016 Peak| | 0.1606| 0.724 ---------------+--------+--------+--------- RxCan1[380] Avg| 10.00| 0.1619| 0.014 Peak| | 0.1644| 0.605 ---------------+--------+--------+--------- RxCan1[38b] Avg| 25.00| 0.3991| 0.016 Peak| | 0.4280| 1.448 ---------------+--------+--------+--------- RxCan1[3b3] Avg| 10.00| 0.1537| 0.013 Peak| | 0.1610| 0.380 ---------------+--------+--------+--------- RxCan1[400] Avg| 4.00| 0.0626| 0.014 Peak| | 0.0626| 0.251 ---------------+--------+--------+--------- RxCan1[405] Avg| 3.90| 0.1019| 0.028 Peak| | 0.1019| 0.781 ---------------+--------+--------+--------- RxCan1[40a] Avg| 7.90| 0.1256| 0.020 Peak| | 0.1256| 0.991 ---------------+--------+--------+--------- RxCan1[410] Avg| 10.00| 0.1643| 0.016 Peak| | 0.1839| 1.634 ---------------+--------+--------+--------- RxCan1[411] Avg| 10.00| 0.1532| 0.013 Peak| | 0.1645| 0.824 ---------------+--------+--------+--------- RxCan1[416] Avg| 10.00| 0.1516| 0.016 Peak| | 0.1582| 0.807 ---------------+--------+--------+--------- RxCan1[421] Avg| 10.00| 0.1648| 0.013 Peak| | 0.1740| 0.839 ---------------+--------+--------+--------- RxCan1[42d] Avg| 10.00| 0.1548| 0.014 Peak| | 0.1658| 0.741 ---------------+--------+--------+--------- RxCan1[42f] Avg| 10.00| 0.1527| 0.013 Peak| | 0.1578| 0.667 ---------------+--------+--------+--------- RxCan1[430] Avg| 10.00| 0.1730| 0.016 Peak| | 0.1880| 1.209 ---------------+--------+--------+--------- RxCan1[434] Avg| 10.00| 0.1620| 0.021 Peak| | 0.1712| 1.140 ---------------+--------+--------+--------- RxCan1[435] Avg| 6.66| 0.1104| 0.014 Peak| | 0.1121| 1.011 ---------------+--------+--------+--------- RxCan1[43e] Avg| 20.00| 0.3194| 0.013 Peak| | 0.3434| 1.212 ---------------+--------+--------+--------- RxCan1[440] Avg| 1.00| 0.0160| 0.014 Peak| | 0.0175| 0.315 ---------------+--------+--------+--------- RxCan1[465] Avg| 1.00| 0.0172| 0.015 Peak| | 0.0194| 0.404 ---------------+--------+--------+--------- RxCan1[466] Avg| 1.00| 0.0198| 0.015 Peak| | 0.0252| 0.890 ---------------+--------+--------+--------- RxCan1[467] Avg| 1.00| 0.0152| 0.014 Peak| | 0.0160| 0.217 ---------------+--------+--------+--------- RxCan1[472] Avg| 0.70| 0.0533| 0.075 Peak| | 0.0546| 0.990 ---------------+--------+--------+--------- RxCan1[473] Avg| 0.65| 0.0325| 0.051 Peak| | 0.0361| 0.774 ---------------+--------+--------+--------- RxCan1[474] Avg| 1.00| 0.0146| 0.014 Peak| | 0.0151| 0.189 ---------------+--------+--------+--------- RxCan1[475] Avg| 2.00| 0.0332| 0.015 Peak| | 0.0362| 0.513 ---------------+--------+--------+--------- RxCan1[476] Avg| 2.00| 0.0305| 0.014 Peak| | 0.0307| 0.249 ---------------+--------+--------+--------- RxCan1[477] Avg| 2.00| 0.0309| 0.014 Peak| | 0.0311| 0.438 ---------------+--------+--------+--------- RxCan1[595] Avg| 1.00| 0.0151| 0.014 Peak| | 0.0160| 0.230 ---------------+--------+--------+--------- RxCan1[59e] Avg| 1.00| 0.0179| 0.015 Peak| | 0.0209| 0.716 ---------------+--------+--------+--------- RxCan1[5a2] Avg| 1.00| 0.0154| 0.016 Peak| | 0.0184| 0.699 ---------------+--------+--------+--------- RxCan1[5ba] Avg| 1.00| 0.0159| 0.017 Peak| | 0.0174| 0.485 ---------------+--------+--------+--------- RxCan2[010] Avg| 0.00| 0.0000| 0.015 Peak| | 0.0000| 0.146 ---------------+--------+--------+--------- RxCan2[020] Avg| 31.10| 0.5159| 0.015 Peak| | 0.5730| 0.992 ---------------+--------+--------+--------- RxCan2[030] Avg| 20.70| 0.3506| 0.016 Peak| | 0.3956| 1.055 ---------------+--------+--------+--------- RxCan2[03a] Avg| 18.65| 0.3157| 0.014 Peak| | 0.3292| 0.702 ---------------+--------+--------+--------- RxCan2[040] Avg| 18.60| 0.3111| 0.015 Peak| | 0.3474| 0.953 ---------------+--------+--------+--------- RxCan2[060] Avg| 18.60| 0.3182| 0.014 Peak| | 0.3569| 0.694 ---------------+--------+--------+--------- RxCan2[070] Avg| 15.55| 0.4581| 0.017 Peak| | 0.6859| 39.212 ---------------+--------+--------+--------- RxCan2[080] Avg| 15.50| 0.5041| 0.029 Peak| | 0.5414| 1.555 ---------------+--------+--------+--------- RxCan2[083] Avg| 18.70| 0.3083| 0.014 Peak| | 0.3325| 0.557 ---------------+--------+--------+--------- RxCan2[090] Avg| 23.40| 0.3961| 0.014 Peak| | 0.4445| 1.218 ---------------+--------+--------+--------- RxCan2[0a0] Avg| 15.55| 0.2734| 0.014 Peak| | 0.3144| 1.062 ---------------+--------+--------+--------- RxCan2[100] Avg| 15.50| 0.2645| 0.016 Peak| | 0.2875| 1.021 ---------------+--------+--------+--------- RxCan2[108] Avg| 23.40| 0.4231| 0.016 Peak| | 0.4680| 1.297 ---------------+--------+--------+--------- RxCan2[110] Avg| 15.55| 0.2467| 0.014 Peak| | 0.2684| 0.475 ---------------+--------+--------+--------- RxCan2[130] Avg| 13.30| 0.2231| 0.014 Peak| | 0.2447| 0.512 ---------------+--------+--------+--------- RxCan2[150] Avg| 15.50| 0.2533| 0.015 Peak| | 0.2836| 0.823 ---------------+--------+--------+--------- RxCan2[160] Avg| 4.70| 0.0784| 0.014 Peak| | 0.0863| 0.608 ---------------+--------+--------+--------- RxCan2[180] Avg| 15.55| 0.2713| 0.015 Peak| | 0.2841| 0.884 ---------------+--------+--------+--------- RxCan2[190] Avg| 15.50| 0.2596| 0.014 Peak| | 0.2825| 0.743 ---------------+--------+--------+--------- RxCan2[1a0] Avg| 0.95| 0.0164| 0.015 Peak| | 0.0164| 0.346 ---------------+--------+--------+--------- RxCan2[1a4] Avg| 18.65| 0.3232| 0.015 Peak| | 0.3515| 0.989 ---------------+--------+--------+--------- RxCan2[1a8] Avg| 11.60| 0.1911| 0.016 Peak| | 0.2012| 0.757 ---------------+--------+--------+--------- RxCan2[1b0] Avg| 9.35| 0.1558| 0.016 Peak| | 0.1641| 0.795 ---------------+--------+--------+--------- RxCan2[1b4] Avg| 9.35| 0.1543| 0.015 Peak| | 0.1617| 1.217 ---------------+--------+--------+--------- RxCan2[1b8] Avg| 11.65| 0.2003| 0.014 Peak| | 0.2236| 1.549 ---------------+--------+--------+--------- RxCan2[1c0] Avg| 9.40| 0.1532| 0.016 Peak| | 0.1673| 0.955 ---------------+--------+--------+--------- RxCan2[1e0] Avg| 9.30| 0.1582| 0.015 Peak| | 0.1708| 0.661 ---------------+--------+--------+--------- RxCan2[215] Avg| 7.80| 0.1409| 0.016 Peak| | 0.1531| 0.660 ---------------+--------+--------+--------- RxCan2[217] Avg| 7.80| 0.1239| 0.014 Peak| | 0.1333| 0.520 ---------------+--------+--------+--------- RxCan2[220] Avg| 6.20| 0.1041| 0.015 Peak| | 0.1094| 0.652 ---------------+--------+--------+--------- RxCan2[225] Avg| 23.40| 0.4648| 0.015 Peak| | 0.4696| 4.288 ---------------+--------+--------+--------- RxCan2[230] Avg| 6.20| 0.3120| 0.048 Peak| | 0.3377| 1.065 ---------------+--------+--------+--------- RxCan2[240] Avg| 7.70| 0.1248| 0.014 Peak| | 0.1364| 0.635 ---------------+--------+--------+--------- RxCan2[241] Avg| 18.60| 0.3258| 0.014 Peak| | 0.3343| 1.288 ---------------+--------+--------+--------- RxCan2[250] Avg| 4.70| 0.0761| 0.014 Peak| | 0.0809| 0.322 ---------------+--------+--------+--------- RxCan2[255] Avg| 11.75| 0.2058| 0.014 Peak| | 0.2283| 0.937 ---------------+--------+--------+--------- RxCan2[265] Avg| 11.65| 0.1964| 0.014 Peak| | 0.2068| 0.965 ---------------+--------+--------+--------- RxCan2[270] Avg| 4.70| 0.0808| 0.016 Peak| | 0.0949| 0.729 ---------------+--------+--------+--------- RxCan2[290] Avg| 3.15| 0.0498| 0.015 Peak| | 0.0504| 0.449 ---------------+--------+--------+--------- RxCan2[295] Avg| 6.25| 0.1019| 0.014 Peak| | 0.1094| 0.859 ---------------+--------+--------+--------- RxCan2[2a0] Avg| 3.15| 0.0550| 0.014 Peak| | 0.0551| 0.779 ---------------+--------+--------+--------- RxCan2[2a7] Avg| 11.65| 0.1929| 0.014 Peak| | 0.2080| 0.775 ---------------+--------+--------+--------- RxCan2[2b0] Avg| 3.00| 0.0497| 0.015 Peak| | 0.0562| 0.528 ---------------+--------+--------+--------- RxCan2[2c0] Avg| 3.10| 0.0534| 0.016 Peak| | 0.0592| 0.501 ---------------+--------+--------+--------- RxCan2[2e0] Avg| 1.55| 0.0247| 0.014 Peak| | 0.0289| 0.319 ---------------+--------+--------+--------- RxCan2[2f0] Avg| 1.55| 0.0244| 0.014 Peak| | 0.0273| 0.192 ---------------+--------+--------+--------- RxCan2[2f5] Avg| 11.65| 0.2078| 0.016 Peak| | 0.2333| 0.879 ---------------+--------+--------+--------- RxCan2[300] Avg| 1.60| 0.0266| 0.018 Peak| | 0.0278| 0.724 ---------------+--------+--------+--------- RxCan2[310] Avg| 1.55| 0.0276| 0.016 Peak| | 0.0285| 0.759 ---------------+--------+--------+--------- RxCan2[320] Avg| 1.60| 0.0240| 0.014 Peak| | 0.0258| 0.179 ---------------+--------+--------+--------- RxCan2[326] Avg| 9.30| 0.1550| 0.014 Peak| | 0.1582| 0.850 ---------------+--------+--------+--------- RxCan2[330] Avg| 29.95| 0.5311| 0.015 Peak| | 0.5565| 4.522 ---------------+--------+--------+--------- RxCan2[340] Avg| 7.75| 0.1693| 0.024 Peak| | 0.1868| 1.148 ---------------+--------+--------+--------- RxCan2[345] Avg| 1.60| 0.0292| 0.016 Peak| | 0.0316| 0.471 ---------------+--------+--------+--------- RxCan2[350] Avg| 0.00| 0.0000| 0.019 Peak| | 0.0000| 0.188 ---------------+--------+--------+--------- RxCan2[35e] Avg| 4.70| 0.0851| 0.019 Peak| | 0.0911| 1.023 ---------------+--------+--------+--------- RxCan2[360] Avg| 1.60| 0.0258| 0.015 Peak| | 0.0284| 0.306 ---------------+--------+--------+--------- RxCan2[361] Avg| 7.75| 0.1341| 0.017 Peak| | 0.1487| 0.761 ---------------+--------+--------+--------- RxCan2[363] Avg| 1.20| 0.0203| 0.016 Peak| | 0.0220| 0.421 ---------------+--------+--------+--------- RxCan2[370] Avg| 0.85| 0.0140| 0.016 Peak| | 0.0162| 0.354 ---------------+--------+--------+--------- RxCan2[381] Avg| 3.15| 0.0512| 0.016 Peak| | 0.0546| 0.416 ---------------+--------+--------+--------- RxCan2[3a0] Avg| 15.60| 0.2548| 0.015 Peak| | 0.2890| 0.976 ---------------+--------+--------+--------- RxCan2[3d0] Avg| 9.35| 0.1553| 0.019 Peak| | 0.1612| 1.115 ---------------+--------+--------+--------- RxCan2[3d5] Avg| 5.15| 0.0836| 0.016 Peak| | 0.0867| 0.479 ---------------+--------+--------+--------- RxCan2[3e0] Avg| 0.00| 0.0000| 0.014 Peak| | 0.0000| 0.142 ---------------+--------+--------+--------- RxCan2[400] Avg| 3.55| 0.0613| 0.017 Peak| | 0.0695| 0.501 ---------------+--------+--------+--------- RxCan2[405] Avg| 3.50| 0.0584| 0.018 Peak| | 0.0626| 0.686 ---------------+--------+--------+--------- RxCan2[40a] Avg| 7.10| 0.1278| 0.017 Peak| | 0.1389| 1.244 ---------------+--------+--------+--------- RxCan2[415] Avg| 1.60| 0.0258| 0.014 Peak| | 0.0287| 0.266 ---------------+--------+--------+--------- RxCan2[435] Avg| 0.85| 0.0165| 0.019 Peak| | 0.0167| 0.367 ---------------+--------+--------+--------- RxCan2[440] Avg| 0.85| 0.0128| 0.019 Peak| | 0.0141| 0.885 ---------------+--------+--------+--------- RxCan2[465] Avg| 0.95| 0.0177| 0.016 Peak| | 0.0195| 0.721 ---------------+--------+--------+--------- RxCan2[466] Avg| 0.95| 0.0147| 0.014 Peak| | 0.0160| 0.184 ---------------+--------+--------+--------- RxCan2[467] Avg| 0.95| 0.0172| 0.017 Peak| | 0.0188| 0.391 ---------------+--------+--------+--------- RxCan2[501] Avg| 1.45| 0.0273| 0.016 Peak| | 0.0327| 0.996 ---------------+--------+--------+--------- RxCan2[503] Avg| 1.45| 0.0288| 0.020 Peak| | 0.0338| 0.970 ---------------+--------+--------+--------- RxCan2[504] Avg| 1.40| 0.0241| 0.015 Peak| | 0.0263| 0.609 ---------------+--------+--------+--------- RxCan2[505] Avg| 1.40| 0.0255| 0.015 Peak| | 0.0296| 0.866 ---------------+--------+--------+--------- RxCan2[508] Avg| 1.35| 0.0237| 0.017 Peak| | 0.0237| 0.384 ---------------+--------+--------+--------- RxCan2[511] Avg| 1.35| 0.0226| 0.016 Peak| | 0.0228| 0.426 ---------------+--------+--------+--------- RxCan2[51e] Avg| 1.40| 0.0221| 0.014 Peak| | 0.0245| 0.211 ---------------+--------+--------+--------- RxCan2[581] Avg| 0.80| 0.0189| 0.019 Peak| | 0.0290| 1.217 ---------------+--------+--------+--------- RxCan2[606] Avg| 0.00| 0.0000| 0.014 Peak| | 0.0000| 0.142 ---------------+--------+--------+--------- RxCan2[657] Avg| 0.00| 0.0000| 0.014 Peak| | 0.0000| 0.137 ---------------+--------+--------+--------- Cmd:State Avg| 0.00| 0.0000| 0.002 Peak| | 0.0000| 0.024 ===============+========+========+========= Total Avg| 2748.42| 58.3344| 28.718
@Simon: it would be an option to try commenting out the overflow counting, to see if that's causing the issue.
I have commented out the line with the Atomic_Increment statement. Now I no longer receive any messages with “RX Task Queue Overflow Run” Here is the output of poller times status:
OVMS# poll time status Poller timing is: on Type | count | Utlztn | Time | per s | [%] | [ms] ---------------+--------+--------+--------- Poll:PRI Avg| 1.00| 0.0045| 0.004 Peak| | 0.0046| 0.064 ---------------+--------+--------+--------- RxCan1[010] Avg| 34.26| 2.2574| 0.021 Peak| | 2.2574| 4.609 ---------------+--------+--------+--------- RxCan1[030] Avg| 34.26| 2.3820| 0.021 Peak| | 2.3820| 1.135 ---------------+--------+--------+--------- RxCan1[041] Avg| 49.89| 1.2059| 0.021 Peak| | 1.2295| 5.331 ---------------+--------+--------+--------- RxCan1[049] Avg| 49.96| 1.2400| 0.030 Peak| | 1.2699| 1.402 ---------------+--------+--------+--------- RxCan1[04c] Avg| 49.92| 1.1752| 0.021 Peak| | 1.2072| 4.502 ---------------+--------+--------+--------- RxCan1[04d] Avg| 34.31| 2.4433| 0.022 Peak| | 2.4773| 1.368 ---------------+--------+--------+--------- RxCan1[076] Avg| 49.96| 1.2071| 0.024 Peak| | 1.2554| 2.007 ---------------+--------+--------+--------- RxCan1[077] Avg| 49.96| 1.2012| 0.022 Peak| | 1.2492| 1.955 ---------------+--------+--------+--------- RxCan1[07a] Avg| 34.35| 2.9251| 0.030 Peak| | 3.1103| 1.829 ---------------+--------+--------+--------- RxCan1[07d] Avg| 49.96| 1.1954| 0.022 Peak| | 1.2282| 1.074 ---------------+--------+--------+--------- RxCan1[0c8] Avg| 49.89| 1.2491| 0.021 Peak| | 1.3169| 1.181 ---------------+--------+--------+--------- RxCan1[11a] Avg| 34.39| 2.4423| 0.024 Peak| | 2.5693| 1.491 ---------------+--------+--------+--------- RxCan1[130] Avg| 49.95| 1.1312| 0.020 Peak| | 1.1684| 1.218 ---------------+--------+--------+--------- RxCan1[139] Avg| 49.92| 1.1547| 0.021 Peak| | 1.1778| 1.199 ---------------+--------+--------+--------- RxCan1[156] Avg| 9.96| 0.2391| 0.023 Peak| | 0.2591| 1.943 ---------------+--------+--------+--------- RxCan1[160] Avg| 49.96| 1.1657| 0.031 Peak| | 1.2017| 2.158 ---------------+--------+--------+--------- RxCan1[165] Avg| 49.96| 1.1257| 0.021 Peak| | 1.1652| 1.471 ---------------+--------+--------+--------- RxCan1[167] Avg| 34.31| 2.2871| 0.021 Peak| | 2.3374| 1.776 ---------------+--------+--------+--------- RxCan1[171] Avg| 49.96| 1.1879| 0.023 Peak| | 1.2268| 1.166 ---------------+--------+--------+--------- RxCan1[178] Avg| 10.00| 0.2371| 0.029 Peak| | 0.2459| 1.516 ---------------+--------+--------+--------- RxCan1[179] Avg| 10.00| 0.2196| 0.021 Peak| | 0.2260| 0.758 ---------------+--------+--------+--------- RxCan1[180] Avg| 49.96| 1.1703| 0.022 Peak| | 1.2103| 1.481 ---------------+--------+--------+--------- RxCan1[185] Avg| 49.95| 1.1127| 0.020 Peak| | 1.1636| 1.292 ---------------+--------+--------+--------- RxCan1[1a0] Avg| 49.96| 1.1009| 0.020 Peak| | 1.1468| 1.060 ---------------+--------+--------+--------- RxCan1[1e0] Avg| 49.96| 1.1744| 0.021 Peak| | 1.2027| 1.240 ---------------+--------+--------+--------- RxCan1[1e4] Avg| 49.96| 1.3733| 0.032 Peak| | 1.4085| 1.523 ---------------+--------+--------+--------- RxCan1[1f0] Avg| 33.30| 0.7625| 0.023 Peak| | 0.8004| 3.349 ---------------+--------+--------+--------- RxCan1[200] Avg| 49.92| 1.1462| 0.021 Peak| | 1.1809| 1.254 ---------------+--------+--------+--------- RxCan1[202] Avg| 34.39| 2.4034| 0.028 Peak| | 2.5611| 1.472 ---------------+--------+--------+--------- RxCan1[204] Avg| 34.30| 2.2541| 0.022 Peak| | 2.2924| 2.015 ---------------+--------+--------+--------- RxCan1[213] Avg| 49.96| 1.1599| 0.027 Peak| | 1.1794| 1.714 ---------------+--------+--------+--------- RxCan1[214] Avg| 49.96| 1.1537| 0.022 Peak| | 1.1941| 1.439 ---------------+--------+--------+--------- RxCan1[217] Avg| 34.39| 2.2490| 0.020 Peak| | 2.2856| 3.766 ---------------+--------+--------+--------- RxCan1[218] Avg| 49.96| 1.1291| 0.021 Peak| | 1.1646| 1.547 ---------------+--------+--------+--------- RxCan1[230] Avg| 49.96| 1.1272| 0.020 Peak| | 1.2237| 1.295 ---------------+--------+--------+--------- RxCan1[240] Avg| 10.00| 0.2191| 0.021 Peak| | 0.2226| 1.067 ---------------+--------+--------+--------- RxCan1[242] Avg| 24.96| 0.6911| 0.024 Peak| | 0.7161| 1.180 ---------------+--------+--------+--------- RxCan1[24a] Avg| 9.96| 0.2345| 0.024 Peak| | 0.2535| 0.779 ---------------+--------+--------+--------- RxCan1[24b] Avg| 9.96| 0.2433| 0.023 Peak| | 0.2697| 2.085 ---------------+--------+--------+--------- RxCan1[24c] Avg| 9.96| 0.3103| 0.029 Peak| | 0.3203| 0.809 ---------------+--------+--------+--------- RxCan1[25a] Avg| 10.00| 0.2346| 0.022 Peak| | 0.2405| 1.223 ---------------+--------+--------+--------- RxCan1[25b] Avg| 49.89| 1.2121| 0.020 Peak| | 1.3659| 19.523 ---------------+--------+--------+--------- RxCan1[25c] Avg| 34.31| 2.4193| 0.019 Peak| | 2.8022| 58.153 ---------------+--------+--------+--------- RxCan1[260] Avg| 9.93| 0.2149| 0.024 Peak| | 0.2174| 1.096 ---------------+--------+--------+--------- RxCan1[270] Avg| 49.96| 1.2042| 0.026 Peak| | 1.2755| 20.612 ---------------+--------+--------+--------- RxCan1[280] Avg| 49.96| 1.0922| 0.020 Peak| | 1.1312| 1.266 ---------------+--------+--------+--------- RxCan1[2e4] Avg| 19.96| 0.6942| 0.044 Peak| | 0.8604| 1.533 ---------------+--------+--------+--------- RxCan1[2ec] Avg| 10.00| 0.3727| 0.025 Peak| | 0.5154| 28.819 ---------------+--------+--------+--------- RxCan1[2ed] Avg| 10.00| 0.2298| 0.023 Peak| | 0.2378| 1.345 ---------------+--------+--------+--------- RxCan1[2ee] Avg| 9.96| 0.2172| 0.019 Peak| | 0.2210| 1.058 ---------------+--------+--------+--------- RxCan1[312] Avg| 10.00| 0.2206| 0.020 Peak| | 0.2396| 1.060 ---------------+--------+--------+--------- RxCan1[326] Avg| 9.96| 0.2099| 0.020 Peak| | 0.2158| 0.507 ---------------+--------+--------+--------- RxCan1[336] Avg| 1.00| 0.0212| 0.020 Peak| | 0.0233| 0.315 ---------------+--------+--------+--------- RxCan1[352] Avg| 6.64| 0.1675| 0.024 Peak| | 0.1818| 1.048 ---------------+--------+--------+--------- RxCan1[355] Avg| 2.00| 0.0540| 0.027 Peak| | 0.0619| 1.209 ---------------+--------+--------+--------- RxCan1[35e] Avg| 9.98| 0.2221| 0.021 Peak| | 0.2284| 1.186 ---------------+--------+--------+--------- RxCan1[365] Avg| 10.00| 0.2282| 0.023 Peak| | 0.2335| 0.769 ---------------+--------+--------+--------- RxCan1[366] Avg| 10.00| 0.3163| 0.022 Peak| | 0.6330| 23.587 ---------------+--------+--------+--------- RxCan1[367] Avg| 10.00| 0.2417| 0.021 Peak| | 0.2568| 1.417 ---------------+--------+--------+--------- RxCan1[368] Avg| 9.96| 0.2187| 0.019 Peak| | 0.2250| 1.135 ---------------+--------+--------+--------- RxCan1[369] Avg| 9.99| 0.2277| 0.021 Peak| | 0.2334| 0.667 ---------------+--------+--------+--------- RxCan1[380] Avg| 9.96| 0.2133| 0.020 Peak| | 0.2161| 0.560 ---------------+--------+--------+--------- RxCan1[38b] Avg| 24.92| 0.5622| 0.022 Peak| | 0.5716| 1.618 ---------------+--------+--------+--------- RxCan1[3b3] Avg| 10.00| 0.2132| 0.023 Peak| | 0.2194| 1.106 ---------------+--------+--------+--------- RxCan1[400] Avg| 4.00| 0.0885| 0.019 Peak| | 0.0885| 0.570 ---------------+--------+--------+--------- RxCan1[405] Avg| 3.70| 0.1414| 0.036 Peak| | 0.1414| 0.710 ---------------+--------+--------+--------- RxCan1[40a] Avg| 8.00| 0.1887| 0.021 Peak| | 0.1887| 1.027 ---------------+--------+--------+--------- RxCan1[410] Avg| 10.00| 0.2141| 0.023 Peak| | 0.2188| 0.984 ---------------+--------+--------+--------- RxCan1[411] Avg| 10.00| 0.2325| 0.023 Peak| | 0.2447| 0.660 ---------------+--------+--------+--------- RxCan1[416] Avg| 10.00| 0.2326| 0.022 Peak| | 0.2389| 0.774 ---------------+--------+--------+--------- RxCan1[421] Avg| 10.00| 0.2245| 0.021 Peak| | 0.2271| 1.160 ---------------+--------+--------+--------- RxCan1[42d] Avg| 10.00| 0.2315| 0.021 Peak| | 0.2411| 0.677 ---------------+--------+--------+--------- RxCan1[42f] Avg| 10.00| 0.2480| 0.020 Peak| | 0.2975| 8.093 ---------------+--------+--------+--------- RxCan1[430] Avg| 10.00| 0.2203| 0.019 Peak| | 0.2302| 0.847 ---------------+--------+--------+--------- RxCan1[434] Avg| 10.00| 0.2331| 0.019 Peak| | 0.2620| 1.150 ---------------+--------+--------+--------- RxCan1[435] Avg| 6.68| 0.1445| 0.020 Peak| | 0.1486| 1.063 ---------------+--------+--------+--------- RxCan1[43e] Avg| 20.00| 0.4515| 0.021 Peak| | 0.4632| 1.013 ---------------+--------+--------+--------- RxCan1[440] Avg| 1.00| 0.0210| 0.019 Peak| | 0.0218| 0.294 ---------------+--------+--------+--------- RxCan1[465] Avg| 0.95| 0.0214| 0.023 Peak| | 0.0215| 0.587 ---------------+--------+--------+--------- RxCan1[466] Avg| 0.95| 0.0211| 0.021 Peak| | 0.0215| 0.350 ---------------+--------+--------+--------- RxCan1[467] Avg| 0.95| 0.0191| 0.020 Peak| | 0.0201| 0.444 ---------------+--------+--------+--------- RxCan1[472] Avg| 0.68| 0.0588| 0.085 Peak| | 0.0606| 1.170 ---------------+--------+--------+--------- RxCan1[473] Avg| 0.66| 0.0407| 0.062 Peak| | 0.0492| 1.329 ---------------+--------+--------+--------- RxCan1[474] Avg| 1.00| 0.0218| 0.021 Peak| | 0.0237| 0.278 ---------------+--------+--------+--------- RxCan1[475] Avg| 1.96| 0.0466| 0.024 Peak| | 0.0570| 1.112 ---------------+--------+--------+--------- RxCan1[476] Avg| 2.00| 0.0454| 0.020 Peak| | 0.0497| 0.409 ---------------+--------+--------+--------- RxCan1[477] Avg| 2.00| 0.0497| 0.022 Peak| | 0.0595| 0.864 ---------------+--------+--------+--------- RxCan1[595] Avg| 1.00| 0.0223| 0.021 Peak| | 0.0241| 0.296 ---------------+--------+--------+--------- RxCan1[59e] Avg| 1.00| 0.0233| 0.024 Peak| | 0.0289| 0.713 ---------------+--------+--------+--------- RxCan1[5a2] Avg| 1.00| 0.0200| 0.020 Peak| | 0.0204| 0.264 ---------------+--------+--------+--------- RxCan1[5ba] Avg| 1.00| 0.0206| 0.021 Peak| | 0.0238| 0.515 ---------------+--------+--------+--------- RxCan2[020] Avg| 33.30| 0.7938| 0.022 Peak| | 0.7938| 4.793 ---------------+--------+--------+--------- RxCan2[030] Avg| 22.20| 0.5229| 0.022 Peak| | 0.5229| 0.985 ---------------+--------+--------+--------- RxCan2[03a] Avg| 19.90| 0.4700| 0.022 Peak| | 0.4700| 0.804 ---------------+--------+--------+--------- RxCan2[040] Avg| 19.90| 0.4678| 0.023 Peak| | 0.4678| 1.222 ---------------+--------+--------+--------- RxCan2[060] Avg| 20.00| 0.6480| 0.050 Peak| | 0.6480| 20.997 ---------------+--------+--------+--------- RxCan2[070] Avg| 16.60| 0.3944| 0.022 Peak| | 0.3944| 1.053 ---------------+--------+--------+--------- RxCan2[080] Avg| 16.70| 0.7032| 0.041 Peak| | 0.7032| 1.611 ---------------+--------+--------+--------- RxCan2[083] Avg| 20.10| 0.4329| 0.021 Peak| | 0.4329| 0.520 ---------------+--------+--------+--------- RxCan2[090] Avg| 24.90| 0.5674| 0.017 Peak| | 0.5674| 1.149 ---------------+--------+--------+--------- RxCan2[0a0] Avg| 16.60| 0.3836| 0.023 Peak| | 0.3836| 0.933 ---------------+--------+--------+--------- RxCan2[100] Avg| 16.50| 0.3661| 0.021 Peak| | 0.3661| 0.740 ---------------+--------+--------+--------- RxCan2[108] Avg| 24.90| 0.5923| 0.025 Peak| | 0.5923| 0.859 ---------------+--------+--------+--------- RxCan2[110] Avg| 16.70| 0.3906| 0.023 Peak| | 0.3906| 0.697 ---------------+--------+--------+--------- RxCan2[130] Avg| 14.40| 0.3341| 0.022 Peak| | 0.3341| 0.829 ---------------+--------+--------+--------- RxCan2[150] Avg| 16.50| 0.4025| 0.020 Peak| | 0.4025| 1.120 ---------------+--------+--------+--------- RxCan2[160] Avg| 4.90| 0.1252| 0.025 Peak| | 0.1252| 0.502 ---------------+--------+--------+--------- RxCan2[180] Avg| 16.60| 0.3899| 0.023 Peak| | 0.3899| 0.799 ---------------+--------+--------+--------- RxCan2[190] Avg| 16.60| 0.3892| 0.025 Peak| | 0.3892| 1.172 ---------------+--------+--------+--------- RxCan2[1a0] Avg| 1.00| 0.0281| 0.025 Peak| | 0.0281| 0.695 ---------------+--------+--------+--------- RxCan2[1a4] Avg| 20.00| 0.4525| 0.022 Peak| | 0.4525| 1.231 ---------------+--------+--------+--------- RxCan2[1a8] Avg| 12.50| 0.2886| 0.020 Peak| | 0.2886| 1.048 ---------------+--------+--------+--------- RxCan2[1b0] Avg| 10.00| 0.2300| 0.023 Peak| | 0.2300| 0.579 ---------------+--------+--------+--------- RxCan2[1b4] Avg| 10.00| 0.2334| 0.022 Peak| | 0.2334| 0.947 ---------------+--------+--------+--------- RxCan2[1b8] Avg| 12.40| 0.2970| 0.023 Peak| | 0.2970| 0.909 ---------------+--------+--------+--------- RxCan2[1c0] Avg| 10.00| 0.2257| 0.021 Peak| | 0.2257| 0.983 ---------------+--------+--------+--------- RxCan2[1e0] Avg| 10.00| 0.2141| 0.023 Peak| | 0.2141| 0.556 ---------------+--------+--------+--------- RxCan2[215] Avg| 8.30| 0.2047| 0.025 Peak| | 0.2047| 0.786 ---------------+--------+--------+--------- RxCan2[217] Avg| 8.30| 0.2033| 0.022 Peak| | 0.2033| 1.135 ---------------+--------+--------+--------- RxCan2[220] Avg| 6.70| 0.1647| 0.020 Peak| | 0.1647| 0.961 ---------------+--------+--------+--------- RxCan2[225] Avg| 24.90| 0.6136| 0.026 Peak| | 0.6136| 1.018 ---------------+--------+--------+--------- RxCan2[230] Avg| 6.70| 0.4045| 0.057 Peak| | 0.4045| 1.532 ---------------+--------+--------+--------- RxCan2[240] Avg| 8.20| 0.1849| 0.021 Peak| | 0.1849| 0.510 ---------------+--------+--------+--------- RxCan2[241] Avg| 20.00| 0.4312| 0.021 Peak| | 0.4312| 5.110 ---------------+--------+--------+--------- RxCan2[250] Avg| 5.00| 0.1072| 0.021 Peak| | 0.1072| 0.320 ---------------+--------+--------+--------- RxCan2[255] Avg| 12.50| 0.3091| 0.022 Peak| | 0.3091| 0.904 ---------------+--------+--------+--------- RxCan2[265] Avg| 12.50| 0.2819| 0.021 Peak| | 0.2819| 1.035 ---------------+--------+--------+--------- RxCan2[270] Avg| 5.00| 0.1189| 0.022 Peak| | 0.1189| 0.631 ---------------+--------+--------+--------- RxCan2[290] Avg| 3.30| 0.0740| 0.023 Peak| | 0.0740| 0.455 ---------------+--------+--------+--------- RxCan2[295] Avg| 6.60| 0.1431| 0.023 Peak| | 0.1431| 0.504 ---------------+--------+--------+--------- RxCan2[2a0] Avg| 3.30| 0.0686| 0.020 Peak| | 0.0686| 0.445 ---------------+--------+--------+--------- RxCan2[2a7] Avg| 12.50| 0.2869| 0.021 Peak| | 0.2869| 0.660 ---------------+--------+--------+--------- RxCan2[2b0] Avg| 3.20| 0.0707| 0.023 Peak| | 0.0707| 0.331 ---------------+--------+--------+--------- RxCan2[2c0] Avg| 3.20| 0.0988| 0.026 Peak| | 0.0988| 0.932 ---------------+--------+--------+--------- RxCan2[2e0] Avg| 1.60| 0.0388| 0.024 Peak| | 0.0388| 0.393 ---------------+--------+--------+--------- RxCan2[2f0] Avg| 1.70| 0.0376| 0.021 Peak| | 0.0376| 0.282 ---------------+--------+--------+--------- RxCan2[2f5] Avg| 12.50| 0.2833| 0.021 Peak| | 0.2833| 0.855 ---------------+--------+--------+--------- RxCan2[300] Avg| 1.70| 0.0398| 0.023 Peak| | 0.0398| 0.488 ---------------+--------+--------+--------- RxCan2[310] Avg| 1.60| 0.0480| 0.026 Peak| | 0.0480| 0.937 ---------------+--------+--------+--------- RxCan2[320] Avg| 1.70| 0.0346| 0.020 Peak| | 0.0346| 0.370 ---------------+--------+--------+--------- RxCan2[326] Avg| 9.90| 0.2200| 0.022 Peak| | 0.2200| 0.502 ---------------+--------+--------+--------- RxCan2[330] Avg| 32.30| 0.7323| 0.021 Peak| | 0.7323| 1.130 ---------------+--------+--------+--------- RxCan2[340] Avg| 8.20| 0.2375| 0.028 Peak| | 0.2375| 0.578 ---------------+--------+--------+--------- RxCan2[345] Avg| 1.60| 0.0393| 0.022 Peak| | 0.0393| 0.590 ---------------+--------+--------+--------- RxCan2[35e] Avg| 5.00| 0.1303| 0.023 Peak| | 0.1303| 0.943 ---------------+--------+--------+--------- RxCan2[360] Avg| 1.70| 0.0381| 0.025 Peak| | 0.0381| 0.922 ---------------+--------+--------+--------- RxCan2[361] Avg| 8.20| 0.1907| 0.023 Peak| | 0.1907| 1.119 ---------------+--------+--------+--------- RxCan2[363] Avg| 1.30| 0.0337| 0.024 Peak| | 0.0337| 0.425 ---------------+--------+--------+--------- RxCan2[370] Avg| 0.90| 0.0194| 0.022 Peak| | 0.0194| 0.246 ---------------+--------+--------+--------- RxCan2[381] Avg| 3.20| 0.0684| 0.024 Peak| | 0.0684| 0.828 ---------------+--------+--------+--------- RxCan2[3a0] Avg| 16.60| 0.3734| 0.022 Peak| | 0.3734| 0.636 ---------------+--------+--------+--------- RxCan2[3d0] Avg| 10.00| 0.2262| 0.023 Peak| | 0.2262| 0.663 ---------------+--------+--------+--------- RxCan2[3d5] Avg| 5.60| 0.1335| 0.022 Peak| | 0.1335| 1.222 ---------------+--------+--------+--------- RxCan2[400] Avg| 4.00| 0.0949| 0.022 Peak| | 0.0949| 0.715 ---------------+--------+--------+--------- RxCan2[405] Avg| 3.70| 0.0861| 0.022 Peak| | 0.0861| 0.443 ---------------+--------+--------+--------- RxCan2[40a] Avg| 8.00| 0.1853| 0.021 Peak| | 0.1853| 0.552 ---------------+--------+--------+--------- RxCan2[415] Avg| 1.60| 0.0341| 0.021 Peak| | 0.0341| 0.273 ---------------+--------+--------+--------- RxCan2[435] Avg| 0.90| 0.0220| 0.025 Peak| | 0.0220| 0.354 ---------------+--------+--------+--------- RxCan2[440] Avg| 0.90| 0.0199| 0.021 Peak| | 0.0199| 0.266 ---------------+--------+--------+--------- RxCan2[465] Avg| 0.90| 0.0234| 0.028 Peak| | 0.0234| 0.633 ---------------+--------+--------+--------- RxCan2[466] Avg| 1.00| 0.0222| 0.021 Peak| | 0.0222| 0.322 ---------------+--------+--------+--------- RxCan2[467] Avg| 1.00| 0.0221| 0.020 Peak| | 0.0221| 0.355 ---------------+--------+--------+--------- RxCan2[501] Avg| 1.50| 0.0335| 0.023 Peak| | 0.0335| 0.393 ---------------+--------+--------+--------- RxCan2[503] Avg| 1.50| 0.0370| 0.022 Peak| | 0.0370| 0.546 ---------------+--------+--------+--------- RxCan2[504] Avg| 1.40| 0.0328| 0.022 Peak| | 0.0328| 0.489 ---------------+--------+--------+--------- RxCan2[505] Avg| 1.40| 0.0290| 0.021 Peak| | 0.0290| 0.354 ---------------+--------+--------+--------- RxCan2[508] Avg| 1.40| 0.0318| 0.023 Peak| | 0.0318| 0.408 ---------------+--------+--------+--------- RxCan2[511] Avg| 1.40| 0.0306| 0.022 Peak| | 0.0306| 0.328 ---------------+--------+--------+--------- RxCan2[51e] Avg| 1.40| 0.0310| 0.022 Peak| | 0.0310| 0.269 ---------------+--------+--------+--------- RxCan2[581] Avg| 1.00| 0.0222| 0.022 Peak| | 0.0222| 0.256 ---------------+--------+--------+--------- Cmd:State Avg| 0.00| 0.0000| 0.002 Peak| | 0.0000| 0.024 ===============+========+========+========= Total Avg| 2795.57| 82.7745| 40.174
Cheers, Simon
Am 17.01.2025 um 17:49 schrieb Michael Balzer via OvmsDev:
OK, I've got a new idea: CAN timing.
Comparing our esp32can bit timing to the esp-idf driver's, there seem to be some differences:
https://github.com/espressif/esp-idf/blob/master/components/hal/include/hal/...
Transceivers are normally tolerant to small timing offsets. Maybe being off a little bit has no effect under normal conditions, but it has when the transceiver has to cope with a filled RX queue. That could be causing the transceiver to slide just out of sync. If the timing gets garbled, the transceiver would signal errors in the packets to the bus, possibly so many the vehicle ECUs decide to raise an error condition.
Is that plausible?
On why the new poller could be causing this (in combination with too slow processing by the vehicle): as mentioned, the standard CAN listener mechanism doesn't care about queue overflows. The poller does. `OvmsPollers::Queue_PollerFrame()` does a log call when Tx/Rx tracing is enabled, that could even block, but tracing is optional and only meant for debugging. Not optional is the overflow counting using an atomic uint32.
The atomic types are said to be fast, but I never checked their actual implementation on the ESP32. Maybe they can block as well?
@Simon: it would be an option to try commenting out the overflow counting, to see if that's causing the issue.
Regards, Michael
Am 17.01.25 um 15:37 schrieb Chris Box via OvmsDev:
Yes, I can confirm I've had one experience of the Leaf switching to Neutral while driving, with a yellow warning symbol on the dash. It refused to reselect Drive until I had switched the car off and back on. Derek wasn't so lucky and he need to clear fault codes before the car would work.
On returning home, I found OVMS was not accessible over a network. I didn't try a USB cable. Unplugging and reinserting the OBD cable caused OVMS to rejoin Wi-Fi. However the SD logs showed nothing from the time of the event. CAN writes are enabled, so it can perform SOC limiting.
My car has been using this firmware since 21st November, based on the git master of that day. As a relatively new user of OVMS (only since October) I don't have much experience of older firmware.
Perhaps a safeguard should be implemented before releasing a new stable firmware that will be automatically downloaded by Leaf owners. But I don't have the expertise to know what that safeguard should be. Derek's suggestion of 'only CAN write when parked' appears to be a good idea.
Chris
On 2025-01-15 18:18, Derek Caudwell via OvmsDev wrote:
Since the following email I have high confidence the issue on the Leaf is related/caused by the poller as there has been no further occurrence and Chris has also experienced the car going to neutral on the new poller firmware.
.... I haven't ruled out it being a fault with my car yet. Shortly after it faulted the car was run into so has been off the road for sometime, my first step was to replace 12V battery. The ovms unit is now unplugged and if it does not fault over the next month while driving I'll be reasonably confident
Derek, Am 03.05.24 um 12:53 schrieb Derek Caudwell via OvmsDev:
When running *firmware **3.3.004-74-gbd4e7196* on my Nissan Leaf I suspect (but can't be 100% sure as it's only been 24h without fault) the new poller caused the car to throw the attached faults from overloading the can bus whilst driving. The fault was sufficient to send the car into limp mode and could not be driven until cleared with LeafSpy.
Build 3.3.004-74 (released 2024-04-30) did not yet include the poller tracing control, i.e. it did lots of logging for frames, significantly affecting overall performance. Poller tracing control was introduced in https://github.com/openvehicles/Open-Vehicle-Monitoring-System-3/commit/7e40... on May 12. That commit was first included in build 3.3.004-103-g11fddbf6 released 2024-05-25. Do you remember testing that build or a later one? But as I still don't understand how a software queue overflow could cause a bus crash, I've also checked the 500 kbit timing for the MCP2515 and found that may have the same issue as the 125 kbit timing: Our timing is: case CAN_SPEED_500KBPS: cnf1=0x00; cnf2=0xf0; cnf3=0x86; = PROP=1, PS1=7, PS2=7, SJW=1, Sample 3x @56.3% Remember, the SAE/CiA recommendation is SJW=2, Sample 1x @87.5%. That would translate to: PROP=5, PS1=8, PS2=2, SJW=2, Sample 1x @87.5% = cnf1=0x40; cnf2=0xbc; cnf3=0x81; I also checked the Arduino MCP_CAN lib, and that uses: cnf1=0x40; cnf2=0xe5; cnf3=0x83; = PROP=6, PS1=5, PS2=4, SJW=2, Sample 3x @75% So our timing for 500 kbit/s on the MCP buses also isn't as recommended. Derek, could you test the SAE/CiA recommendation and the MCP_CAN config as shown? Or anyone else with a live can2/can3 bus at 500 kbit? If these work, the question is which is the more general setup we should adopt. Apparently the MCP_CAN lib also does not follow the CiA recommendation, I wonder if the MCP_CAN config is a compromise for compatibility. Regards, Michael Am 19.01.25 um 19:07 schrieb Derek Caudwell via OvmsDev:
Hi Michael
I just used the firmware stock with no changes to the poller settings.
The Leaf is using high speeds on both buses: RegisterCanBus(1,CAN_MODE_ACTIVE,CAN_SPEED_500KBPS); RegisterCanBus(2,CAN_MODE_ACTIVE,CAN_SPEED_500KBPS);
On Sun, 19 Jan 2025, 10:15 pm Michael Balzer via OvmsDev, <ovmsdev@lists.openvehicles.com> wrote:
Michael,
I suggest adding a standard bool member variable to reflect if any filter is defined, so `PollerRxCallback()` can just skip the filter test while that is false. A mutex has some overhead, even if used non-blocking, and a bool variable only read there will be sufficient to signal "apply filtering" to the callback. With the simple bool test, all vehicles that don't need filtering (i.e. most vehicles) will have a neglectible impact from this.
Regarding the overhead: the GCC atomic implementation should use the xtensa CPU builtin atomic support (SCOMPARE1 register & S32C1I instruction), so should be pretty fast and not use any interrupt disabling, see:
* https://gcc.gnu.org/wiki/Atomic (xtensa atomic support since gcc 4.4.0) * https://www.cadence.com/content/dam/cadence-www/global/en_US/documents/tools... (section 4.3.13)
So I still doubt the queue overflow is the real culprit.
But having the filter option doesn't hurt (with my suggestion above), and your changes to the queue processing look promising as well.
@Derek: what was your poller tracing & timing setup when you had the bus issue on the Leaf? I still think that was something related to your car or setup. There are currently 11 Leafs on my server running "edge" releases including the new poller, all without (reported) issues.
Regards, Michael
Am 19.01.25 um 04:26 schrieb Michael Geddes:
P/R Created https://github.com/openvehicles/Open-Vehicle-Monitoring-System-3/pull/1100 Let me know if you want me to split it up or ANY changes and I'll get onto it asap.
Maybe somebody could grab the code and check it out in the context of specifying some filters. This will prevent those messages from coming to the vehicle implementation at all.. and even from going through the poller queue. It is non-blocking meaning that the filter is briefly inopperational while the filter is being modified. //.
On Sun, 19 Jan 2025 at 11:02, Michael Geddes <frog@bunyip.wheelycreek.net> wrote:
On Sat, 18 Jan 2025 at 17:08, Michael Balzer via OvmsDev <ovmsdev@lists.openvehicles.com> wrote:
I have commented out the line with the Atomic_Increment statement. Now I no longer receive any messages with “RX Task Queue Overflow Run” Here is the output of poller times status:
The main question is if you still get the CAN bus crash (vehicle running into issues) with that modification in active mode. Timing statistics were not expected to change.
I have a feeling that the atomic operations are along the lines of:
* Set Interrupts off * atomic operation * Set interrupts on
Which means no real 'blocking' .. just not allowing interrupts and therefor task switching for a couple of instructions.
Nearly 2800 frames per second is quite a lot, and most is on can1 with many frame periods at 20 ms. Yet the total processing time averages at 30-40 ms, so there is no actual CPU capacity issue for that amount of frames.
@Derek: can you please supply these statistics for the Leaf in drive mode as well?
Am 18.01.25 um 02:42 schrieb Michael Geddes via OvmsDev:
Maybe try setting CONFIG_OVMS_VEHICLE_CAN_RX_QUEUE_SIZE = 160 and see if that reduces the overflow?
Simons car sends at least 91 process data frame IDs on can1 and 84 on can2. Worst case would be these come all in within the shortest possible time span, that would mean the queue needs to be able to hold 175 frames. I'd add some headroom and round up to 200.
But keep in mind, if the Incoming processing actually occasionally gets blocked for up to 60 ms -- as indicated by Simons statistics --, the queue may need to be twice as large.
Am 18.01.25 um 02:42 schrieb Michael Geddes via OvmsDev:
I was thinking that the frame filter would be here: void OvmsPollers::PollerRxCallback(const CAN_frame_t* frame, bool success) { Queue_PollerFrame(*frame, success, false); } which I guess is executed in the task handling the CAN queue. (we don't know how many frames get dropped there).
Actually we do know that, or at least have some indication, as we count the CAN transceiver queue overruns. That info is included as "Rx overflw" in the can status output & as "rxovr" in the logs.
Adding a filter before queueing the frame would exclude the filtered IDs from all vehicle processing. I meant adding a filter just to exclude IDs from the timing statistics, assuming those are the culprits, as Simon wrote the issue only appears after enabling the timing statistics and printing them. That's why I asked if printing might need to lock the statistics for too long in case of such a long list.
Completely blocking ID ranges from processing by the vehicle should normally not be necessary, unless the Incoming handler is written very poorly.
Yet, if we add that, a mutex in the CAN RX callback must be avoided, or would need to be non-blocking:
The only real concern is thread safety between checking and adding to the filter - so the check itself might have to be mutexed. void OvmsPollers::PollerRxCallback(const CAN_frame_t* frame, bool success) { // Check filter { OvmsRecMutexLock lock(&m_filter_mutex); if (! m_filter->IsFiltered(frame)) return; } Queue_PollerFrame(*frame, success, false); }
A mutex like that could block the CAN task, which must be avoided at all cost. I introduced CAN callbacks for vehicles & applications that need to react to certain frames as fast as possible, e.g. to maintain control precedence, so cannot use the standard CAN listener mechanism (frame queueing).
The current poller callback use is OK, if (!) the atomic type really isn't the culprit, ie doesn't block.
So if (!) an ID filter needs to be added before queueing, it needs to be done in a way that needs no mutex. But I don't see an issue with the vehicle passing a fixed filter when registering with the poller/buses. The filter doesn't need to by mutable on the fly.
Regards, Michael
Am 17.01.25 um 19:42 schrieb Simon Ehlen via OvmsDev:
The poller statistics can help you track this down, but you need to have at least 10 seconds of statistics, the more the better. Rule of thumb: PRI average at 0.0/second means you don't have enough data yet.
There were again many messages with “RX Task Queue Overflow Run”. Here are the statistics of poller times status:
OVMS# poll times status Poller timing is: on Type | count | Utlztn | Time | per s | [%] | [ms] ---------------+--------+--------+--------- Poll:PRI Avg| 1.00| 0.0043| 0.004 Peak| | 0.0043| 0.052 ---------------+--------+--------+--------- RxCan1[010] Avg| 34.26| 1.6741| 0.015 Peak| | 1.6741| 1.182 ---------------+--------+--------+--------- RxCan1[030] Avg| 34.06| 1.7085| 0.020 Peak| | 1.7085| 1.390 ---------------+--------+--------+--------- RxCan1[041] Avg| 49.89| 0.8109| 0.016 Peak| | 0.8541| 1.098 ---------------+--------+--------+--------- RxCan1[049] Avg| 50.00| 1.5970| 0.019 Peak| | 1.7154| 32.233 ---------------+--------+--------+--------- RxCan1[04c] Avg| 49.92| 0.8340| 0.014 Peak| | 0.8933| 1.995 ---------------+--------+--------+--------- RxCan1[04d] Avg| 34.43| 1.6211| 0.014 Peak| | 1.6756| 1.318 ---------------+--------+--------+--------- RxCan1[076] Avg| 50.00| 0.8362| 0.024 Peak| | 0.8784| 2.185 ---------------+--------+--------+--------- RxCan1[077] Avg| 50.00| 0.7837| 0.014 Peak| | 0.8083| 1.156 ---------------+--------+--------+--------- RxCan1[07a] Avg| 34.31| 2.1870| 0.017 Peak| | 2.3252| 1.888 ---------------+--------+--------+--------- RxCan1[07d] Avg| 50.00| 0.8001| 0.013 Peak| | 0.8434| 1.150 ---------------+--------+--------+--------- RxCan1[0c8] Avg| 49.96| 0.8359| 0.013 Peak| | 0.8715| 1.171 ---------------+--------+--------+--------- RxCan1[11a] Avg| 34.35| 1.6701| 0.020 Peak| | 1.6981| 1.273 ---------------+--------+--------+--------- RxCan1[130] Avg| 50.00| 0.7902| 0.018 Peak| | 0.8513| 0.980 ---------------+--------+--------+--------- RxCan1[139] Avg| 49.92| 0.7872| 0.013 Peak| | 0.8219| 0.795 ---------------+--------+--------+--------- RxCan1[156] Avg| 10.00| 0.1620| 0.014 Peak| | 0.1729| 0.919 ---------------+--------+--------+--------- RxCan1[160] Avg| 50.04| 0.7977| 0.014 Peak| | 0.8232| 1.495 ---------------+--------+--------+--------- RxCan1[165] Avg| 49.85| 0.7976| 0.014 Peak| | 0.8486| 1.015 ---------------+--------+--------+--------- RxCan1[167] Avg| 34.39| 1.6025| 0.016 Peak| | 1.6888| 1.354 ---------------+--------+--------+--------- RxCan1[171] Avg| 50.00| 0.8150| 0.017 Peak| | 0.8488| 1.091 ---------------+--------+--------+--------- RxCan1[178] Avg| 10.00| 0.1614| 0.014 Peak| | 0.1702| 0.903 ---------------+--------+--------+--------- RxCan1[179] Avg| 10.00| 0.1630| 0.017 Peak| | 0.1663| 1.336 ---------------+--------+--------+--------- RxCan1[180] Avg| 50.00| 0.8137| 0.014 Peak| | 0.8605| 1.566 ---------------+--------+--------+--------- RxCan1[185] Avg| 50.04| 0.8033| 0.013 Peak| | 0.8393| 1.126 ---------------+--------+--------+--------- RxCan1[1a0] Avg| 49.92| 0.7748| 0.013 Peak| | 0.8169| 1.184 ---------------+--------+--------+--------- RxCan1[1e0] Avg| 49.92| 0.7738| 0.014 Peak| | 0.8028| 1.049 ---------------+--------+--------+--------- RxCan1[1e4] Avg| 49.89| 0.9692| 0.018 Peak| | 1.0096| 1.332 ---------------+--------+--------+--------- RxCan1[1f0] Avg| 33.22| 0.5544| 0.014 Peak| | 0.5855| 0.848 ---------------+--------+--------+--------- RxCan1[200] Avg| 49.92| 0.7879| 0.015 Peak| | 0.8345| 1.206 ---------------+--------+--------+--------- RxCan1[202] Avg| 34.28| 1.7075| 0.016 Peak| | 1.7874| 1.218 ---------------+--------+--------+--------- RxCan1[204] Avg| 34.35| 1.5641| 0.013 Peak| | 1.6427| 1.235 ---------------+--------+--------+--------- RxCan1[213] Avg| 49.89| 0.7814| 0.015 Peak| | 0.8232| 0.910 ---------------+--------+--------+--------- RxCan1[214] Avg| 49.92| 0.7736| 0.014 Peak| | 0.8216| 0.800 ---------------+--------+--------+--------- RxCan1[217] Avg| 34.31| 1.6294| 0.014 Peak| | 1.7165| 1.153 ---------------+--------+--------+--------- RxCan1[218] Avg| 49.86| 0.7877| 0.013 Peak| | 0.8290| 1.068 ---------------+--------+--------+--------- RxCan1[230] Avg| 50.00| 0.7596| 0.014 Peak| | 0.7660| 1.021 ---------------+--------+--------+--------- RxCan1[240] Avg| 10.00| 0.1669| 0.013 Peak| | 0.1835| 0.887 ---------------+--------+--------+--------- RxCan1[242] Avg| 24.96| 0.4764| 0.020 Peak| | 0.4963| 1.501 ---------------+--------+--------+--------- RxCan1[24a] Avg| 9.89| 0.1789| 0.015 Peak| | 0.2009| 0.874 ---------------+--------+--------+--------- RxCan1[24b] Avg| 9.89| 0.1702| 0.014 Peak| | 0.1870| 1.195 ---------------+--------+--------+--------- RxCan1[24c] Avg| 9.89| 0.2146| 0.019 Peak| | 0.2187| 1.242 ---------------+--------+--------+--------- RxCan1[25a] Avg| 10.00| 0.1603| 0.013 Peak| | 0.1667| 0.720 ---------------+--------+--------+--------- RxCan1[25b] Avg| 49.94| 0.7918| 0.017 Peak| | 0.8454| 1.666 ---------------+--------+--------+--------- RxCan1[25c] Avg| 34.24| 1.5331| 0.013 Peak| | 1.5997| 1.538 ---------------+--------+--------+--------- RxCan1[260] Avg| 10.00| 0.1626| 0.014 Peak| | 0.1682| 0.718 ---------------+--------+--------+--------- RxCan1[270] Avg| 49.90| 0.8120| 0.014 Peak| | 0.8460| 1.671 ---------------+--------+--------+--------- RxCan1[280] Avg| 49.92| 0.7777| 0.019 Peak| | 0.8447| 1.157 ---------------+--------+--------+--------- RxCan1[2e4] Avg| 19.89| 0.5778| 0.032 Peak| | 0.6648| 2.226 ---------------+--------+--------+--------- RxCan1[2ec] Avg| 10.00| 0.1701| 0.014 Peak| | 0.1755| 0.928 ---------------+--------+--------+--------- RxCan1[2ed] Avg| 10.00| 0.1650| 0.013 Peak| | 0.1747| 0.917 ---------------+--------+--------+--------- RxCan1[2ee] Avg| 9.98| 0.1544| 0.013 Peak| | 0.1588| 1.312 ---------------+--------+--------+--------- RxCan1[312] Avg| 10.00| 0.1648| 0.017 Peak| | 0.1690| 0.922 ---------------+--------+--------+--------- RxCan1[326] Avg| 9.89| 0.1603| 0.015 Peak| | 0.1833| 1.230 ---------------+--------+--------+--------- RxCan1[336] Avg| 1.00| 0.0146| 0.015 Peak| | 0.0150| 0.349 ---------------+--------+--------+--------- RxCan1[352] Avg| 6.66| 0.1223| 0.022 Peak| | 0.1338| 1.015 ---------------+--------+--------+--------- RxCan1[355] Avg| 2.00| 0.0424| 0.019 Peak| | 0.0431| 0.786 ---------------+--------+--------+--------- RxCan1[35e] Avg| 9.96| 0.1570| 0.013 Peak| | 0.1644| 0.579 ---------------+--------+--------+--------- RxCan1[365] Avg| 10.00| 0.1600| 0.014 Peak| | 0.1653| 0.961 ---------------+--------+--------+--------- RxCan1[366] Avg| 10.00| 0.1716| 0.013 Peak| | 0.1890| 0.987 ---------------+--------+--------+--------- RxCan1[367] Avg| 9.93| 0.1793| 0.015 Peak| | 0.1864| 0.984 ---------------+--------+--------+--------- RxCan1[368] Avg| 10.00| 0.1645| 0.014 Peak| | 0.1778| 0.768 ---------------+--------+--------+--------- RxCan1[369] Avg| 10.00| 0.1562| 0.016 Peak| | 0.1606| 0.724 ---------------+--------+--------+--------- RxCan1[380] Avg| 10.00| 0.1619| 0.014 Peak| | 0.1644| 0.605 ---------------+--------+--------+--------- RxCan1[38b] Avg| 25.00| 0.3991| 0.016 Peak| | 0.4280| 1.448 ---------------+--------+--------+--------- RxCan1[3b3] Avg| 10.00| 0.1537| 0.013 Peak| | 0.1610| 0.380 ---------------+--------+--------+--------- RxCan1[400] Avg| 4.00| 0.0626| 0.014 Peak| | 0.0626| 0.251 ---------------+--------+--------+--------- RxCan1[405] Avg| 3.90| 0.1019| 0.028 Peak| | 0.1019| 0.781 ---------------+--------+--------+--------- RxCan1[40a] Avg| 7.90| 0.1256| 0.020 Peak| | 0.1256| 0.991 ---------------+--------+--------+--------- RxCan1[410] Avg| 10.00| 0.1643| 0.016 Peak| | 0.1839| 1.634 ---------------+--------+--------+--------- RxCan1[411] Avg| 10.00| 0.1532| 0.013 Peak| | 0.1645| 0.824 ---------------+--------+--------+--------- RxCan1[416] Avg| 10.00| 0.1516| 0.016 Peak| | 0.1582| 0.807 ---------------+--------+--------+--------- RxCan1[421] Avg| 10.00| 0.1648| 0.013 Peak| | 0.1740| 0.839 ---------------+--------+--------+--------- RxCan1[42d] Avg| 10.00| 0.1548| 0.014 Peak| | 0.1658| 0.741 ---------------+--------+--------+--------- RxCan1[42f] Avg| 10.00| 0.1527| 0.013 Peak| | 0.1578| 0.667 ---------------+--------+--------+--------- RxCan1[430] Avg| 10.00| 0.1730| 0.016 Peak| | 0.1880| 1.209 ---------------+--------+--------+--------- RxCan1[434] Avg| 10.00| 0.1620| 0.021 Peak| | 0.1712| 1.140 ---------------+--------+--------+--------- RxCan1[435] Avg| 6.66| 0.1104| 0.014 Peak| | 0.1121| 1.011 ---------------+--------+--------+--------- RxCan1[43e] Avg| 20.00| 0.3194| 0.013 Peak| | 0.3434| 1.212 ---------------+--------+--------+--------- RxCan1[440] Avg| 1.00| 0.0160| 0.014 Peak| | 0.0175| 0.315 ---------------+--------+--------+--------- RxCan1[465] Avg| 1.00| 0.0172| 0.015 Peak| | 0.0194| 0.404 ---------------+--------+--------+--------- RxCan1[466] Avg| 1.00| 0.0198| 0.015 Peak| | 0.0252| 0.890 ---------------+--------+--------+--------- RxCan1[467] Avg| 1.00| 0.0152| 0.014 Peak| | 0.0160| 0.217 ---------------+--------+--------+--------- RxCan1[472] Avg| 0.70| 0.0533| 0.075 Peak| | 0.0546| 0.990 ---------------+--------+--------+--------- RxCan1[473] Avg| 0.65| 0.0325| 0.051 Peak| | 0.0361| 0.774 ---------------+--------+--------+--------- RxCan1[474] Avg| 1.00| 0.0146| 0.014 Peak| | 0.0151| 0.189 ---------------+--------+--------+--------- RxCan1[475] Avg| 2.00| 0.0332| 0.015 Peak| | 0.0362| 0.513 ---------------+--------+--------+--------- RxCan1[476] Avg| 2.00| 0.0305| 0.014 Peak| | 0.0307| 0.249 ---------------+--------+--------+--------- RxCan1[477] Avg| 2.00| 0.0309| 0.014 Peak| | 0.0311| 0.438 ---------------+--------+--------+--------- RxCan1[595] Avg| 1.00| 0.0151| 0.014 Peak| | 0.0160| 0.230 ---------------+--------+--------+--------- RxCan1[59e] Avg| 1.00| 0.0179| 0.015 Peak| | 0.0209| 0.716 ---------------+--------+--------+--------- RxCan1[5a2] Avg| 1.00| 0.0154| 0.016 Peak| | 0.0184| 0.699 ---------------+--------+--------+--------- RxCan1[5ba] Avg| 1.00| 0.0159| 0.017 Peak| | 0.0174| 0.485 ---------------+--------+--------+--------- RxCan2[010] Avg| 0.00| 0.0000| 0.015 Peak| | 0.0000| 0.146 ---------------+--------+--------+--------- RxCan2[020] Avg| 31.10| 0.5159| 0.015 Peak| | 0.5730| 0.992 ---------------+--------+--------+--------- RxCan2[030] Avg| 20.70| 0.3506| 0.016 Peak| | 0.3956| 1.055 ---------------+--------+--------+--------- RxCan2[03a] Avg| 18.65| 0.3157| 0.014 Peak| | 0.3292| 0.702 ---------------+--------+--------+--------- RxCan2[040] Avg| 18.60| 0.3111| 0.015 Peak| | 0.3474| 0.953 ---------------+--------+--------+--------- RxCan2[060] Avg| 18.60| 0.3182| 0.014 Peak| | 0.3569| 0.694 ---------------+--------+--------+--------- RxCan2[070] Avg| 15.55| 0.4581| 0.017 Peak| | 0.6859| 39.212 ---------------+--------+--------+--------- RxCan2[080] Avg| 15.50| 0.5041| 0.029 Peak| | 0.5414| 1.555 ---------------+--------+--------+--------- RxCan2[083] Avg| 18.70| 0.3083| 0.014 Peak| | 0.3325| 0.557 ---------------+--------+--------+--------- RxCan2[090] Avg| 23.40| 0.3961| 0.014 Peak| | 0.4445| 1.218 ---------------+--------+--------+--------- RxCan2[0a0] Avg| 15.55| 0.2734| 0.014 Peak| | 0.3144| 1.062 ---------------+--------+--------+--------- RxCan2[100] Avg| 15.50| 0.2645| 0.016 Peak| | 0.2875| 1.021 ---------------+--------+--------+--------- RxCan2[108] Avg| 23.40| 0.4231| 0.016 Peak| | 0.4680| 1.297 ---------------+--------+--------+--------- RxCan2[110] Avg| 15.55| 0.2467| 0.014 Peak| | 0.2684| 0.475 ---------------+--------+--------+--------- RxCan2[130] Avg| 13.30| 0.2231| 0.014 Peak| | 0.2447| 0.512 ---------------+--------+--------+--------- RxCan2[150] Avg| 15.50| 0.2533| 0.015 Peak| | 0.2836| 0.823 ---------------+--------+--------+--------- RxCan2[160] Avg| 4.70| 0.0784| 0.014 Peak| | 0.0863| 0.608 ---------------+--------+--------+--------- RxCan2[180] Avg| 15.55| 0.2713| 0.015 Peak| | 0.2841| 0.884 ---------------+--------+--------+--------- RxCan2[190] Avg| 15.50| 0.2596| 0.014 Peak| | 0.2825| 0.743 ---------------+--------+--------+--------- RxCan2[1a0] Avg| 0.95| 0.0164| 0.015 Peak| | 0.0164| 0.346 ---------------+--------+--------+--------- RxCan2[1a4] Avg| 18.65| 0.3232| 0.015 Peak| | 0.3515| 0.989 ---------------+--------+--------+--------- RxCan2[1a8] Avg| 11.60| 0.1911| 0.016 Peak| | 0.2012| 0.757 ---------------+--------+--------+--------- RxCan2[1b0] Avg| 9.35| 0.1558| 0.016 Peak| | 0.1641| 0.795 ---------------+--------+--------+--------- RxCan2[1b4] Avg| 9.35| 0.1543| 0.015 Peak| | 0.1617| 1.217 ---------------+--------+--------+--------- RxCan2[1b8] Avg| 11.65| 0.2003| 0.014 Peak| | 0.2236| 1.549 ---------------+--------+--------+--------- RxCan2[1c0] Avg| 9.40| 0.1532| 0.016 Peak| | 0.1673| 0.955 ---------------+--------+--------+--------- RxCan2[1e0] Avg| 9.30| 0.1582| 0.015 Peak| | 0.1708| 0.661 ---------------+--------+--------+--------- RxCan2[215] Avg| 7.80| 0.1409| 0.016 Peak| | 0.1531| 0.660 ---------------+--------+--------+--------- RxCan2[217] Avg| 7.80| 0.1239| 0.014 Peak| | 0.1333| 0.520 ---------------+--------+--------+--------- RxCan2[220] Avg| 6.20| 0.1041| 0.015 Peak| | 0.1094| 0.652 ---------------+--------+--------+--------- RxCan2[225] Avg| 23.40| 0.4648| 0.015 Peak| | 0.4696| 4.288 ---------------+--------+--------+--------- RxCan2[230] Avg| 6.20| 0.3120| 0.048 Peak| | 0.3377| 1.065 ---------------+--------+--------+--------- RxCan2[240] Avg| 7.70| 0.1248| 0.014 Peak| | 0.1364| 0.635 ---------------+--------+--------+--------- RxCan2[241] Avg| 18.60| 0.3258| 0.014 Peak| | 0.3343| 1.288 ---------------+--------+--------+--------- RxCan2[250] Avg| 4.70| 0.0761| 0.014 Peak| | 0.0809| 0.322 ---------------+--------+--------+--------- RxCan2[255] Avg| 11.75| 0.2058| 0.014 Peak| | 0.2283| 0.937 ---------------+--------+--------+--------- RxCan2[265] Avg| 11.65| 0.1964| 0.014 Peak| | 0.2068| 0.965 ---------------+--------+--------+--------- RxCan2[270] Avg| 4.70| 0.0808| 0.016 Peak| | 0.0949| 0.729 ---------------+--------+--------+--------- RxCan2[290] Avg| 3.15| 0.0498| 0.015 Peak| | 0.0504| 0.449 ---------------+--------+--------+--------- RxCan2[295] Avg| 6.25| 0.1019| 0.014 Peak| | 0.1094| 0.859 ---------------+--------+--------+--------- RxCan2[2a0] Avg| 3.15| 0.0550| 0.014 Peak| | 0.0551| 0.779 ---------------+--------+--------+--------- RxCan2[2a7] Avg| 11.65| 0.1929| 0.014 Peak| | 0.2080| 0.775 ---------------+--------+--------+--------- RxCan2[2b0] Avg| 3.00| 0.0497| 0.015 Peak| | 0.0562| 0.528 ---------------+--------+--------+--------- RxCan2[2c0] Avg| 3.10| 0.0534| 0.016 Peak| | 0.0592| 0.501 ---------------+--------+--------+--------- RxCan2[2e0] Avg| 1.55| 0.0247| 0.014 Peak| | 0.0289| 0.319 ---------------+--------+--------+--------- RxCan2[2f0] Avg| 1.55| 0.0244| 0.014 Peak| | 0.0273| 0.192 ---------------+--------+--------+--------- RxCan2[2f5] Avg| 11.65| 0.2078| 0.016 Peak| | 0.2333| 0.879 ---------------+--------+--------+--------- RxCan2[300] Avg| 1.60| 0.0266| 0.018 Peak| | 0.0278| 0.724 ---------------+--------+--------+--------- RxCan2[310] Avg| 1.55| 0.0276| 0.016 Peak| | 0.0285| 0.759 ---------------+--------+--------+--------- RxCan2[320] Avg| 1.60| 0.0240| 0.014 Peak| | 0.0258| 0.179 ---------------+--------+--------+--------- RxCan2[326] Avg| 9.30| 0.1550| 0.014 Peak| | 0.1582| 0.850 ---------------+--------+--------+--------- RxCan2[330] Avg| 29.95| 0.5311| 0.015 Peak| | 0.5565| 4.522 ---------------+--------+--------+--------- RxCan2[340] Avg| 7.75| 0.1693| 0.024 Peak| | 0.1868| 1.148 ---------------+--------+--------+--------- RxCan2[345] Avg| 1.60| 0.0292| 0.016 Peak| | 0.0316| 0.471 ---------------+--------+--------+--------- RxCan2[350] Avg| 0.00| 0.0000| 0.019 Peak| | 0.0000| 0.188 ---------------+--------+--------+--------- RxCan2[35e] Avg| 4.70| 0.0851| 0.019 Peak| | 0.0911| 1.023 ---------------+--------+--------+--------- RxCan2[360] Avg| 1.60| 0.0258| 0.015 Peak| | 0.0284| 0.306 ---------------+--------+--------+--------- RxCan2[361] Avg| 7.75| 0.1341| 0.017 Peak| | 0.1487| 0.761 ---------------+--------+--------+--------- RxCan2[363] Avg| 1.20| 0.0203| 0.016 Peak| | 0.0220| 0.421 ---------------+--------+--------+--------- RxCan2[370] Avg| 0.85| 0.0140| 0.016 Peak| | 0.0162| 0.354 ---------------+--------+--------+--------- RxCan2[381] Avg| 3.15| 0.0512| 0.016 Peak| | 0.0546| 0.416 ---------------+--------+--------+--------- RxCan2[3a0] Avg| 15.60| 0.2548| 0.015 Peak| | 0.2890| 0.976 ---------------+--------+--------+--------- RxCan2[3d0] Avg| 9.35| 0.1553| 0.019 Peak| | 0.1612| 1.115 ---------------+--------+--------+--------- RxCan2[3d5] Avg| 5.15| 0.0836| 0.016 Peak| | 0.0867| 0.479 ---------------+--------+--------+--------- RxCan2[3e0] Avg| 0.00| 0.0000| 0.014 Peak| | 0.0000| 0.142 ---------------+--------+--------+--------- RxCan2[400] Avg| 3.55| 0.0613| 0.017 Peak| | 0.0695| 0.501 ---------------+--------+--------+--------- RxCan2[405] Avg| 3.50| 0.0584| 0.018 Peak| | 0.0626| 0.686 ---------------+--------+--------+--------- RxCan2[40a] Avg| 7.10| 0.1278| 0.017 Peak| | 0.1389| 1.244 ---------------+--------+--------+--------- RxCan2[415] Avg| 1.60| 0.0258| 0.014 Peak| | 0.0287| 0.266 ---------------+--------+--------+--------- RxCan2[435] Avg| 0.85| 0.0165| 0.019 Peak| | 0.0167| 0.367 ---------------+--------+--------+--------- RxCan2[440] Avg| 0.85| 0.0128| 0.019 Peak| | 0.0141| 0.885 ---------------+--------+--------+--------- RxCan2[465] Avg| 0.95| 0.0177| 0.016 Peak| | 0.0195| 0.721 ---------------+--------+--------+--------- RxCan2[466] Avg| 0.95| 0.0147| 0.014 Peak| | 0.0160| 0.184 ---------------+--------+--------+--------- RxCan2[467] Avg| 0.95| 0.0172| 0.017 Peak| | 0.0188| 0.391 ---------------+--------+--------+--------- RxCan2[501] Avg| 1.45| 0.0273| 0.016 Peak| | 0.0327| 0.996 ---------------+--------+--------+--------- RxCan2[503] Avg| 1.45| 0.0288| 0.020 Peak| | 0.0338| 0.970 ---------------+--------+--------+--------- RxCan2[504] Avg| 1.40| 0.0241| 0.015 Peak| | 0.0263| 0.609 ---------------+--------+--------+--------- RxCan2[505] Avg| 1.40| 0.0255| 0.015 Peak| | 0.0296| 0.866 ---------------+--------+--------+--------- RxCan2[508] Avg| 1.35| 0.0237| 0.017 Peak| | 0.0237| 0.384 ---------------+--------+--------+--------- RxCan2[511] Avg| 1.35| 0.0226| 0.016 Peak| | 0.0228| 0.426 ---------------+--------+--------+--------- RxCan2[51e] Avg| 1.40| 0.0221| 0.014 Peak| | 0.0245| 0.211 ---------------+--------+--------+--------- RxCan2[581] Avg| 0.80| 0.0189| 0.019 Peak| | 0.0290| 1.217 ---------------+--------+--------+--------- RxCan2[606] Avg| 0.00| 0.0000| 0.014 Peak| | 0.0000| 0.142 ---------------+--------+--------+--------- RxCan2[657] Avg| 0.00| 0.0000| 0.014 Peak| | 0.0000| 0.137 ---------------+--------+--------+--------- Cmd:State Avg| 0.00| 0.0000| 0.002 Peak| | 0.0000| 0.024 ===============+========+========+========= Total Avg| 2748.42| 58.3344| 28.718
@Simon: it would be an option to try commenting out the overflow counting, to see if that's causing the issue.
I have commented out the line with the Atomic_Increment statement. Now I no longer receive any messages with “RX Task Queue Overflow Run” Here is the output of poller times status:
OVMS# poll time status Poller timing is: on Type | count | Utlztn | Time | per s | [%] | [ms] ---------------+--------+--------+--------- Poll:PRI Avg| 1.00| 0.0045| 0.004 Peak| | 0.0046| 0.064 ---------------+--------+--------+--------- RxCan1[010] Avg| 34.26| 2.2574| 0.021 Peak| | 2.2574| 4.609 ---------------+--------+--------+--------- RxCan1[030] Avg| 34.26| 2.3820| 0.021 Peak| | 2.3820| 1.135 ---------------+--------+--------+--------- RxCan1[041] Avg| 49.89| 1.2059| 0.021 Peak| | 1.2295| 5.331 ---------------+--------+--------+--------- RxCan1[049] Avg| 49.96| 1.2400| 0.030 Peak| | 1.2699| 1.402 ---------------+--------+--------+--------- RxCan1[04c] Avg| 49.92| 1.1752| 0.021 Peak| | 1.2072| 4.502 ---------------+--------+--------+--------- RxCan1[04d] Avg| 34.31| 2.4433| 0.022 Peak| | 2.4773| 1.368 ---------------+--------+--------+--------- RxCan1[076] Avg| 49.96| 1.2071| 0.024 Peak| | 1.2554| 2.007 ---------------+--------+--------+--------- RxCan1[077] Avg| 49.96| 1.2012| 0.022 Peak| | 1.2492| 1.955 ---------------+--------+--------+--------- RxCan1[07a] Avg| 34.35| 2.9251| 0.030 Peak| | 3.1103| 1.829 ---------------+--------+--------+--------- RxCan1[07d] Avg| 49.96| 1.1954| 0.022 Peak| | 1.2282| 1.074 ---------------+--------+--------+--------- RxCan1[0c8] Avg| 49.89| 1.2491| 0.021 Peak| | 1.3169| 1.181 ---------------+--------+--------+--------- RxCan1[11a] Avg| 34.39| 2.4423| 0.024 Peak| | 2.5693| 1.491 ---------------+--------+--------+--------- RxCan1[130] Avg| 49.95| 1.1312| 0.020 Peak| | 1.1684| 1.218 ---------------+--------+--------+--------- RxCan1[139] Avg| 49.92| 1.1547| 0.021 Peak| | 1.1778| 1.199 ---------------+--------+--------+--------- RxCan1[156] Avg| 9.96| 0.2391| 0.023 Peak| | 0.2591| 1.943 ---------------+--------+--------+--------- RxCan1[160] Avg| 49.96| 1.1657| 0.031 Peak| | 1.2017| 2.158 ---------------+--------+--------+--------- RxCan1[165] Avg| 49.96| 1.1257| 0.021 Peak| | 1.1652| 1.471 ---------------+--------+--------+--------- RxCan1[167] Avg| 34.31| 2.2871| 0.021 Peak| | 2.3374| 1.776 ---------------+--------+--------+--------- RxCan1[171] Avg| 49.96| 1.1879| 0.023 Peak| | 1.2268| 1.166 ---------------+--------+--------+--------- RxCan1[178] Avg| 10.00| 0.2371| 0.029 Peak| | 0.2459| 1.516 ---------------+--------+--------+--------- RxCan1[179] Avg| 10.00| 0.2196| 0.021 Peak| | 0.2260| 0.758 ---------------+--------+--------+--------- RxCan1[180] Avg| 49.96| 1.1703| 0.022 Peak| | 1.2103| 1.481 ---------------+--------+--------+--------- RxCan1[185] Avg| 49.95| 1.1127| 0.020 Peak| | 1.1636| 1.292 ---------------+--------+--------+--------- RxCan1[1a0] Avg| 49.96| 1.1009| 0.020 Peak| | 1.1468| 1.060 ---------------+--------+--------+--------- RxCan1[1e0] Avg| 49.96| 1.1744| 0.021 Peak| | 1.2027| 1.240 ---------------+--------+--------+--------- RxCan1[1e4] Avg| 49.96| 1.3733| 0.032 Peak| | 1.4085| 1.523 ---------------+--------+--------+--------- RxCan1[1f0] Avg| 33.30| 0.7625| 0.023 Peak| | 0.8004| 3.349 ---------------+--------+--------+--------- RxCan1[200] Avg| 49.92| 1.1462| 0.021 Peak| | 1.1809| 1.254 ---------------+--------+--------+--------- RxCan1[202] Avg| 34.39| 2.4034| 0.028 Peak| | 2.5611| 1.472 ---------------+--------+--------+--------- RxCan1[204] Avg| 34.30| 2.2541| 0.022 Peak| | 2.2924| 2.015 ---------------+--------+--------+--------- RxCan1[213] Avg| 49.96| 1.1599| 0.027 Peak| | 1.1794| 1.714 ---------------+--------+--------+--------- RxCan1[214] Avg| 49.96| 1.1537| 0.022 Peak| | 1.1941| 1.439 ---------------+--------+--------+--------- RxCan1[217] Avg| 34.39| 2.2490| 0.020 Peak| | 2.2856| 3.766 ---------------+--------+--------+--------- RxCan1[218] Avg| 49.96| 1.1291| 0.021 Peak| | 1.1646| 1.547 ---------------+--------+--------+--------- RxCan1[230] Avg| 49.96| 1.1272| 0.020 Peak| | 1.2237| 1.295 ---------------+--------+--------+--------- RxCan1[240] Avg| 10.00| 0.2191| 0.021 Peak| | 0.2226| 1.067 ---------------+--------+--------+--------- RxCan1[242] Avg| 24.96| 0.6911| 0.024 Peak| | 0.7161| 1.180 ---------------+--------+--------+--------- RxCan1[24a] Avg| 9.96| 0.2345| 0.024 Peak| | 0.2535| 0.779 ---------------+--------+--------+--------- RxCan1[24b] Avg| 9.96| 0.2433| 0.023 Peak| | 0.2697| 2.085 ---------------+--------+--------+--------- RxCan1[24c] Avg| 9.96| 0.3103| 0.029 Peak| | 0.3203| 0.809 ---------------+--------+--------+--------- RxCan1[25a] Avg| 10.00| 0.2346| 0.022 Peak| | 0.2405| 1.223 ---------------+--------+--------+--------- RxCan1[25b] Avg| 49.89| 1.2121| 0.020 Peak| | 1.3659| 19.523 ---------------+--------+--------+--------- RxCan1[25c] Avg| 34.31| 2.4193| 0.019 Peak| | 2.8022| 58.153 ---------------+--------+--------+--------- RxCan1[260] Avg| 9.93| 0.2149| 0.024 Peak| | 0.2174| 1.096 ---------------+--------+--------+--------- RxCan1[270] Avg| 49.96| 1.2042| 0.026 Peak| | 1.2755| 20.612 ---------------+--------+--------+--------- RxCan1[280] Avg| 49.96| 1.0922| 0.020 Peak| | 1.1312| 1.266 ---------------+--------+--------+--------- RxCan1[2e4] Avg| 19.96| 0.6942| 0.044 Peak| | 0.8604| 1.533 ---------------+--------+--------+--------- RxCan1[2ec] Avg| 10.00| 0.3727| 0.025 Peak| | 0.5154| 28.819 ---------------+--------+--------+--------- RxCan1[2ed] Avg| 10.00| 0.2298| 0.023 Peak| | 0.2378| 1.345 ---------------+--------+--------+--------- RxCan1[2ee] Avg| 9.96| 0.2172| 0.019 Peak| | 0.2210| 1.058 ---------------+--------+--------+--------- RxCan1[312] Avg| 10.00| 0.2206| 0.020 Peak| | 0.2396| 1.060 ---------------+--------+--------+--------- RxCan1[326] Avg| 9.96| 0.2099| 0.020 Peak| | 0.2158| 0.507 ---------------+--------+--------+--------- RxCan1[336] Avg| 1.00| 0.0212| 0.020 Peak| | 0.0233| 0.315 ---------------+--------+--------+--------- RxCan1[352] Avg| 6.64| 0.1675| 0.024 Peak| | 0.1818| 1.048 ---------------+--------+--------+--------- RxCan1[355] Avg| 2.00| 0.0540| 0.027 Peak| | 0.0619| 1.209 ---------------+--------+--------+--------- RxCan1[35e] Avg| 9.98| 0.2221| 0.021 Peak| | 0.2284| 1.186 ---------------+--------+--------+--------- RxCan1[365] Avg| 10.00| 0.2282| 0.023 Peak| | 0.2335| 0.769 ---------------+--------+--------+--------- RxCan1[366] Avg| 10.00| 0.3163| 0.022 Peak| | 0.6330| 23.587 ---------------+--------+--------+--------- RxCan1[367] Avg| 10.00| 0.2417| 0.021 Peak| | 0.2568| 1.417 ---------------+--------+--------+--------- RxCan1[368] Avg| 9.96| 0.2187| 0.019 Peak| | 0.2250| 1.135 ---------------+--------+--------+--------- RxCan1[369] Avg| 9.99| 0.2277| 0.021 Peak| | 0.2334| 0.667 ---------------+--------+--------+--------- RxCan1[380] Avg| 9.96| 0.2133| 0.020 Peak| | 0.2161| 0.560 ---------------+--------+--------+--------- RxCan1[38b] Avg| 24.92| 0.5622| 0.022 Peak| | 0.5716| 1.618 ---------------+--------+--------+--------- RxCan1[3b3] Avg| 10.00| 0.2132| 0.023 Peak| | 0.2194| 1.106 ---------------+--------+--------+--------- RxCan1[400] Avg| 4.00| 0.0885| 0.019 Peak| | 0.0885| 0.570 ---------------+--------+--------+--------- RxCan1[405] Avg| 3.70| 0.1414| 0.036 Peak| | 0.1414| 0.710 ---------------+--------+--------+--------- RxCan1[40a] Avg| 8.00| 0.1887| 0.021 Peak| | 0.1887| 1.027 ---------------+--------+--------+--------- RxCan1[410] Avg| 10.00| 0.2141| 0.023 Peak| | 0.2188| 0.984 ---------------+--------+--------+--------- RxCan1[411] Avg| 10.00| 0.2325| 0.023 Peak| | 0.2447| 0.660 ---------------+--------+--------+--------- RxCan1[416] Avg| 10.00| 0.2326| 0.022 Peak| | 0.2389| 0.774 ---------------+--------+--------+--------- RxCan1[421] Avg| 10.00| 0.2245| 0.021 Peak| | 0.2271| 1.160 ---------------+--------+--------+--------- RxCan1[42d] Avg| 10.00| 0.2315| 0.021 Peak| | 0.2411| 0.677 ---------------+--------+--------+--------- RxCan1[42f] Avg| 10.00| 0.2480| 0.020 Peak| | 0.2975| 8.093 ---------------+--------+--------+--------- RxCan1[430] Avg| 10.00| 0.2203| 0.019 Peak| | 0.2302| 0.847 ---------------+--------+--------+--------- RxCan1[434] Avg| 10.00| 0.2331| 0.019 Peak| | 0.2620| 1.150 ---------------+--------+--------+--------- RxCan1[435] Avg| 6.68| 0.1445| 0.020 Peak| | 0.1486| 1.063 ---------------+--------+--------+--------- RxCan1[43e] Avg| 20.00| 0.4515| 0.021 Peak| | 0.4632| 1.013 ---------------+--------+--------+--------- RxCan1[440] Avg| 1.00| 0.0210| 0.019 Peak| | 0.0218| 0.294 ---------------+--------+--------+--------- RxCan1[465] Avg| 0.95| 0.0214| 0.023 Peak| | 0.0215| 0.587 ---------------+--------+--------+--------- RxCan1[466] Avg| 0.95| 0.0211| 0.021 Peak| | 0.0215| 0.350 ---------------+--------+--------+--------- RxCan1[467] Avg| 0.95| 0.0191| 0.020 Peak| | 0.0201| 0.444 ---------------+--------+--------+--------- RxCan1[472] Avg| 0.68| 0.0588| 0.085 Peak| | 0.0606| 1.170 ---------------+--------+--------+--------- RxCan1[473] Avg| 0.66| 0.0407| 0.062 Peak| | 0.0492| 1.329 ---------------+--------+--------+--------- RxCan1[474] Avg| 1.00| 0.0218| 0.021 Peak| | 0.0237| 0.278 ---------------+--------+--------+--------- RxCan1[475] Avg| 1.96| 0.0466| 0.024 Peak| | 0.0570| 1.112 ---------------+--------+--------+--------- RxCan1[476] Avg| 2.00| 0.0454| 0.020 Peak| | 0.0497| 0.409 ---------------+--------+--------+--------- RxCan1[477] Avg| 2.00| 0.0497| 0.022 Peak| | 0.0595| 0.864 ---------------+--------+--------+--------- RxCan1[595] Avg| 1.00| 0.0223| 0.021 Peak| | 0.0241| 0.296 ---------------+--------+--------+--------- RxCan1[59e] Avg| 1.00| 0.0233| 0.024 Peak| | 0.0289| 0.713 ---------------+--------+--------+--------- RxCan1[5a2] Avg| 1.00| 0.0200| 0.020 Peak| | 0.0204| 0.264 ---------------+--------+--------+--------- RxCan1[5ba] Avg| 1.00| 0.0206| 0.021 Peak| | 0.0238| 0.515 ---------------+--------+--------+--------- RxCan2[020] Avg| 33.30| 0.7938| 0.022 Peak| | 0.7938| 4.793 ---------------+--------+--------+--------- RxCan2[030] Avg| 22.20| 0.5229| 0.022 Peak| | 0.5229| 0.985 ---------------+--------+--------+--------- RxCan2[03a] Avg| 19.90| 0.4700| 0.022 Peak| | 0.4700| 0.804 ---------------+--------+--------+--------- RxCan2[040] Avg| 19.90| 0.4678| 0.023 Peak| | 0.4678| 1.222 ---------------+--------+--------+--------- RxCan2[060] Avg| 20.00| 0.6480| 0.050 Peak| | 0.6480| 20.997 ---------------+--------+--------+--------- RxCan2[070] Avg| 16.60| 0.3944| 0.022 Peak| | 0.3944| 1.053 ---------------+--------+--------+--------- RxCan2[080] Avg| 16.70| 0.7032| 0.041 Peak| | 0.7032| 1.611 ---------------+--------+--------+--------- RxCan2[083] Avg| 20.10| 0.4329| 0.021 Peak| | 0.4329| 0.520 ---------------+--------+--------+--------- RxCan2[090] Avg| 24.90| 0.5674| 0.017 Peak| | 0.5674| 1.149 ---------------+--------+--------+--------- RxCan2[0a0] Avg| 16.60| 0.3836| 0.023 Peak| | 0.3836| 0.933 ---------------+--------+--------+--------- RxCan2[100] Avg| 16.50| 0.3661| 0.021 Peak| | 0.3661| 0.740 ---------------+--------+--------+--------- RxCan2[108] Avg| 24.90| 0.5923| 0.025 Peak| | 0.5923| 0.859 ---------------+--------+--------+--------- RxCan2[110] Avg| 16.70| 0.3906| 0.023 Peak| | 0.3906| 0.697 ---------------+--------+--------+--------- RxCan2[130] Avg| 14.40| 0.3341| 0.022 Peak| | 0.3341| 0.829 ---------------+--------+--------+--------- RxCan2[150] Avg| 16.50| 0.4025| 0.020 Peak| | 0.4025| 1.120 ---------------+--------+--------+--------- RxCan2[160] Avg| 4.90| 0.1252| 0.025 Peak| | 0.1252| 0.502 ---------------+--------+--------+--------- RxCan2[180] Avg| 16.60| 0.3899| 0.023 Peak| | 0.3899| 0.799 ---------------+--------+--------+--------- RxCan2[190] Avg| 16.60| 0.3892| 0.025 Peak| | 0.3892| 1.172 ---------------+--------+--------+--------- RxCan2[1a0] Avg| 1.00| 0.0281| 0.025 Peak| | 0.0281| 0.695 ---------------+--------+--------+--------- RxCan2[1a4] Avg| 20.00| 0.4525| 0.022 Peak| | 0.4525| 1.231 ---------------+--------+--------+--------- RxCan2[1a8] Avg| 12.50| 0.2886| 0.020 Peak| | 0.2886| 1.048 ---------------+--------+--------+--------- RxCan2[1b0] Avg| 10.00| 0.2300| 0.023 Peak| | 0.2300| 0.579 ---------------+--------+--------+--------- RxCan2[1b4] Avg| 10.00| 0.2334| 0.022 Peak| | 0.2334| 0.947 ---------------+--------+--------+--------- RxCan2[1b8] Avg| 12.40| 0.2970| 0.023 Peak| | 0.2970| 0.909 ---------------+--------+--------+--------- RxCan2[1c0] Avg| 10.00| 0.2257| 0.021 Peak| | 0.2257| 0.983 ---------------+--------+--------+--------- RxCan2[1e0] Avg| 10.00| 0.2141| 0.023 Peak| | 0.2141| 0.556 ---------------+--------+--------+--------- RxCan2[215] Avg| 8.30| 0.2047| 0.025 Peak| | 0.2047| 0.786 ---------------+--------+--------+--------- RxCan2[217] Avg| 8.30| 0.2033| 0.022 Peak| | 0.2033| 1.135 ---------------+--------+--------+--------- RxCan2[220] Avg| 6.70| 0.1647| 0.020 Peak| | 0.1647| 0.961 ---------------+--------+--------+--------- RxCan2[225] Avg| 24.90| 0.6136| 0.026 Peak| | 0.6136| 1.018 ---------------+--------+--------+--------- RxCan2[230] Avg| 6.70| 0.4045| 0.057 Peak| | 0.4045| 1.532 ---------------+--------+--------+--------- RxCan2[240] Avg| 8.20| 0.1849| 0.021 Peak| | 0.1849| 0.510 ---------------+--------+--------+--------- RxCan2[241] Avg| 20.00| 0.4312| 0.021 Peak| | 0.4312| 5.110 ---------------+--------+--------+--------- RxCan2[250] Avg| 5.00| 0.1072| 0.021 Peak| | 0.1072| 0.320 ---------------+--------+--------+--------- RxCan2[255] Avg| 12.50| 0.3091| 0.022 Peak| | 0.3091| 0.904 ---------------+--------+--------+--------- RxCan2[265] Avg| 12.50| 0.2819| 0.021 Peak| | 0.2819| 1.035 ---------------+--------+--------+--------- RxCan2[270] Avg| 5.00| 0.1189| 0.022 Peak| | 0.1189| 0.631 ---------------+--------+--------+--------- RxCan2[290] Avg| 3.30| 0.0740| 0.023 Peak| | 0.0740| 0.455 ---------------+--------+--------+--------- RxCan2[295] Avg| 6.60| 0.1431| 0.023 Peak| | 0.1431| 0.504 ---------------+--------+--------+--------- RxCan2[2a0] Avg| 3.30| 0.0686| 0.020 Peak| | 0.0686| 0.445 ---------------+--------+--------+--------- RxCan2[2a7] Avg| 12.50| 0.2869| 0.021 Peak| | 0.2869| 0.660 ---------------+--------+--------+--------- RxCan2[2b0] Avg| 3.20| 0.0707| 0.023 Peak| | 0.0707| 0.331 ---------------+--------+--------+--------- RxCan2[2c0] Avg| 3.20| 0.0988| 0.026 Peak| | 0.0988| 0.932 ---------------+--------+--------+--------- RxCan2[2e0] Avg| 1.60| 0.0388| 0.024 Peak| | 0.0388| 0.393 ---------------+--------+--------+--------- RxCan2[2f0] Avg| 1.70| 0.0376| 0.021 Peak| | 0.0376| 0.282 ---------------+--------+--------+--------- RxCan2[2f5] Avg| 12.50| 0.2833| 0.021 Peak| | 0.2833| 0.855 ---------------+--------+--------+--------- RxCan2[300] Avg| 1.70| 0.0398| 0.023 Peak| | 0.0398| 0.488 ---------------+--------+--------+--------- RxCan2[310] Avg| 1.60| 0.0480| 0.026 Peak| | 0.0480| 0.937 ---------------+--------+--------+--------- RxCan2[320] Avg| 1.70| 0.0346| 0.020 Peak| | 0.0346| 0.370 ---------------+--------+--------+--------- RxCan2[326] Avg| 9.90| 0.2200| 0.022 Peak| | 0.2200| 0.502 ---------------+--------+--------+--------- RxCan2[330] Avg| 32.30| 0.7323| 0.021 Peak| | 0.7323| 1.130 ---------------+--------+--------+--------- RxCan2[340] Avg| 8.20| 0.2375| 0.028 Peak| | 0.2375| 0.578 ---------------+--------+--------+--------- RxCan2[345] Avg| 1.60| 0.0393| 0.022 Peak| | 0.0393| 0.590 ---------------+--------+--------+--------- RxCan2[35e] Avg| 5.00| 0.1303| 0.023 Peak| | 0.1303| 0.943 ---------------+--------+--------+--------- RxCan2[360] Avg| 1.70| 0.0381| 0.025 Peak| | 0.0381| 0.922 ---------------+--------+--------+--------- RxCan2[361] Avg| 8.20| 0.1907| 0.023 Peak| | 0.1907| 1.119 ---------------+--------+--------+--------- RxCan2[363] Avg| 1.30| 0.0337| 0.024 Peak| | 0.0337| 0.425 ---------------+--------+--------+--------- RxCan2[370] Avg| 0.90| 0.0194| 0.022 Peak| | 0.0194| 0.246 ---------------+--------+--------+--------- RxCan2[381] Avg| 3.20| 0.0684| 0.024 Peak| | 0.0684| 0.828 ---------------+--------+--------+--------- RxCan2[3a0] Avg| 16.60| 0.3734| 0.022 Peak| | 0.3734| 0.636 ---------------+--------+--------+--------- RxCan2[3d0] Avg| 10.00| 0.2262| 0.023 Peak| | 0.2262| 0.663 ---------------+--------+--------+--------- RxCan2[3d5] Avg| 5.60| 0.1335| 0.022 Peak| | 0.1335| 1.222 ---------------+--------+--------+--------- RxCan2[400] Avg| 4.00| 0.0949| 0.022 Peak| | 0.0949| 0.715 ---------------+--------+--------+--------- RxCan2[405] Avg| 3.70| 0.0861| 0.022 Peak| | 0.0861| 0.443 ---------------+--------+--------+--------- RxCan2[40a] Avg| 8.00| 0.1853| 0.021 Peak| | 0.1853| 0.552 ---------------+--------+--------+--------- RxCan2[415] Avg| 1.60| 0.0341| 0.021 Peak| | 0.0341| 0.273 ---------------+--------+--------+--------- RxCan2[435] Avg| 0.90| 0.0220| 0.025 Peak| | 0.0220| 0.354 ---------------+--------+--------+--------- RxCan2[440] Avg| 0.90| 0.0199| 0.021 Peak| | 0.0199| 0.266 ---------------+--------+--------+--------- RxCan2[465] Avg| 0.90| 0.0234| 0.028 Peak| | 0.0234| 0.633 ---------------+--------+--------+--------- RxCan2[466] Avg| 1.00| 0.0222| 0.021 Peak| | 0.0222| 0.322 ---------------+--------+--------+--------- RxCan2[467] Avg| 1.00| 0.0221| 0.020 Peak| | 0.0221| 0.355 ---------------+--------+--------+--------- RxCan2[501] Avg| 1.50| 0.0335| 0.023 Peak| | 0.0335| 0.393 ---------------+--------+--------+--------- RxCan2[503] Avg| 1.50| 0.0370| 0.022 Peak| | 0.0370| 0.546 ---------------+--------+--------+--------- RxCan2[504] Avg| 1.40| 0.0328| 0.022 Peak| | 0.0328| 0.489 ---------------+--------+--------+--------- RxCan2[505] Avg| 1.40| 0.0290| 0.021 Peak| | 0.0290| 0.354 ---------------+--------+--------+--------- RxCan2[508] Avg| 1.40| 0.0318| 0.023 Peak| | 0.0318| 0.408 ---------------+--------+--------+--------- RxCan2[511] Avg| 1.40| 0.0306| 0.022 Peak| | 0.0306| 0.328 ---------------+--------+--------+--------- RxCan2[51e] Avg| 1.40| 0.0310| 0.022 Peak| | 0.0310| 0.269 ---------------+--------+--------+--------- RxCan2[581] Avg| 1.00| 0.0222| 0.022 Peak| | 0.0222| 0.256 ---------------+--------+--------+--------- Cmd:State Avg| 0.00| 0.0000| 0.002 Peak| | 0.0000| 0.024 ===============+========+========+========= Total Avg| 2795.57| 82.7745| 40.174
Cheers, Simon
Am 17.01.2025 um 17:49 schrieb Michael Balzer via OvmsDev:
OK, I've got a new idea: CAN timing.
Comparing our esp32can bit timing to the esp-idf driver's, there seem to be some differences: https://github.com/espressif/esp-idf/blob/master/components/hal/include/hal/...
Transceivers are normally tolerant to small timing offsets. Maybe being off a little bit has no effect under normal conditions, but it has when the transceiver has to cope with a filled RX queue. That could be causing the transceiver to slide just out of sync. If the timing gets garbled, the transceiver would signal errors in the packets to the bus, possibly so many the vehicle ECUs decide to raise an error condition.
Is that plausible?
On why the new poller could be causing this (in combination with too slow processing by the vehicle): as mentioned, the standard CAN listener mechanism doesn't care about queue overflows. The poller does. `OvmsPollers::Queue_PollerFrame()` does a log call when Tx/Rx tracing is enabled, that could even block, but tracing is optional and only meant for debugging. Not optional is the overflow counting using an atomic uint32.
The atomic types are said to be fast, but I never checked their actual implementation on the ESP32. Maybe they can block as well?
@Simon: it would be an option to try commenting out the overflow counting, to see if that's causing the issue.
Regards, Michael
Am 17.01.25 um 15:37 schrieb Chris Box via OvmsDev:
Yes, I can confirm I've had one experience of the Leaf switching to Neutral while driving, with a yellow warning symbol on the dash. It refused to reselect Drive until I had switched the car off and back on. Derek wasn't so lucky and he need to clear fault codes before the car would work.
On returning home, I found OVMS was not accessible over a network. I didn't try a USB cable. Unplugging and reinserting the OBD cable caused OVMS to rejoin Wi-Fi. However the SD logs showed nothing from the time of the event. CAN writes are enabled, so it can perform SOC limiting.
My car has been using this firmware since 21st November, based on the git master of that day. As a relatively new user of OVMS (only since October) I don't have much experience of older firmware.
Perhaps a safeguard should be implemented before releasing a new stable firmware that will be automatically downloaded by Leaf owners. But I don't have the expertise to know what that safeguard should be. Derek's suggestion of 'only CAN write when parked' appears to be a good idea.
Chris
On 2025-01-15 18:18, Derek Caudwell via OvmsDev wrote:
Since the following email I have high confidence the issue on the Leaf is related/caused by the poller as there has been no further occurrence and Chris has also experienced the car going to neutral on the new poller firmware.
.... I haven't ruled out it being a fault with my car yet. Shortly after it faulted the car was run into so has been off the road for sometime, my first step was to replace 12V battery. The ovms unit is now unplugged and if it does not fault over the next month while driving I'll be reasonably confident
_______________________________________________ OvmsDev mailing list OvmsDev@lists.openvehicles.com http://lists.openvehicles.com/mailman/listinfo/ovmsdev
-- Michael Balzer * Am Rahmen 5 * D-58313 Herdecke Fon 02330 9104094 * Handy 0176 20698926
Thanks Michael I can't recall testing a later version but I think Chris can confirm he was on a later version when his Leaf had a similar problem. The Leaf is now my wife's daily drive so I won't be able to take a look at making the suggested changes for a couple of weeks at least. On Mon, 20 Jan 2025, 8:31 am Michael Balzer via OvmsDev, < ovmsdev@lists.openvehicles.com> wrote:
Derek,
Am 03.05.24 um 12:53 schrieb Derek Caudwell via OvmsDev:
When running *firmware **3.3.004-74-gbd4e7196* on my Nissan Leaf I suspect (but can't be 100% sure as it's only been 24h without fault) the new poller caused the car to throw the attached faults from overloading the can bus whilst driving. The fault was sufficient to send the car into limp mode and could not be driven until cleared with LeafSpy.
Build 3.3.004-74 (released 2024-04-30) did not yet include the poller tracing control, i.e. it did lots of logging for frames, significantly affecting overall performance.
Poller tracing control was introduced in https://github.com/openvehicles/Open-Vehicle-Monitoring-System-3/commit/7e40... on May 12.
That commit was first included in build 3.3.004-103-g11fddbf6 released 2024-05-25. Do you remember testing that build or a later one?
But as I still don't understand how a software queue overflow could cause a bus crash, I've also checked the 500 kbit timing for the MCP2515 and found that may have the same issue as the 125 kbit timing:
Our timing is: case CAN_SPEED_500KBPS: cnf1=0x00; cnf2=0xf0; cnf3=0x86; = PROP=1, PS1=7, PS2=7, SJW=1, Sample 3x @56.3%
Remember, the SAE/CiA recommendation is SJW=2, Sample 1x @87.5%. That would translate to: PROP=5, PS1=8, PS2=2, SJW=2, Sample 1x @87.5% = cnf1=0x40; cnf2=0xbc; cnf3=0x81;
I also checked the Arduino MCP_CAN lib, and that uses: cnf1=0x40; cnf2=0xe5; cnf3=0x83; = PROP=6, PS1=5, PS2=4, SJW=2, Sample 3x @75%
So our timing for 500 kbit/s on the MCP buses also isn't as recommended.
Derek, could you test the SAE/CiA recommendation and the MCP_CAN config as shown? Or anyone else with a live can2/can3 bus at 500 kbit?
If these work, the question is which is the more general setup we should adopt. Apparently the MCP_CAN lib also does not follow the CiA recommendation, I wonder if the MCP_CAN config is a compromise for compatibility.
Regards, Michael
Am 19.01.25 um 19:07 schrieb Derek Caudwell via OvmsDev:
Hi Michael
I just used the firmware stock with no changes to the poller settings.
The Leaf is using high speeds on both buses: RegisterCanBus(1,CAN_MODE_ACTIVE,CAN_SPEED_500KBPS); RegisterCanBus(2,CAN_MODE_ACTIVE,CAN_SPEED_500KBPS);
On Sun, 19 Jan 2025, 10:15 pm Michael Balzer via OvmsDev, < ovmsdev@lists.openvehicles.com> wrote:
Michael,
I suggest adding a standard bool member variable to reflect if any filter is defined, so `PollerRxCallback()` can just skip the filter test while that is false. A mutex has some overhead, even if used non-blocking, and a bool variable only read there will be sufficient to signal "apply filtering" to the callback. With the simple bool test, all vehicles that don't need filtering (i.e. most vehicles) will have a neglectible impact from this.
Regarding the overhead: the GCC atomic implementation should use the xtensa CPU builtin atomic support (SCOMPARE1 register & S32C1I instruction), so should be pretty fast and not use any interrupt disabling, see:
- https://gcc.gnu.org/wiki/Atomic (xtensa atomic support since gcc 4.4.0) - https://www.cadence.com/content/dam/cadence-www/global/en_US/documents/tools... (section 4.3.13)
So I still doubt the queue overflow is the real culprit.
But having the filter option doesn't hurt (with my suggestion above), and your changes to the queue processing look promising as well.
@Derek: what was your poller tracing & timing setup when you had the bus issue on the Leaf? I still think that was something related to your car or setup. There are currently 11 Leafs on my server running "edge" releases including the new poller, all without (reported) issues.
Regards, Michael
Am 19.01.25 um 04:26 schrieb Michael Geddes:
P/R Created https://github.com/openvehicles/Open-Vehicle-Monitoring-System-3/pull/1100 Let me know if you want me to split it up or ANY changes and I'll get onto it asap.
Maybe somebody could grab the code and check it out in the context of specifying some filters. This will prevent those messages from coming to the vehicle implementation at all.. and even from going through the poller queue. It is non-blocking meaning that the filter is briefly inopperational while the filter is being modified.
//.
On Sun, 19 Jan 2025 at 11:02, Michael Geddes <frog@bunyip.wheelycreek.net> wrote:
On Sat, 18 Jan 2025 at 17:08, Michael Balzer via OvmsDev < ovmsdev@lists.openvehicles.com> wrote:
I have commented out the line with the Atomic_Increment statement. Now I no longer receive any messages with “RX Task Queue Overflow Run” Here is the output of poller times status:
The main question is if you still get the CAN bus crash (vehicle running into issues) with that modification in active mode. Timing statistics were not expected to change.
I have a feeling that the atomic operations are along the lines of:
* Set Interrupts off * atomic operation * Set interrupts on
Which means no real 'blocking' .. just not allowing interrupts and therefor task switching for a couple of instructions.
Nearly 2800 frames per second is quite a lot, and most is on can1 with many frame periods at 20 ms. Yet the total processing time averages at 30-40 ms, so there is no actual CPU capacity issue for that amount of frames.
@Derek: can you please supply these statistics for the Leaf in drive mode as well?
Am 18.01.25 um 02:42 schrieb Michael Geddes via OvmsDev:
Maybe try setting CONFIG_OVMS_VEHICLE_CAN_RX_QUEUE_SIZE = 160 and see if that reduces the overflow?
Simons car sends at least 91 process data frame IDs on can1 and 84 on can2. Worst case would be these come all in within the shortest possible time span, that would mean the queue needs to be able to hold 175 frames. I'd add some headroom and round up to 200.
But keep in mind, if the Incoming processing actually occasionally gets blocked for up to 60 ms -- as indicated by Simons statistics --, the queue may need to be twice as large.
Am 18.01.25 um 02:42 schrieb Michael Geddes via OvmsDev:
I was thinking that the frame filter would be here: void OvmsPollers::PollerRxCallback(const CAN_frame_t* frame, bool success) { Queue_PollerFrame(*frame, success, false); } which I guess is executed in the task handling the CAN queue. (we don't know how many frames get dropped there).
Actually we do know that, or at least have some indication, as we count the CAN transceiver queue overruns. That info is included as "Rx overflw" in the can status output & as "rxovr" in the logs.
Adding a filter before queueing the frame would exclude the filtered IDs from all vehicle processing. I meant adding a filter just to exclude IDs from the timing statistics, assuming those are the culprits, as Simon wrote the issue only appears after enabling the timing statistics and printing them. That's why I asked if printing might need to lock the statistics for too long in case of such a long list.
Completely blocking ID ranges from processing by the vehicle should normally not be necessary, unless the Incoming handler is written very poorly.
Yet, if we add that, a mutex in the CAN RX callback must be avoided, or would need to be non-blocking:
The only real concern is thread safety between checking and adding to the filter - so the check itself might have to be mutexed. void OvmsPollers::PollerRxCallback(const CAN_frame_t* frame, bool success) { // Check filter { OvmsRecMutexLock lock(&m_filter_mutex); if (! m_filter->IsFiltered(frame)) return; } Queue_PollerFrame(*frame, success, false); }
A mutex like that could block the CAN task, which must be avoided at all cost. I introduced CAN callbacks for vehicles & applications that need to react to certain frames as fast as possible, e.g. to maintain control precedence, so cannot use the standard CAN listener mechanism (frame queueing).
The current poller callback use is OK, if (!) the atomic type really isn't the culprit, ie doesn't block.
So if (!) an ID filter needs to be added before queueing, it needs to be done in a way that needs no mutex. But I don't see an issue with the vehicle passing a fixed filter when registering with the poller/buses. The filter doesn't need to by mutable on the fly.
Regards, Michael
Am 17.01.25 um 19:42 schrieb Simon Ehlen via OvmsDev:
The poller statistics can help you track this down, but you need to have at least 10 seconds of statistics, the more the better. Rule of thumb: PRI average at 0.0/second means you don't have enough data yet.
There were again many messages with “RX Task Queue Overflow Run”. Here are the statistics of poller times status:
OVMS# poll times status Poller timing is: on Type | count | Utlztn | Time | per s | [%] | [ms] ---------------+--------+--------+--------- Poll:PRI Avg| 1.00| 0.0043| 0.004 Peak| | 0.0043| 0.052 ---------------+--------+--------+--------- RxCan1[010] Avg| 34.26| 1.6741| 0.015 Peak| | 1.6741| 1.182 ---------------+--------+--------+--------- RxCan1[030] Avg| 34.06| 1.7085| 0.020 Peak| | 1.7085| 1.390 ---------------+--------+--------+--------- RxCan1[041] Avg| 49.89| 0.8109| 0.016 Peak| | 0.8541| 1.098 ---------------+--------+--------+--------- RxCan1[049] Avg| 50.00| 1.5970| 0.019 Peak| | 1.7154| 32.233 ---------------+--------+--------+--------- RxCan1[04c] Avg| 49.92| 0.8340| 0.014 Peak| | 0.8933| 1.995 ---------------+--------+--------+--------- RxCan1[04d] Avg| 34.43| 1.6211| 0.014 Peak| | 1.6756| 1.318 ---------------+--------+--------+--------- RxCan1[076] Avg| 50.00| 0.8362| 0.024 Peak| | 0.8784| 2.185 ---------------+--------+--------+--------- RxCan1[077] Avg| 50.00| 0.7837| 0.014 Peak| | 0.8083| 1.156 ---------------+--------+--------+--------- RxCan1[07a] Avg| 34.31| 2.1870| 0.017 Peak| | 2.3252| 1.888 ---------------+--------+--------+--------- RxCan1[07d] Avg| 50.00| 0.8001| 0.013 Peak| | 0.8434| 1.150 ---------------+--------+--------+--------- RxCan1[0c8] Avg| 49.96| 0.8359| 0.013 Peak| | 0.8715| 1.171 ---------------+--------+--------+--------- RxCan1[11a] Avg| 34.35| 1.6701| 0.020 Peak| | 1.6981| 1.273 ---------------+--------+--------+--------- RxCan1[130] Avg| 50.00| 0.7902| 0.018 Peak| | 0.8513| 0.980 ---------------+--------+--------+--------- RxCan1[139] Avg| 49.92| 0.7872| 0.013 Peak| | 0.8219| 0.795 ---------------+--------+--------+--------- RxCan1[156] Avg| 10.00| 0.1620| 0.014 Peak| | 0.1729| 0.919 ---------------+--------+--------+--------- RxCan1[160] Avg| 50.04| 0.7977| 0.014 Peak| | 0.8232| 1.495 ---------------+--------+--------+--------- RxCan1[165] Avg| 49.85| 0.7976| 0.014 Peak| | 0.8486| 1.015 ---------------+--------+--------+--------- RxCan1[167] Avg| 34.39| 1.6025| 0.016 Peak| | 1.6888| 1.354 ---------------+--------+--------+--------- RxCan1[171] Avg| 50.00| 0.8150| 0.017 Peak| | 0.8488| 1.091 ---------------+--------+--------+--------- RxCan1[178] Avg| 10.00| 0.1614| 0.014 Peak| | 0.1702| 0.903 ---------------+--------+--------+--------- RxCan1[179] Avg| 10.00| 0.1630| 0.017 Peak| | 0.1663| 1.336 ---------------+--------+--------+--------- RxCan1[180] Avg| 50.00| 0.8137| 0.014 Peak| | 0.8605| 1.566 ---------------+--------+--------+--------- RxCan1[185] Avg| 50.04| 0.8033| 0.013 Peak| | 0.8393| 1.126 ---------------+--------+--------+--------- RxCan1[1a0] Avg| 49.92| 0.7748| 0.013 Peak| | 0.8169| 1.184 ---------------+--------+--------+--------- RxCan1[1e0] Avg| 49.92| 0.7738| 0.014 Peak| | 0.8028| 1.049 ---------------+--------+--------+--------- RxCan1[1e4] Avg| 49.89| 0.9692| 0.018 Peak| | 1.0096| 1.332 ---------------+--------+--------+--------- RxCan1[1f0] Avg| 33.22| 0.5544| 0.014 Peak| | 0.5855| 0.848 ---------------+--------+--------+--------- RxCan1[200] Avg| 49.92| 0.7879| 0.015 Peak| | 0.8345| 1.206 ---------------+--------+--------+--------- RxCan1[202] Avg| 34.28| 1.7075| 0.016 Peak| | 1.7874| 1.218 ---------------+--------+--------+--------- RxCan1[204] Avg| 34.35| 1.5641| 0.013 Peak| | 1.6427| 1.235 ---------------+--------+--------+--------- RxCan1[213] Avg| 49.89| 0.7814| 0.015 Peak| | 0.8232| 0.910 ---------------+--------+--------+--------- RxCan1[214] Avg| 49.92| 0.7736| 0.014 Peak| | 0.8216| 0.800 ---------------+--------+--------+--------- RxCan1[217] Avg| 34.31| 1.6294| 0.014 Peak| | 1.7165| 1.153 ---------------+--------+--------+--------- RxCan1[218] Avg| 49.86| 0.7877| 0.013 Peak| | 0.8290| 1.068 ---------------+--------+--------+--------- RxCan1[230] Avg| 50.00| 0.7596| 0.014 Peak| | 0.7660| 1.021 ---------------+--------+--------+--------- RxCan1[240] Avg| 10.00| 0.1669| 0.013 Peak| | 0.1835| 0.887 ---------------+--------+--------+--------- RxCan1[242] Avg| 24.96| 0.4764| 0.020 Peak| | 0.4963| 1.501 ---------------+--------+--------+--------- RxCan1[24a] Avg| 9.89| 0.1789| 0.015 Peak| | 0.2009| 0.874 ---------------+--------+--------+--------- RxCan1[24b] Avg| 9.89| 0.1702| 0.014 Peak| | 0.1870| 1.195 ---------------+--------+--------+--------- RxCan1[24c] Avg| 9.89| 0.2146| 0.019 Peak| | 0.2187| 1.242 ---------------+--------+--------+--------- RxCan1[25a] Avg| 10.00| 0.1603| 0.013 Peak| | 0.1667| 0.720 ---------------+--------+--------+--------- RxCan1[25b] Avg| 49.94| 0.7918| 0.017 Peak| | 0.8454| 1.666 ---------------+--------+--------+--------- RxCan1[25c] Avg| 34.24| 1.5331| 0.013 Peak| | 1.5997| 1.538 ---------------+--------+--------+--------- RxCan1[260] Avg| 10.00| 0.1626| 0.014 Peak| | 0.1682| 0.718 ---------------+--------+--------+--------- RxCan1[270] Avg| 49.90| 0.8120| 0.014 Peak| | 0.8460| 1.671 ---------------+--------+--------+--------- RxCan1[280] Avg| 49.92| 0.7777| 0.019 Peak| | 0.8447| 1.157 ---------------+--------+--------+--------- RxCan1[2e4] Avg| 19.89| 0.5778| 0.032 Peak| | 0.6648| 2.226 ---------------+--------+--------+--------- RxCan1[2ec] Avg| 10.00| 0.1701| 0.014 Peak| | 0.1755| 0.928 ---------------+--------+--------+--------- RxCan1[2ed] Avg| 10.00| 0.1650| 0.013 Peak| | 0.1747| 0.917 ---------------+--------+--------+--------- RxCan1[2ee] Avg| 9.98| 0.1544| 0.013 Peak| | 0.1588| 1.312 ---------------+--------+--------+--------- RxCan1[312] Avg| 10.00| 0.1648| 0.017 Peak| | 0.1690| 0.922 ---------------+--------+--------+--------- RxCan1[326] Avg| 9.89| 0.1603| 0.015 Peak| | 0.1833| 1.230 ---------------+--------+--------+--------- RxCan1[336] Avg| 1.00| 0.0146| 0.015 Peak| | 0.0150| 0.349 ---------------+--------+--------+--------- RxCan1[352] Avg| 6.66| 0.1223| 0.022 Peak| | 0.1338| 1.015 ---------------+--------+--------+--------- RxCan1[355] Avg| 2.00| 0.0424| 0.019 Peak| | 0.0431| 0.786 ---------------+--------+--------+--------- RxCan1[35e] Avg| 9.96| 0.1570| 0.013 Peak| | 0.1644| 0.579 ---------------+--------+--------+--------- RxCan1[365] Avg| 10.00| 0.1600| 0.014 Peak| | 0.1653| 0.961 ---------------+--------+--------+--------- RxCan1[366] Avg| 10.00| 0.1716| 0.013 Peak| | 0.1890| 0.987 ---------------+--------+--------+--------- RxCan1[367] Avg| 9.93| 0.1793| 0.015 Peak| | 0.1864| 0.984 ---------------+--------+--------+--------- RxCan1[368] Avg| 10.00| 0.1645| 0.014 Peak| | 0.1778| 0.768 ---------------+--------+--------+--------- RxCan1[369] Avg| 10.00| 0.1562| 0.016 Peak| | 0.1606| 0.724 ---------------+--------+--------+--------- RxCan1[380] Avg| 10.00| 0.1619| 0.014 Peak| | 0.1644| 0.605 ---------------+--------+--------+--------- RxCan1[38b] Avg| 25.00| 0.3991| 0.016 Peak| | 0.4280| 1.448 ---------------+--------+--------+--------- RxCan1[3b3] Avg| 10.00| 0.1537| 0.013 Peak| | 0.1610| 0.380 ---------------+--------+--------+--------- RxCan1[400] Avg| 4.00| 0.0626| 0.014 Peak| | 0.0626| 0.251 ---------------+--------+--------+--------- RxCan1[405] Avg| 3.90| 0.1019| 0.028 Peak| | 0.1019| 0.781 ---------------+--------+--------+--------- RxCan1[40a] Avg| 7.90| 0.1256| 0.020 Peak| | 0.1256| 0.991 ---------------+--------+--------+--------- RxCan1[410] Avg| 10.00| 0.1643| 0.016 Peak| | 0.1839| 1.634 ---------------+--------+--------+--------- RxCan1[411] Avg| 10.00| 0.1532| 0.013 Peak| | 0.1645| 0.824 ---------------+--------+--------+--------- RxCan1[416] Avg| 10.00| 0.1516| 0.016 Peak| | 0.1582| 0.807 ---------------+--------+--------+--------- RxCan1[421] Avg| 10.00| 0.1648| 0.013 Peak| | 0.1740| 0.839 ---------------+--------+--------+--------- RxCan1[42d] Avg| 10.00| 0.1548| 0.014 Peak| | 0.1658| 0.741 ---------------+--------+--------+--------- RxCan1[42f] Avg| 10.00| 0.1527| 0.013 Peak| | 0.1578| 0.667 ---------------+--------+--------+--------- RxCan1[430] Avg| 10.00| 0.1730| 0.016 Peak| | 0.1880| 1.209 ---------------+--------+--------+--------- RxCan1[434] Avg| 10.00| 0.1620| 0.021 Peak| | 0.1712| 1.140 ---------------+--------+--------+--------- RxCan1[435] Avg| 6.66| 0.1104| 0.014 Peak| | 0.1121| 1.011 ---------------+--------+--------+--------- RxCan1[43e] Avg| 20.00| 0.3194| 0.013 Peak| | 0.3434| 1.212 ---------------+--------+--------+--------- RxCan1[440] Avg| 1.00| 0.0160| 0.014 Peak| | 0.0175| 0.315 ---------------+--------+--------+--------- RxCan1[465] Avg| 1.00| 0.0172| 0.015 Peak| | 0.0194| 0.404 ---------------+--------+--------+--------- RxCan1[466] Avg| 1.00| 0.0198| 0.015 Peak| | 0.0252| 0.890 ---------------+--------+--------+--------- RxCan1[467] Avg| 1.00| 0.0152| 0.014 Peak| | 0.0160| 0.217 ---------------+--------+--------+--------- RxCan1[472] Avg| 0.70| 0.0533| 0.075 Peak| | 0.0546| 0.990 ---------------+--------+--------+--------- RxCan1[473] Avg| 0.65| 0.0325| 0.051 Peak| | 0.0361| 0.774 ---------------+--------+--------+--------- RxCan1[474] Avg| 1.00| 0.0146| 0.014 Peak| | 0.0151| 0.189 ---------------+--------+--------+--------- RxCan1[475] Avg| 2.00| 0.0332| 0.015 Peak| | 0.0362| 0.513 ---------------+--------+--------+--------- RxCan1[476] Avg| 2.00| 0.0305| 0.014 Peak| | 0.0307| 0.249 ---------------+--------+--------+--------- RxCan1[477] Avg| 2.00| 0.0309| 0.014 Peak| | 0.0311| 0.438 ---------------+--------+--------+--------- RxCan1[595] Avg| 1.00| 0.0151| 0.014 Peak| | 0.0160| 0.230 ---------------+--------+--------+--------- RxCan1[59e] Avg| 1.00| 0.0179| 0.015 Peak| | 0.0209| 0.716 ---------------+--------+--------+--------- RxCan1[5a2] Avg| 1.00| 0.0154| 0.016 Peak| | 0.0184| 0.699 ---------------+--------+--------+--------- RxCan1[5ba] Avg| 1.00| 0.0159| 0.017 Peak| | 0.0174| 0.485 ---------------+--------+--------+--------- RxCan2[010] Avg| 0.00| 0.0000| 0.015 Peak| | 0.0000| 0.146 ---------------+--------+--------+--------- RxCan2[020] Avg| 31.10| 0.5159| 0.015 Peak| | 0.5730| 0.992 ---------------+--------+--------+--------- RxCan2[030] Avg| 20.70| 0.3506| 0.016 Peak| | 0.3956| 1.055 ---------------+--------+--------+--------- RxCan2[03a] Avg| 18.65| 0.3157| 0.014 Peak| | 0.3292| 0.702 ---------------+--------+--------+--------- RxCan2[040] Avg| 18.60| 0.3111| 0.015 Peak| | 0.3474| 0.953 ---------------+--------+--------+--------- RxCan2[060] Avg| 18.60| 0.3182| 0.014 Peak| | 0.3569| 0.694 ---------------+--------+--------+--------- RxCan2[070] Avg| 15.55| 0.4581| 0.017 Peak| | 0.6859| 39.212 ---------------+--------+--------+--------- RxCan2[080] Avg| 15.50| 0.5041| 0.029 Peak| | 0.5414| 1.555 ---------------+--------+--------+--------- RxCan2[083] Avg| 18.70| 0.3083| 0.014 Peak| | 0.3325| 0.557 ---------------+--------+--------+--------- RxCan2[090] Avg| 23.40| 0.3961| 0.014 Peak| | 0.4445| 1.218 ---------------+--------+--------+--------- RxCan2[0a0] Avg| 15.55| 0.2734| 0.014 Peak| | 0.3144| 1.062 ---------------+--------+--------+--------- RxCan2[100] Avg| 15.50| 0.2645| 0.016 Peak| | 0.2875| 1.021 ---------------+--------+--------+--------- RxCan2[108] Avg| 23.40| 0.4231| 0.016 Peak| | 0.4680| 1.297 ---------------+--------+--------+--------- RxCan2[110] Avg| 15.55| 0.2467| 0.014 Peak| | 0.2684| 0.475 ---------------+--------+--------+--------- RxCan2[130] Avg| 13.30| 0.2231| 0.014 Peak| | 0.2447| 0.512 ---------------+--------+--------+--------- RxCan2[150] Avg| 15.50| 0.2533| 0.015 Peak| | 0.2836| 0.823 ---------------+--------+--------+--------- RxCan2[160] Avg| 4.70| 0.0784| 0.014 Peak| | 0.0863| 0.608 ---------------+--------+--------+--------- RxCan2[180] Avg| 15.55| 0.2713| 0.015 Peak| | 0.2841| 0.884 ---------------+--------+--------+--------- RxCan2[190] Avg| 15.50| 0.2596| 0.014 Peak| | 0.2825| 0.743 ---------------+--------+--------+--------- RxCan2[1a0] Avg| 0.95| 0.0164| 0.015 Peak| | 0.0164| 0.346 ---------------+--------+--------+--------- RxCan2[1a4] Avg| 18.65| 0.3232| 0.015 Peak| | 0.3515| 0.989 ---------------+--------+--------+--------- RxCan2[1a8] Avg| 11.60| 0.1911| 0.016 Peak| | 0.2012| 0.757 ---------------+--------+--------+--------- RxCan2[1b0] Avg| 9.35| 0.1558| 0.016 Peak| | 0.1641| 0.795 ---------------+--------+--------+--------- RxCan2[1b4] Avg| 9.35| 0.1543| 0.015 Peak| | 0.1617| 1.217 ---------------+--------+--------+--------- RxCan2[1b8] Avg| 11.65| 0.2003| 0.014 Peak| | 0.2236| 1.549 ---------------+--------+--------+--------- RxCan2[1c0] Avg| 9.40| 0.1532| 0.016 Peak| | 0.1673| 0.955 ---------------+--------+--------+--------- RxCan2[1e0] Avg| 9.30| 0.1582| 0.015 Peak| | 0.1708| 0.661 ---------------+--------+--------+--------- RxCan2[215] Avg| 7.80| 0.1409| 0.016 Peak| | 0.1531| 0.660 ---------------+--------+--------+--------- RxCan2[217] Avg| 7.80| 0.1239| 0.014 Peak| | 0.1333| 0.520 ---------------+--------+--------+--------- RxCan2[220] Avg| 6.20| 0.1041| 0.015 Peak| | 0.1094| 0.652 ---------------+--------+--------+--------- RxCan2[225] Avg| 23.40| 0.4648| 0.015 Peak| | 0.4696| 4.288 ---------------+--------+--------+--------- RxCan2[230] Avg| 6.20| 0.3120| 0.048 Peak| | 0.3377| 1.065 ---------------+--------+--------+--------- RxCan2[240] Avg| 7.70| 0.1248| 0.014 Peak| | 0.1364| 0.635 ---------------+--------+--------+--------- RxCan2[241] Avg| 18.60| 0.3258| 0.014 Peak| | 0.3343| 1.288 ---------------+--------+--------+--------- RxCan2[250] Avg| 4.70| 0.0761| 0.014 Peak| | 0.0809| 0.322 ---------------+--------+--------+--------- RxCan2[255] Avg| 11.75| 0.2058| 0.014 Peak| | 0.2283| 0.937 ---------------+--------+--------+--------- RxCan2[265] Avg| 11.65| 0.1964| 0.014 Peak| | 0.2068| 0.965 ---------------+--------+--------+--------- RxCan2[270] Avg| 4.70| 0.0808| 0.016 Peak| | 0.0949| 0.729 ---------------+--------+--------+--------- RxCan2[290] Avg| 3.15| 0.0498| 0.015 Peak| | 0.0504| 0.449 ---------------+--------+--------+--------- RxCan2[295] Avg| 6.25| 0.1019| 0.014 Peak| | 0.1094| 0.859 ---------------+--------+--------+--------- RxCan2[2a0] Avg| 3.15| 0.0550| 0.014 Peak| | 0.0551| 0.779 ---------------+--------+--------+--------- RxCan2[2a7] Avg| 11.65| 0.1929| 0.014 Peak| | 0.2080| 0.775 ---------------+--------+--------+--------- RxCan2[2b0] Avg| 3.00| 0.0497| 0.015 Peak| | 0.0562| 0.528 ---------------+--------+--------+--------- RxCan2[2c0] Avg| 3.10| 0.0534| 0.016 Peak| | 0.0592| 0.501 ---------------+--------+--------+--------- RxCan2[2e0] Avg| 1.55| 0.0247| 0.014 Peak| | 0.0289| 0.319 ---------------+--------+--------+--------- RxCan2[2f0] Avg| 1.55| 0.0244| 0.014 Peak| | 0.0273| 0.192 ---------------+--------+--------+--------- RxCan2[2f5] Avg| 11.65| 0.2078| 0.016 Peak| | 0.2333| 0.879 ---------------+--------+--------+--------- RxCan2[300] Avg| 1.60| 0.0266| 0.018 Peak| | 0.0278| 0.724 ---------------+--------+--------+--------- RxCan2[310] Avg| 1.55| 0.0276| 0.016 Peak| | 0.0285| 0.759 ---------------+--------+--------+--------- RxCan2[320] Avg| 1.60| 0.0240| 0.014 Peak| | 0.0258| 0.179 ---------------+--------+--------+--------- RxCan2[326] Avg| 9.30| 0.1550| 0.014 Peak| | 0.1582| 0.850 ---------------+--------+--------+--------- RxCan2[330] Avg| 29.95| 0.5311| 0.015 Peak| | 0.5565| 4.522 ---------------+--------+--------+--------- RxCan2[340] Avg| 7.75| 0.1693| 0.024 Peak| | 0.1868| 1.148 ---------------+--------+--------+--------- RxCan2[345] Avg| 1.60| 0.0292| 0.016 Peak| | 0.0316| 0.471 ---------------+--------+--------+--------- RxCan2[350] Avg| 0.00| 0.0000| 0.019 Peak| | 0.0000| 0.188 ---------------+--------+--------+--------- RxCan2[35e] Avg| 4.70| 0.0851| 0.019 Peak| | 0.0911| 1.023 ---------------+--------+--------+--------- RxCan2[360] Avg| 1.60| 0.0258| 0.015 Peak| | 0.0284| 0.306 ---------------+--------+--------+--------- RxCan2[361] Avg| 7.75| 0.1341| 0.017 Peak| | 0.1487| 0.761 ---------------+--------+--------+--------- RxCan2[363] Avg| 1.20| 0.0203| 0.016 Peak| | 0.0220| 0.421 ---------------+--------+--------+--------- RxCan2[370] Avg| 0.85| 0.0140| 0.016 Peak| | 0.0162| 0.354 ---------------+--------+--------+--------- RxCan2[381] Avg| 3.15| 0.0512| 0.016 Peak| | 0.0546| 0.416 ---------------+--------+--------+--------- RxCan2[3a0] Avg| 15.60| 0.2548| 0.015 Peak| | 0.2890| 0.976 ---------------+--------+--------+--------- RxCan2[3d0] Avg| 9.35| 0.1553| 0.019 Peak| | 0.1612| 1.115 ---------------+--------+--------+--------- RxCan2[3d5] Avg| 5.15| 0.0836| 0.016 Peak| | 0.0867| 0.479 ---------------+--------+--------+--------- RxCan2[3e0] Avg| 0.00| 0.0000| 0.014 Peak| | 0.0000| 0.142 ---------------+--------+--------+--------- RxCan2[400] Avg| 3.55| 0.0613| 0.017 Peak| | 0.0695| 0.501 ---------------+--------+--------+--------- RxCan2[405] Avg| 3.50| 0.0584| 0.018 Peak| | 0.0626| 0.686 ---------------+--------+--------+--------- RxCan2[40a] Avg| 7.10| 0.1278| 0.017 Peak| | 0.1389| 1.244 ---------------+--------+--------+--------- RxCan2[415] Avg| 1.60| 0.0258| 0.014 Peak| | 0.0287| 0.266 ---------------+--------+--------+--------- RxCan2[435] Avg| 0.85| 0.0165| 0.019 Peak| | 0.0167| 0.367 ---------------+--------+--------+--------- RxCan2[440] Avg| 0.85| 0.0128| 0.019 Peak| | 0.0141| 0.885 ---------------+--------+--------+--------- RxCan2[465] Avg| 0.95| 0.0177| 0.016 Peak| | 0.0195| 0.721 ---------------+--------+--------+--------- RxCan2[466] Avg| 0.95| 0.0147| 0.014 Peak| | 0.0160| 0.184 ---------------+--------+--------+--------- RxCan2[467] Avg| 0.95| 0.0172| 0.017 Peak| | 0.0188| 0.391 ---------------+--------+--------+--------- RxCan2[501] Avg| 1.45| 0.0273| 0.016 Peak| | 0.0327| 0.996 ---------------+--------+--------+--------- RxCan2[503] Avg| 1.45| 0.0288| 0.020 Peak| | 0.0338| 0.970 ---------------+--------+--------+--------- RxCan2[504] Avg| 1.40| 0.0241| 0.015 Peak| | 0.0263| 0.609 ---------------+--------+--------+--------- RxCan2[505] Avg| 1.40| 0.0255| 0.015 Peak| | 0.0296| 0.866 ---------------+--------+--------+--------- RxCan2[508] Avg| 1.35| 0.0237| 0.017 Peak| | 0.0237| 0.384 ---------------+--------+--------+--------- RxCan2[511] Avg| 1.35| 0.0226| 0.016 Peak| | 0.0228| 0.426 ---------------+--------+--------+--------- RxCan2[51e] Avg| 1.40| 0.0221| 0.014 Peak| | 0.0245| 0.211 ---------------+--------+--------+--------- RxCan2[581] Avg| 0.80| 0.0189| 0.019 Peak| | 0.0290| 1.217 ---------------+--------+--------+--------- RxCan2[606] Avg| 0.00| 0.0000| 0.014 Peak| | 0.0000| 0.142 ---------------+--------+--------+--------- RxCan2[657] Avg| 0.00| 0.0000| 0.014 Peak| | 0.0000| 0.137 ---------------+--------+--------+--------- Cmd:State Avg| 0.00| 0.0000| 0.002 Peak| | 0.0000| 0.024 ===============+========+========+========= Total Avg| 2748.42| 58.3344| 28.718
@Simon: it would be an option to try commenting out the overflow counting, to see if that's causing the issue.
I have commented out the line with the Atomic_Increment statement. Now I no longer receive any messages with “RX Task Queue Overflow Run” Here is the output of poller times status:
OVMS# poll time status Poller timing is: on Type | count | Utlztn | Time | per s | [%] | [ms] ---------------+--------+--------+--------- Poll:PRI Avg| 1.00| 0.0045| 0.004 Peak| | 0.0046| 0.064 ---------------+--------+--------+--------- RxCan1[010] Avg| 34.26| 2.2574| 0.021 Peak| | 2.2574| 4.609 ---------------+--------+--------+--------- RxCan1[030] Avg| 34.26| 2.3820| 0.021 Peak| | 2.3820| 1.135 ---------------+--------+--------+--------- RxCan1[041] Avg| 49.89| 1.2059| 0.021 Peak| | 1.2295| 5.331 ---------------+--------+--------+--------- RxCan1[049] Avg| 49.96| 1.2400| 0.030 Peak| | 1.2699| 1.402 ---------------+--------+--------+--------- RxCan1[04c] Avg| 49.92| 1.1752| 0.021 Peak| | 1.2072| 4.502 ---------------+--------+--------+--------- RxCan1[04d] Avg| 34.31| 2.4433| 0.022 Peak| | 2.4773| 1.368 ---------------+--------+--------+--------- RxCan1[076] Avg| 49.96| 1.2071| 0.024 Peak| | 1.2554| 2.007 ---------------+--------+--------+--------- RxCan1[077] Avg| 49.96| 1.2012| 0.022 Peak| | 1.2492| 1.955 ---------------+--------+--------+--------- RxCan1[07a] Avg| 34.35| 2.9251| 0.030 Peak| | 3.1103| 1.829 ---------------+--------+--------+--------- RxCan1[07d] Avg| 49.96| 1.1954| 0.022 Peak| | 1.2282| 1.074 ---------------+--------+--------+--------- RxCan1[0c8] Avg| 49.89| 1.2491| 0.021 Peak| | 1.3169| 1.181 ---------------+--------+--------+--------- RxCan1[11a] Avg| 34.39| 2.4423| 0.024 Peak| | 2.5693| 1.491 ---------------+--------+--------+--------- RxCan1[130] Avg| 49.95| 1.1312| 0.020 Peak| | 1.1684| 1.218 ---------------+--------+--------+--------- RxCan1[139] Avg| 49.92| 1.1547| 0.021 Peak| | 1.1778| 1.199 ---------------+--------+--------+--------- RxCan1[156] Avg| 9.96| 0.2391| 0.023 Peak| | 0.2591| 1.943 ---------------+--------+--------+--------- RxCan1[160] Avg| 49.96| 1.1657| 0.031 Peak| | 1.2017| 2.158 ---------------+--------+--------+--------- RxCan1[165] Avg| 49.96| 1.1257| 0.021 Peak| | 1.1652| 1.471 ---------------+--------+--------+--------- RxCan1[167] Avg| 34.31| 2.2871| 0.021 Peak| | 2.3374| 1.776 ---------------+--------+--------+--------- RxCan1[171] Avg| 49.96| 1.1879| 0.023 Peak| | 1.2268| 1.166 ---------------+--------+--------+--------- RxCan1[178] Avg| 10.00| 0.2371| 0.029 Peak| | 0.2459| 1.516 ---------------+--------+--------+--------- RxCan1[179] Avg| 10.00| 0.2196| 0.021 Peak| | 0.2260| 0.758 ---------------+--------+--------+--------- RxCan1[180] Avg| 49.96| 1.1703| 0.022 Peak| | 1.2103| 1.481 ---------------+--------+--------+--------- RxCan1[185] Avg| 49.95| 1.1127| 0.020 Peak| | 1.1636| 1.292 ---------------+--------+--------+--------- RxCan1[1a0] Avg| 49.96| 1.1009| 0.020 Peak| | 1.1468| 1.060 ---------------+--------+--------+--------- RxCan1[1e0] Avg| 49.96| 1.1744| 0.021 Peak| | 1.2027| 1.240 ---------------+--------+--------+--------- RxCan1[1e4] Avg| 49.96| 1.3733| 0.032 Peak| | 1.4085| 1.523 ---------------+--------+--------+--------- RxCan1[1f0] Avg| 33.30| 0.7625| 0.023 Peak| | 0.8004| 3.349 ---------------+--------+--------+--------- RxCan1[200] Avg| 49.92| 1.1462| 0.021 Peak| | 1.1809| 1.254 ---------------+--------+--------+--------- RxCan1[202] Avg| 34.39| 2.4034| 0.028 Peak| | 2.5611| 1.472 ---------------+--------+--------+--------- RxCan1[204] Avg| 34.30| 2.2541| 0.022 Peak| | 2.2924| 2.015 ---------------+--------+--------+--------- RxCan1[213] Avg| 49.96| 1.1599| 0.027 Peak| | 1.1794| 1.714 ---------------+--------+--------+--------- RxCan1[214] Avg| 49.96| 1.1537| 0.022 Peak| | 1.1941| 1.439 ---------------+--------+--------+--------- RxCan1[217] Avg| 34.39| 2.2490| 0.020 Peak| | 2.2856| 3.766 ---------------+--------+--------+--------- RxCan1[218] Avg| 49.96| 1.1291| 0.021 Peak| | 1.1646| 1.547 ---------------+--------+--------+--------- RxCan1[230] Avg| 49.96| 1.1272| 0.020 Peak| | 1.2237| 1.295 ---------------+--------+--------+--------- RxCan1[240] Avg| 10.00| 0.2191| 0.021 Peak| | 0.2226| 1.067 ---------------+--------+--------+--------- RxCan1[242] Avg| 24.96| 0.6911| 0.024 Peak| | 0.7161| 1.180 ---------------+--------+--------+--------- RxCan1[24a] Avg| 9.96| 0.2345| 0.024 Peak| | 0.2535| 0.779 ---------------+--------+--------+--------- RxCan1[24b] Avg| 9.96| 0.2433| 0.023 Peak| | 0.2697| 2.085 ---------------+--------+--------+--------- RxCan1[24c] Avg| 9.96| 0.3103| 0.029 Peak| | 0.3203| 0.809 ---------------+--------+--------+--------- RxCan1[25a] Avg| 10.00| 0.2346| 0.022 Peak| | 0.2405| 1.223 ---------------+--------+--------+--------- RxCan1[25b] Avg| 49.89| 1.2121| 0.020 Peak| | 1.3659| 19.523 ---------------+--------+--------+--------- RxCan1[25c] Avg| 34.31| 2.4193| 0.019 Peak| | 2.8022| 58.153 ---------------+--------+--------+--------- RxCan1[260] Avg| 9.93| 0.2149| 0.024 Peak| | 0.2174| 1.096 ---------------+--------+--------+--------- RxCan1[270] Avg| 49.96| 1.2042| 0.026 Peak| | 1.2755| 20.612 ---------------+--------+--------+--------- RxCan1[280] Avg| 49.96| 1.0922| 0.020 Peak| | 1.1312| 1.266 ---------------+--------+--------+--------- RxCan1[2e4] Avg| 19.96| 0.6942| 0.044 Peak| | 0.8604| 1.533 ---------------+--------+--------+--------- RxCan1[2ec] Avg| 10.00| 0.3727| 0.025 Peak| | 0.5154| 28.819 ---------------+--------+--------+--------- RxCan1[2ed] Avg| 10.00| 0.2298| 0.023 Peak| | 0.2378| 1.345 ---------------+--------+--------+--------- RxCan1[2ee] Avg| 9.96| 0.2172| 0.019 Peak| | 0.2210| 1.058 ---------------+--------+--------+--------- RxCan1[312] Avg| 10.00| 0.2206| 0.020 Peak| | 0.2396| 1.060 ---------------+--------+--------+--------- RxCan1[326] Avg| 9.96| 0.2099| 0.020 Peak| | 0.2158| 0.507 ---------------+--------+--------+--------- RxCan1[336] Avg| 1.00| 0.0212| 0.020 Peak| | 0.0233| 0.315 ---------------+--------+--------+--------- RxCan1[352] Avg| 6.64| 0.1675| 0.024 Peak| | 0.1818| 1.048 ---------------+--------+--------+--------- RxCan1[355] Avg| 2.00| 0.0540| 0.027 Peak| | 0.0619| 1.209 ---------------+--------+--------+--------- RxCan1[35e] Avg| 9.98| 0.2221| 0.021 Peak| | 0.2284| 1.186 ---------------+--------+--------+--------- RxCan1[365] Avg| 10.00| 0.2282| 0.023 Peak| | 0.2335| 0.769 ---------------+--------+--------+--------- RxCan1[366] Avg| 10.00| 0.3163| 0.022 Peak| | 0.6330| 23.587 ---------------+--------+--------+--------- RxCan1[367] Avg| 10.00| 0.2417| 0.021 Peak| | 0.2568| 1.417 ---------------+--------+--------+--------- RxCan1[368] Avg| 9.96| 0.2187| 0.019 Peak| | 0.2250| 1.135 ---------------+--------+--------+--------- RxCan1[369] Avg| 9.99| 0.2277| 0.021 Peak| | 0.2334| 0.667 ---------------+--------+--------+--------- RxCan1[380] Avg| 9.96| 0.2133| 0.020 Peak| | 0.2161| 0.560 ---------------+--------+--------+--------- RxCan1[38b] Avg| 24.92| 0.5622| 0.022 Peak| | 0.5716| 1.618 ---------------+--------+--------+--------- RxCan1[3b3] Avg| 10.00| 0.2132| 0.023 Peak| | 0.2194| 1.106 ---------------+--------+--------+--------- RxCan1[400] Avg| 4.00| 0.0885| 0.019 Peak| | 0.0885| 0.570 ---------------+--------+--------+--------- RxCan1[405] Avg| 3.70| 0.1414| 0.036 Peak| | 0.1414| 0.710 ---------------+--------+--------+--------- RxCan1[40a] Avg| 8.00| 0.1887| 0.021 Peak| | 0.1887| 1.027 ---------------+--------+--------+--------- RxCan1[410] Avg| 10.00| 0.2141| 0.023 Peak| | 0.2188| 0.984 ---------------+--------+--------+--------- RxCan1[411] Avg| 10.00| 0.2325| 0.023 Peak| | 0.2447| 0.660 ---------------+--------+--------+--------- RxCan1[416] Avg| 10.00| 0.2326| 0.022 Peak| | 0.2389| 0.774 ---------------+--------+--------+--------- RxCan1[421] Avg| 10.00| 0.2245| 0.021 Peak| | 0.2271| 1.160 ---------------+--------+--------+--------- RxCan1[42d] Avg| 10.00| 0.2315| 0.021 Peak| | 0.2411| 0.677 ---------------+--------+--------+--------- RxCan1[42f] Avg| 10.00| 0.2480| 0.020 Peak| | 0.2975| 8.093 ---------------+--------+--------+--------- RxCan1[430] Avg| 10.00| 0.2203| 0.019 Peak| | 0.2302| 0.847 ---------------+--------+--------+--------- RxCan1[434] Avg| 10.00| 0.2331| 0.019 Peak| | 0.2620| 1.150 ---------------+--------+--------+--------- RxCan1[435] Avg| 6.68| 0.1445| 0.020 Peak| | 0.1486| 1.063 ---------------+--------+--------+--------- RxCan1[43e] Avg| 20.00| 0.4515| 0.021 Peak| | 0.4632| 1.013 ---------------+--------+--------+--------- RxCan1[440] Avg| 1.00| 0.0210| 0.019 Peak| | 0.0218| 0.294 ---------------+--------+--------+--------- RxCan1[465] Avg| 0.95| 0.0214| 0.023
I'm happy to try some new code on my Leaf. Which code should I use? The current master, or a different branch? It wasn't clear to me from the thread below. Chris On 2025-01-19 19:47, Derek Caudwell via OvmsDev wrote:
I can't recall testing a later version but I think Chris can confirm he was on a later version when his Leaf had a similar problem.
The Leaf is now my wife's daily drive so I won't be able to take a look at making the suggested changes for a couple of weeks at least.
On Mon, 20 Jan 2025, 8:31 am Michael Balzer via OvmsDev, <ovmsdev@lists.openvehicles.com> wrote: Derek,
Am 03.05.24 um 12:53 schrieb Derek Caudwell via OvmsDev: When running firmware 3.3.004-74-gbd4e7196 on my Nissan Leaf I suspect (but can't be 100% sure as it's only been 24h without fault) the new poller caused the car to throw the attached faults from overloading the can bus whilst driving. The fault was sufficient to send the car into limp mode and could not be driven until cleared with LeafSpy. Build 3.3.004-74 (released 2024-04-30) did not yet include the poller tracing control, i.e. it did lots of logging for frames, significantly affecting overall performance.
Poller tracing control was introduced in https://github.com/openvehicles/Open-Vehicle-Monitoring-System-3/commit/7e40... on May 12.
That commit was first included in build 3.3.004-103-g11fddbf6 released 2024-05-25. Do you remember testing that build or a later one?
But as I still don't understand how a software queue overflow could cause a bus crash, I've also checked the 500 kbit timing for the MCP2515 and found that may have the same issue as the 125 kbit timing:
Our timing is: case CAN_SPEED_500KBPS: cnf1=0x00; cnf2=0xf0; cnf3=0x86; = PROP=1, PS1=7, PS2=7, SJW=1, Sample 3x @56.3%
Remember, the SAE/CiA recommendation is SJW=2, Sample 1x @87.5%. That would translate to: PROP=5, PS1=8, PS2=2, SJW=2, Sample 1x @87.5% = cnf1=0x40; cnf2=0xbc; cnf3=0x81;
I also checked the Arduino MCP_CAN lib, and that uses: cnf1=0x40; cnf2=0xe5; cnf3=0x83; = PROP=6, PS1=5, PS2=4, SJW=2, Sample 3x @75%
So our timing for 500 kbit/s on the MCP buses also isn't as recommended.
Derek, could you test the SAE/CiA recommendation and the MCP_CAN config as shown? Or anyone else with a live can2/can3 bus at 500 kbit?
If these work, the question is which is the more general setup we should adopt. Apparently the MCP_CAN lib also does not follow the CiA recommendation, I wonder if the MCP_CAN config is a compromise for compatibility.
Regards, Michael
Chris, there is no prepared branch for these changes, as we still try to determine the best (most compatible) configuration. You need to apply the suggested changes manually to the current master. Regards, Michael Am 20.01.25 um 19:56 schrieb Chris Box via OvmsDev:
I'm happy to try some new code on my Leaf. Which code should I use? The current master, or a different branch? It wasn't clear to me from the thread below.
Chris
On 2025-01-19 19:47, Derek Caudwell via OvmsDev wrote:
I can't recall testing a later version but I think Chris can confirm he was on a later version when his Leaf had a similar problem. The Leaf is now my wife's daily drive so I won't be able to take a look at making the suggested changes for a couple of weeks at least. On Mon, 20 Jan 2025, 8:31 am Michael Balzer via OvmsDev, <ovmsdev@lists.openvehicles.com> wrote:
Derek,
Am 03.05.24 um 12:53 schrieb Derek Caudwell via OvmsDev:
When running *firmware **3.3.004-74-gbd4e7196* on my Nissan Leaf I suspect (but can't be 100% sure as it's only been 24h without fault) the new poller caused the car to throw the attached faults from overloading the can bus whilst driving. The fault was sufficient to send the car into limp mode and could not be driven until cleared with LeafSpy.
Build 3.3.004-74 (released 2024-04-30) did not yet include the poller tracing control, i.e. it did lots of logging for frames, significantly affecting overall performance.
Poller tracing control was introduced in https://github.com/openvehicles/Open-Vehicle-Monitoring-System-3/commit/7e40... on May 12.
That commit was first included in build 3.3.004-103-g11fddbf6 released 2024-05-25. Do you remember testing that build or a later one?
But as I still don't understand how a software queue overflow could cause a bus crash, I've also checked the 500 kbit timing for the MCP2515 and found that may have the same issue as the 125 kbit timing:
Our timing is: case CAN_SPEED_500KBPS: cnf1=0x00; cnf2=0xf0; cnf3=0x86; = PROP=1, PS1=7, PS2=7, SJW=1, Sample 3x @56.3%
Remember, the SAE/CiA recommendation is SJW=2, Sample 1x @87.5%. That would translate to: PROP=5, PS1=8, PS2=2, SJW=2, Sample 1x @87.5% = cnf1=0x40; cnf2=0xbc; cnf3=0x81;
I also checked the Arduino MCP_CAN lib, and that uses: cnf1=0x40; cnf2=0xe5; cnf3=0x83; = PROP=6, PS1=5, PS2=4, SJW=2, Sample 3x @75%
So our timing for 500 kbit/s on the MCP buses also isn't as recommended.
Derek, could you test the SAE/CiA recommendation and the MCP_CAN config as shown? Or anyone else with a live can2/can3 bus at 500 kbit?
If these work, the question is which is the more general setup we should adopt. Apparently the MCP_CAN lib also does not follow the CiA recommendation, I wonder if the MCP_CAN config is a compromise for compatibility.
Regards, Michael
_______________________________________________ OvmsDev mailing list OvmsDev@lists.openvehicles.com http://lists.openvehicles.com/mailman/listinfo/ovmsdev
-- Michael Balzer * Am Rahmen 5 * D-58313 Herdecke Fon 02330 9104094 * Handy 0176 20698926
Hi Chris Here are the required changes, as I understand them, to be compiled into a new firmware from this thread: https://github.com/openvehicles/Open-Vehicle-Monitoring-System-3/pull/1102/f... Cheers Derek On Tue, 21 Jan 2025 at 10:48, Michael Balzer via OvmsDev < ovmsdev@lists.openvehicles.com> wrote:
Chris,
there is no prepared branch for these changes, as we still try to determine the best (most compatible) configuration.
You need to apply the suggested changes manually to the current master.
Regards, Michael
Am 20.01.25 um 19:56 schrieb Chris Box via OvmsDev:
I'm happy to try some new code on my Leaf. Which code should I use? The current master, or a different branch? It wasn't clear to me from the thread below.
Chris
On 2025-01-19 19:47, Derek Caudwell via OvmsDev wrote:
I can't recall testing a later version but I think Chris can confirm he was on a later version when his Leaf had a similar problem.
The Leaf is now my wife's daily drive so I won't be able to take a look at making the suggested changes for a couple of weeks at least.
On Mon, 20 Jan 2025, 8:31 am Michael Balzer via OvmsDev, < ovmsdev@lists.openvehicles.com> wrote:
Derek,
Am 03.05.24 um 12:53 schrieb Derek Caudwell via OvmsDev:
When running *firmware **3.3.004-74-gbd4e7196* on my Nissan Leaf I suspect (but can't be 100% sure as it's only been 24h without fault) the new poller caused the car to throw the attached faults from overloading the can bus whilst driving. The fault was sufficient to send the car into limp mode and could not be driven until cleared with LeafSpy.
Build 3.3.004-74 (released 2024-04-30) did not yet include the poller tracing control, i.e. it did lots of logging for frames, significantly affecting overall performance.
Poller tracing control was introduced in https://github.com/openvehicles/Open-Vehicle-Monitoring-System-3/commit/7e40... on May 12.
That commit was first included in build 3.3.004-103-g11fddbf6 released 2024-05-25. Do you remember testing that build or a later one?
But as I still don't understand how a software queue overflow could cause a bus crash, I've also checked the 500 kbit timing for the MCP2515 and found that may have the same issue as the 125 kbit timing:
Our timing is: case CAN_SPEED_500KBPS: cnf1=0x00; cnf2=0xf0; cnf3=0x86; = PROP=1, PS1=7, PS2=7, SJW=1, Sample 3x @56.3%
Remember, the SAE/CiA recommendation is SJW=2, Sample 1x @87.5%. That would translate to: PROP=5, PS1=8, PS2=2, SJW=2, Sample 1x @87.5% = cnf1=0x40; cnf2=0xbc; cnf3=0x81;
I also checked the Arduino MCP_CAN lib, and that uses: cnf1=0x40; cnf2=0xe5; cnf3=0x83; = PROP=6, PS1=5, PS2=4, SJW=2, Sample 3x @75%
So our timing for 500 kbit/s on the MCP buses also isn't as recommended.
Derek, could you test the SAE/CiA recommendation and the MCP_CAN config as shown? Or anyone else with a live can2/can3 bus at 500 kbit?
If these work, the question is which is the more general setup we should adopt. Apparently the MCP_CAN lib also does not follow the CiA recommendation, I wonder if the MCP_CAN config is a compromise for compatibility.
Regards, Michael
_______________________________________________ OvmsDev mailing listOvmsDev@lists.openvehicles.comhttp://lists.openvehicles.com/mailman/listinfo/ovmsdev
-- Michael Balzer * Am Rahmen 5 * D-58313 Herdecke Fon 02330 9104094 * Handy 0176 20698926
_______________________________________________ OvmsDev mailing list OvmsDev@lists.openvehicles.com http://lists.openvehicles.com/mailman/listinfo/ovmsdev
Thank you Derek and Michael. I'm running this firmware from today, and have driven the car 8 miles so far without issue. Happy to run any useful diagnostic commands. In case it helps, the poller reports this. OVMS# poller times status Poller timing is: off Type | count | Utlztn | Time | per s | [‰] | [ms] ---------------+--------+--------+--------- Poll:PRI Avg| 0.99| 0.632| 0.065 Peak| | 0.733| 1.325 ===============+========+========+========= Total Avg| 0.99| 0.632| 0.653 Chris On 2025-01-21 00:41, Derek Caudwell via OvmsDev wrote:
Hi Chris
Here are the required changes, as I understand them, to be compiled into a new firmware from this thread: https://github.com/openvehicles/Open-Vehicle-Monitoring-System-3/pull/1102/f...
Cheers Derek
On Tue, 21 Jan 2025 at 10:48, Michael Balzer via OvmsDev <ovmsdev@lists.openvehicles.com> wrote: Chris,
there is no prepared branch for these changes, as we still try to determine the best (most compatible) configuration.
You need to apply the suggested changes manually to the current master.
Regards, Michael
Am 20.01.25 um 19:56 schrieb Chris Box via OvmsDev:
I'm happy to try some new code on my Leaf. Which code should I use? The current master, or a different branch? It wasn't clear to me from the thread below.
Chris
On 2025-01-19 19:47, Derek Caudwell via OvmsDev wrote:
I can't recall testing a later version but I think Chris can confirm he was on a later version when his Leaf had a similar problem.
The Leaf is now my wife's daily drive so I won't be able to take a look at making the suggested changes for a couple of weeks at least.
On Mon, 20 Jan 2025, 8:31 am Michael Balzer via OvmsDev, <ovmsdev@lists.openvehicles.com> wrote: Derek,
Am 03.05.24 um 12:53 schrieb Derek Caudwell via OvmsDev: When running firmware 3.3.004-74-gbd4e7196 on my Nissan Leaf I suspect (but can't be 100% sure as it's only been 24h without fault) the new poller caused the car to throw the attached faults from overloading the can bus whilst driving. The fault was sufficient to send the car into limp mode and could not be driven until cleared with LeafSpy. Build 3.3.004-74 (released 2024-04-30) did not yet include the poller tracing control, i.e. it did lots of logging for frames, significantly affecting overall performance.
Poller tracing control was introduced in https://github.com/openvehicles/Open-Vehicle-Monitoring-System-3/commit/7e40... on May 12.
That commit was first included in build 3.3.004-103-g11fddbf6 released 2024-05-25. Do you remember testing that build or a later one?
But as I still don't understand how a software queue overflow could cause a bus crash, I've also checked the 500 kbit timing for the MCP2515 and found that may have the same issue as the 125 kbit timing:
Our timing is: case CAN_SPEED_500KBPS: cnf1=0x00; cnf2=0xf0; cnf3=0x86; = PROP=1, PS1=7, PS2=7, SJW=1, Sample 3x @56.3%
Remember, the SAE/CiA recommendation is SJW=2, Sample 1x @87.5%. That would translate to: PROP=5, PS1=8, PS2=2, SJW=2, Sample 1x @87.5% = cnf1=0x40; cnf2=0xbc; cnf3=0x81;
I also checked the Arduino MCP_CAN lib, and that uses: cnf1=0x40; cnf2=0xe5; cnf3=0x83; = PROP=6, PS1=5, PS2=4, SJW=2, Sample 3x @75%
So our timing for 500 kbit/s on the MCP buses also isn't as recommended.
Derek, could you test the SAE/CiA recommendation and the MCP_CAN config as shown? Or anyone else with a live can2/can3 bus at 500 kbit?
If these work, the question is which is the more general setup we should adopt. Apparently the MCP_CAN lib also does not follow the CiA recommendation, I wonder if the MCP_CAN config is a compromise for compatibility.
Regards, Michael
_______________________________________________ OvmsDev mailing list OvmsDev@lists.openvehicles.com http://lists.openvehicles.com/mailman/listinfo/ovmsdev -- Michael Balzer * Am Rahmen 5 * D-58313 Herdecke Fon 02330 9104094 * Handy 0176 20698926 _______________________________________________ OvmsDev mailing list OvmsDev@lists.openvehicles.com http://lists.openvehicles.com/mailman/listinfo/ovmsdev _______________________________________________ OvmsDev mailing list OvmsDev@lists.openvehicles.com http://lists.openvehicles.com/mailman/listinfo/ovmsdev
Chris, typically "can can1 status" & "can can2 status" will give the statistics of the buses, and "poller times on" will enable poller timing statistics to be then shown by "poller times status". The Leaf uses can2 to query these values: // VIN [19] // QC [2] // L0/L1/L2 [2] …but only when the car is on, but not in drive mode. So you should check if you get these values. It also uses can2 for TCU commands, if the model year is >= 2016. So you should try commands and see if they work correctly. Please also check the log for changes in can error occurence & frequency. Regards, Michael Am 22.01.25 um 14:58 schrieb Chris Box via OvmsDev:
Thank you Derek and Michael.
I'm running this firmware from today, and have driven the car 8 miles so far without issue.
Happy to run any useful diagnostic commands. In case it helps, the poller reports this.
|OVMS# poller times status | |Poller timing is: off | |Type | count | Utlztn | Time | | | per s | [‰] | [ms] | |---------------+--------+--------+--------- | |Poll:PRI Avg| 0.99| 0.632| 0.065 | | Peak| | 0.733| 1.325 | |===============+========+========+========= | | Total Avg| 0.99| 0.632| 0.653 |
Chris
On 2025-01-21 00:41, Derek Caudwell via OvmsDev wrote:
Hi Chris Here are the required changes, as I understand them, to be compiled into a new firmware from this thread: https://github.com/openvehicles/Open-Vehicle-Monitoring-System-3/pull/1102/f... Cheers Derek
On Tue, 21 Jan 2025 at 10:48, Michael Balzer via OvmsDev <ovmsdev@lists.openvehicles.com> wrote:
Chris,
there is no prepared branch for these changes, as we still try to determine the best (most compatible) configuration.
You need to apply the suggested changes manually to the current master.
Regards, Michael
Am 20.01.25 um 19:56 schrieb Chris Box via OvmsDev:
I'm happy to try some new code on my Leaf. Which code should I use? The current master, or a different branch? It wasn't clear to me from the thread below.
Chris
On 2025-01-19 19:47, Derek Caudwell via OvmsDev wrote:
I can't recall testing a later version but I think Chris can confirm he was on a later version when his Leaf had a similar problem. The Leaf is now my wife's daily drive so I won't be able to take a look at making the suggested changes for a couple of weeks at least. On Mon, 20 Jan 2025, 8:31 am Michael Balzer via OvmsDev, <ovmsdev@lists.openvehicles.com> wrote:
Derek,
Am 03.05.24 um 12:53 schrieb Derek Caudwell via OvmsDev:
When running *firmware **3.3.004-74-gbd4e7196* on my Nissan Leaf I suspect (but can't be 100% sure as it's only been 24h without fault) the new poller caused the car to throw the attached faults from overloading the can bus whilst driving. The fault was sufficient to send the car into limp mode and could not be driven until cleared with LeafSpy.
Build 3.3.004-74 (released 2024-04-30) did not yet include the poller tracing control, i.e. it did lots of logging for frames, significantly affecting overall performance.
Poller tracing control was introduced in https://github.com/openvehicles/Open-Vehicle-Monitoring-System-3/commit/7e40... on May 12.
That commit was first included in build 3.3.004-103-g11fddbf6 released 2024-05-25. Do you remember testing that build or a later one?
But as I still don't understand how a software queue overflow could cause a bus crash, I've also checked the 500 kbit timing for the MCP2515 and found that may have the same issue as the 125 kbit timing:
Our timing is: case CAN_SPEED_500KBPS: cnf1=0x00; cnf2=0xf0; cnf3=0x86; = PROP=1, PS1=7, PS2=7, SJW=1, Sample 3x @56.3%
Remember, the SAE/CiA recommendation is SJW=2, Sample 1x @87.5%. That would translate to: PROP=5, PS1=8, PS2=2, SJW=2, Sample 1x @87.5% = cnf1=0x40; cnf2=0xbc; cnf3=0x81;
I also checked the Arduino MCP_CAN lib, and that uses: cnf1=0x40; cnf2=0xe5; cnf3=0x83; = PROP=6, PS1=5, PS2=4, SJW=2, Sample 3x @75%
So our timing for 500 kbit/s on the MCP buses also isn't as recommended.
Derek, could you test the SAE/CiA recommendation and the MCP_CAN config as shown? Or anyone else with a live can2/can3 bus at 500 kbit?
If these work, the question is which is the more general setup we should adopt. Apparently the MCP_CAN lib also does not follow the CiA recommendation, I wonder if the MCP_CAN config is a compromise for compatibility.
Regards, Michael
_______________________________________________ OvmsDev mailing list OvmsDev@lists.openvehicles.com http://lists.openvehicles.com/mailman/listinfo/ovmsdev
-- Michael Balzer * Am Rahmen 5 * D-58313 Herdecke Fon 02330 9104094 * Handy 0176 20698926
_______________________________________________ OvmsDev mailing list OvmsDev@lists.openvehicles.com http://lists.openvehicles.com/mailman/listinfo/ovmsdev
_______________________________________________ OvmsDev mailing list OvmsDev@lists.openvehicles.com http://lists.openvehicles.com/mailman/listinfo/ovmsdev
_______________________________________________ OvmsDev mailing list OvmsDev@lists.openvehicles.com http://lists.openvehicles.com/mailman/listinfo/ovmsdev
-- Michael Balzer * Am Rahmen 5 * D-58313 Herdecke Fon 02330 9104094 * Handy 0176 20698926
Hi. I have now experienced some issues with this updated firmware. I drove the car home just fine, and parked. When I locked the car it issued a continuous warning tone suggesting I shouldn't leave the car in that state. All doors were definitely shut. I turned the car back on, and the dashboard said "When parked apply parking brake". But the handbrake was firmly on. On dismissing that, it reported "I-Key system fault". It wouldn't enter drive ready state. I turned the car off, unplugged OVMS and turned on again. Errors still present. It told me to press the brake pedal in order to turn the car on. I was pressing it, but it didn't seem to recognise this. After a while I came back and disconnected the 12V. On starting up again the I-Key message was still on the dash. I dismissed it, and then it seemed happy. OVMS is now plugged back in. I'm guessing these errors are indicative of CAN bus problems, e.g. preventing communication of brake state? Some command outputs from very recently (i.e. after the events described above): OVMS# can can1 status CAN: can1 Mode: Active Speed: 500000 DBC: none Interrupts: 7299933 Rx pkt: 7299698 Rx ovrflw: 3 Tx pkt: 1371 Tx delays: 50 Tx ovrflw: 0 Tx fails: 108 Err flags: 0x008040d9 Rx err: 0 Tx err: 128 Rx invalid: 0 Wdg Resets: 0 Wdg Timer: 8 sec(s) Err Resets: 0 OVMS# can can2 status CAN: can2 Mode: Active Speed: 500000 DBC: none Interrupts: 210984 Rx pkt: 211985 Rx ovrflw: 0 Tx pkt: 8 Tx delays: 0 Tx ovrflw: 0 Tx fails: 0 Err flags: 0x01000001 Rx err: 0 Tx err: 0 Rx invalid: 0 Wdg Resets: 0 Wdg Timer: 8 sec(s) Err Resets: 0 How would I look for changes in can error frequency in the log? In these numbers perhaps? 2025-01-22 17:28:17.683 GMT E (16789963) can: can2: intr=9475533 rxpkt=9494723 txpkt=52 errflags=0x22401c02 rxerr=0 txerr=0 rxinval=0 rxovr=0 txovr=0 txdelay=0 txfail=0 wdgreset=0 errreset=0 2025-01-22 17:28:17.693 GMT E (16789973) can: can2: intr=9475533 rxpkt=9494724 txpkt=52 errflags=0x23401c01 rxerr=0 txerr=0 rxinval=0 rxovr=0 txovr=0 txdelay=0 txfail=0 wdgreset=0 errreset=0 2025-01-22 21:40:18.843 GMT E (10075543) can: can2: intr=210249 rxpkt=211242 txpkt=8 errflags=0x22401c02 rxerr=0 txerr=0 rxinval=0 rxovr=0 txovr=0 txdelay=0 txfail=0 wdgreset=0 errreset=0 2025-01-22 21:40:18.843 GMT E (10075543) can: can2: intr=210249 rxpkt=211243 txpkt=8 errflags=0x23401c01 rxerr=0 txerr=0 rxinval=0 rxovr=0 txovr=0 txdelay=0 txfail=0 wdgreset=0 errreset=0 I can't see any mentions of can1 in the log, other than ovms-server-v3 pollstats. The log is set to debug level. I have poller times and can share those if needed. Chris On 2025-01-22 16:24, Michael Balzer via OvmsDev wrote:
Chris,
typically "can can1 status" & "can can2 status" will give the statistics of the buses, and "poller times on" will enable poller timing statistics to be then shown by "poller times status".
The Leaf uses can2 to query these values: // VIN [19] // QC [2] // L0/L1/L2 [2]
...but only when the car is on, but not in drive mode. So you should check if you get these values.
It also uses can2 for TCU commands, if the model year is >= 2016.
So you should try commands and see if they work correctly.
Please also check the log for changes in can error occurence & frequency.
Regards, Michael
On 2025-01-21 00:41, Derek Caudwell via OvmsDev wrote:
Hi Chris
Here are the required changes, as I understand them, to be compiled into a new firmware from this thread: https://github.com/openvehicles/Open-Vehicle-Monitoring-System-3/pull/1102/f...
Cheers Derek
Chris, did you take the can status outputs _before_ unplugging the OVMS when the car wouldn't enter drive ready? The poller timing statistics also should best be captured in case of the event, but any may help. Also, did you use the new poller firmware before without issues, i.e. can you confirm the issue only turns up with the new bus timing test? That would confirm it's a timing issue, and it would mean the new timing makes it worse.
How would I look for changes in can error frequency in the log?
Basically by counting the error log entries for each bus to see if they generally increase or decrease, in more detail by also taking the error types logged into account. Some errors log entries are normal, may even occur frequently. Generally, it seems we currently have no idea which of the two CAN buses is actually causing the issue for the Leaf (or the Ford). So I suggest first isolating this by selectively putting one bus into listen mode and testing if the issue then still turns up. Use the "can <bus> start" command to switch the mode, e.g.: can can1 start listen 500000 The Leaf derives the car & polling state from process data frames, so should switch state also in listen mode. Regards, Michael Am 22.01.25 um 23:25 schrieb Chris Box:
Hi.
I have now experienced some issues with this updated firmware. I drove the car home just fine, and parked. When I locked the car it issued a continuous warning tone suggesting I shouldn't leave the car in that state. All doors were definitely shut. I turned the car back on, and the dashboard said "When parked apply parking brake". But the handbrake was firmly on. On dismissing that, it reported "I-Key system fault". It wouldn't enter drive ready state.
I turned the car off, unplugged OVMS and turned on again. Errors still present. It told me to press the brake pedal in order to turn the car on. I was pressing it, but it didn't seem to recognise this.
After a while I came back and disconnected the 12V. On starting up again the I-Key message was still on the dash. I dismissed it, and then it seemed happy. OVMS is now plugged back in.
I'm guessing these errors are indicative of CAN bus problems, e.g. preventing communication of brake state?
Some command outputs from very recently (i.e. after the events described above):
OVMS# can can1 status CAN: can1 Mode: Active Speed: 500000 DBC: none
Interrupts: 7299933 Rx pkt: 7299698 Rx ovrflw: 3 Tx pkt: 1371 Tx delays: 50 Tx ovrflw: 0 Tx fails: 108
Err flags: 0x008040d9 Rx err: 0 Tx err: 128 Rx invalid: 0 Wdg Resets: 0 Wdg Timer: 8 sec(s) Err Resets: 0
OVMS# can can2 status CAN: can2 Mode: Active Speed: 500000 DBC: none
Interrupts: 210984 Rx pkt: 211985 Rx ovrflw: 0 Tx pkt: 8 Tx delays: 0 Tx ovrflw: 0 Tx fails: 0
Err flags: 0x01000001 Rx err: 0 Tx err: 0 Rx invalid: 0 Wdg Resets: 0 Wdg Timer: 8 sec(s) Err Resets: 0
How would I look for changes in can error frequency in the log? In these numbers perhaps?
2025-01-22 17:28:17.683 GMT E (16789963) can: can2: intr=9475533 rxpkt=9494723 txpkt=52 errflags=0x22401c02 rxerr=0 txerr=0 rxinval=0 rxovr=0 txovr=0 txdelay=0 txfail=0 wdgreset=0 errreset=0 2025-01-22 17:28:17.693 GMT E (16789973) can: can2: intr=9475533 rxpkt=9494724 txpkt=52 errflags=0x23401c01 rxerr=0 txerr=0 rxinval=0 rxovr=0 txovr=0 txdelay=0 txfail=0 wdgreset=0 errreset=0
2025-01-22 21:40:18.843 GMT E (10075543) can: can2: intr=210249 rxpkt=211242 txpkt=8 errflags=0x22401c02 rxerr=0 txerr=0 rxinval=0 rxovr=0 txovr=0 txdelay=0 txfail=0 wdgreset=0 errreset=0 2025-01-22 21:40:18.843 GMT E (10075543) can: can2: intr=210249 rxpkt=211243 txpkt=8 errflags=0x23401c01 rxerr=0 txerr=0 rxinval=0 rxovr=0 txovr=0 txdelay=0 txfail=0 wdgreset=0 errreset=0
I can't see any mentions of can1 in the log, other than ovms-server-v3 pollstats. The log is set to debug level.
I have poller times and can share those if needed.
Chris
On 2025-01-22 16:24, Michael Balzer via OvmsDev wrote:
Chris,
typically "can can1 status" & "can can2 status" will give the statistics of the buses, and "poller times on" will enable poller timing statistics to be then shown by "poller times status".
The Leaf uses can2 to query these values: // VIN [19] // QC [2] // L0/L1/L2 [2]
...but only when the car is on, but not in drive mode. So you should check if you get these values.
It also uses can2 for TCU commands, if the model year is >= 2016.
So you should try commands and see if they work correctly.
Please also check the log for changes in can error occurence & frequency.
Regards, Michael
On 2025-01-21 00:41, Derek Caudwell via OvmsDev wrote:
Hi Chris Here are the required changes, as I understand them, to be compiled into a new firmware from this thread: https://github.com/openvehicles/Open-Vehicle-Monitoring-System-3/pull/1102/f... <https://github.com/openvehicles/Open-Vehicle-Monitoring-System-3/pull/1102/files> Cheers Derek
-- Michael Balzer * Am Rahmen 5 * D-58313 Herdecke Fon 02330 9104094 * Handy 0176 20698926
On 2025-01-23 08:19, Michael Balzer wrote:
did you take the can status outputs _before_ unplugging the OVMS when the car wouldn't enter drive ready?
No, unfortunately at the time I was only thinking of wanting to get the car working again.
Also, did you use the new poller firmware before without issues, i.e. can you confirm the issue only turns up with the new bus timing test? That would confirm it's a timing issue, and it would mean the new timing makes it worse.
Previously I was using git master firmware from 19th November. I covered 800 miles in two months using this firmware and only experienced one issue (drive going to neutral). As this firmware gave me an issue on the same day I flashed it, this morning I've reverted the bus timing back to how it was before. But I've kept the single sampling change: MODULE_ESP32CAN->BTR1.B.SAM = (MyESP32can->m_speed < CAN_SPEED_125KBPS) ? 1 : 0; So we'll see how this one goes.
How would I look for changes in can error frequency in the log?
Basically by counting the error log entries for each bus to see if they generally increase or decrease, in more detail by also taking the error types logged into account. Some errors log entries are normal, may even occur frequently.
Could I do this by looking at these counters? e.g. delays/overflow/fails/err/invalid/resets. OVMS# can can1 status CAN: can1 Mode: Active Speed: 500000 DBC: none Interrupts: 6752500 Rx pkt: 6752388 Rx ovrflw: 1 Tx pkt: 737 Tx delays: 0 Tx ovrflw: 0 Tx fails: 0 Err flags: 0x00000000 Rx err: 0 Tx err: 0 Rx invalid: 0 Wdg Resets: 0 Wdg Timer: 0 sec(s) Err Resets: 0 The above set was taken before charging. After charging (and soc limit applied): OVMS# can can1 status CAN: can1 Mode: Active Speed: 500000 DBC: none Interrupts: 7294918 Rx pkt: 7294172 Rx ovrflw: 1 Tx pkt: 1103 Tx delays: 50 Tx ovrflw: 0 Tx fails: 144 Err flags: 0x008040d9 Rx err: 0 Tx err: 128 Rx invalid: 0 Wdg Resets: 0 Wdg Timer: 2 sec(s) Err Resets: 0
So I suggest first isolating this by selectively putting one bus into listen mode and testing if the issue then still turns up. Use the "can <bus> start" command to switch the mode, e.g.: can can1 start listen 500000
I think I'll first give this new firmware a couple of days to see if it's free of issues. If it is, then I could reapply the bus timing changes and then set can1 into listen mode. And see how that goes. Chris
Regarding CAN timing, our ESP32CAN/SJA1000 configuration is mostly according to the SAE/CiA recommendations, with one exception: we generally enable multi (triple) sampling, regardless of the bus speed: esp32can::InitController(): […] /* Set sampling * 1 -> triple; the bus is sampled three times; recommended for low/medium speed buses (class A and B) where filtering spikes on the bus line is beneficial * 0 -> single; the bus is sampled once; recommended for high speed buses (SAE class C)*/ MODULE_ESP32CAN->BTR1.B.SAM=0x1; SAE defines "high speed" (class C) as speeds >= 125 kbit/s. See SAE J2284-1, -2 & -3, section 6.10.8 Data Sample Mode: "The data sampling shall always be set to single sample mode." If setting SAM=0 for 500 kbit/s, our timing setup is exactly as recommended by two tested SJA1000 timing calculators on the web. Maybe we should give that a try? I.e. MODULE_ESP32CAN->BTR1.B.SAM = (MyESP32can->m_speed < CAN_SPEED_125KBPS) ? 1 : 0; Simon, can you try if that helps? But as you also use can2, I wouldn't rule out a timing issue with the MCP2515 configuration. At which speed do you have can2, and did you have some indication from the vehicle error codes regarding a specific bus? Regards, Michael Am 17.01.25 um 17:49 schrieb Michael Balzer via OvmsDev:
OK, I've got a new idea: CAN timing.
Comparing our esp32can bit timing to the esp-idf driver's, there seem to be some differences: https://github.com/espressif/esp-idf/blob/master/components/hal/include/hal/...
Transceivers are normally tolerant to small timing offsets. Maybe being off a little bit has no effect under normal conditions, but it has when the transceiver has to cope with a filled RX queue. That could be causing the transceiver to slide just out of sync. If the timing gets garbled, the transceiver would signal errors in the packets to the bus, possibly so many the vehicle ECUs decide to raise an error condition.
Is that plausible?
On why the new poller could be causing this (in combination with too slow processing by the vehicle): as mentioned, the standard CAN listener mechanism doesn't care about queue overflows. The poller does. `OvmsPollers::Queue_PollerFrame()` does a log call when Tx/Rx tracing is enabled, that could even block, but tracing is optional and only meant for debugging. Not optional is the overflow counting using an atomic uint32.
The atomic types are said to be fast, but I never checked their actual implementation on the ESP32. Maybe they can block as well?
@Simon: it would be an option to try commenting out the overflow counting, to see if that's causing the issue.
Regards, Michael
Am 17.01.25 um 15:37 schrieb Chris Box via OvmsDev:
Yes, I can confirm I've had one experience of the Leaf switching to Neutral while driving, with a yellow warning symbol on the dash. It refused to reselect Drive until I had switched the car off and back on. Derek wasn't so lucky and he need to clear fault codes before the car would work.
On returning home, I found OVMS was not accessible over a network. I didn't try a USB cable. Unplugging and reinserting the OBD cable caused OVMS to rejoin Wi-Fi. However the SD logs showed nothing from the time of the event. CAN writes are enabled, so it can perform SOC limiting.
My car has been using this firmware since 21st November, based on the git master of that day. As a relatively new user of OVMS (only since October) I don't have much experience of older firmware.
Perhaps a safeguard should be implemented before releasing a new stable firmware that will be automatically downloaded by Leaf owners. But I don't have the expertise to know what that safeguard should be. Derek's suggestion of 'only CAN write when parked' appears to be a good idea.
Chris
On 2025-01-15 18:18, Derek Caudwell via OvmsDev wrote:
Since the following email I have high confidence the issue on the Leaf is related/caused by the poller as there has been no further occurrence and Chris has also experienced the car going to neutral on the new poller firmware.
.... I haven't ruled out it being a fault with my car yet. Shortly after it faulted the car was run into so has been off the road for sometime, my first step was to replace 12V battery. The ovms unit is now unplugged and if it does not fault over the next month while driving I'll be reasonably confident it's ovms related. Not sure which firmware version the poller updates were included in but it was only after upgrading to it that the errors occurred (which could be coincidental however it has faulted twice more both on version 3.3.004-141-gf729d82c). For periods where I reverted to 3.3.003 it was fine. It might be useful to have an extra option on the enable can write to only enable it when the car is parked/charging.
_______________________________________________ OvmsDev mailing list OvmsDev@lists.openvehicles.com http://lists.openvehicles.com/mailman/listinfo/ovmsdev
-- Michael Balzer * Am Rahmen 5 * D-58313 Herdecke Fon 02330 9104094 * Handy 0176 20698926
_______________________________________________ OvmsDev mailing list OvmsDev@lists.openvehicles.com http://lists.openvehicles.com/mailman/listinfo/ovmsdev
-- Michael Balzer * Am Rahmen 5 * D-58313 Herdecke Fon 02330 9104094 * Handy 0176 20698926
Hi, Am 19.01.2025 um 12:48 schrieb Michael Balzer via OvmsDev:
Regarding CAN timing, our ESP32CAN/SJA1000 configuration is mostly according to the SAE/CiA recommendations, with one exception: we generally enable multi (triple) sampling, regardless of the bus speed:
esp32can::InitController(): […] /* Set sampling * 1 -> triple; the bus is sampled three times; recommended for low/medium speed buses (class A and B) where filtering spikes on the bus line is beneficial * 0 -> single; the bus is sampled once; recommended for high speed buses (SAE class C)*/ MODULE_ESP32CAN->BTR1.B.SAM=0x1;
SAE defines "high speed" (class C) as speeds >= 125 kbit/s. See SAE J2284-1, -2 & -3, section 6.10.8 Data Sample Mode: "The data sampling shall always be set to single sample mode."
If setting SAM=0 for 500 kbit/s, our timing setup is exactly as recommended by two tested SJA1000 timing calculators on the web.
Maybe we should give that a try? I.e.
MODULE_ESP32CAN->BTR1.B.SAM = (MyESP32can->m_speed < CAN_SPEED_125KBPS) ? 1 : 0;
Simon, can you try if that helps?
I have adjusted the corresponding line. I will check tomorrow whether this has an effect on the active mode. I tried your recommendation and set the CONFIG_OVMS_VEHICLE_CAN_RX_QUEUE_SIZE to both 200 and 400. I have not yet checked whether the bus also crashes in active mode. However, I can see in listening mode that when I abort a running loading process (there are currently no overflows), many overflow messages are received.
But as you also use can2, I wouldn't rule out a timing issue with the MCP2515 configuration. At which speed do you have can2, and did you have some indication from the vehicle error codes regarding a specific bus? RegisterCanBus(1, CAN_MODE_LISTEN, CAN_SPEED_500KBPS); RegisterCanBus(2, CAN_MODE_LISTEN, CAN_SPEED_125KBPS); I do not receive any feedback from the car as to which bus is affected, unfortunately no error code is saved for the incident. Do you have the option of specifying the affected bus in the overflow logging?
Cheers, Simon
Am 17.01.25 um 17:49 schrieb Michael Balzer via OvmsDev:
OK, I've got a new idea: CAN timing.
Comparing our esp32can bit timing to the esp-idf driver's, there seem to be some differences: https://github.com/espressif/esp-idf/blob/master/components/hal/include/hal/...
Transceivers are normally tolerant to small timing offsets. Maybe being off a little bit has no effect under normal conditions, but it has when the transceiver has to cope with a filled RX queue. That could be causing the transceiver to slide just out of sync. If the timing gets garbled, the transceiver would signal errors in the packets to the bus, possibly so many the vehicle ECUs decide to raise an error condition.
Is that plausible?
On why the new poller could be causing this (in combination with too slow processing by the vehicle): as mentioned, the standard CAN listener mechanism doesn't care about queue overflows. The poller does. `OvmsPollers::Queue_PollerFrame()` does a log call when Tx/Rx tracing is enabled, that could even block, but tracing is optional and only meant for debugging. Not optional is the overflow counting using an atomic uint32.
The atomic types are said to be fast, but I never checked their actual implementation on the ESP32. Maybe they can block as well?
@Simon: it would be an option to try commenting out the overflow counting, to see if that's causing the issue.
Regards, Michael
Am 17.01.25 um 15:37 schrieb Chris Box via OvmsDev:
Yes, I can confirm I've had one experience of the Leaf switching to Neutral while driving, with a yellow warning symbol on the dash. It refused to reselect Drive until I had switched the car off and back on. Derek wasn't so lucky and he need to clear fault codes before the car would work.
On returning home, I found OVMS was not accessible over a network. I didn't try a USB cable. Unplugging and reinserting the OBD cable caused OVMS to rejoin Wi-Fi. However the SD logs showed nothing from the time of the event. CAN writes are enabled, so it can perform SOC limiting.
My car has been using this firmware since 21st November, based on the git master of that day. As a relatively new user of OVMS (only since October) I don't have much experience of older firmware.
Perhaps a safeguard should be implemented before releasing a new stable firmware that will be automatically downloaded by Leaf owners. But I don't have the expertise to know what that safeguard should be. Derek's suggestion of 'only CAN write when parked' appears to be a good idea.
Chris
On 2025-01-15 18:18, Derek Caudwell via OvmsDev wrote:
Since the following email I have high confidence the issue on the Leaf is related/caused by the poller as there has been no further occurrence and Chris has also experienced the car going to neutral on the new poller firmware.
.... I haven't ruled out it being a fault with my car yet. Shortly after it faulted the car was run into so has been off the road for sometime, my first step was to replace 12V battery. The ovms unit is now unplugged and if it does not fault over the next month while driving I'll be reasonably confident it's ovms related. Not sure which firmware version the poller updates were included in but it was only after upgrading to it that the errors occurred (which could be coincidental however it has faulted twice more both on version 3.3.004-141-gf729d82c). For periods where I reverted to 3.3.003 it was fine. It might be useful to have an extra option on the enable can write to only enable it when the car is parked/charging.
_______________________________________________ OvmsDev mailing list OvmsDev@lists.openvehicles.com http://lists.openvehicles.com/mailman/listinfo/ovmsdev
-- Michael Balzer * Am Rahmen 5 * D-58313 Herdecke Fon 02330 9104094 * Handy 0176 20698926
_______________________________________________ OvmsDev mailing list OvmsDev@lists.openvehicles.com http://lists.openvehicles.com/mailman/listinfo/ovmsdev
-- Michael Balzer * Am Rahmen 5 * D-58313 Herdecke Fon 02330 9104094 * Handy 0176 20698926
_______________________________________________ OvmsDev mailing list OvmsDev@lists.openvehicles.com http://lists.openvehicles.com/mailman/listinfo/ovmsdev
With my latest push - you could also call AddFilter() before turning on the CAN bus and reduce the load on the Poll queue. //.ichael On Sun, 19 Jan 2025 at 20:40, Simon Ehlen via OvmsDev < ovmsdev@lists.openvehicles.com> wrote:
Hi,
Am 19.01.2025 um 12:48 schrieb Michael Balzer via OvmsDev:
Regarding CAN timing, our ESP32CAN/SJA1000 configuration is mostly according to the SAE/CiA recommendations, with one exception: we generally enable multi (triple) sampling, regardless of the bus speed:
esp32can::InitController(): […] /* Set sampling * 1 -> triple; the bus is sampled three times; recommended for low/medium speed buses (class A and B) where filtering spikes on the bus line is beneficial * 0 -> single; the bus is sampled once; recommended for high speed buses (SAE class C)*/ MODULE_ESP32CAN->BTR1.B.SAM=0x1;
SAE defines "high speed" (class C) as speeds >= 125 kbit/s. See SAE J2284-1, -2 & -3, section 6.10.8 Data Sample Mode: "The data sampling shall always be set to single sample mode."
If setting SAM=0 for 500 kbit/s, our timing setup is exactly as recommended by two tested SJA1000 timing calculators on the web.
Maybe we should give that a try? I.e.
MODULE_ESP32CAN->BTR1.B.SAM = (MyESP32can->m_speed < CAN_SPEED_125KBPS) ? 1 : 0;
Simon, can you try if that helps?
I have adjusted the corresponding line. I will check tomorrow whether this has an effect on the active mode. I tried your recommendation and set the CONFIG_OVMS_VEHICLE_CAN_RX_QUEUE_SIZE to both 200 and 400. I have not yet checked whether the bus also crashes in active mode. However, I can see in listening mode that when I abort a running loading process (there are currently no overflows), many overflow messages are received.
But as you also use can2, I wouldn't rule out a timing issue with the MCP2515 configuration. At which speed do you have can2, and did you have some indication from the vehicle error codes regarding a specific bus?
RegisterCanBus(1, CAN_MODE_LISTEN, CAN_SPEED_500KBPS); RegisterCanBus(2, CAN_MODE_LISTEN, CAN_SPEED_125KBPS); I do not receive any feedback from the car as to which bus is affected, unfortunately no error code is saved for the incident. Do you have the option of specifying the affected bus in the overflow logging?
Cheers, Simon
Am 17.01.25 um 17:49 schrieb Michael Balzer via OvmsDev:
OK, I've got a new idea: CAN timing.
Comparing our esp32can bit timing to the esp-idf driver's, there seem to be some differences:
https://github.com/espressif/esp-idf/blob/master/components/hal/include/hal/...
Transceivers are normally tolerant to small timing offsets. Maybe being off a little bit has no effect under normal conditions, but it has when the transceiver has to cope with a filled RX queue. That could be causing the transceiver to slide just out of sync. If the timing gets garbled, the transceiver would signal errors in the packets to the bus, possibly so many the vehicle ECUs decide to raise an error condition.
Is that plausible?
On why the new poller could be causing this (in combination with too slow processing by the vehicle): as mentioned, the standard CAN listener mechanism doesn't care about queue overflows. The poller does. `OvmsPollers::Queue_PollerFrame()` does a log call when Tx/Rx tracing is enabled, that could even block, but tracing is optional and only meant for debugging. Not optional is the overflow counting using an atomic uint32.
The atomic types are said to be fast, but I never checked their actual implementation on the ESP32. Maybe they can block as well?
@Simon: it would be an option to try commenting out the overflow counting, to see if that's causing the issue.
Regards, Michael
Am 17.01.25 um 15:37 schrieb Chris Box via OvmsDev:
Yes, I can confirm I've had one experience of the Leaf switching to Neutral while driving, with a yellow warning symbol on the dash. It refused to reselect Drive until I had switched the car off and back on. Derek wasn't so lucky and he need to clear fault codes before the car would work.
On returning home, I found OVMS was not accessible over a network. I didn't try a USB cable. Unplugging and reinserting the OBD cable caused OVMS to rejoin Wi-Fi. However the SD logs showed nothing from the time of the event. CAN writes are enabled, so it can perform SOC limiting.
My car has been using this firmware since 21st November, based on the git master of that day. As a relatively new user of OVMS (only since October) I don't have much experience of older firmware.
Perhaps a safeguard should be implemented before releasing a new stable firmware that will be automatically downloaded by Leaf owners. But I don't have the expertise to know what that safeguard should be. Derek's suggestion of 'only CAN write when parked' appears to be a good idea.
Chris
On 2025-01-15 18:18, Derek Caudwell via OvmsDev wrote:
Since the following email I have high confidence the issue on the Leaf is related/caused by the poller as there has been no further occurrence and Chris has also experienced the car going to neutral on the new poller firmware.
.... I haven't ruled out it being a fault with my car yet. Shortly after it faulted the car was run into so has been off the road for sometime, my first step was to replace 12V battery. The ovms unit is now unplugged and if it does not fault over the next month while driving I'll be reasonably confident it's ovms related.
Not sure which firmware version the poller updates were included in but it was only after upgrading to it that the errors occurred (which could be coincidental however it has faulted twice more both on version 3.3.004-141-gf729d82c). For periods where I reverted to 3.3.003 it was fine.
It might be useful to have an extra option on the enable can write to only enable it when the car is parked/charging.
_______________________________________________ OvmsDev mailing listOvmsDev@lists.openvehicles.comhttp://lists.openvehicles.com/mailman/listinfo/ovmsdev
-- Michael Balzer * Am Rahmen 5 * D-58313 Herdecke Fon 02330 9104094 * Handy 0176 20698926
_______________________________________________ OvmsDev mailing listOvmsDev@lists.openvehicles.comhttp://lists.openvehicles.com/mailman/listinfo/ovmsdev
-- Michael Balzer * Am Rahmen 5 * D-58313 Herdecke Fon 02330 9104094 * Handy 0176 20698926
_______________________________________________ OvmsDev mailing listOvmsDev@lists.openvehicles.comhttp://lists.openvehicles.com/mailman/listinfo/ovmsdev
_______________________________________________ OvmsDev mailing list OvmsDev@lists.openvehicles.com http://lists.openvehicles.com/mailman/listinfo/ovmsdev
Am 19.01.2025 um 13:51 schrieb Michael Geddes:
With my latest push - you could also call AddFilter() before turning on the CAN bus and reduce the load on the Poll queue. Hi Michael,
I'd be happy to try it out. Can you please give me brief instructions on how to use AddFilter()? Do I enter the MsgIDs that I want to evaluate or the ones that should be discarded? Thank you! Cheers, Simon
On Sun, 19 Jan 2025 at 20:40, Simon Ehlen via OvmsDev <ovmsdev@lists.openvehicles.com> wrote:
Hi,
Am 19.01.2025 um 12:48 schrieb Michael Balzer via OvmsDev:
Regarding CAN timing, our ESP32CAN/SJA1000 configuration is mostly according to the SAE/CiA recommendations, with one exception: we generally enable multi (triple) sampling, regardless of the bus speed:
esp32can::InitController(): […] /* Set sampling * 1 -> triple; the bus is sampled three times; recommended for low/medium speed buses (class A and B) where filtering spikes on the bus line is beneficial * 0 -> single; the bus is sampled once; recommended for high speed buses (SAE class C)*/ MODULE_ESP32CAN->BTR1.B.SAM=0x1;
SAE defines "high speed" (class C) as speeds >= 125 kbit/s. See SAE J2284-1, -2 & -3, section 6.10.8 Data Sample Mode: "The data sampling shall always be set to single sample mode."
If setting SAM=0 for 500 kbit/s, our timing setup is exactly as recommended by two tested SJA1000 timing calculators on the web.
Maybe we should give that a try? I.e.
MODULE_ESP32CAN->BTR1.B.SAM = (MyESP32can->m_speed < CAN_SPEED_125KBPS) ? 1 : 0;
Simon, can you try if that helps?
I have adjusted the corresponding line. I will check tomorrow whether this has an effect on the active mode. I tried your recommendation and set the CONFIG_OVMS_VEHICLE_CAN_RX_QUEUE_SIZE to both 200 and 400. I have not yet checked whether the bus also crashes in active mode. However, I can see in listening mode that when I abort a running loading process (there are currently no overflows), many overflow messages are received.
But as you also use can2, I wouldn't rule out a timing issue with the MCP2515 configuration. At which speed do you have can2, and did you have some indication from the vehicle error codes regarding a specific bus?
RegisterCanBus(1, CAN_MODE_LISTEN, CAN_SPEED_500KBPS); RegisterCanBus(2, CAN_MODE_LISTEN, CAN_SPEED_125KBPS); I do not receive any feedback from the car as to which bus is affected, unfortunately no error code is saved for the incident. Do you have the option of specifying the affected bus in the overflow logging?
Cheers, Simon
Am 17.01.25 um 17:49 schrieb Michael Balzer via OvmsDev:
OK, I've got a new idea: CAN timing.
Comparing our esp32can bit timing to the esp-idf driver's, there seem to be some differences: https://github.com/espressif/esp-idf/blob/master/components/hal/include/hal/...
Transceivers are normally tolerant to small timing offsets. Maybe being off a little bit has no effect under normal conditions, but it has when the transceiver has to cope with a filled RX queue. That could be causing the transceiver to slide just out of sync. If the timing gets garbled, the transceiver would signal errors in the packets to the bus, possibly so many the vehicle ECUs decide to raise an error condition.
Is that plausible?
On why the new poller could be causing this (in combination with too slow processing by the vehicle): as mentioned, the standard CAN listener mechanism doesn't care about queue overflows. The poller does. `OvmsPollers::Queue_PollerFrame()` does a log call when Tx/Rx tracing is enabled, that could even block, but tracing is optional and only meant for debugging. Not optional is the overflow counting using an atomic uint32.
The atomic types are said to be fast, but I never checked their actual implementation on the ESP32. Maybe they can block as well?
@Simon: it would be an option to try commenting out the overflow counting, to see if that's causing the issue.
Regards, Michael
Am 17.01.25 um 15:37 schrieb Chris Box via OvmsDev:
Yes, I can confirm I've had one experience of the Leaf switching to Neutral while driving, with a yellow warning symbol on the dash. It refused to reselect Drive until I had switched the car off and back on. Derek wasn't so lucky and he need to clear fault codes before the car would work.
On returning home, I found OVMS was not accessible over a network. I didn't try a USB cable. Unplugging and reinserting the OBD cable caused OVMS to rejoin Wi-Fi. However the SD logs showed nothing from the time of the event. CAN writes are enabled, so it can perform SOC limiting.
My car has been using this firmware since 21st November, based on the git master of that day. As a relatively new user of OVMS (only since October) I don't have much experience of older firmware.
Perhaps a safeguard should be implemented before releasing a new stable firmware that will be automatically downloaded by Leaf owners. But I don't have the expertise to know what that safeguard should be. Derek's suggestion of 'only CAN write when parked' appears to be a good idea.
Chris
On 2025-01-15 18:18, Derek Caudwell via OvmsDev wrote:
Since the following email I have high confidence the issue on the Leaf is related/caused by the poller as there has been no further occurrence and Chris has also experienced the car going to neutral on the new poller firmware.
.... I haven't ruled out it being a fault with my car yet. Shortly after it faulted the car was run into so has been off the road for sometime, my first step was to replace 12V battery. The ovms unit is now unplugged and if it does not fault over the next month while driving I'll be reasonably confident it's ovms related. Not sure which firmware version the poller updates were included in but it was only after upgrading to it that the errors occurred (which could be coincidental however it has faulted twice more both on version 3.3.004-141-gf729d82c). For periods where I reverted to 3.3.003 it was fine. It might be useful to have an extra option on the enable can write to only enable it when the car is parked/charging.
_______________________________________________ OvmsDev mailing list OvmsDev@lists.openvehicles.com http://lists.openvehicles.com/mailman/listinfo/ovmsdev
-- Michael Balzer * Am Rahmen 5 * D-58313 Herdecke Fon 02330 9104094 * Handy 0176 20698926
_______________________________________________ OvmsDev mailing list OvmsDev@lists.openvehicles.com http://lists.openvehicles.com/mailman/listinfo/ovmsdev
-- Michael Balzer * Am Rahmen 5 * D-58313 Herdecke Fon 02330 9104094 * Handy 0176 20698926
_______________________________________________ OvmsDev mailing list OvmsDev@lists.openvehicles.com http://lists.openvehicles.com/mailman/listinfo/ovmsdev
_______________________________________________ OvmsDev mailing list OvmsDev@lists.openvehicles.com http://lists.openvehicles.com/mailman/listinfo/ovmsdev
The AddFilter calls canbus::AddFilter. If the frame 'MsgID' matches the bus and is within the range, then it is INCLUDED. This means if you add a filter for one bus, you have to add it for all busses. AddFilter('1', 0x700, 0x800) ; would allow only msgid from 0x700 to 0x800 for bus 1. The char is a bit weird, but that's the original call. I wonder if I should make it a bit different in the translation. Maybe the Poller AddFilter should be AddFilter(1, 0x700, 0x800) which passes to the canbus AddFilter( '0' + busno, busfrom, busto); (to be consistent with the pollers number of busses) If you included that in a commit, I wouldn't object. //. On Mon, 20 Jan 2025 at 04:51, Simon Ehlen via OvmsDev < ovmsdev@lists.openvehicles.com> wrote:
Am 19.01.2025 um 13:51 schrieb Michael Geddes:
With my latest push - you could also call AddFilter() before turning on the CAN bus and reduce the load on the Poll queue.
Hi Michael,
I'd be happy to try it out. Can you please give me brief instructions on how to use AddFilter()? Do I enter the MsgIDs that I want to evaluate or the ones that should be discarded?
Thank you! Cheers, Simon
On Sun, 19 Jan 2025 at 20:40, Simon Ehlen via OvmsDev < ovmsdev@lists.openvehicles.com> wrote:
Hi,
Am 19.01.2025 um 12:48 schrieb Michael Balzer via OvmsDev:
Regarding CAN timing, our ESP32CAN/SJA1000 configuration is mostly according to the SAE/CiA recommendations, with one exception: we generally enable multi (triple) sampling, regardless of the bus speed:
esp32can::InitController(): […] /* Set sampling * 1 -> triple; the bus is sampled three times; recommended for low/medium speed buses (class A and B) where filtering spikes on the bus line is beneficial * 0 -> single; the bus is sampled once; recommended for high speed buses (SAE class C)*/ MODULE_ESP32CAN->BTR1.B.SAM=0x1;
SAE defines "high speed" (class C) as speeds >= 125 kbit/s. See SAE J2284-1, -2 & -3, section 6.10.8 Data Sample Mode: "The data sampling shall always be set to single sample mode."
If setting SAM=0 for 500 kbit/s, our timing setup is exactly as recommended by two tested SJA1000 timing calculators on the web.
Maybe we should give that a try? I.e.
MODULE_ESP32CAN->BTR1.B.SAM = (MyESP32can->m_speed < CAN_SPEED_125KBPS) ? 1 : 0;
Simon, can you try if that helps?
I have adjusted the corresponding line. I will check tomorrow whether this has an effect on the active mode. I tried your recommendation and set the CONFIG_OVMS_VEHICLE_CAN_RX_QUEUE_SIZE to both 200 and 400. I have not yet checked whether the bus also crashes in active mode. However, I can see in listening mode that when I abort a running loading process (there are currently no overflows), many overflow messages are received.
But as you also use can2, I wouldn't rule out a timing issue with the MCP2515 configuration. At which speed do you have can2, and did you have some indication from the vehicle error codes regarding a specific bus?
RegisterCanBus(1, CAN_MODE_LISTEN, CAN_SPEED_500KBPS); RegisterCanBus(2, CAN_MODE_LISTEN, CAN_SPEED_125KBPS); I do not receive any feedback from the car as to which bus is affected, unfortunately no error code is saved for the incident. Do you have the option of specifying the affected bus in the overflow logging?
Cheers, Simon
Am 17.01.25 um 17:49 schrieb Michael Balzer via OvmsDev:
OK, I've got a new idea: CAN timing.
Comparing our esp32can bit timing to the esp-idf driver's, there seem to be some differences:
https://github.com/espressif/esp-idf/blob/master/components/hal/include/hal/...
Transceivers are normally tolerant to small timing offsets. Maybe being off a little bit has no effect under normal conditions, but it has when the transceiver has to cope with a filled RX queue. That could be causing the transceiver to slide just out of sync. If the timing gets garbled, the transceiver would signal errors in the packets to the bus, possibly so many the vehicle ECUs decide to raise an error condition.
Is that plausible?
On why the new poller could be causing this (in combination with too slow processing by the vehicle): as mentioned, the standard CAN listener mechanism doesn't care about queue overflows. The poller does. `OvmsPollers::Queue_PollerFrame()` does a log call when Tx/Rx tracing is enabled, that could even block, but tracing is optional and only meant for debugging. Not optional is the overflow counting using an atomic uint32.
The atomic types are said to be fast, but I never checked their actual implementation on the ESP32. Maybe they can block as well?
@Simon: it would be an option to try commenting out the overflow counting, to see if that's causing the issue.
Regards, Michael
Am 17.01.25 um 15:37 schrieb Chris Box via OvmsDev:
Yes, I can confirm I've had one experience of the Leaf switching to Neutral while driving, with a yellow warning symbol on the dash. It refused to reselect Drive until I had switched the car off and back on. Derek wasn't so lucky and he need to clear fault codes before the car would work.
On returning home, I found OVMS was not accessible over a network. I didn't try a USB cable. Unplugging and reinserting the OBD cable caused OVMS to rejoin Wi-Fi. However the SD logs showed nothing from the time of the event. CAN writes are enabled, so it can perform SOC limiting.
My car has been using this firmware since 21st November, based on the git master of that day. As a relatively new user of OVMS (only since October) I don't have much experience of older firmware.
Perhaps a safeguard should be implemented before releasing a new stable firmware that will be automatically downloaded by Leaf owners. But I don't have the expertise to know what that safeguard should be. Derek's suggestion of 'only CAN write when parked' appears to be a good idea.
Chris
On 2025-01-15 18:18, Derek Caudwell via OvmsDev wrote:
Since the following email I have high confidence the issue on the Leaf is related/caused by the poller as there has been no further occurrence and Chris has also experienced the car going to neutral on the new poller firmware.
.... I haven't ruled out it being a fault with my car yet. Shortly after it faulted the car was run into so has been off the road for sometime, my first step was to replace 12V battery. The ovms unit is now unplugged and if it does not fault over the next month while driving I'll be reasonably confident it's ovms related.
Not sure which firmware version the poller updates were included in but it was only after upgrading to it that the errors occurred (which could be coincidental however it has faulted twice more both on version 3.3.004-141-gf729d82c). For periods where I reverted to 3.3.003 it was fine.
It might be useful to have an extra option on the enable can write to only enable it when the car is parked/charging.
_______________________________________________ OvmsDev mailing listOvmsDev@lists.openvehicles.comhttp://lists.openvehicles.com/mailman/listinfo/ovmsdev
-- Michael Balzer * Am Rahmen 5 * D-58313 Herdecke Fon 02330 9104094 * Handy 0176 20698926
_______________________________________________ OvmsDev mailing listOvmsDev@lists.openvehicles.comhttp://lists.openvehicles.com/mailman/listinfo/ovmsdev
-- Michael Balzer * Am Rahmen 5 * D-58313 Herdecke Fon 02330 9104094 * Handy 0176 20698926
_______________________________________________ OvmsDev mailing listOvmsDev@lists.openvehicles.comhttp://lists.openvehicles.com/mailman/listinfo/ovmsdev
_______________________________________________ OvmsDev mailing list OvmsDev@lists.openvehicles.com http://lists.openvehicles.com/mailman/listinfo/ovmsdev
_______________________________________________ OvmsDev mailing list OvmsDev@lists.openvehicles.com http://lists.openvehicles.com/mailman/listinfo/ovmsdev
Maybe the Poller AddFilter should be AddFilter(1, 0x700, 0x800) which passes to the canbus AddFilter( '0' + busno, busfrom, busto); (to be consistent with the pollers number of busses)
AddFilter with bus=0 (actual zero, not '0') translates to "any bus", which is handy for can logging. Probably not needed for a vehicle implementation, but still I'd suggest keeping it consistent, so '0' + busno should only be applied for busno >= 1. I think the char digits for actual buses stuck from the string spec parsing, could be changed if necessary. Regards, Michael Am 20.01.25 um 01:40 schrieb Michael Geddes via OvmsDev:
The AddFilter calls canbus::AddFilter.
If the frame 'MsgID' matches the bus and is within the range, then it is INCLUDED.
This means if you add a filter for one bus, you have to add it for all busses. AddFilter('1', 0x700, 0x800) ; would allow only msgid from 0x700 to 0x800 for bus 1. The char is a bit weird, but that's the original call. I wonder if I should make it a bit different in the translation.
Maybe the Poller AddFilter should be AddFilter(1, 0x700, 0x800) which passes to the canbus AddFilter( '0' + busno, busfrom, busto); (to be consistent with the pollers number of busses)
If you included that in a commit, I wouldn't object.
//.
On Mon, 20 Jan 2025 at 04:51, Simon Ehlen via OvmsDev <ovmsdev@lists.openvehicles.com> wrote:
Am 19.01.2025 um 13:51 schrieb Michael Geddes:
With my latest push - you could also call AddFilter() before turning on the CAN bus and reduce the load on the Poll queue.
Hi Michael,
I'd be happy to try it out. Can you please give me brief instructions on how to use AddFilter()? Do I enter the MsgIDs that I want to evaluate or the ones that should be discarded?
Thank you! Cheers, Simon
On Sun, 19 Jan 2025 at 20:40, Simon Ehlen via OvmsDev <ovmsdev@lists.openvehicles.com> wrote:
Hi,
Am 19.01.2025 um 12:48 schrieb Michael Balzer via OvmsDev:
Regarding CAN timing, our ESP32CAN/SJA1000 configuration is mostly according to the SAE/CiA recommendations, with one exception: we generally enable multi (triple) sampling, regardless of the bus speed:
esp32can::InitController(): […] /* Set sampling * 1 -> triple; the bus is sampled three times; recommended for low/medium speed buses (class A and B) where filtering spikes on the bus line is beneficial * 0 -> single; the bus is sampled once; recommended for high speed buses (SAE class C)*/ MODULE_ESP32CAN->BTR1.B.SAM=0x1;
SAE defines "high speed" (class C) as speeds >= 125 kbit/s. See SAE J2284-1, -2 & -3, section 6.10.8 Data Sample Mode: "The data sampling shall always be set to single sample mode."
If setting SAM=0 for 500 kbit/s, our timing setup is exactly as recommended by two tested SJA1000 timing calculators on the web.
Maybe we should give that a try? I.e.
MODULE_ESP32CAN->BTR1.B.SAM = (MyESP32can->m_speed < CAN_SPEED_125KBPS) ? 1 : 0;
Simon, can you try if that helps?
I have adjusted the corresponding line. I will check tomorrow whether this has an effect on the active mode. I tried your recommendation and set the CONFIG_OVMS_VEHICLE_CAN_RX_QUEUE_SIZE to both 200 and 400. I have not yet checked whether the bus also crashes in active mode. However, I can see in listening mode that when I abort a running loading process (there are currently no overflows), many overflow messages are received.
But as you also use can2, I wouldn't rule out a timing issue with the MCP2515 configuration. At which speed do you have can2, and did you have some indication from the vehicle error codes regarding a specific bus?
RegisterCanBus(1, CAN_MODE_LISTEN, CAN_SPEED_500KBPS); RegisterCanBus(2, CAN_MODE_LISTEN, CAN_SPEED_125KBPS); I do not receive any feedback from the car as to which bus is affected, unfortunately no error code is saved for the incident. Do you have the option of specifying the affected bus in the overflow logging?
Cheers, Simon
Am 17.01.25 um 17:49 schrieb Michael Balzer via OvmsDev:
OK, I've got a new idea: CAN timing.
Comparing our esp32can bit timing to the esp-idf driver's, there seem to be some differences: https://github.com/espressif/esp-idf/blob/master/components/hal/include/hal/...
Transceivers are normally tolerant to small timing offsets. Maybe being off a little bit has no effect under normal conditions, but it has when the transceiver has to cope with a filled RX queue. That could be causing the transceiver to slide just out of sync. If the timing gets garbled, the transceiver would signal errors in the packets to the bus, possibly so many the vehicle ECUs decide to raise an error condition.
Is that plausible?
On why the new poller could be causing this (in combination with too slow processing by the vehicle): as mentioned, the standard CAN listener mechanism doesn't care about queue overflows. The poller does. `OvmsPollers::Queue_PollerFrame()` does a log call when Tx/Rx tracing is enabled, that could even block, but tracing is optional and only meant for debugging. Not optional is the overflow counting using an atomic uint32.
The atomic types are said to be fast, but I never checked their actual implementation on the ESP32. Maybe they can block as well?
@Simon: it would be an option to try commenting out the overflow counting, to see if that's causing the issue.
Regards, Michael
Am 17.01.25 um 15:37 schrieb Chris Box via OvmsDev:
Yes, I can confirm I've had one experience of the Leaf switching to Neutral while driving, with a yellow warning symbol on the dash. It refused to reselect Drive until I had switched the car off and back on. Derek wasn't so lucky and he need to clear fault codes before the car would work.
On returning home, I found OVMS was not accessible over a network. I didn't try a USB cable. Unplugging and reinserting the OBD cable caused OVMS to rejoin Wi-Fi. However the SD logs showed nothing from the time of the event. CAN writes are enabled, so it can perform SOC limiting.
My car has been using this firmware since 21st November, based on the git master of that day. As a relatively new user of OVMS (only since October) I don't have much experience of older firmware.
Perhaps a safeguard should be implemented before releasing a new stable firmware that will be automatically downloaded by Leaf owners. But I don't have the expertise to know what that safeguard should be. Derek's suggestion of 'only CAN write when parked' appears to be a good idea.
Chris
On 2025-01-15 18:18, Derek Caudwell via OvmsDev wrote:
Since the following email I have high confidence the issue on the Leaf is related/caused by the poller as there has been no further occurrence and Chris has also experienced the car going to neutral on the new poller firmware.
.... I haven't ruled out it being a fault with my car yet. Shortly after it faulted the car was run into so has been off the road for sometime, my first step was to replace 12V battery. The ovms unit is now unplugged and if it does not fault over the next month while driving I'll be reasonably confident it's ovms related. Not sure which firmware version the poller updates were included in but it was only after upgrading to it that the errors occurred (which could be coincidental however it has faulted twice more both on version 3.3.004-141-gf729d82c). For periods where I reverted to 3.3.003 it was fine. It might be useful to have an extra option on the enable can write to only enable it when the car is parked/charging.
_______________________________________________ OvmsDev mailing list OvmsDev@lists.openvehicles.com http://lists.openvehicles.com/mailman/listinfo/ovmsdev
-- Michael Balzer * Am Rahmen 5 * D-58313 Herdecke Fon 02330 9104094 * Handy 0176 20698926
_______________________________________________ OvmsDev mailing list OvmsDev@lists.openvehicles.com http://lists.openvehicles.com/mailman/listinfo/ovmsdev
-- Michael Balzer * Am Rahmen 5 * D-58313 Herdecke Fon 02330 9104094 * Handy 0176 20698926
_______________________________________________ OvmsDev mailing list OvmsDev@lists.openvehicles.com http://lists.openvehicles.com/mailman/listinfo/ovmsdev
_______________________________________________ OvmsDev mailing list OvmsDev@lists.openvehicles.com http://lists.openvehicles.com/mailman/listinfo/ovmsdev
_______________________________________________ OvmsDev mailing list OvmsDev@lists.openvehicles.com http://lists.openvehicles.com/mailman/listinfo/ovmsdev
_______________________________________________ OvmsDev mailing list OvmsDev@lists.openvehicles.com http://lists.openvehicles.com/mailman/listinfo/ovmsdev
-- Michael Balzer * Am Rahmen 5 * D-58313 Herdecke Fon 02330 9104094 * Handy 0176 20698926
OK, here's my analysis & comparison of our 125 kbit timing for the MCP2515: We currently use: mcp2515::Start() […] case CAN_SPEED_125KBPS: cnf1=0x03; cnf2=0xf0; cnf3=0x86; // BRP=3, PRSEG=0, PS1=6, PS2=6, SJW=0, BTLMODE=1, SAM=1, SOF=1, WAKFIL=0 → Sample point at 9/16 = 56,25% break; That results in this timing, with a very early sample point and a narrow sync jump width of 500 ns: The Arduino MCP_CAN library uses this config: #define MCP_16MHz_125kBPS_CFG1 (0x43) /* Increased SJW */ #define MCP_16MHz_125kBPS_CFG2 (0xE5) #define MCP_16MHz_125kBPS_CFG3 (0x83) /* Sample point at 75% */ Which results in this timing: This sets the sample point later and doubles the SJW. This has The CiA recommendation of sampling at 87.5% and SJW 2 would require this config: case CAN_SPEED_125KBPS: cnf1=0x43; cnf2=0xbc; cnf3=0x81; Timing: IOW, our timing seems to be quite far off. The 125 kbit configuration is only used by the Tesla Model S adapter currently, maybe it's OK for the Tesla, but not generally? @Mark, do you remember where you got the MCP 125 kbit timing from? (introduced in commit eb78f8ec8509fe20f501bfb4946e809d29e2bb1d) @Simon, you could test these alternative setups on can2: a) // CiA recommendation: PROP=5, PS1=8, PS2=2, SJW=2, sampling 1x @87.5% cnf1=0x43; cnf2=0xbc; cnf3=0x81; b) // Arduino MCP_CAN: PROP=6, PS1=5, PS2=4, SJW=2, sampling 3x @75%: cnf1=0x43; cnf2=0xe5; cnf3=0x83; Regards, Michael Am 19.01.25 um 13:39 schrieb Simon Ehlen via OvmsDev:
Hi,
Am 19.01.2025 um 12:48 schrieb Michael Balzer via OvmsDev:
Regarding CAN timing, our ESP32CAN/SJA1000 configuration is mostly according to the SAE/CiA recommendations, with one exception: we generally enable multi (triple) sampling, regardless of the bus speed:
esp32can::InitController(): […] /* Set sampling * 1 -> triple; the bus is sampled three times; recommended for low/medium speed buses (class A and B) where filtering spikes on the bus line is beneficial * 0 -> single; the bus is sampled once; recommended for high speed buses (SAE class C)*/ MODULE_ESP32CAN->BTR1.B.SAM=0x1;
SAE defines "high speed" (class C) as speeds >= 125 kbit/s. See SAE J2284-1, -2 & -3, section 6.10.8 Data Sample Mode: "The data sampling shall always be set to single sample mode."
If setting SAM=0 for 500 kbit/s, our timing setup is exactly as recommended by two tested SJA1000 timing calculators on the web.
Maybe we should give that a try? I.e.
MODULE_ESP32CAN->BTR1.B.SAM = (MyESP32can->m_speed < CAN_SPEED_125KBPS) ? 1 : 0;
Simon, can you try if that helps?
I have adjusted the corresponding line. I will check tomorrow whether this has an effect on the active mode. I tried your recommendation and set the CONFIG_OVMS_VEHICLE_CAN_RX_QUEUE_SIZE to both 200 and 400. I have not yet checked whether the bus also crashes in active mode. However, I can see in listening mode that when I abort a running loading process (there are currently no overflows), many overflow messages are received.
But as you also use can2, I wouldn't rule out a timing issue with the MCP2515 configuration. At which speed do you have can2, and did you have some indication from the vehicle error codes regarding a specific bus? RegisterCanBus(1, CAN_MODE_LISTEN, CAN_SPEED_500KBPS); RegisterCanBus(2, CAN_MODE_LISTEN, CAN_SPEED_125KBPS); I do not receive any feedback from the car as to which bus is affected, unfortunately no error code is saved for the incident. Do you have the option of specifying the affected bus in the overflow logging?
Cheers, Simon
Am 17.01.25 um 17:49 schrieb Michael Balzer via OvmsDev:
OK, I've got a new idea: CAN timing.
Comparing our esp32can bit timing to the esp-idf driver's, there seem to be some differences: https://github.com/espressif/esp-idf/blob/master/components/hal/include/hal/...
Transceivers are normally tolerant to small timing offsets. Maybe being off a little bit has no effect under normal conditions, but it has when the transceiver has to cope with a filled RX queue. That could be causing the transceiver to slide just out of sync. If the timing gets garbled, the transceiver would signal errors in the packets to the bus, possibly so many the vehicle ECUs decide to raise an error condition.
Is that plausible?
On why the new poller could be causing this (in combination with too slow processing by the vehicle): as mentioned, the standard CAN listener mechanism doesn't care about queue overflows. The poller does. `OvmsPollers::Queue_PollerFrame()` does a log call when Tx/Rx tracing is enabled, that could even block, but tracing is optional and only meant for debugging. Not optional is the overflow counting using an atomic uint32.
The atomic types are said to be fast, but I never checked their actual implementation on the ESP32. Maybe they can block as well?
@Simon: it would be an option to try commenting out the overflow counting, to see if that's causing the issue.
Regards, Michael
Am 17.01.25 um 15:37 schrieb Chris Box via OvmsDev:
Yes, I can confirm I've had one experience of the Leaf switching to Neutral while driving, with a yellow warning symbol on the dash. It refused to reselect Drive until I had switched the car off and back on. Derek wasn't so lucky and he need to clear fault codes before the car would work.
On returning home, I found OVMS was not accessible over a network. I didn't try a USB cable. Unplugging and reinserting the OBD cable caused OVMS to rejoin Wi-Fi. However the SD logs showed nothing from the time of the event. CAN writes are enabled, so it can perform SOC limiting.
My car has been using this firmware since 21st November, based on the git master of that day. As a relatively new user of OVMS (only since October) I don't have much experience of older firmware.
Perhaps a safeguard should be implemented before releasing a new stable firmware that will be automatically downloaded by Leaf owners. But I don't have the expertise to know what that safeguard should be. Derek's suggestion of 'only CAN write when parked' appears to be a good idea.
Chris
On 2025-01-15 18:18, Derek Caudwell via OvmsDev wrote:
Since the following email I have high confidence the issue on the Leaf is related/caused by the poller as there has been no further occurrence and Chris has also experienced the car going to neutral on the new poller firmware.
.... I haven't ruled out it being a fault with my car yet. Shortly after it faulted the car was run into so has been off the road for sometime, my first step was to replace 12V battery. The ovms unit is now unplugged and if it does not fault over the next month while driving I'll be reasonably confident it's ovms related. Not sure which firmware version the poller updates were included in but it was only after upgrading to it that the errors occurred (which could be coincidental however it has faulted twice more both on version 3.3.004-141-gf729d82c). For periods where I reverted to 3.3.003 it was fine. It might be useful to have an extra option on the enable can write to only enable it when the car is parked/charging.
_______________________________________________ OvmsDev mailing list OvmsDev@lists.openvehicles.com http://lists.openvehicles.com/mailman/listinfo/ovmsdev
-- Michael Balzer * Am Rahmen 5 * D-58313 Herdecke Fon 02330 9104094 * Handy 0176 20698926
_______________________________________________ OvmsDev mailing list OvmsDev@lists.openvehicles.com http://lists.openvehicles.com/mailman/listinfo/ovmsdev
-- Michael Balzer * Am Rahmen 5 * D-58313 Herdecke Fon 02330 9104094 * Handy 0176 20698926
_______________________________________________ OvmsDev mailing list OvmsDev@lists.openvehicles.com http://lists.openvehicles.com/mailman/listinfo/ovmsdev
_______________________________________________ OvmsDev mailing list OvmsDev@lists.openvehicles.com http://lists.openvehicles.com/mailman/listinfo/ovmsdev
-- Michael Balzer * Am Rahmen 5 * D-58313 Herdecke Fon 02330 9104094 * Handy 0176 20698926
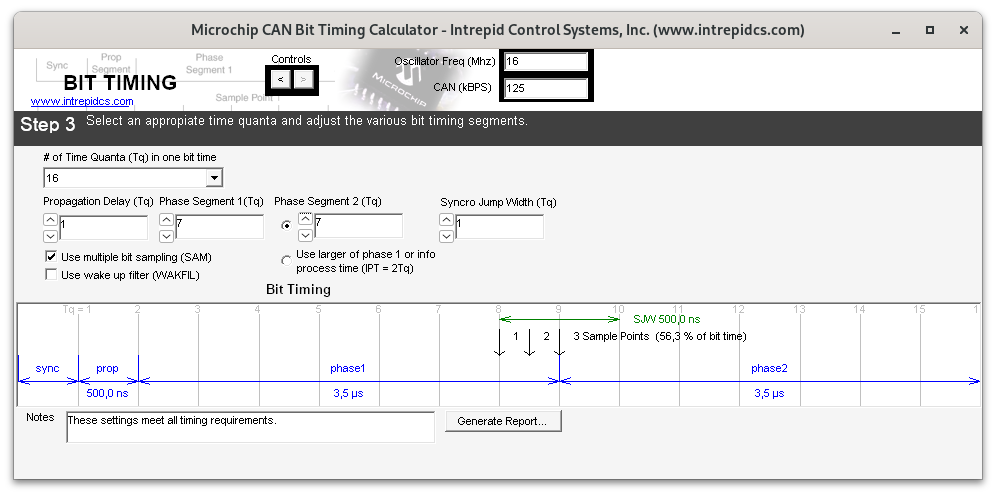
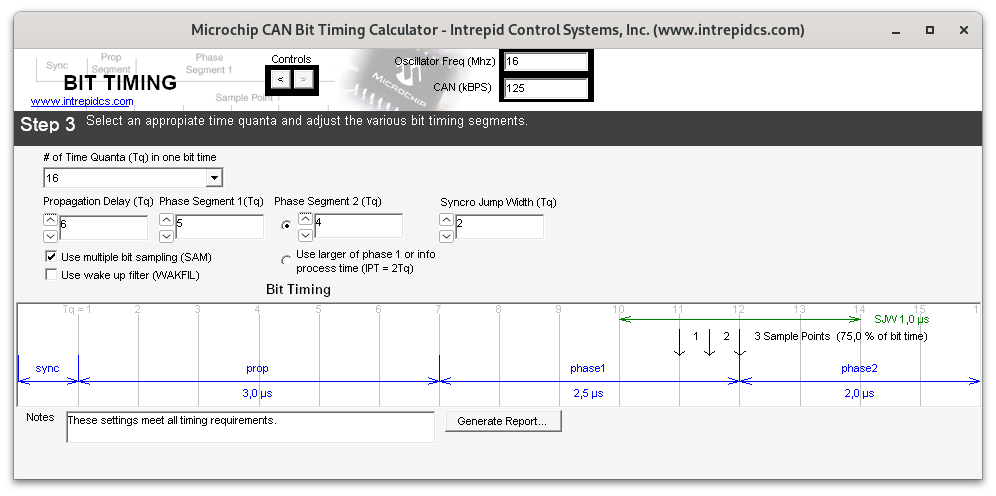
@Mark, do you remember where you got the MCP 125 kbit timing from? (introduced in commit eb78f8ec8509fe20f501bfb4946e809d29e2bb1d)
Sorry, I can’t remember. I would either have been from some other open source driver, or from an online calculator. I think it would be probably safe to go with the Arduino library settings, as that library should have had extensive real world use. So long as they use the same oscillator as us. Regards, Mark.
On 19 Jan 2025, at 9:54 PM, Michael Balzer via OvmsDev <ovmsdev@lists.openvehicles.com> wrote:
Signed PGP part OK, here's my analysis & comparison of our 125 kbit timing for the MCP2515:
We currently use:
mcp2515::Start() […] case CAN_SPEED_125KBPS: cnf1=0x03; cnf2=0xf0; cnf3=0x86; // BRP=3, PRSEG=0, PS1=6, PS2=6, SJW=0, BTLMODE=1, SAM=1, SOF=1, WAKFIL=0 → Sample point at 9/16 = 56,25% break;
That results in this timing, with a very early sample point and a narrow sync jump width of 500 ns: <125kbit-ovms-current-03-f0-86.png>
The Arduino MCP_CAN library uses this config: #define MCP_16MHz_125kBPS_CFG1 (0x43) /* Increased SJW */ #define MCP_16MHz_125kBPS_CFG2 (0xE5) #define MCP_16MHz_125kBPS_CFG3 (0x83) /* Sample point at 75% */
Which results in this timing: <125kbit-arduino-mcp-can-43-e5-83.png>
This sets the sample point later and doubles the SJW. This has
The CiA recommendation of sampling at 87.5% and SJW 2 would require this config: case CAN_SPEED_125KBPS: cnf1=0x43; cnf2=0xbc; cnf3=0x81;
Timing: <125kbit-cia-recommend-43-bc-81.png>
IOW, our timing seems to be quite far off.
The 125 kbit configuration is only used by the Tesla Model S adapter currently, maybe it's OK for the Tesla, but not generally?
@Mark, do you remember where you got the MCP 125 kbit timing from? (introduced in commit eb78f8ec8509fe20f501bfb4946e809d29e2bb1d)
@Simon, you could test these alternative setups on can2:
a) // CiA recommendation: PROP=5, PS1=8, PS2=2, SJW=2, sampling 1x @87.5% cnf1=0x43; cnf2=0xbc; cnf3=0x81;
b) // Arduino MCP_CAN: PROP=6, PS1=5, PS2=4, SJW=2, sampling 3x @75%: cnf1=0x43; cnf2=0xe5; cnf3=0x83;
Regards, Michael
Am 19.01.25 um 13:39 schrieb Simon Ehlen via OvmsDev:
Hi,
Am 19.01.2025 um 12:48 schrieb Michael Balzer via OvmsDev:
Regarding CAN timing, our ESP32CAN/SJA1000 configuration is mostly according to the SAE/CiA recommendations, with one exception: we generally enable multi (triple) sampling, regardless of the bus speed:
esp32can::InitController(): […] /* Set sampling * 1 -> triple; the bus is sampled three times; recommended for low/medium speed buses (class A and B) where filtering spikes on the bus line is beneficial * 0 -> single; the bus is sampled once; recommended for high speed buses (SAE class C)*/ MODULE_ESP32CAN->BTR1.B.SAM=0x1;
SAE defines "high speed" (class C) as speeds >= 125 kbit/s. See SAE J2284-1, -2 & -3, section 6.10.8 Data Sample Mode: "The data sampling shall always be set to single sample mode."
If setting SAM=0 for 500 kbit/s, our timing setup is exactly as recommended by two tested SJA1000 timing calculators on the web.
Maybe we should give that a try? I.e.
MODULE_ESP32CAN->BTR1.B.SAM = (MyESP32can->m_speed < CAN_SPEED_125KBPS) ? 1 : 0;
Simon, can you try if that helps?
I have adjusted the corresponding line. I will check tomorrow whether this has an effect on the active mode. I tried your recommendation and set the CONFIG_OVMS_VEHICLE_CAN_RX_QUEUE_SIZE to both 200 and 400. I have not yet checked whether the bus also crashes in active mode. However, I can see in listening mode that when I abort a running loading process (there are currently no overflows), many overflow messages are received.
But as you also use can2, I wouldn't rule out a timing issue with the MCP2515 configuration. At which speed do you have can2, and did you have some indication from the vehicle error codes regarding a specific bus? RegisterCanBus(1, CAN_MODE_LISTEN, CAN_SPEED_500KBPS); RegisterCanBus(2, CAN_MODE_LISTEN, CAN_SPEED_125KBPS); I do not receive any feedback from the car as to which bus is affected, unfortunately no error code is saved for the incident. Do you have the option of specifying the affected bus in the overflow logging?
Cheers, Simon
Am 17.01.25 um 17:49 schrieb Michael Balzer via OvmsDev:
OK, I've got a new idea: CAN timing.
Comparing our esp32can bit timing to the esp-idf driver's, there seem to be some differences: https://github.com/espressif/esp-idf/blob/master/components/hal/include/hal/...
Transceivers are normally tolerant to small timing offsets. Maybe being off a little bit has no effect under normal conditions, but it has when the transceiver has to cope with a filled RX queue. That could be causing the transceiver to slide just out of sync. If the timing gets garbled, the transceiver would signal errors in the packets to the bus, possibly so many the vehicle ECUs decide to raise an error condition.
Is that plausible?
On why the new poller could be causing this (in combination with too slow processing by the vehicle): as mentioned, the standard CAN listener mechanism doesn't care about queue overflows. The poller does. `OvmsPollers::Queue_PollerFrame()` does a log call when Tx/Rx tracing is enabled, that could even block, but tracing is optional and only meant for debugging. Not optional is the overflow counting using an atomic uint32.
The atomic types are said to be fast, but I never checked their actual implementation on the ESP32. Maybe they can block as well?
@Simon: it would be an option to try commenting out the overflow counting, to see if that's causing the issue.
Regards, Michael
Am 17.01.25 um 15:37 schrieb Chris Box via OvmsDev:
Yes, I can confirm I've had one experience of the Leaf switching to Neutral while driving, with a yellow warning symbol on the dash. It refused to reselect Drive until I had switched the car off and back on. Derek wasn't so lucky and he need to clear fault codes before the car would work.
On returning home, I found OVMS was not accessible over a network. I didn't try a USB cable. Unplugging and reinserting the OBD cable caused OVMS to rejoin Wi-Fi. However the SD logs showed nothing from the time of the event. CAN writes are enabled, so it can perform SOC limiting.
My car has been using this firmware since 21st November, based on the git master of that day. As a relatively new user of OVMS (only since October) I don't have much experience of older firmware.
Perhaps a safeguard should be implemented before releasing a new stable firmware that will be automatically downloaded by Leaf owners. But I don't have the expertise to know what that safeguard should be. Derek's suggestion of 'only CAN write when parked' appears to be a good idea.
Chris
On 2025-01-15 18:18, Derek Caudwell via OvmsDev wrote:
Since the following email I have high confidence the issue on the Leaf is related/caused by the poller as there has been no further occurrence and Chris has also experienced the car going to neutral on the new poller firmware.
.... I haven't ruled out it being a fault with my car yet. Shortly after it faulted the car was run into so has been off the road for sometime, my first step was to replace 12V battery. The ovms unit is now unplugged and if it does not fault over the next month while driving I'll be reasonably confident it's ovms related.
Not sure which firmware version the poller updates were included in but it was only after upgrading to it that the errors occurred (which could be coincidental however it has faulted twice more both on version 3.3.004-141-gf729d82c). For periods where I reverted to 3.3.003 it was fine.
It might be useful to have an extra option on the enable can write to only enable it when the car is parked/charging.
_______________________________________________ OvmsDev mailing list OvmsDev@lists.openvehicles.com <mailto:OvmsDev@lists.openvehicles.com> http://lists.openvehicles.com/mailman/listinfo/ovmsdev
-- Michael Balzer * Am Rahmen 5 * D-58313 Herdecke Fon 02330 9104094 * Handy 0176 20698926
_______________________________________________ OvmsDev mailing list OvmsDev@lists.openvehicles.com <mailto:OvmsDev@lists.openvehicles.com> http://lists.openvehicles.com/mailman/listinfo/ovmsdev
-- Michael Balzer * Am Rahmen 5 * D-58313 Herdecke Fon 02330 9104094 * Handy 0176 20698926
_______________________________________________ OvmsDev mailing list OvmsDev@lists.openvehicles.com <mailto:OvmsDev@lists.openvehicles.com> http://lists.openvehicles.com/mailman/listinfo/ovmsdev
_______________________________________________ OvmsDev mailing list OvmsDev@lists.openvehicles.com <mailto:OvmsDev@lists.openvehicles.com> http://lists.openvehicles.com/mailman/listinfo/ovmsdev
-- Michael Balzer * Am Rahmen 5 * D-58313 Herdecke Fon 02330 9104094 * Handy 0176 20698926 _______________________________________________ OvmsDev mailing list OvmsDev@lists.openvehicles.com <mailto:OvmsDev@lists.openvehicles.com> http://lists.openvehicles.com/mailman/listinfo/ovmsdev
Am 19.01.25 um 12:48 schrieb Michael Balzer via OvmsDev:
Maybe we should give that a try? I.e.
MODULE_ESP32CAN->BTR1.B.SAM = (MyESP32can->m_speed < CAN_SPEED_125KBPS) ? 1 : 0;
This change works flawlessly on my UpMiiGo (running can1 at 500 kbit/s). Regards, Michael -- Michael Balzer * Am Rahmen 5 * D-58313 Herdecke Fon 02330 9104094 * Handy 0176 20698926
I was too quick on this conclusion: Am 19.01.25 um 12:48 schrieb Michael Balzer via OvmsDev:
Regarding CAN timing, our ESP32CAN/SJA1000 configuration is mostly according to the SAE/CiA recommendations, with one exception: we generally enable multi (triple) sampling, regardless of the bus speed
I trusted this CAN timing tool: https://www.esacademy.com/en/library/calculators/sja1000-timing-calculator.h... …because it claims it applies the CiA recommendation. That turns out to either be not true or to be different from the SAE recommendation. I've had another look at the SAE J2284-3 spec. TL;DR: our sampling point is too late and our tolerance for timing variances of other devices on the bus is too low, at least for the usual 500 kbit/s bus speed. For 500 kbit/s, SAE J2284-3 defines SJW=3 and TSEG2=3 at tq=125ns, or SJW=3 and TSEG2=3…5 at tq=100ns, resulting in the sampling point being in the range 75-85%. Our driver currently uses tq=125ns with SJW=2 and TSEG2=2, sampling at 87.5%, so clearly outside the recommendation. The ESP-IDF driver configuration uses the tq=100ns setup, and places TSEG2 at 4: #define CAN_TIMING_CONFIG_500KBITS() {.brp = 8, .tseg_1 = 15, .tseg_2 = 4, .sjw = 3, .triple_sampling = false} → bus clock = .brp / 80 MHz → tq=100ns, with sampling at tq 16 of 20 = 80% -- this is exactly as recommended by SAE. I now test this configuration in my Mii, so far without issues. To test this timing, apply the attached patch, this also includes the SAE 500 kbit/s timing for can2/3. Regards, Michael -- Michael Balzer * Am Rahmen 5 * D-58313 Herdecke Fon 02330 9104094 * Handy 0176 20698926
Nice work. Thanks. Mark
On Jan 25, 2025, at 2:52 AM, Michael Balzer via OvmsDev <ovmsdev@lists.openvehicles.com> wrote:
I was too quick on this conclusion:
Am 19.01.25 um 12:48 schrieb Michael Balzer via OvmsDev: Regarding CAN timing, our ESP32CAN/SJA1000 configuration is mostly according to the SAE/CiA recommendations, with one exception: we generally enable multi (triple) sampling, regardless of the bus speed
I trusted this CAN timing tool: https://www.esacademy.com/en/library/calculators/sja1000-timing-calculator.h... …because it claims it applies the CiA recommendation. That turns out to either be not true or to be different from the SAE recommendation.
I've had another look at the SAE J2284-3 spec.
TL;DR: our sampling point is too late and our tolerance for timing variances of other devices on the bus is too low, at least for the usual 500 kbit/s bus speed.
For 500 kbit/s, SAE J2284-3 defines SJW=3 and TSEG2=3 at tq=125ns, or SJW=3 and TSEG2=3…5 at tq=100ns, resulting in the sampling point being in the range 75-85%.
Our driver currently uses tq=125ns with SJW=2 and TSEG2=2, sampling at 87.5%, so clearly outside the recommendation.
The ESP-IDF driver configuration uses the tq=100ns setup, and places TSEG2 at 4: #define CAN_TIMING_CONFIG_500KBITS() {.brp = 8, .tseg_1 = 15, .tseg_2 = 4, .sjw = 3, .triple_sampling = false} → bus clock = .brp / 80 MHz → tq=100ns, with sampling at tq 16 of 20 = 80% -- this is exactly as recommended by SAE.
I now test this configuration in my Mii, so far without issues.
To test this timing, apply the attached patch, this also includes the SAE 500 kbit/s timing for can2/3.
Regards, Michael
-- Michael Balzer * Am Rahmen 5 * D-58313 Herdecke Fon 02330 9104094 * Handy 0176 20698926
<can1-sae.diff> _______________________________________________ OvmsDev mailing list OvmsDev@lists.openvehicles.com http://lists.openvehicles.com/mailman/listinfo/ovmsdev
I think this is kinda what it's always done with Ioniq5, but this is with the timing patch applied.. if I go from State=0 .. so no polling which means NOTHING received on the CAN bus, to State=1 (Vehicle on - lotsa polling including every second) where it starts polling, I get: E (36101885) can: can1: intr=18642 rxpkt=11924 txpkt=6700 errflags=0x8000d9 rxerr=0 txerr=8 rxinval=0 rxovr=0 txovr=0 txdelay=0 txfail=1 wdgreset=0 errreset=1 E (36101885) can: can1: intr=18646 rxpkt=11924 txpkt=6700 errflags=0x8000d9 rxerr=0 txerr=40 rxinval=0 rxovr=0 txovr=0 txdelay=0 txfail=1 wdgreset=0 errreset=1 E (36101885) can: can1: intr=18648 rxpkt=11924 txpkt=6700 errflags=0x8000d9 rxerr=0 txerr=56 rxinval=0 rxovr=0 txovr=0 txdelay=0 txfail=1 wdgreset=0 errreset=1 E (36101885) can: can1: intr=18650 rxpkt=11924 txpkt=6700 errflags=0x8000d9 rxerr=0 txerr=72 rxinval=0 rxovr=0 txovr=0 txdelay=0 txfail=1 wdgreset=0 errreset=1 E (36101885) can: can1: intr=18652 rxpkt=11924 txpkt=6700 errflags=0x8000d9 rxerr=0 txerr=88 rxinval=0 rxovr=0 txovr=0 txdelay=0 txfail=1 wdgreset=0 errreset=1 E (36101885) can: can1: intr=18654 rxpkt=11924 txpkt=6700 errflags=0x8040d9 rxerr=0 txerr=104 rxinval=0 rxovr=0 txovr=0 txdelay=0 txfail=1 wdgreset=0 errreset=1 E (36101885) can: can1: intr=18655 rxpkt=11924 txpkt=6700 errflags=0x8040d9 rxerr=0 txerr=112 rxinval=0 rxovr=0 txovr=0 txdelay=0 txfail=1 wdgreset=0 errreset=1 E (36101885) can: can1: intr=18659 rxpkt=11924 txpkt=6700 errflags=0x204800 rxerr=0 txerr=128 rxinval=0 rxovr=0 txovr=0 txdelay=0 txfail=1 wdgreset=0 errreset=1 .... followed by E (36145665) esp32can: can1 stuck bus-off error state (errflags=0x00040c00) detected - resetting bus And then things seem to be good from there. I have bus 1 registered as active 500kbps *RegisterCanBus(1, CAN_MODE_ACTIVE, CAN_SPEED_500KBPS);* //.ichael On Sat, 25 Jan 2025 at 09:58, Mark Webb-Johnson via OvmsDev < ovmsdev@lists.openvehicles.com> wrote:
Nice work. Thanks.
Mark
On Jan 25, 2025, at 2:52 AM, Michael Balzer via OvmsDev < ovmsdev@lists.openvehicles.com> wrote:
I was too quick on this conclusion:
Am 19.01.25 um 12:48 schrieb Michael Balzer via OvmsDev: Regarding CAN timing, our ESP32CAN/SJA1000 configuration is mostly according to the SAE/CiA recommendations, with one exception: we generally enable multi (triple) sampling, regardless of the bus speed
I trusted this CAN timing tool: https://www.esacademy.com/en/library/calculators/sja1000-timing-calculator.h... …because it claims it applies the CiA recommendation. That turns out to either be not true or to be different from the SAE recommendation.
I've had another look at the SAE J2284-3 spec.
TL;DR: our sampling point is too late and our tolerance for timing variances of other devices on the bus is too low, at least for the usual 500 kbit/s bus speed.
For 500 kbit/s, SAE J2284-3 defines SJW=3 and TSEG2=3 at tq=125ns, or SJW=3 and TSEG2=3…5 at tq=100ns, resulting in the sampling point being in the range 75-85%.
Our driver currently uses tq=125ns with SJW=2 and TSEG2=2, sampling at 87.5%, so clearly outside the recommendation.
The ESP-IDF driver configuration uses the tq=100ns setup, and places TSEG2 at 4: #define CAN_TIMING_CONFIG_500KBITS() {.brp = 8, .tseg_1 = 15, .tseg_2 = 4, .sjw = 3, .triple_sampling = false} → bus clock = .brp / 80 MHz → tq=100ns, with sampling at tq 16 of 20 = 80% -- this is exactly as recommended by SAE.
I now test this configuration in my Mii, so far without issues.
To test this timing, apply the attached patch, this also includes the SAE 500 kbit/s timing for can2/3.
Regards, Michael
-- Michael Balzer * Am Rahmen 5 * D-58313 Herdecke Fon 02330 9104094 * Handy 0176 20698926
<can1-sae.diff> _______________________________________________ OvmsDev mailing list OvmsDev@lists.openvehicles.com http://lists.openvehicles.com/mailman/listinfo/ovmsdev
_______________________________________________ OvmsDev mailing list OvmsDev@lists.openvehicles.com http://lists.openvehicles.com/mailman/listinfo/ovmsdev
On 2025-01-24 18:52, Michael Balzer via OvmsDev wrote:
To test this timing, apply the attached patch, this also includes the SAE 500 kbit/s timing for can2/3.
Great detective work in spotting this! I've now deployed the patch, with both can buses active. Will report back how it goes. I've enabled the specific debug logging you recommended, including events. Although for the latter I've commented out server.web.socket.opened/closed as those events were spamming the log. If issues become apparent, either in the car or the log, I'll then try making just can1 (or can2) active. Thanks, Chris
Hi. Initial results after 27 miles on this new timing in the Leaf 2016. No in-car issues yet experienced. Stats are as below. OVMS# can can1 status CAN: can1 Mode: Active Speed: 500000 DBC: none Interrupts: 20760013 Rx pkt: 20753155 Rx ovrflw: 6 Tx pkt: 2983 Tx delays: 103 Tx ovrflw: 0 Tx fails: 2527 Err flags: 0x008040d9 Rx err: 0 Tx err: 128 Rx invalid: 0 Wdg Resets: 0 Wdg Timer: 6 sec(s) Err Resets: 1 OVMS# can can2 status CAN: can2 Mode: Active Speed: 500000 DBC: none Interrupts: 12559716 Rx pkt: 12581843 Rx ovrflw: 0 Tx pkt: 88 Tx delays: 0 Tx ovrflw: 0 Tx fails: 0 Err flags: 0x01000001 Rx err: 0 Tx err: 0 Rx invalid: 0 Wdg Resets: 0 Wdg Timer: 2 sec(s) Err Resets: 0 The logs show the usual mix of occasional can2 0x23401c01 & 0x22401c02 errors, indicating a busy state but not excessively so. I also saw 0x22001002 while driving this morning, in the middle of those others and a few minutes later when coming in range of home wifi. The few log messages for can1 are of a different nature. 0x8048d9 was logged twice last night while parked and locked, with nothing going on. And this morning, 5.5 seconds after CAR IS OFF, it reports: esp32can: can1 stuck bus-off error state (errflags=0x00040c00) detected - resetting bus I'll now set can1 into listen mode to see what difference that makes. Chris
Chris, those are normal stats for can1, and occasional stuck bus-off error logs are also normal, as those are a flaw in the ESP32 CAN hardware, or more specifically a workaround for the workaround for that hardware bug, as explained in the source (search for "TWAI_ERRATA_FIX_BUS_OFF_REC"). That's why you only see this log for can1, as the MCP2515 doesn't have that bug. The stuck bus-off mostly occurs when the module tries to transmit to an offline bus, so that matches it happening right after you turned the car off.
0x8048d9 was logged twice last night while parked and locked, with nothing going on
0x80 = IR.7 Bus Error Interrupt 0x48 = SR.6 Error Status (1=warning; error count >= 96) | SR.3 Transmission Complete Status (1=successful) 0xd9 = Stuff error during transmission in acknowledge slot segment That normally cannot / should not happen without a transmission attempt. So please verify there really was nothing going on. Maybe you didn't see the vehicle was actually active due to reduced log levels or missing log entries in the leaf code? There's the option the last TX frames were still waiting in the TX queue, issued when the car was switching off, but those would normally fail shortly after. The best option to capture anything going on with the bus over the night is activating an unfiltered can log to the SD card. When using crtd, that will also capture relevant events, errors and counter changes. The normal behaviour of a parked car is doing 12V battery maintenance every few hours, i.e. topping up the 12V battery from the main battery. That will normally also cause a limited CAN wakeup of the ECUs taking part in that process. Another option is some plugin or script doing a wakeup to query values. Yet another option is, the log entry wasn't caused by that error status, but by a counter change, e.g. txfail.
I'll now set can1 into listen mode to see what difference that makes.
That should only be done selectively if you still encounter car faults, to determine which bus possibly causes them. As you don't see any issues yet, proceed with both buses active to see if the new timing solved that. Regards, Michael Am 27.01.25 um 20:12 schrieb Chris Box via OvmsDev:
Hi.
Initial results after 27 miles on this new timing in the Leaf 2016. No in-car issues yet experienced. Stats are as below.
OVMS# can can1 status CAN: can1 Mode: Active Speed: 500000 DBC: none Interrupts: 20760013 Rx pkt: 20753155 Rx ovrflw: 6 Tx pkt: 2983 Tx delays: 103 Tx ovrflw: 0 Tx fails: 2527 Err flags: 0x008040d9 Rx err: 0 Tx err: 128 Rx invalid: 0 Wdg Resets: 0 Wdg Timer: 6 sec(s) Err Resets: 1 OVMS# can can2 status CAN: can2 Mode: Active Speed: 500000 DBC: none Interrupts: 12559716 Rx pkt: 12581843 Rx ovrflw: 0 Tx pkt: 88 Tx delays: 0 Tx ovrflw: 0 Tx fails: 0 Err flags: 0x01000001 Rx err: 0 Tx err: 0 Rx invalid: 0 Wdg Resets: 0 Wdg Timer: 2 sec(s) Err Resets: 0
The logs show the usual mix of occasional can2 0x23401c01 & 0x22401c02 errors, indicating a busy state but not excessively so. I also saw 0x22001002 while driving this morning, in the middle of those others and a few minutes later when coming in range of home wifi.
The few log messages for can1 are of a different nature. 0x8048d9 was logged twice last night while parked and locked, with nothing going on. And this morning, 5.5 seconds after CAR IS OFF, it reports:
esp32can: can1 stuck bus-off error state (errflags=0x00040c00) detected - resetting bus
I'll now set can1 into listen mode to see what difference that makes.
Chris
_______________________________________________ OvmsDev mailing list OvmsDev@lists.openvehicles.com http://lists.openvehicles.com/mailman/listinfo/ovmsdev
-- Michael Balzer * Am Rahmen 5 * D-58313 Herdecke Fon 02330 9104094 * Handy 0176 20698926
On 2025-01-27 21:50, Michael Balzer via OvmsDev wrote:
0x8048d9 was logged twice last night while parked and locked, with nothing going on
So please verify there really was nothing going on. Maybe you didn't see the vehicle was actually active due to reduced log levels or missing log entries in the leaf code?
Logging to SD card was globally at info level, except with debug for can, esp32can, mcp2515 & events. Here's all I saw: 2025-01-26 19:56:25.997 GMT I (92702057) housekeeping: 2025-01-26 19:56:25 GMT (RAM: 8b=79720-82596 32b=12560 SPI=3263128-3285676) 2025-01-26 20:01:25.997 GMT I (93002057) housekeeping: 2025-01-26 20:01:25 GMT (RAM: 8b=79720-82596 32b=12560 SPI=3263128-3285644) 2025-01-26 20:03:57.337 GMT E (93153387) can: can1: intr=4800273 rxpkt=4799065 txpkt=900 errflags=0x8048d9 rxerr=0 txerr=128 rxinval=0 rxovr=5 txovr=0 txdelay=51 txfail=281 wdgreset=0 errreset=0 2025-01-26 20:03:58.337 GMT E (93154387) can: can1: intr=4800319 rxpkt=4799065 txpkt=901 errflags=0x8048d9 rxerr=0 txerr=135 rxinval=0 rxovr=5 txovr=0 txdelay=51 txfail=282 wdgreset=0 errreset=0 2025-01-26 20:06:05.337 GMT E (93281387) can: can1: intr=4800334 rxpkt=4799065 txpkt=902 errflags=0x8048d9 rxerr=0 txerr=134 rxinval=0 rxovr=5 txovr=0 txdelay=51 txfail=289 wdgreset=0 errreset=0 2025-01-26 20:06:26.007 GMT I (93302057) housekeeping: 2025-01-26 20:06:25 GMT (RAM: 8b=79720-82596 32b=12560 SPI=3263128-3285676) 2025-01-26 20:11:25.997 GMT I (93602057) housekeeping: 2025-01-26 20:11:25 GMT (RAM: 8b=79720-82596 32b=12560 SPI=3263128-3285612) 2025-01-26 23:16:26.017 GMT I (104702057) housekeeping: 2025-01-26 23:16:25 GMT (RAM: 8b=79720-82596 32b=12560 SPI=3263128-3285488) 2025-01-26 23:21:26.017 GMT I (105002057) housekeeping: 2025-01-26 23:21:25 GMT (RAM: 8b=79720-82596 32b=12560 SPI=3263128-3285456) 2025-01-26 23:23:04.347 GMT E (105100387) can: can1: intr=4801533 rxpkt=4799065 txpkt=903 errflags=0x8048d9 rxerr=0 txerr=131 rxinval=0 rxovr=5 txovr=0 txdelay=51 txfail=888 wdgreset=0 errreset=0 2025-01-26 23:26:26.017 GMT I (105302057) housekeeping: 2025-01-26 23:26:25 GMT (RAM: 8b=79720-82596 32b=12560 SPI=3263128-3285488) 2025-01-26 23:31:26.017 GMT I (105602057) housekeeping: 2025-01-26 23:31:25 GMT (RAM: 8b=79720-82596 32b=12560 SPI=3263128-3285456)
The best option to capture anything going on with the bus over the night is activating an unfiltered can log to the SD card.
Do you mean setting the global log level to verbose?
The normal behaviour of a parked car is doing 12V battery maintenance every few hours, i.e. topping up the 12V battery from the main battery. That will normally also cause a limited CAN wakeup of the ECUs taking part in that process.
With the MQTT metrics I observe charging of 12V ceased at 18:40. The battery then went into gradual decline starting at 12.8V until it reached 12.4V the next morning.
Another option is some plugin or script doing a wakeup to query values.
The only activity I have is an MQTT idle update interval of 10 minutes. Overnight this just sends things like free memory, 12V voltage and signal strength.
As you don't see any issues yet, proceed with both buses active to see if the new timing solved that.
Both buses now set to active. Thanks Chris
Chris,
The best option to capture anything going on with the bus over the night is activating an unfiltered can log to the SD card. Do you mean setting the global log level to verbose?
No, I mean activating a CAN logger. You can simply start one on the monitor channel, which outputs the CAN log to the system log: OVMS# log level verbose canlog-monitor OVMS# can log start monitor crtd For more info on CAN logging, see the user guide: https://docs.openvehicles.com/en/latest/crtd/can_logging.html I've now added output of the TX queue fill level to the CAN status outputs, that should help identifying the effect. Hint: you can use "git pull --rebase --autostash" to merge this with your local changes. On my UpMiiGo (which switches off the bus), the ESP32CAN most of the time recognizes an immediate failure for a TX with the vehicle being off. That means the TX buffer (in the controller) gets cleared immediately, with an immediate "TX_Fail" result for the frame. Ideally that would be the case always while the bus is off. But the ESP32CAN controller sometimes tries to send the frame, waiting for an ack, repeating the transmission and then ending up in the frame being stuck in the TX buffer. Then the TX queue (software) gets filled with the status ping request frame from there, up to the 30 frames capacity of the TX queue, then counting TX overflows. This continues until the ESP32CAN, due to unknown reasons, thinks it could send the frame. The TX queue then gets flushed immediately, with the frames appearing as being sent successfully (although there is no ECU active, the bus is still off). After the queue has been cleared, this loop starts over. So it may happen, that the TX queue gets filled, and the ESP32CAN thinks it can send frames, even while the bus is shut off. Reading the Leaf code, I don't see any regular status ping polling, but it may still be, the Leaf queued some TX packets just before switching off the vehicle. Those would stick in the queue until the ESP32CAN enters the state described above, so actually tries to send the frames queued. You should be able to determine if that's the case from the TX fill level being logged & displayed in the status output. Regards, Michael Am 28.01.25 um 00:20 schrieb Chris Box:
On 2025-01-27 21:50, Michael Balzer via OvmsDev wrote:
0x8048d9 was logged twice last night while parked and locked, with nothing going on
So please verify there really was nothing going on. Maybe you didn't see the vehicle was actually active due to reduced log levels or missing log entries in the leaf code? Logging to SD card was globally at info level, except with debug for can, esp32can, mcp2515 & events. Here's all I saw:
2025-01-26 19:56:25.997 GMT I (92702057) housekeeping: 2025-01-26 19:56:25 GMT (RAM: 8b=79720-82596 32b=12560 SPI=3263128-3285676) 2025-01-26 20:01:25.997 GMT I (93002057) housekeeping: 2025-01-26 20:01:25 GMT (RAM: 8b=79720-82596 32b=12560 SPI=3263128-3285644) 2025-01-26 20:03:57.337 GMT E (93153387) can: can1: intr=4800273 rxpkt=4799065 txpkt=900 errflags=0x8048d9 rxerr=0 txerr=128 rxinval=0 rxovr=5 txovr=0 txdelay=51 txfail=281 wdgreset=0 errreset=0 2025-01-26 20:03:58.337 GMT E (93154387) can: can1: intr=4800319 rxpkt=4799065 txpkt=901 errflags=0x8048d9 rxerr=0 txerr=135 rxinval=0 rxovr=5 txovr=0 txdelay=51 txfail=282 wdgreset=0 errreset=0 2025-01-26 20:06:05.337 GMT E (93281387) can: can1: intr=4800334 rxpkt=4799065 txpkt=902 errflags=0x8048d9 rxerr=0 txerr=134 rxinval=0 rxovr=5 txovr=0 txdelay=51 txfail=289 wdgreset=0 errreset=0 2025-01-26 20:06:26.007 GMT I (93302057) housekeeping: 2025-01-26 20:06:25 GMT (RAM: 8b=79720-82596 32b=12560 SPI=3263128-3285676) 2025-01-26 20:11:25.997 GMT I (93602057) housekeeping: 2025-01-26 20:11:25 GMT (RAM: 8b=79720-82596 32b=12560 SPI=3263128-3285612)
2025-01-26 23:16:26.017 GMT I (104702057) housekeeping: 2025-01-26 23:16:25 GMT (RAM: 8b=79720-82596 32b=12560 SPI=3263128-3285488) 2025-01-26 23:21:26.017 GMT I (105002057) housekeeping: 2025-01-26 23:21:25 GMT (RAM: 8b=79720-82596 32b=12560 SPI=3263128-3285456) 2025-01-26 23:23:04.347 GMT E (105100387) can: can1: intr=4801533 rxpkt=4799065 txpkt=903 errflags=0x8048d9 rxerr=0 txerr=131 rxinval=0 rxovr=5 txovr=0 txdelay=51 txfail=888 wdgreset=0 errreset=0 2025-01-26 23:26:26.017 GMT I (105302057) housekeeping: 2025-01-26 23:26:25 GMT (RAM: 8b=79720-82596 32b=12560 SPI=3263128-3285488) 2025-01-26 23:31:26.017 GMT I (105602057) housekeeping: 2025-01-26 23:31:25 GMT (RAM: 8b=79720-82596 32b=12560 SPI=3263128-3285456)
The best option to capture anything going on with the bus over the night is activating an unfiltered can log to the SD card.
Do you mean setting the global log level to verbose?
The normal behaviour of a parked car is doing 12V battery maintenance every few hours, i.e. topping up the 12V battery from the main battery. That will normally also cause a limited CAN wakeup of the ECUs taking part in that process. With the MQTT metrics I observe charging of 12V ceased at 18:40. The batterythen went into gradual decline starting at 12.8V until it reached 12.4V the next morning. Another option is some plugin or script doing a wakeup to query values. The only activity I have is an MQTT idle update interval of 10 minutes. Overnight this just sends things like free memory, 12V voltage and signal strength. As you don't see any issues yet, proceed with both buses active to see if the new timing solved that. Both buses now set to active.
Thanks Chris
-- Michael Balzer * Am Rahmen 5 * D-58313 Herdecke Fon 02330 9104094 * Handy 0176 20698926
On 2025-01-28 19:12, Michael Balzer wrote:
The best option to capture anything going on with the bus over the night is activating an unfiltered can log to the SD card.
Do you mean setting the global log level to verbose?
No, I mean activating a CAN logger.
For more info on CAN logging, see the user guide: https://docs.openvehicles.com/en/latest/crtd/can_logging.html
Ah, sorry. I had looked through the Developer Guide google doc, but not investigated this part of the website.
I've now added output of the TX queue fill level to the CAN status outputs, that should help identifying the effect. Hint: you can use "git pull --rebase --autostash" to merge this with your local changes.
Reading the Leaf code, I don't see any regular status ping polling, but it may still be, the Leaf queued some TX packets just before switching off the vehicle. Those would stick in the queue until the ESP32CAN enters the state described above, so actually tries to send the frames queued.
You should be able to determine if that's the case from the TX fill level being logged & displayed in the status output.
Thanks. I ran this code overnight, and recorded a crtd log. It shows no can messages at all between 23:09 and 05:50. The system log was similarly quiet, with nothing at all between 23:08 and 05:50. What happened at 05:50 was Signal(vehicle.charge.pilot.on), although the vehicle was plugged in all night. I've driven the car this morning, and so far I haven't seen any log messages with a non-zero txqueue value. I'll keep looking. Chris
Hi everyone, On 2025-01-28 19:12, Michael Balzer wrote:
Reading the Leaf code, I don't see any regular status ping polling,
Actually there is some defined polling of BMS: static const OvmsPoller::poll_pid_t obdii_polls[] = { // BUS 2 { CHARGER_TXID, CHARGER_RXID, VEHICLE_POLL_TYPE_OBDIIGROUP, VIN_PID, { 0, 900, 0, 0 }, 2, ISOTP_STD }, // VIN [19] { CHARGER_TXID, CHARGER_RXID, VEHICLE_POLL_TYPE_OBDIIEXTENDED, QC_COUNT_PID, { 0, 900, 0, 0 }, 2, ISOTP_STD }, // QC [2] { CHARGER_TXID, CHARGER_RXID, VEHICLE_POLL_TYPE_OBDIIEXTENDED, L1L2_COUNT_PID, { 0, 900, 0, 0 }, 2, ISOTP_STD }, // L0/L1/L2 [2] // BUS 1 { BMS_TXID, BMS_RXID, VEHICLE_POLL_TYPE_OBDIIGROUP, 0x01, { 0, 60, 0, 60 }, 1, ISOTP_STD }, // bat [39/41] { BMS_TXID, BMS_RXID, VEHICLE_POLL_TYPE_OBDIIGROUP, 0x02, { 0, 60, 0, 60 }, 1, ISOTP_STD }, // battery voltages [196] { BMS_TXID, BMS_RXID, VEHICLE_POLL_TYPE_OBDIIGROUP, 0x06, { 0, 60, 0, 60 }, 1, ISOTP_STD }, // battery shunts [96] { BMS_TXID, BMS_RXID, VEHICLE_POLL_TYPE_OBDIIGROUP, 0x04, { 0, 300, 0, 300 }, 1, ISOTP_STD }, // battery temperatures [14] POLL_LIST_END }; BMS_TXID is 0x79B, and this is mostly what I see appearing in CRTD overnight: 1738275829.012407 CXX OVMS CRTD 1738275829.012407 CVR 3.1 1738275829.020355 1CXX Info Type:vfs Format:crtd(discard) Vehicle:NL Path:/sd/can4.crtd 1738275879.419663 1CER TX_Fail T11 79B 02 21 01 55 55 55 55 55 1738275880.419598 1CER TX_Fail T11 79B 02 21 02 55 55 55 55 55 1738275881.419606 1CER TX_Fail T11 79B 02 21 06 55 55 55 55 55 1738275942.419724 1CER TX_Fail T11 79B 02 21 01 55 55 55 55 55 1738275943.419618 1CER TX_Fail T11 79B 02 21 02 55 55 55 55 55 1738275944.419611 1CER TX_Fail T11 79B 02 21 06 55 55 55 55 55 1738276005.419663 1CER TX_Fail T11 79B 02 21 01 55 55 55 55 55 1738276006.419606 1CER TX_Fail T11 79B 02 21 02 55 55 55 55 55 The first night, that was everything I saw until a charge pilot event woke the car up at 05:50. The second night, at 03:46 there were two records of apparently successful transmits, which coincides with errors being logged. 1738381606.559723 1CER TX_Fail T11 79B 02 21 01 55 55 55 55 55 1738381607.560118 1CER TX_Fail T11 79B 02 21 02 55 55 55 55 55 1738381607.561672 1CER Error intr=32898937 rxpkt=32886195 txpkt=4872 errflags=0x204c00 rxerr=0 txerr=127 rxinval=0 rxovr=3 txovr=0 txdelay=213 txfail=5411 wdgreset=0 errreset=5 txqueue=0 1738381607.561766 1T11 79B 02 21 02 55 55 55 55 55 1738381607.561816 1CST Status intr=32898937 rxpkt=32886195 txpkt=4873 errflags=0x204c00 rxerr=0 txerr=127 rxinval=0 rxovr=3 txovr=0 txdelay=213 txfail=5411 wdgreset=0 errreset=5 txqueue=0 1738381608.559656 1CER TX_Fail T11 79B 02 21 06 55 55 55 55 55 1738381608.559819 1CST Status intr=32898940 rxpkt=32886195 txpkt=4873 errflags=0x8048d9 rxerr=0 txerr=135 rxinval=0 rxovr=3 txovr=0 txdelay=213 txfail=5412 wdgreset=0 errreset=5 txqueue=0 1738381608.561065 1CER Error intr=32898943 rxpkt=32886195 txpkt=4873 errflags=0x8048d9 rxerr=0 txerr=134 rxinval=0 rxovr=3 txovr=0 txdelay=213 txfail=5412 wdgreset=0 errreset=5 txqueue=0 1738381608.561163 1T11 79B 02 21 06 55 55 55 55 55 1738381669.559719 1CER TX_Fail T11 79B 02 21 01 55 55 55 55 55 1738381670.559655 1CER TX_Fail T11 79B 02 21 02 55 55 55 55 55 The above activity is what creates records in the otherwise-quiet system log: 2025-02-01 03:46:48.272 GMT E (189607402) can: can1: intr=32898936 rxpkt=32886195 txpkt=4872 errflags=0x8048d9 rxerr=0 txerr=128 rxinval=0 rxovr=3 txovr=0 txdelay=213 txfail=5411 wdgreset=0 er rreset=5 txqueue=0 2025-02-01 03:46:49.272 GMT E (189608402) can: can1: intr=32898940 rxpkt=32886195 txpkt=4873 errflags=0x8048d9 rxerr=0 txerr=135 rxinval=0 rxovr=3 txovr=0 txdelay=213 txfail=5412 wdgreset=0 er rreset=5 txqueue=0 It fits well with your description below, although in these nights I didn't see any queuing. Just a small probability of thinking it can send a frame on a bus that's off.
On my UpMiiGo (which switches off the bus), the ESP32CAN most of the time recognizes an immediate failure for a TX with the vehicle being off. That means the TX buffer (in the controller) gets cleared immediately, with an immediate "TX_Fail" result for the frame. Ideally that would be the case always while the bus is off.
But the ESP32CAN controller sometimes tries to send the frame, waiting for an ack, repeating the transmission and then ending up in the frame being stuck in the TX buffer. Then the TX queue (software) gets filled with the status ping request frame from there, up to the 30 frames capacity of the TX queue, then counting TX overflows.
This continues until the ESP32CAN, due to unknown reasons, thinks it could send the frame. The TX queue then gets flushed immediately, with the frames appearing as being sent successfully (although there is no ECU active, the bus is still off).
After the queue has been cleared, this loop starts over.
So it may happen, that the TX queue gets filled, and the ESP32CAN thinks it can send frames, even while the bus is shut off.
On the third night the crtd log says it tried to send BMS polls at 23:37, 23:39, 00:00 and 00:02. 1738452975.674976 1CER TX_Fail T11 79B 02 21 06 55 55 55 55 55 1738453036.675613 1CER TX_Fail T11 79B 02 21 01 55 55 55 55 55 1738453036.677195 1CER Error intr=41628672 rxpkt=41612603 txpkt=6073 errflags=0x8048d9 rxerr=0 txerr=128 rxinval=0 rxovr=3 txovr=0 txdelay=259 txfail=6847 wdgreset=0 errreset=7 txqueue=0 1738453036.686582 1T11 79B 02 21 01 55 55 55 55 55 1738453036.686690 1CST Status intr=41628708 rxpkt=41612603 txpkt=6074 errflags=0x204c00 rxerr=0 txerr=127 rxinval=0 rxovr=3 txovr=0 txdelay=259 txfail=6847 wdgreset=0 errreset=7 txqueue=0 1738453037.674988 1CER TX_Fail T11 79B 02 21 02 55 55 55 55 55 1738453037.675148 1CST Status intr=41628711 rxpkt=41612603 txpkt=6074 errflags=0x8048d9 rxerr=0 txerr=135 rxinval=0 rxovr=3 txovr=0 txdelay=259 txfail=6848 wdgreset=0 errreset=7 txqueue=0 1738453037.676306 1CER Error intr=41628714 rxpkt=41612603 txpkt=6074 errflags=0x8048d9 rxerr=0 txerr=134 rxinval=0 rxovr=3 txovr=0 txdelay=259 txfail=6848 wdgreset=0 errreset=7 txqueue=0 1738453037.676389 1T11 79B 02 21 02 55 55 55 55 55 1738453038.674985 1CER TX_Fail T11 79B 02 21 06 55 55 55 55 55 1738453164.675494 1CER TX_Fail T11 79B 02 21 02 55 55 55 55 55 1738453164.676968 1CER Error intr=41628729 rxpkt=41612603 txpkt=6075 errflags=0x8048d9 rxerr=0 txerr=133 rxinval=0 rxovr=3 txovr=0 txdelay=259 txfail=6855 wdgreset=0 errreset=7 txqueue=0 1738453164.677076 1T11 79B 02 21 02 55 55 55 55 55 1738453165.675001 1CER TX_Fail T11 79B 02 21 06 55 55 55 55 55 1738454366.674962 1CER TX_Fail T11 79B 02 21 04 55 55 55 55 55 1738454427.675572 1CER TX_Fail T11 79B 02 21 01 55 55 55 55 55 1738454427.677047 1CER Error intr=41628861 rxpkt=41612603 txpkt=6076 errflags=0x8048d9 rxerr=0 txerr=133 rxinval=0 rxovr=3 txovr=0 txdelay=259 txfail=6918 wdgreset=0 errreset=7 txqueue=0 1738454427.686539 1T11 79B 02 21 01 55 55 55 55 55 1738454428.674962 1CER TX_Fail T11 79B 02 21 02 55 55 55 55 55 1738454555.679243 1CER TX_Fail T11 79B 02 21 06 55 55 55 55 55 1738454555.680668 1CER Error intr=41628916 rxpkt=41612603 txpkt=6077 errflags=0x8048d9 rxerr=0 txerr=131 rxinval=0 rxovr=3 txovr=0 txdelay=259 txfail=6926 wdgreset=0 errreset=7 txqueue=0 1738454555.680756 1T11 79B 02 21 06 55 55 55 55 55 1738454616.678795 1CER TX_Fail T11 79B 02 21 01 55 55 55 55 55 So far I haven't seen any errors with a non-zero txqueue value, but I'll continue to keep a lookout for any issues. Until then, this seems to be its normal behaviour. I haven't explored the Leaf modules' BMS polling code, but I'm wondering if some changes there would help, e.g. not polling when the car is off. Chris
Chris, Michael, by "regular status ping" I meant testing the car status while off by sending a request every few seconds. The "off" state for the Leaf is state 0, none of the polls has an interval in that slot. So while the Leaf is considered "off" by the module, there should be no new (!) requests. If a final round of the BMS polls would have been kept in the queue, that would only contain at most one entry for each of the polls, i.e. four TX in total, with PIDs 0x01, 0x02, 0x06, 0x04 (with 0x04 only being polled every 5 minutes). The first TX_Fail would then remove the poll from the queue. But your log shows repeated TX failures for 0x01, 0x02 & 0x06. So no, that's not normal. That can only happen, if either the Leaf code has a bug with detecting the correct vehicle state (and with announcing that by some log / event, would need to be "on" or "charging" according to the polling scheme)… …or the new poller has a bug, that leads to keeping or re-entering a wrong poll state. The latter could affect other vehicles as well.
1738275829.012407 CXX OVMS CRTD 1738275829.012407 CVR 3.1 1738275829.020355 1CXX Info Type:vfs Format:crtd(discard) Vehicle:NL Path:/sd/can4.crtd *1738275879*.419663 1CER TX_Fail T11 79B 02 21 *01* 55 55 55 55 55 1738275880.419598 1CER TX_Fail T11 79B 02 21 *02* 55 55 55 55 55 1738275881.419606 1CER TX_Fail T11 79B 02 21 *06* 55 55 55 55 55 *1738275942*.419724 1CER TX_Fail T11 79B 02 21 *01* 55 55 55 55 55 1738275943.419618 1CER TX_Fail T11 79B 02 21 *02* 55 55 55 55 55 1738275944.419611 1CER TX_Fail T11 79B 02 21 *06* 55 55 55 55 55 *1738276005*.419663 1CER TX_Fail T11 79B 02 21 *01* 55 55 55 55 55 1738276006.419606 1CER TX_Fail T11 79B 02 21 *02* 55 55 55 55 55
From the timestamps, that's the 60 seconds interval (63 due to the error/timeout), so that must have been poll state 1 (on) or 3 (charging). You need to check the poll state transitions. These get logged by the poller (log tag "vehicle-poll"), which needs to be set to log level "debug" for this. You should then see log entries "Pollers: Queue SetState" for the state change request & "Pollers: PollState(<state>[,<bus>])" for the actual state change. A log entry "Pollers[SetState]: Task Queue Overflow" (btw, that's currently at "info" level, should be "error") indicates a state change request got lost. That should not happen. @Michael: the poller currently allows state changes to get lost. I think that's a problem. Not properly transitioning the poll state could cause mayhem, as the wrong polls can cause damage, either by putting the vehicle in a fault mode, or simply by not letting the ECUs go to sleep, causing the 12V battery to drain. I think state changes must not get lost, if that happens, that's rather a reason for `abort()` if it cannot be handled otherwise. The same applies to all poll list management commands. Maybe it's an option to make these queue requests blocking? Or to introduce a secondary queue for poller control commands? Any additional ideas for Chris on how to investigate this further? Regards, Michael Am 02.02.25 um 13:58 schrieb Chris Box:
Hi everyone,
On 2025-01-28 19:12, Michael Balzer wrote:
Reading the Leaf code, I don't see any regular status ping polling, Actually there is some defined polling of BMS: static const OvmsPoller::poll_pid_t obdii_polls[] = { // BUS 2 { CHARGER_TXID, CHARGER_RXID, VEHICLE_POLL_TYPE_OBDIIGROUP, VIN_PID, { 0, 900, 0, 0 }, 2, ISOTP_STD }, // VIN [19] { CHARGER_TXID, CHARGER_RXID, VEHICLE_POLL_TYPE_OBDIIEXTENDED, QC_COUNT_PID, { 0, 900, 0, 0 }, 2, ISOTP_STD }, // QC [2] { CHARGER_TXID, CHARGER_RXID, VEHICLE_POLL_TYPE_OBDIIEXTENDED, L1L2_COUNT_PID, { 0, 900, 0, 0 }, 2, ISOTP_STD }, // L0/L1/L2 [2] // BUS 1 { BMS_TXID, BMS_RXID, VEHICLE_POLL_TYPE_OBDIIGROUP, 0x01, { 0, 60, 0, 60 }, 1, ISOTP_STD }, // bat [39/41] { BMS_TXID, BMS_RXID, VEHICLE_POLL_TYPE_OBDIIGROUP, 0x02, { 0, 60, 0, 60 }, 1, ISOTP_STD }, // battery voltages [196] { BMS_TXID, BMS_RXID, VEHICLE_POLL_TYPE_OBDIIGROUP, 0x06, { 0, 60, 0, 60 }, 1, ISOTP_STD }, // battery shunts [96] { BMS_TXID, BMS_RXID, VEHICLE_POLL_TYPE_OBDIIGROUP, 0x04, { 0, 300, 0, 300 }, 1, ISOTP_STD }, // battery temperatures [14] POLL_LIST_END }; BMS_TXID is 0x79B, and this is mostly what I see appearing in CRTD overnight: 1738275829.012407 CXX OVMS CRTD 1738275829.012407 CVR 3.1 1738275829.020355 1CXX Info Type:vfs Format:crtd(discard) Vehicle:NL Path:/sd/can4.crtd 1738275879.419663 1CER TX_Fail T11 79B 02 21 01 55 55 55 55 55 1738275880.419598 1CER TX_Fail T11 79B 02 21 02 55 55 55 55 55 1738275881.419606 1CER TX_Fail T11 79B 02 21 06 55 55 55 55 55 1738275942.419724 1CER TX_Fail T11 79B 02 21 01 55 55 55 55 55 1738275943.419618 1CER TX_Fail T11 79B 02 21 02 55 55 55 55 55 1738275944.419611 1CER TX_Fail T11 79B 02 21 06 55 55 55 55 55 1738276005.419663 1CER TX_Fail T11 79B 02 21 01 55 55 55 55 55 1738276006.419606 1CER TX_Fail T11 79B 02 21 02 55 55 55 55 55 The first night, that was everything I saw until a charge pilot event woke the car up at 05:50. The second night, at 03:46 there were two records of apparently successful transmits, which coincides with errors being logged. 1738381606.559723 1CER TX_Fail T11 79B 02 21 01 55 55 55 55 55 1738381607.560118 1CER TX_Fail T11 79B 02 21 02 55 55 55 55 55
1738381607.561672 1CER Error intr=32898937 rxpkt=32886195 txpkt=4872 errflags=0x204c00 rxerr=0 txerr=127 rxinval=0 rxovr=3 txovr=0 txdelay=213 txfail=5411 wdgreset=0 errreset=5 txqueue=0 1738381607.561766 *1T11 79B 02 21 02 55 55 55 55 55* 1738381607.561816 1CST Status intr=32898937 rxpkt=32886195 txpkt=4873 errflags=0x204c00 rxerr=0 txerr=127 rxinval=0 rxovr=3 txovr=0 txdelay=213 txfail=5411 wdgreset=0 errreset=5 txqueue=0
1738381608.559656 1CER TX_Fail T11 79B 02 21 06 55 55 55 55 55 1738381608.559819 1CST Status intr=32898940 rxpkt=32886195 txpkt=4873 errflags=0x8048d9 rxerr=0 txerr=135 rxinval=0 rxovr=3 txovr=0 txdelay=213 txfail=5412 wdgreset=0 errreset=5 txqueue=0 1738381608.561065 1CER Error intr=32898943 rxpkt=32886195 txpkt=4873 errflags=0x8048d9 rxerr=0 txerr=134 rxinval=0 rxovr=3 txovr=0 txdelay=213 txfail=5412 wdgreset=0 errreset=5 txqueue=0 1738381608.561163 *1T11 79B 02 21 06 55 55 55 55 55*
1738381669.559719 1CER TX_Fail T11 79B 02 21 01 55 55 55 55 55 1738381670.559655 1CER TX_Fail T11 79B 02 21 02 55 55 55 55 55 The above activity is what creates records in the otherwise-quiet system log: 2025-02-01 03:46:48.272 GMT E (189607402) can: can1: intr=32898936 rxpkt=32886195 txpkt=4872 errflags=0x8048d9 rxerr=0 txerr=128 rxinval=0 rxovr=3 txovr=0 txdelay=213 txfail=5411 wdgreset=0 er rreset=5 txqueue=0 2025-02-01 03:46:49.272 GMT E (189608402) can: can1: intr=32898940 rxpkt=32886195 txpkt=4873 errflags=0x8048d9 rxerr=0 txerr=135 rxinval=0 rxovr=3 txovr=0 txdelay=213 txfail=5412 wdgreset=0 er rreset=5 txqueue=0 It fits well with your description below, although in these nights I didn't see any queuing. Just a small probability of thinking it can send a frame on a bus that's off.
On my UpMiiGo (which switches off the bus), the ESP32CAN most of the time recognizes an immediate failure for a TX with the vehicle being off. That means the TX buffer (in the controller) gets cleared immediately, with an immediate "TX_Fail" result for the frame. Ideally that would be the case always while the bus is off.
But the ESP32CAN controller sometimes tries to send the frame, waiting for an ack, repeating the transmission and then ending up in the frame being stuck in the TX buffer. Then the TX queue (software) gets filled with the status ping request frame from there, up to the 30 frames capacity of the TX queue, then counting TX overflows.
This continues until the ESP32CAN, due to unknown reasons, thinks it could send the frame. The TX queue then gets flushed immediately, with the frames appearing as being sent successfully (although there is no ECU active, the bus is still off).
After the queue has been cleared, this loop starts over.
So it may happen, that the TX queue gets filled, and the ESP32CAN thinks it can send frames, even while the bus is shut off.
On the third night the crtd log says it tried to send BMS polls at 23:37, 23:39, 00:00 and 00:02. 1738452975.674976 1CER TX_Fail T11 79B 02 21 06 55 55 55 55 55 1738453036.675613 1CER TX_Fail T11 79B 02 21 01 55 55 55 55 55 1738453036.677195 1CER Error intr=41628672 rxpkt=41612603 txpkt=6073 errflags=0x8048d9 rxerr=0 txerr=128 rxinval=0 rxovr=3 txovr=0 txdelay=259 txfail=6847 wdgreset=0 errreset=7 txqueue=0 1738453036.686582 *1T11 79B 02 21 01 55 55 55 55 55* 1738453036.686690 1CST Status intr=41628708 rxpkt=41612603 txpkt=6074 errflags=0x204c00 rxerr=0 txerr=127 rxinval=0 rxovr=3 txovr=0 txdelay=259 txfail=6847 wdgreset=0 errreset=7 txqueue=0 1738453037.674988 1CER TX_Fail T11 79B 02 21 02 55 55 55 55 55 1738453037.675148 1CST Status intr=41628711 rxpkt=41612603 txpkt=6074 errflags=0x8048d9 rxerr=0 txerr=135 rxinval=0 rxovr=3 txovr=0 txdelay=259 txfail=6848 wdgreset=0 errreset=7 txqueue=0 1738453037.676306 1CER Error intr=41628714 rxpkt=41612603 txpkt=6074 errflags=0x8048d9 rxerr=0 txerr=134 rxinval=0 rxovr=3 txovr=0 txdelay=259 txfail=6848 wdgreset=0 errreset=7 txqueue=0 1738453037.676389 *1T11 79B 02 21 02 55 55 55 55 55* 1738453038.674985 1CER TX_Fail T11 79B 02 21 06 55 55 55 55 55 1738453164.675494 1CER TX_Fail T11 79B 02 21 02 55 55 55 55 55 1738453164.676968 1CER Error intr=41628729 rxpkt=41612603 txpkt=6075 errflags=0x8048d9 rxerr=0 txerr=133 rxinval=0 rxovr=3 txovr=0 txdelay=259 txfail=6855 wdgreset=0 errreset=7 txqueue=0 1738453164.677076 *1T11 79B 02 21 02 55 55 55 55 55* 1738453165.675001 1CER TX_Fail T11 79B 02 21 06 55 55 55 55 55 1738454366.674962 1CER TX_Fail T11 79B 02 21 04 55 55 55 55 55 1738454427.675572 1CER TX_Fail T11 79B 02 21 01 55 55 55 55 55 1738454427.677047 1CER Error intr=41628861 rxpkt=41612603 txpkt=6076 errflags=0x8048d9 rxerr=0 txerr=133 rxinval=0 rxovr=3 txovr=0 txdelay=259 txfail=6918 wdgreset=0 errreset=7 txqueue=0 1738454427.686539 *1T11 79B 02 21 01 55 55 55 55 55* 1738454428.674962 1CER TX_Fail T11 79B 02 21 02 55 55 55 55 55 1738454555.679243 1CER TX_Fail T11 79B 02 21 06 55 55 55 55 55 1738454555.680668 1CER Error intr=41628916 rxpkt=41612603 txpkt=6077 errflags=0x8048d9 rxerr=0 txerr=131 rxinval=0 rxovr=3 txovr=0 txdelay=259 txfail=6926 wdgreset=0 errreset=7 txqueue=0 1738454555.680756 *1T11 79B 02 21 06 55 55 55 55 55* 1738454616.678795 1CER TX_Fail T11 79B 02 21 01 55 55 55 55 55 So far I haven't seen any errors with a non-zero txqueue value, but I'll continue to keep a lookout for any issues. Until then, this seems to be its normal behaviour. I haven't explored the Leaf modules' BMS polling code, but I'm wondering if some changes there would help, e.g. not polling when the car is off. Chris
-- Michael Balzer * Am Rahmen 5 * D-58313 Herdecke Fon 02330 9104094 * Handy 0176 20698926
On 2025-02-02 13:44, Michael Balzer wrote:
That can only happen, if either the Leaf code has a bug with detecting the correct vehicle state (and with announcing that by some log / event, would need to be "on" or "charging" according to the polling scheme)...
...or the new poller has a bug, that leads to keeping or re-entering a wrong poll state. The latter could affect other vehicles as well.
You need to check the poll state transitions. These get logged by the poller (log tag "vehicle-poll"), which needs to be set to log level "debug" for this.
You should then see log entries "Pollers: Queue SetState" for the state change request & "Pollers: PollState(<state>[,<bus>])" for the actual state change.
Yes, I can see how this would be bad. I'm learning more about the code as we go through this. This evening, I enabled vehicle-poll debug while it was charging. As you can see from the log below, there was no SetState after charging stopped. Therefore the poller continued in its current state, and polled every minute. So something is causing it to miss the state transition. If you let me know what to do next, I should be able to try that on Monday. Thanks Chris 2025-02-02 21:06:07.482 GMT D (338366402) vehicle-poll: [1]PollerSend(PRI)[3]: entry at[type=21, pid=1], ticker=2880, wait=0, cnt=0/0 2025-02-02 21:06:07.542 GMT D (338366462) vehicle-poll: [1]PollerSend(SRX)[3]: entry at[type=21, pid=2], ticker=2880, wait=0, cnt=1/0 2025-02-02 21:06:07.842 GMT D (338366762) vehicle-poll: [1]PollerSend(SRX)[3]: entry at[type=21, pid=6], ticker=2880, wait=0, cnt=2/0 2025-02-02 21:06:43.162 GMT I (338402082) housekeeping: 2025-02-02 21:06:42 GMT (RAM: 8b=64080-79564 32b=12560 SPI=3264264-3283048) 2025-02-02 21:07:07.482 GMT D (338426402) vehicle-poll: [1]PollerSend(PRI)[3]: entry at[type=21, pid=1], ticker=2940, wait=0, cnt=0/0 2025-02-02 21:07:07.542 GMT D (338426462) vehicle-poll: [1]PollerSend(SRX)[3]: entry at[type=21, pid=2], ticker=2940, wait=0, cnt=1/0 2025-02-02 21:07:07.852 GMT D (338426772) vehicle-poll: [1]PollerSend(SRX)[3]: entry at[type=21, pid=6], ticker=2940, wait=0, cnt=2/0 2025-02-02 21:08:07.482 GMT D (338486402) vehicle-poll: [1]PollerSend(PRI)[3]: entry at[type=21, pid=1], ticker=3000, wait=0, cnt=0/0 2025-02-02 21:08:07.532 GMT D (338486452) vehicle-poll: [1]PollerSend(SRX)[3]: entry at[type=21, pid=2], ticker=3000, wait=0, cnt=1/0 2025-02-02 21:08:07.842 GMT D (338486762) vehicle-poll: [1]PollerSend(SRX)[3]: entry at[type=21, pid=6], ticker=3000, wait=0, cnt=2/0 2025-02-02 21:08:07.882 GMT D (338486802) vehicle-poll: [1]PollerSend(SRX)[3]: entry at[type=21, pid=4], ticker=3000, wait=0, cnt=3/0 2025-02-02 21:08:13.142 GMT I (338492062) v-nissanleaf: RemoteCommandHandler 2025-02-02 21:08:13.142 GMT I (338492062) v-nissanleaf: Sending Wakeup Frame 2025-02-02 21:08:13.142 GMT I (338492062) ovms-server-v3: Tx notify ovms/notify/info/v-nissanleaf/charge/status=Target charge level reached (52%) 2025-02-02 21:08:13.152 GMT D (338492072) events: Signal(notify.info.v-nissanleaf.charge.status) 2025-02-02 21:08:13.242 GMT I (338492162) v-nissanleaf: RemoteCommandTimer 24 2025-02-02 21:08:13.242 GMT I (338492162) v-nissanleaf: New TCU on CAR Bus 2025-02-02 21:08:13.242 GMT I (338492162) v-nissanleaf: Sending Wakeup Frame 2025-02-02 21:08:13.242 GMT I (338492162) v-nissanleaf: Stop Charging 2025-02-02 21:08:13.322 GMT I (338492242) v-nissanleaf: MITM attempted off 2025-02-02 21:08:13.322 GMT I (338492242) v-nissanleaf: MITM turned off 2025-02-02 21:08:13.342 GMT I (338492262) v-nissanleaf: RemoteCommandTimer 23 2025-02-02 21:08:13.342 GMT I (338492262) v-nissanleaf: New TCU on CAR Bus 2025-02-02 21:08:13.342 GMT I (338492262) v-nissanleaf: Sending Wakeup Frame 2025-02-02 21:08:13.342 GMT I (338492262) v-nissanleaf: Stop Charging 2025-02-02 21:08:13.362 GMT I (338492282) ovms-server-v3: Message publishing acknowledged (msg_id: 2149) 2025-02-02 21:08:13.422 GMT I (338492342) v-nissanleaf: MITM attempted off 2025-02-02 21:08:13.422 GMT I (338492342) v-nissanleaf: MITM turned off 2025-02-02 21:08:13.442 GMT I (338492362) v-nissanleaf: RemoteCommandTimer 22 2025-02-02 21:08:13.442 GMT I (338492362) v-nissanleaf: New TCU on CAR Bus 2025-02-02 21:08:13.442 GMT I (338492362) v-nissanleaf: Sending Wakeup Frame 2025-02-02 21:08:13.442 GMT I (338492362) v-nissanleaf: Stop Charging 2025-02-02 21:08:13.522 GMT I (338492442) v-nissanleaf: MITM attempted off 2025-02-02 21:08:13.522 GMT I (338492442) v-nissanleaf: MITM turned off 2025-02-02 21:08:13.542 GMT I (338492462) v-nissanleaf: RemoteCommandTimer 21 2025-02-02 21:08:13.542 GMT I (338492462) v-nissanleaf: New TCU on CAR Bus 2025-02-02 21:08:13.542 GMT I (338492462) v-nissanleaf: Sending Wakeup Frame 2025-02-02 21:08:13.542 GMT I (338492462) v-nissanleaf: Stop Charging 2025-02-02 21:08:13.622 GMT I (338492542) v-nissanleaf: MITM attempted off 2025-02-02 21:08:13.622 GMT I (338492542) v-nissanleaf: MITM turned off 2025-02-02 21:08:13.642 GMT I (338492562) v-nissanleaf: RemoteCommandTimer 20 2025-02-02 21:08:13.642 GMT I (338492562) v-nissanleaf: New TCU on CAR Bus 2025-02-02 21:08:13.642 GMT I (338492562) v-nissanleaf: Sending Wakeup Frame 2025-02-02 21:08:13.642 GMT I (338492562) v-nissanleaf: Stop Charging 2025-02-02 21:08:13.722 GMT I (338492642) v-nissanleaf: MITM attempted off 2025-02-02 21:08:13.722 GMT I (338492642) v-nissanleaf: MITM turned off 2025-02-02 21:08:13.742 GMT I (338492662) v-nissanleaf: RemoteCommandTimer 19 2025-02-02 21:08:13.742 GMT I (338492662) v-nissanleaf: New TCU on CAR Bus 2025-02-02 21:08:13.742 GMT I (338492662) v-nissanleaf: Sending Wakeup Frame 2025-02-02 21:08:13.742 GMT I (338492662) v-nissanleaf: Stop Charging 2025-02-02 21:08:13.822 GMT I (338492742) v-nissanleaf: MITM attempted off 2025-02-02 21:08:13.822 GMT I (338492742) v-nissanleaf: MITM turned off 2025-02-02 21:08:13.842 GMT I (338492762) v-nissanleaf: RemoteCommandTimer 18 2025-02-02 21:08:13.842 GMT I (338492762) v-nissanleaf: New TCU on CAR Bus 2025-02-02 21:08:13.842 GMT I (338492762) v-nissanleaf: Sending Wakeup Frame 2025-02-02 21:08:13.842 GMT I (338492762) v-nissanleaf: Stop Charging 2025-02-02 21:08:13.922 GMT I (338492842) v-nissanleaf: MITM attempted off 2025-02-02 21:08:13.922 GMT I (338492842) v-nissanleaf: MITM turned off 2025-02-02 21:08:13.942 GMT I (338492862) v-nissanleaf: RemoteCommandTimer 17 2025-02-02 21:08:13.942 GMT I (338492862) v-nissanleaf: New TCU on CAR Bus 2025-02-02 21:08:13.942 GMT I (338492862) v-nissanleaf: Sending Wakeup Frame 2025-02-02 21:08:13.942 GMT I (338492862) v-nissanleaf: Stop Charging 2025-02-02 21:08:14.022 GMT I (338492942) v-nissanleaf: MITM attempted off 2025-02-02 21:08:14.022 GMT I (338492942) v-nissanleaf: MITM turned off 2025-02-02 21:08:14.042 GMT I (338492962) v-nissanleaf: RemoteCommandTimer 16 2025-02-02 21:08:14.042 GMT I (338492962) v-nissanleaf: New TCU on CAR Bus 2025-02-02 21:08:14.042 GMT I (338492962) v-nissanleaf: Sending Wakeup Frame 2025-02-02 21:08:14.042 GMT I (338492962) v-nissanleaf: Stop Charging 2025-02-02 21:08:14.122 GMT I (338493042) v-nissanleaf: MITM attempted off 2025-02-02 21:08:14.122 GMT I (338493042) v-nissanleaf: MITM turned off 2025-02-02 21:08:14.142 GMT I (338493062) v-nissanleaf: RemoteCommandTimer 15 2025-02-02 21:08:14.142 GMT I (338493062) v-nissanleaf: New TCU on CAR Bus 2025-02-02 21:08:14.142 GMT I (338493062) v-nissanleaf: Sending Wakeup Frame 2025-02-02 21:08:14.142 GMT I (338493062) v-nissanleaf: Stop Charging 2025-02-02 21:08:14.222 GMT I (338493142) v-nissanleaf: MITM attempted off 2025-02-02 21:08:14.222 GMT I (338493142) v-nissanleaf: MITM turned off 2025-02-02 21:08:14.242 GMT I (338493162) v-nissanleaf: RemoteCommandTimer 14 2025-02-02 21:08:14.242 GMT I (338493162) v-nissanleaf: New TCU on CAR Bus 2025-02-02 21:08:14.242 GMT I (338493162) v-nissanleaf: Sending Wakeup Frame 2025-02-02 21:08:14.242 GMT I (338493162) v-nissanleaf: Stop Charging 2025-02-02 21:08:14.322 GMT I (338493242) v-nissanleaf: MITM attempted off 2025-02-02 21:08:14.322 GMT I (338493242) v-nissanleaf: MITM turned off 2025-02-02 21:08:14.342 GMT I (338493262) v-nissanleaf: RemoteCommandTimer 13 2025-02-02 21:08:14.342 GMT I (338493262) v-nissanleaf: New TCU on CAR Bus 2025-02-02 21:08:14.342 GMT I (338493262) v-nissanleaf: Sending Wakeup Frame 2025-02-02 21:08:14.342 GMT I (338493262) v-nissanleaf: Stop Charging 2025-02-02 21:08:14.372 GMT D (338493292) events: Signal(vehicle.charge.stop) 2025-02-02 21:08:14.382 GMT D (338493302) events: Signal(vehicle.charge.state) 2025-02-02 21:08:14.382 GMT D (338493302) events: Signal(vehicle.charge.mode) 2025-02-02 21:08:14.422 GMT I (338493342) v-nissanleaf: MITM attempted off 2025-02-02 21:08:14.422 GMT I (338493342) v-nissanleaf: MITM turned off 2025-02-02 21:08:14.442 GMT I (338493362) v-nissanleaf: RemoteCommandTimer 12 2025-02-02 21:08:14.442 GMT I (338493362) v-nissanleaf: New TCU on CAR Bus 2025-02-02 21:08:14.442 GMT I (338493362) v-nissanleaf: Sending Wakeup Frame 2025-02-02 21:08:14.442 GMT I (338493362) v-nissanleaf: Stop Charging 2025-02-02 21:08:14.522 GMT I (338493442) v-nissanleaf: MITM attempted off 2025-02-02 21:08:14.522 GMT I (338493442) v-nissanleaf: MITM turned off 2025-02-02 21:08:14.542 GMT I (338493462) v-nissanleaf: RemoteCommandTimer 11 2025-02-02 21:08:14.542 GMT I (338493462) v-nissanleaf: New TCU on CAR Bus 2025-02-02 21:08:14.542 GMT I (338493462) v-nissanleaf: Sending Wakeup Frame 2025-02-02 21:08:14.542 GMT I (338493462) v-nissanleaf: Stop Charging 2025-02-02 21:08:14.622 GMT I (338493542) v-nissanleaf: MITM attempted off 2025-02-02 21:08:14.622 GMT I (338493542) v-nissanleaf: MITM turned off 2025-02-02 21:08:14.642 GMT I (338493562) v-nissanleaf: RemoteCommandTimer 10 2025-02-02 21:08:14.642 GMT I (338493562) v-nissanleaf: New TCU on CAR Bus 2025-02-02 21:08:14.642 GMT I (338493562) v-nissanleaf: Sending Wakeup Frame 2025-02-02 21:08:14.642 GMT I (338493562) v-nissanleaf: Stop Charging 2025-02-02 21:08:14.722 GMT I (338493642) v-nissanleaf: MITM attempted off 2025-02-02 21:08:14.722 GMT I (338493642) v-nissanleaf: MITM turned off 2025-02-02 21:08:14.742 GMT I (338493662) v-nissanleaf: RemoteCommandTimer 9 2025-02-02 21:08:14.742 GMT I (338493662) v-nissanleaf: New TCU on CAR Bus 2025-02-02 21:08:14.742 GMT I (338493662) v-nissanleaf: Sending Wakeup Frame 2025-02-02 21:08:14.742 GMT I (338493662) v-nissanleaf: Stop Charging 2025-02-02 21:08:14.822 GMT I (338493742) v-nissanleaf: MITM attempted off 2025-02-02 21:08:14.822 GMT I (338493742) v-nissanleaf: MITM turned off 2025-02-02 21:08:14.842 GMT I (338493762) v-nissanleaf: RemoteCommandTimer 8 2025-02-02 21:08:14.842 GMT I (338493762) v-nissanleaf: New TCU on CAR Bus 2025-02-02 21:08:14.842 GMT I (338493762) v-nissanleaf: Sending Wakeup Frame 2025-02-02 21:08:14.842 GMT I (338493762) v-nissanleaf: Stop Charging 2025-02-02 21:08:14.922 GMT I (338493842) v-nissanleaf: MITM attempted off 2025-02-02 21:08:14.922 GMT I (338493842) v-nissanleaf: MITM turned off 2025-02-02 21:08:14.942 GMT I (338493862) v-nissanleaf: RemoteCommandTimer 7 2025-02-02 21:08:14.942 GMT I (338493862) v-nissanleaf: New TCU on CAR Bus 2025-02-02 21:08:14.942 GMT I (338493862) v-nissanleaf: Sending Wakeup Frame 2025-02-02 21:08:14.942 GMT I (338493862) v-nissanleaf: Stop Charging 2025-02-02 21:08:15.022 GMT I (338493942) v-nissanleaf: MITM attempted off 2025-02-02 21:08:15.022 GMT I (338493942) v-nissanleaf: MITM turned off 2025-02-02 21:08:15.042 GMT I (338493962) v-nissanleaf: RemoteCommandTimer 6 2025-02-02 21:08:15.042 GMT I (338493962) v-nissanleaf: New TCU on CAR Bus 2025-02-02 21:08:15.042 GMT I (338493962) v-nissanleaf: Sending Wakeup Frame 2025-02-02 21:08:15.042 GMT I (338493962) v-nissanleaf: Stop Charging 2025-02-02 21:08:15.122 GMT I (338494042) v-nissanleaf: MITM attempted off 2025-02-02 21:08:15.122 GMT I (338494042) v-nissanleaf: MITM turned off 2025-02-02 21:08:15.142 GMT I (338494062) v-nissanleaf: RemoteCommandTimer 5 2025-02-02 21:08:15.142 GMT I (338494062) v-nissanleaf: New TCU on CAR Bus 2025-02-02 21:08:15.142 GMT I (338494062) v-nissanleaf: Sending Wakeup Frame 2025-02-02 21:08:15.142 GMT I (338494062) v-nissanleaf: Stop Charging 2025-02-02 21:08:15.222 GMT I (338494142) v-nissanleaf: MITM attempted off 2025-02-02 21:08:15.222 GMT I (338494142) v-nissanleaf: MITM turned off 2025-02-02 21:08:15.242 GMT I (338494162) v-nissanleaf: RemoteCommandTimer 4 2025-02-02 21:08:15.242 GMT I (338494162) v-nissanleaf: New TCU on CAR Bus 2025-02-02 21:08:15.242 GMT I (338494162) v-nissanleaf: Sending Wakeup Frame 2025-02-02 21:08:15.242 GMT I (338494162) v-nissanleaf: Stop Charging 2025-02-02 21:08:15.322 GMT I (338494242) v-nissanleaf: MITM attempted off 2025-02-02 21:08:15.322 GMT I (338494242) v-nissanleaf: MITM turned off 2025-02-02 21:08:15.342 GMT I (338494262) v-nissanleaf: RemoteCommandTimer 3 2025-02-02 21:08:15.342 GMT I (338494262) v-nissanleaf: New TCU on CAR Bus 2025-02-02 21:08:15.342 GMT I (338494262) v-nissanleaf: Sending Wakeup Frame 2025-02-02 21:08:15.342 GMT I (338494262) v-nissanleaf: Stop Charging 2025-02-02 21:08:15.422 GMT I (338494342) v-nissanleaf: MITM attempted off 2025-02-02 21:08:15.422 GMT I (338494342) v-nissanleaf: MITM turned off 2025-02-02 21:08:15.442 GMT I (338494362) v-nissanleaf: RemoteCommandTimer 2 2025-02-02 21:08:15.442 GMT I (338494362) v-nissanleaf: New TCU on CAR Bus 2025-02-02 21:08:15.442 GMT I (338494362) v-nissanleaf: Sending Wakeup Frame 2025-02-02 21:08:15.442 GMT I (338494362) v-nissanleaf: Stop Charging 2025-02-02 21:08:15.522 GMT I (338494442) v-nissanleaf: MITM attempted off 2025-02-02 21:08:15.522 GMT I (338494442) v-nissanleaf: MITM turned off 2025-02-02 21:08:15.542 GMT I (338494462) v-nissanleaf: RemoteCommandTimer 1 2025-02-02 21:08:15.542 GMT I (338494462) v-nissanleaf: New TCU on CAR Bus 2025-02-02 21:08:15.542 GMT I (338494462) v-nissanleaf: Sending Wakeup Frame 2025-02-02 21:08:15.542 GMT I (338494462) v-nissanleaf: Stop Charging 2025-02-02 21:08:15.622 GMT I (338494542) v-nissanleaf: MITM attempted off 2025-02-02 21:08:15.622 GMT I (338494542) v-nissanleaf: MITM turned off 2025-02-02 21:08:15.642 GMT I (338494562) v-nissanleaf: RemoteCommandTimer 0 2025-02-02 21:08:22.142 GMT I (338501062) ovms-server-v3: Tx notify ovms/notify/info/charge/stopped=Charge Stopped, Timer On|0.7Mph|Full: 4:35h|Charged: 3.5kWh|SOC: 52.2%|Ideal range: 66M|Est. range: 41M|ODO: 56580.0M|CAC: 57.5Ah|SOH: 73% 2025-02-02 21:08:22.152 GMT D (338501072) events: Signal(notify.info.charge.stopped) 2025-02-02 21:08:22.372 GMT I (338501292) ovms-server-v3: Message publishing acknowledged (msg_id: 2154) 2025-02-02 21:08:23.142 GMT D (338502062) events: Signal(vehicle.charge.12v.stop) 2025-02-02 21:08:24.142 GMT I (338503062) powermgmt: No longer charging 12V battery.. 2025-02-02 21:09:07.482 GMT D (338546402) vehicle-poll: [1]PollerSend(PRI)[3]: entry at[type=21, pid=1], ticker=3060, wait=0, cnt=0/0 2025-02-02 21:09:07.482 GMT E (338546402) can: can1: intr=49552907 rxpkt=49533436 txpkt=7319 errflags=0x8000d9 rxerr=0 txerr=8 rxinval=0 rxovr=6 txovr=0 txdelay=309 txfail=8283 wdgreset=0 errreset=8 txqueue=0 2025-02-02 21:09:07.482 GMT E (338546402) can: can1: intr=49552911 rxpkt=49533436 txpkt=7319 errflags=0x8000d9 rxerr=0 txerr=40 rxinval=0 rxovr=6 txovr=0 txdelay=309 txfail=8283 wdgreset=0 errreset=8 txqueue=0 2025-02-02 21:09:07.482 GMT E (338546402) can: can1: intr=49552913 rxpkt=49533436 txpkt=7319 errflags=0x8000d9 rxerr=0 txerr=56 rxinval=0 rxovr=6 txovr=0 txdelay=309 txfail=8283 wdgreset=0 errreset=8 txqueue=0 2025-02-02 21:09:07.482 GMT E (338546402) can: can1: intr=49552915 rxpkt=49533436 txpkt=7319 errflags=0x8000d9 rxerr=0 txerr=72 rxinval=0 rxovr=6 txovr=0 txdelay=309 txfail=8283 wdgreset=0 errreset=8 txqueue=0 2025-02-02 21:09:07.482 GMT E (338546402) can: can1: intr=49552916 rxpkt=49533436 txpkt=7319 errflags=0x8000d9 rxerr=0 txerr=80 rxinval=0 rxovr=6 txovr=0 txdelay=309 txfail=8283 wdgreset=0 errreset=8 txqueue=0 2025-02-02 21:09:07.482 GMT E (338546402) can: can1: intr=49552918 rxpkt=49533436 txpkt=7319 errflags=0x8440d9 rxerr=0 txerr=96 rxinval=0 rxovr=6 txovr=0 txdelay=309 txfail=8283 wdgreset=0 errreset=8 txqueue=0 2025-02-02 21:09:07.482 GMT E (338546402) can: can1: intr=49552920 rxpkt=49533436 txpkt=7319 errflags=0x8040d9 rxerr=0 txerr=112 rxinval=0 rxovr=6 txovr=0 txdelay=309 txfail=8283 wdgreset=0 errreset=8 txqueue=0 2025-02-02 21:09:07.482 GMT E (338546402) can: can1: intr=49552923 rxpkt=49533436 txpkt=7319 errflags=0xa040d9 rxerr=0 txerr=128 rxinval=0 rxovr=6 txovr=0 txdelay=309 txfail=8283 wdgreset=0 errreset=8 txqueue=0 2025-02-02 21:09:08.482 GMT D (338547402) vehicle-poll: [1]PollerSend(PRI)[3]: entry at[type=21, pid=2], ticker=3060, wait=0, cnt=0/0 2025-02-02 21:09:09.482 GMT D (338548402) vehicle-poll: [1]PollerSend(PRI)[3]: entry at[type=21, pid=6], ticker=3060, wait=0, cnt=0/0 2025-02-02 21:10:10.482 GMT D (338609402) vehicle-poll: [1]PollerSend(PRI)[3]: entry at[type=21, pid=1], ticker=3120, wait=0, cnt=0/0 2025-02-02 21:10:11.482 GMT D (338610402) vehicle-poll: [1]PollerSend(PRI)[3]: entry at[type=21, pid=2], ticker=3120, wait=0, cnt=0/0 2025-02-02 21:10:12.482 GMT D (338611402) vehicle-poll: [1]PollerSend(PRI)[3]: entry at[type=21, pid=6], ticker=3120, wait=0, cnt=0/0 2025-02-02 21:11:13.482 GMT D (338672402) vehicle-poll: [1]PollerSend(PRI)[3]: entry at[type=21, pid=1], ticker=3180, wait=0, cnt=0/0 2025-02-02 21:11:14.482 GMT D (338673402) vehicle-poll: [1]PollerSend(PRI)[3]: entry at[type=21, pid=2], ticker=3180, wait=0, cnt=0/0 2025-02-02 21:11:15.482 GMT D (338674402) vehicle-poll: [1]PollerSend(PRI)[3]: entry at[type=21, pid=6], ticker=3180, wait=0, cnt=0/0
Chris, your log shows it's not a poller bug, it's a Leaf bug: the Leaf code detects the vehicle state change & sets the state metrics correctly, but does not request the appropriate poller state change. This is the moment the vehicle state change was detected:
2025-02-02 21:08:14.372 GMT D (338493292) events: Signal(vehicle.charge.stop)
The event is emitted automatically by the vehicle framework when metric "v.c.charging" (ms_v_charge_inprogress) changes from true to false. I don't know the Leaf code, but I think that should directly lead to a poller state change, but doesn't. So you should investigate that bug in the Leaf module. Regards, Michael Am 02.02.25 um 23:30 schrieb Chris Box:
On 2025-02-02 13:44, Michael Balzer wrote:
That can only happen, if either the Leaf code has a bug with detecting the correct vehicle state (and with announcing that by some log / event, would need to be "on" or "charging" according to the polling scheme)...
...or the new poller has a bug, that leads to keeping or re-entering a wrong poll state. The latter could affect other vehicles as well. You need to check the poll state transitions. These get logged by the poller (log tag "vehicle-poll"), which needs to be set to log level "debug" for this.
You should then see log entries "Pollers: Queue SetState" for the state change request & "Pollers: PollState(<state>[,<bus>])" for the actual state change. Yes, I can see how this would be bad. I'm learning more about the code as we go through this. This evening, I enabled vehicle-poll debug while it was charging. As you can see from the log below, there was no SetState after charging stopped. Therefore the poller continued in its current state, and polled every minute. So something is causing it to miss the state transition. If you let me know what to do next, I should be able to try that on Monday. Thanks Chris 2025-02-02 21:06:07.482 GMT D (338366402) vehicle-poll: [1]PollerSend(PRI)[3]: entry at[type=21, pid=1], ticker=2880, wait=0, cnt=0/0 2025-02-02 21:06:07.542 GMT D (338366462) vehicle-poll: [1]PollerSend(SRX)[3]: entry at[type=21, pid=2], ticker=2880, wait=0, cnt=1/0 2025-02-02 21:06:07.842 GMT D (338366762) vehicle-poll: [1]PollerSend(SRX)[3]: entry at[type=21, pid=6], ticker=2880, wait=0, cnt=2/0 2025-02-02 21:06:43.162 GMT I (338402082) housekeeping: 2025-02-02 21:06:42 GMT (RAM: 8b=64080-79564 32b=12560 SPI=3264264-3283048) 2025-02-02 21:07:07.482 GMT D (338426402) vehicle-poll: [1]PollerSend(PRI)[3]: entry at[type=21, pid=1], ticker=2940, wait=0, cnt=0/0 2025-02-02 21:07:07.542 GMT D (338426462) vehicle-poll: [1]PollerSend(SRX)[3]: entry at[type=21, pid=2], ticker=2940, wait=0, cnt=1/0 2025-02-02 21:07:07.852 GMT D (338426772) vehicle-poll: [1]PollerSend(SRX)[3]: entry at[type=21, pid=6], ticker=2940, wait=0, cnt=2/0 2025-02-02 21:08:07.482 GMT D (338486402) vehicle-poll: [1]PollerSend(PRI)[3]: entry at[type=21, pid=1], ticker=3000, wait=0, cnt=0/0 2025-02-02 21:08:07.532 GMT D (338486452) vehicle-poll: [1]PollerSend(SRX)[3]: entry at[type=21, pid=2], ticker=3000, wait=0, cnt=1/0 2025-02-02 21:08:07.842 GMT D (338486762) vehicle-poll: [1]PollerSend(SRX)[3]: entry at[type=21, pid=6], ticker=3000, wait=0, cnt=2/0 2025-02-02 21:08:07.882 GMT D (338486802) vehicle-poll: [1]PollerSend(SRX)[3]: entry at[type=21, pid=4], ticker=3000, wait=0, cnt=3/0 2025-02-02 21:08:13.142 GMT I (338492062) v-nissanleaf: RemoteCommandHandler 2025-02-02 21:08:13.142 GMT I (338492062) v-nissanleaf: Sending Wakeup Frame 2025-02-02 21:08:13.142 GMT I (338492062) ovms-server-v3: Tx notify ovms/notify/info/v-nissanleaf/charge/status=Target charge level reached (52%) 2025-02-02 21:08:13.152 GMT D (338492072) events: Signal(notify.info.v-nissanleaf.charge.status) 2025-02-02 21:08:13.242 GMT I (338492162) v-nissanleaf: RemoteCommandTimer 24 2025-02-02 21:08:13.242 GMT I (338492162) v-nissanleaf: New TCU on CAR Bus 2025-02-02 21:08:13.242 GMT I (338492162) v-nissanleaf: Sending Wakeup Frame 2025-02-02 21:08:13.242 GMT I (338492162) v-nissanleaf: Stop Charging 2025-02-02 21:08:13.322 GMT I (338492242) v-nissanleaf: MITM attempted off 2025-02-02 21:08:13.322 GMT I (338492242) v-nissanleaf: MITM turned off 2025-02-02 21:08:13.342 GMT I (338492262) v-nissanleaf: RemoteCommandTimer 23 2025-02-02 21:08:13.342 GMT I (338492262) v-nissanleaf: New TCU on CAR Bus 2025-02-02 21:08:13.342 GMT I (338492262) v-nissanleaf: Sending Wakeup Frame 2025-02-02 21:08:13.342 GMT I (338492262) v-nissanleaf: Stop Charging 2025-02-02 21:08:13.362 GMT I (338492282) ovms-server-v3: Message publishing acknowledged (msg_id: 2149) 2025-02-02 21:08:13.422 GMT I (338492342) v-nissanleaf: MITM attempted off 2025-02-02 21:08:13.422 GMT I (338492342) v-nissanleaf: MITM turned off 2025-02-02 21:08:13.442 GMT I (338492362) v-nissanleaf: RemoteCommandTimer 22 2025-02-02 21:08:13.442 GMT I (338492362) v-nissanleaf: New TCU on CAR Bus 2025-02-02 21:08:13.442 GMT I (338492362) v-nissanleaf: Sending Wakeup Frame 2025-02-02 21:08:13.442 GMT I (338492362) v-nissanleaf: Stop Charging 2025-02-02 21:08:13.522 GMT I (338492442) v-nissanleaf: MITM attempted off 2025-02-02 21:08:13.522 GMT I (338492442) v-nissanleaf: MITM turned off 2025-02-02 21:08:13.542 GMT I (338492462) v-nissanleaf: RemoteCommandTimer 21 2025-02-02 21:08:13.542 GMT I (338492462) v-nissanleaf: New TCU on CAR Bus 2025-02-02 21:08:13.542 GMT I (338492462) v-nissanleaf: Sending Wakeup Frame 2025-02-02 21:08:13.542 GMT I (338492462) v-nissanleaf: Stop Charging 2025-02-02 21:08:13.622 GMT I (338492542) v-nissanleaf: MITM attempted off 2025-02-02 21:08:13.622 GMT I (338492542) v-nissanleaf: MITM turned off 2025-02-02 21:08:13.642 GMT I (338492562) v-nissanleaf: RemoteCommandTimer 20 2025-02-02 21:08:13.642 GMT I (338492562) v-nissanleaf: New TCU on CAR Bus 2025-02-02 21:08:13.642 GMT I (338492562) v-nissanleaf: Sending Wakeup Frame 2025-02-02 21:08:13.642 GMT I (338492562) v-nissanleaf: Stop Charging 2025-02-02 21:08:13.722 GMT I (338492642) v-nissanleaf: MITM attempted off 2025-02-02 21:08:13.722 GMT I (338492642) v-nissanleaf: MITM turned off 2025-02-02 21:08:13.742 GMT I (338492662) v-nissanleaf: RemoteCommandTimer 19 2025-02-02 21:08:13.742 GMT I (338492662) v-nissanleaf: New TCU on CAR Bus 2025-02-02 21:08:13.742 GMT I (338492662) v-nissanleaf: Sending Wakeup Frame 2025-02-02 21:08:13.742 GMT I (338492662) v-nissanleaf: Stop Charging 2025-02-02 21:08:13.822 GMT I (338492742) v-nissanleaf: MITM attempted off 2025-02-02 21:08:13.822 GMT I (338492742) v-nissanleaf: MITM turned off 2025-02-02 21:08:13.842 GMT I (338492762) v-nissanleaf: RemoteCommandTimer 18 2025-02-02 21:08:13.842 GMT I (338492762) v-nissanleaf: New TCU on CAR Bus 2025-02-02 21:08:13.842 GMT I (338492762) v-nissanleaf: Sending Wakeup Frame 2025-02-02 21:08:13.842 GMT I (338492762) v-nissanleaf: Stop Charging 2025-02-02 21:08:13.922 GMT I (338492842) v-nissanleaf: MITM attempted off 2025-02-02 21:08:13.922 GMT I (338492842) v-nissanleaf: MITM turned off 2025-02-02 21:08:13.942 GMT I (338492862) v-nissanleaf: RemoteCommandTimer 17 2025-02-02 21:08:13.942 GMT I (338492862) v-nissanleaf: New TCU on CAR Bus 2025-02-02 21:08:13.942 GMT I (338492862) v-nissanleaf: Sending Wakeup Frame 2025-02-02 21:08:13.942 GMT I (338492862) v-nissanleaf: Stop Charging 2025-02-02 21:08:14.022 GMT I (338492942) v-nissanleaf: MITM attempted off 2025-02-02 21:08:14.022 GMT I (338492942) v-nissanleaf: MITM turned off 2025-02-02 21:08:14.042 GMT I (338492962) v-nissanleaf: RemoteCommandTimer 16 2025-02-02 21:08:14.042 GMT I (338492962) v-nissanleaf: New TCU on CAR Bus 2025-02-02 21:08:14.042 GMT I (338492962) v-nissanleaf: Sending Wakeup Frame 2025-02-02 21:08:14.042 GMT I (338492962) v-nissanleaf: Stop Charging 2025-02-02 21:08:14.122 GMT I (338493042) v-nissanleaf: MITM attempted off 2025-02-02 21:08:14.122 GMT I (338493042) v-nissanleaf: MITM turned off 2025-02-02 21:08:14.142 GMT I (338493062) v-nissanleaf: RemoteCommandTimer 15 2025-02-02 21:08:14.142 GMT I (338493062) v-nissanleaf: New TCU on CAR Bus 2025-02-02 21:08:14.142 GMT I (338493062) v-nissanleaf: Sending Wakeup Frame 2025-02-02 21:08:14.142 GMT I (338493062) v-nissanleaf: Stop Charging 2025-02-02 21:08:14.222 GMT I (338493142) v-nissanleaf: MITM attempted off 2025-02-02 21:08:14.222 GMT I (338493142) v-nissanleaf: MITM turned off 2025-02-02 21:08:14.242 GMT I (338493162) v-nissanleaf: RemoteCommandTimer 14 2025-02-02 21:08:14.242 GMT I (338493162) v-nissanleaf: New TCU on CAR Bus 2025-02-02 21:08:14.242 GMT I (338493162) v-nissanleaf: Sending Wakeup Frame 2025-02-02 21:08:14.242 GMT I (338493162) v-nissanleaf: Stop Charging 2025-02-02 21:08:14.322 GMT I (338493242) v-nissanleaf: MITM attempted off 2025-02-02 21:08:14.322 GMT I (338493242) v-nissanleaf: MITM turned off 2025-02-02 21:08:14.342 GMT I (338493262) v-nissanleaf: RemoteCommandTimer 13 2025-02-02 21:08:14.342 GMT I (338493262) v-nissanleaf: New TCU on CAR Bus 2025-02-02 21:08:14.342 GMT I (338493262) v-nissanleaf: Sending Wakeup Frame 2025-02-02 21:08:14.342 GMT I (338493262) v-nissanleaf: Stop Charging 2025-02-02 21:08:14.372 GMT D (338493292) events: Signal(vehicle.charge.stop) 2025-02-02 21:08:14.382 GMT D (338493302) events: Signal(vehicle.charge.state) 2025-02-02 21:08:14.382 GMT D (338493302) events: Signal(vehicle.charge.mode) 2025-02-02 21:08:14.422 GMT I (338493342) v-nissanleaf: MITM attempted off 2025-02-02 21:08:14.422 GMT I (338493342) v-nissanleaf: MITM turned off 2025-02-02 21:08:14.442 GMT I (338493362) v-nissanleaf: RemoteCommandTimer 12 2025-02-02 21:08:14.442 GMT I (338493362) v-nissanleaf: New TCU on CAR Bus 2025-02-02 21:08:14.442 GMT I (338493362) v-nissanleaf: Sending Wakeup Frame 2025-02-02 21:08:14.442 GMT I (338493362) v-nissanleaf: Stop Charging 2025-02-02 21:08:14.522 GMT I (338493442) v-nissanleaf: MITM attempted off 2025-02-02 21:08:14.522 GMT I (338493442) v-nissanleaf: MITM turned off 2025-02-02 21:08:14.542 GMT I (338493462) v-nissanleaf: RemoteCommandTimer 11 2025-02-02 21:08:14.542 GMT I (338493462) v-nissanleaf: New TCU on CAR Bus 2025-02-02 21:08:14.542 GMT I (338493462) v-nissanleaf: Sending Wakeup Frame 2025-02-02 21:08:14.542 GMT I (338493462) v-nissanleaf: Stop Charging 2025-02-02 21:08:14.622 GMT I (338493542) v-nissanleaf: MITM attempted off 2025-02-02 21:08:14.622 GMT I (338493542) v-nissanleaf: MITM turned off 2025-02-02 21:08:14.642 GMT I (338493562) v-nissanleaf: RemoteCommandTimer 10 2025-02-02 21:08:14.642 GMT I (338493562) v-nissanleaf: New TCU on CAR Bus 2025-02-02 21:08:14.642 GMT I (338493562) v-nissanleaf: Sending Wakeup Frame 2025-02-02 21:08:14.642 GMT I (338493562) v-nissanleaf: Stop Charging 2025-02-02 21:08:14.722 GMT I (338493642) v-nissanleaf: MITM attempted off 2025-02-02 21:08:14.722 GMT I (338493642) v-nissanleaf: MITM turned off 2025-02-02 21:08:14.742 GMT I (338493662) v-nissanleaf: RemoteCommandTimer 9 2025-02-02 21:08:14.742 GMT I (338493662) v-nissanleaf: New TCU on CAR Bus 2025-02-02 21:08:14.742 GMT I (338493662) v-nissanleaf: Sending Wakeup Frame 2025-02-02 21:08:14.742 GMT I (338493662) v-nissanleaf: Stop Charging 2025-02-02 21:08:14.822 GMT I (338493742) v-nissanleaf: MITM attempted off 2025-02-02 21:08:14.822 GMT I (338493742) v-nissanleaf: MITM turned off 2025-02-02 21:08:14.842 GMT I (338493762) v-nissanleaf: RemoteCommandTimer 8 2025-02-02 21:08:14.842 GMT I (338493762) v-nissanleaf: New TCU on CAR Bus 2025-02-02 21:08:14.842 GMT I (338493762) v-nissanleaf: Sending Wakeup Frame 2025-02-02 21:08:14.842 GMT I (338493762) v-nissanleaf: Stop Charging 2025-02-02 21:08:14.922 GMT I (338493842) v-nissanleaf: MITM attempted off 2025-02-02 21:08:14.922 GMT I (338493842) v-nissanleaf: MITM turned off 2025-02-02 21:08:14.942 GMT I (338493862) v-nissanleaf: RemoteCommandTimer 7 2025-02-02 21:08:14.942 GMT I (338493862) v-nissanleaf: New TCU on CAR Bus 2025-02-02 21:08:14.942 GMT I (338493862) v-nissanleaf: Sending Wakeup Frame 2025-02-02 21:08:14.942 GMT I (338493862) v-nissanleaf: Stop Charging 2025-02-02 21:08:15.022 GMT I (338493942) v-nissanleaf: MITM attempted off 2025-02-02 21:08:15.022 GMT I (338493942) v-nissanleaf: MITM turned off 2025-02-02 21:08:15.042 GMT I (338493962) v-nissanleaf: RemoteCommandTimer 6 2025-02-02 21:08:15.042 GMT I (338493962) v-nissanleaf: New TCU on CAR Bus 2025-02-02 21:08:15.042 GMT I (338493962) v-nissanleaf: Sending Wakeup Frame 2025-02-02 21:08:15.042 GMT I (338493962) v-nissanleaf: Stop Charging 2025-02-02 21:08:15.122 GMT I (338494042) v-nissanleaf: MITM attempted off 2025-02-02 21:08:15.122 GMT I (338494042) v-nissanleaf: MITM turned off 2025-02-02 21:08:15.142 GMT I (338494062) v-nissanleaf: RemoteCommandTimer 5 2025-02-02 21:08:15.142 GMT I (338494062) v-nissanleaf: New TCU on CAR Bus 2025-02-02 21:08:15.142 GMT I (338494062) v-nissanleaf: Sending Wakeup Frame 2025-02-02 21:08:15.142 GMT I (338494062) v-nissanleaf: Stop Charging 2025-02-02 21:08:15.222 GMT I (338494142) v-nissanleaf: MITM attempted off 2025-02-02 21:08:15.222 GMT I (338494142) v-nissanleaf: MITM turned off 2025-02-02 21:08:15.242 GMT I (338494162) v-nissanleaf: RemoteCommandTimer 4 2025-02-02 21:08:15.242 GMT I (338494162) v-nissanleaf: New TCU on CAR Bus 2025-02-02 21:08:15.242 GMT I (338494162) v-nissanleaf: Sending Wakeup Frame 2025-02-02 21:08:15.242 GMT I (338494162) v-nissanleaf: Stop Charging 2025-02-02 21:08:15.322 GMT I (338494242) v-nissanleaf: MITM attempted off 2025-02-02 21:08:15.322 GMT I (338494242) v-nissanleaf: MITM turned off 2025-02-02 21:08:15.342 GMT I (338494262) v-nissanleaf: RemoteCommandTimer 3 2025-02-02 21:08:15.342 GMT I (338494262) v-nissanleaf: New TCU on CAR Bus 2025-02-02 21:08:15.342 GMT I (338494262) v-nissanleaf: Sending Wakeup Frame 2025-02-02 21:08:15.342 GMT I (338494262) v-nissanleaf: Stop Charging 2025-02-02 21:08:15.422 GMT I (338494342) v-nissanleaf: MITM attempted off 2025-02-02 21:08:15.422 GMT I (338494342) v-nissanleaf: MITM turned off 2025-02-02 21:08:15.442 GMT I (338494362) v-nissanleaf: RemoteCommandTimer 2 2025-02-02 21:08:15.442 GMT I (338494362) v-nissanleaf: New TCU on CAR Bus 2025-02-02 21:08:15.442 GMT I (338494362) v-nissanleaf: Sending Wakeup Frame 2025-02-02 21:08:15.442 GMT I (338494362) v-nissanleaf: Stop Charging 2025-02-02 21:08:15.522 GMT I (338494442) v-nissanleaf: MITM attempted off 2025-02-02 21:08:15.522 GMT I (338494442) v-nissanleaf: MITM turned off 2025-02-02 21:08:15.542 GMT I (338494462) v-nissanleaf: RemoteCommandTimer 1 2025-02-02 21:08:15.542 GMT I (338494462) v-nissanleaf: New TCU on CAR Bus 2025-02-02 21:08:15.542 GMT I (338494462) v-nissanleaf: Sending Wakeup Frame 2025-02-02 21:08:15.542 GMT I (338494462) v-nissanleaf: Stop Charging 2025-02-02 21:08:15.622 GMT I (338494542) v-nissanleaf: MITM attempted off 2025-02-02 21:08:15.622 GMT I (338494542) v-nissanleaf: MITM turned off 2025-02-02 21:08:15.642 GMT I (338494562) v-nissanleaf: RemoteCommandTimer 0 2025-02-02 21:08:22.142 GMT I (338501062) ovms-server-v3: Tx notify ovms/notify/info/charge/stopped=Charge Stopped, Timer On|0.7Mph|Full: 4:35h|Charged: 3.5kWh|SOC: 52.2%|Ideal range: 66M|Est. range: 41M|ODO: 56580.0M|CAC: 57.5Ah|SOH: 73% 2025-02-02 21:08:22.152 GMT D (338501072) events: Signal(notify.info.charge.stopped) 2025-02-02 21:08:22.372 GMT I (338501292) ovms-server-v3: Message publishing acknowledged (msg_id: 2154) 2025-02-02 21:08:23.142 GMT D (338502062) events: Signal(vehicle.charge.12v.stop) 2025-02-02 21:08:24.142 GMT I (338503062) powermgmt: No longer charging 12V battery.. 2025-02-02 21:09:07.482 GMT D (338546402) vehicle-poll: [1]PollerSend(PRI)[3]: entry at[type=21, pid=1], ticker=3060, wait=0, cnt=0/0 2025-02-02 21:09:07.482 GMT E (338546402) can: can1: intr=49552907 rxpkt=49533436 txpkt=7319 errflags=0x8000d9 rxerr=0 txerr=8 rxinval=0 rxovr=6 txovr=0 txdelay=309 txfail=8283 wdgreset=0 errreset=8 txqueue=0 2025-02-02 21:09:07.482 GMT E (338546402) can: can1: intr=49552911 rxpkt=49533436 txpkt=7319 errflags=0x8000d9 rxerr=0 txerr=40 rxinval=0 rxovr=6 txovr=0 txdelay=309 txfail=8283 wdgreset=0 errreset=8 txqueue=0 2025-02-02 21:09:07.482 GMT E (338546402) can: can1: intr=49552913 rxpkt=49533436 txpkt=7319 errflags=0x8000d9 rxerr=0 txerr=56 rxinval=0 rxovr=6 txovr=0 txdelay=309 txfail=8283 wdgreset=0 errreset=8 txqueue=0 2025-02-02 21:09:07.482 GMT E (338546402) can: can1: intr=49552915 rxpkt=49533436 txpkt=7319 errflags=0x8000d9 rxerr=0 txerr=72 rxinval=0 rxovr=6 txovr=0 txdelay=309 txfail=8283 wdgreset=0 errreset=8 txqueue=0 2025-02-02 21:09:07.482 GMT E (338546402) can: can1: intr=49552916 rxpkt=49533436 txpkt=7319 errflags=0x8000d9 rxerr=0 txerr=80 rxinval=0 rxovr=6 txovr=0 txdelay=309 txfail=8283 wdgreset=0 errreset=8 txqueue=0 2025-02-02 21:09:07.482 GMT E (338546402) can: can1: intr=49552918 rxpkt=49533436 txpkt=7319 errflags=0x8440d9 rxerr=0 txerr=96 rxinval=0 rxovr=6 txovr=0 txdelay=309 txfail=8283 wdgreset=0 errreset=8 txqueue=0 2025-02-02 21:09:07.482 GMT E (338546402) can: can1: intr=49552920 rxpkt=49533436 txpkt=7319 errflags=0x8040d9 rxerr=0 txerr=112 rxinval=0 rxovr=6 txovr=0 txdelay=309 txfail=8283 wdgreset=0 errreset=8 txqueue=0 2025-02-02 21:09:07.482 GMT E (338546402) can: can1: intr=49552923 rxpkt=49533436 txpkt=7319 errflags=0xa040d9 rxerr=0 txerr=128 rxinval=0 rxovr=6 txovr=0 txdelay=309 txfail=8283 wdgreset=0 errreset=8 txqueue=0 2025-02-02 21:09:08.482 GMT D (338547402) vehicle-poll: [1]PollerSend(PRI)[3]: entry at[type=21, pid=2], ticker=3060, wait=0, cnt=0/0 2025-02-02 21:09:09.482 GMT D (338548402) vehicle-poll: [1]PollerSend(PRI)[3]: entry at[type=21, pid=6], ticker=3060, wait=0, cnt=0/0 2025-02-02 21:10:10.482 GMT D (338609402) vehicle-poll: [1]PollerSend(PRI)[3]: entry at[type=21, pid=1], ticker=3120, wait=0, cnt=0/0 2025-02-02 21:10:11.482 GMT D (338610402) vehicle-poll: [1]PollerSend(PRI)[3]: entry at[type=21, pid=2], ticker=3120, wait=0, cnt=0/0 2025-02-02 21:10:12.482 GMT D (338611402) vehicle-poll: [1]PollerSend(PRI)[3]: entry at[type=21, pid=6], ticker=3120, wait=0, cnt=0/0 2025-02-02 21:11:13.482 GMT D (338672402) vehicle-poll: [1]PollerSend(PRI)[3]: entry at[type=21, pid=1], ticker=3180, wait=0, cnt=0/0 2025-02-02 21:11:14.482 GMT D (338673402) vehicle-poll: [1]PollerSend(PRI)[3]: entry at[type=21, pid=2], ticker=3180, wait=0, cnt=0/0 2025-02-02 21:11:15.482 GMT D (338674402) vehicle-poll: [1]PollerSend(PRI)[3]: entry at[type=21, pid=6], ticker=3180, wait=0, cnt=0/0
-- Michael Balzer * Am Rahmen 5 * D-58313 Herdecke Fon 02330 9104094 * Handy 0176 20698926
On 2025-02-03 07:34, Michael Balzer wrote:
your log shows it's not a poller bug, it's a Leaf bug: the Leaf code detects the vehicle state change & sets the state metrics correctly, but does not request the appropriate poller state change.
I don't know the Leaf code, but I think that should directly lead to a poller state change, but doesn't.
So you should investigate that bug in the Leaf module.
I don't know the code either, but I'll see if I can spot anything. Chris
On 2025-02-03 07:34, Michael Balzer wrote:
This is the moment the vehicle state change was detected:
2025-02-02 21:08:14.372 GMT D (338493292) events: Signal(vehicle.charge.stop)
The event is emitted automatically by the vehicle framework when metric "v.c.charging" (ms_v_charge_inprogress) changes from true to false.
I don't know the Leaf code, but I think that should directly lead to a poller state change, but doesn't.
In vehicle_nissanleaf.cpp [1] there are four places where we have "StandardMetrics.ms_v_charge_inprogress->SetValue(false);" They're all in the same switch statement block. Two of them also say "PollSetState(POLLSTATE_OFF);" These are CHARGER_STATUS_INTERRUPTED and CHARGER_STATUS_FINISHED. The two that don't set poll state are CHARGER_STATUS_IDLE and CHARGER_STATUS_PLUGGED_IN_TIMER_WAIT. For anyone that knows the Leaf code, does it seem reasonable to add PollSetState(POLLSTATE_OFF) to both of those? I note there's a mysterious comment "Separate from vehicle_nissanleaf_poll1() to make it clearer what is going on." but I can find no record of such a function in the current repo. Chris Links: ------ [1] https://github.com/openvehicles/Open-Vehicle-Monitoring-System-3/blob/master...
Hi Chris I can't see any issue with setting the poll state to OFF if the charger state is either CHARGER_STATUS_IDLE or CHARGER_STATUS_PLUGGED_IN_TIMER_WAIT, particularly if the can bus goes to sleep in these states. Kind regards Derek On Tue, 4 Feb 2025 at 11:47, Chris Box via OvmsDev < ovmsdev@lists.openvehicles.com> wrote:
On 2025-02-03 07:34, Michael Balzer wrote:
This is the moment the vehicle state change was detected:
2025-02-02 21:08:14.372 GMT D (338493292) events: Signal(vehicle.charge.stop)
The event is emitted automatically by the vehicle framework when metric "v.c.charging" (ms_v_charge_inprogress) changes from true to false.
I don't know the Leaf code, but I think that should directly lead to a poller state change, but doesn't.
In vehicle_nissanleaf.cpp <https://github.com/openvehicles/Open-Vehicle-Monitoring-System-3/blob/master/vehicle/OVMS.V3/components/vehicle_nissanleaf/src/vehicle_nissanleaf.cpp> there are four places where we have "StandardMetrics.ms_v_charge_inprogress->SetValue(false);" They're all in the same switch statement block.
Two of them also say "PollSetState(POLLSTATE_OFF);" These are CHARGER_STATUS_INTERRUPTED and CHARGER_STATUS_FINISHED.
The two that don't set poll state are CHARGER_STATUS_IDLE and CHARGER_STATUS_PLUGGED_IN_TIMER_WAIT.
For anyone that knows the Leaf code, does it seem reasonable to add PollSetState(POLLSTATE_OFF) to both of those? I note there's a mysterious comment "Separate from vehicle_nissanleaf_poll1() to make it clearer what is going on." but I can find no record of such a function in the current repo.
Chris _______________________________________________ OvmsDev mailing list OvmsDev@lists.openvehicles.com http://lists.openvehicles.com/mailman/listinfo/ovmsdev
Chris, Derek, as you're checking the Leaf code, also have a look at this: Am 15.01.25 um 11:11 schrieb Michael Balzer via OvmsDev:
Speaking of the Leaf, the code there actually does something fishy in `CommandWakeup()`:
unsigned char data = 0; … m_can1->WriteStandard(0x5C0, *_8_*, &data); //Wakes up the VCM (by spoofing empty battery request heating)
Regards, Michael Am 04.02.25 um 02:00 schrieb Derek Caudwell via OvmsDev:
Hi Chris
I can't see any issue with setting the poll state to OFF if the charger state is either CHARGER_STATUS_IDLE or CHARGER_STATUS_PLUGGED_IN_TIMER_WAIT, particularly if the can bus goes to sleep in these states.
Kind regards Derek
On Tue, 4 Feb 2025 at 11:47, Chris Box via OvmsDev <ovmsdev@lists.openvehicles.com> wrote:
On 2025-02-03 07:34, Michael Balzer wrote:
This is the moment the vehicle state change was detected:
2025-02-02 21:08:14.372 GMT D (338493292) events: Signal(vehicle.charge.stop)
The event is emitted automatically by the vehicle framework when metric "v.c.charging" (ms_v_charge_inprogress) changes from true to false.
I don't know the Leaf code, but I think that should directly lead to a poller state change, but doesn't.
In vehicle_nissanleaf.cpp <https://github.com/openvehicles/Open-Vehicle-Monitoring-System-3/blob/master/vehicle/OVMS.V3/components/vehicle_nissanleaf/src/vehicle_nissanleaf.cpp> there are four places where we have "StandardMetrics.ms_v_charge_inprogress->SetValue(false);" They're all in the same switch statement block. Two of them also say "PollSetState(POLLSTATE_OFF);" These are CHARGER_STATUS_INTERRUPTED and CHARGER_STATUS_FINISHED. The two that don't set poll state are CHARGER_STATUS_IDLE and CHARGER_STATUS_PLUGGED_IN_TIMER_WAIT. For anyone that knows the Leaf code, does it seem reasonable to add PollSetState(POLLSTATE_OFF) to both of those? I note there's a mysterious comment "Separate from vehicle_nissanleaf_poll1() to make it clearer what is going on." but I can find no record of such a function in the current repo. Chris _______________________________________________ OvmsDev mailing list OvmsDev@lists.openvehicles.com http://lists.openvehicles.com/mailman/listinfo/ovmsdev
_______________________________________________ OvmsDev mailing list OvmsDev@lists.openvehicles.com http://lists.openvehicles.com/mailman/listinfo/ovmsdev
-- Michael Balzer * Am Rahmen 5 * D-58313 Herdecke Fon 02330 9104094 * Handy 0176 20698926
Am 15.01.25 um 11:11 schrieb Michael Balzer via OvmsDev:
Speaking of the Leaf, the code there actually does something fishy in `CommandWakeup()`:
unsigned char data = 0; ... m_can1->WriteStandard(0x5C0, 8, &data); //Wakes up the VCM (by spoofing empty battery request heating)
I agree that is dodgy. It's going to write 8 bytes of data onto the bus, but only the first byte's contents are known. The other 7 are nondeterministic - just whatever happened to be on the stack at that time. This doesn't seem like a recipe for predictable operation. The commit was https://github.com/openvehicles/Open-Vehicle-Monitoring-System-3/commit/09c5... by dalathegreat. Unfortunately my CAN knowledge is close to zero so I can't comment on the messages themselves. Chris
Chris, Am 04.02.25 um 23:49 schrieb Chris Box:
Am 15.01.25 um 11:11 schrieb Michael Balzer via OvmsDev:
Speaking of the Leaf, the code there actually does something fishy in `CommandWakeup()`:
unsigned char data = 0; ... m_can1->WriteStandard(0x5C0, *_8_*, &data); //Wakes up the VCM (by spoofing empty battery request heating) I agree that is dodgy. It's going to write 8 bytes of data onto the bus, but only the first byte's contents are known. The other 7 are nondeterministic - just whatever happened to be on the stack at that time. This doesn't seem like a recipe for predictable operation.
I'd say that seems like a recipe for an occasional car fault condition. If the message needs to be 8 bytes long, I'd expect the car to normally also process all 8 bytes.
The commit was https://github.com/openvehicles/Open-Vehicle-Monitoring-System-3/commit/09c5... by dalathegreat. Unfortunately my CAN knowledge is close to zero so I can't comment on the messages themselves.
You could try if the 8 is the error here by replacing that by 1, and if that then no longer works, you could try making data a deterministic 8 null bytes frame. Regards, Michael -- Michael Balzer * Am Rahmen 5 * D-58313 Herdecke Fon 02330 9104094 * Handy 0176 20698926
On 2025-02-02 22:30, Chris Box via OvmsDev wrote:
This evening, I enabled vehicle-poll debug while it was charging. As you can see from the log below, there was no SetState after charging stopped. Therefore the poller continued in its current state, and polled every minute. So something is causing it to miss the state transition.
The poller eventually realised the car wasn't charging at 05:50 this morning, after it was informed of an interruption to pilot signal. 2025-02-03 05:48:24.512 GMT D (369703402) vehicle-poll: [1]PollerSend(PRI)[3]: entry at[type=21, pid=1], ticker=240, wait=0, cnt=0/0 2025-02-03 05:48:25.512 GMT D (369704402) vehicle-poll: [1]PollerSend(PRI)[3]: entry at[type=21, pid=2], ticker=240, wait=0, cnt=0/0 2025-02-03 05:48:26.512 GMT D (369705402) vehicle-poll: [1]PollerSend(PRI)[3]: entry at[type=21, pid=6], ticker=240, wait=0, cnt=0/0 2025-02-03 05:49:27.512 GMT D (369766402) vehicle-poll: [1]PollerSend(PRI)[3]: entry at[type=21, pid=1], ticker=300, wait=0, cnt=0/0 2025-02-03 05:49:28.512 GMT D (369767402) vehicle-poll: [1]PollerSend(PRI)[3]: entry at[type=21, pid=2], ticker=300, wait=0, cnt=0/0 2025-02-03 05:49:29.512 GMT D (369768402) vehicle-poll: [1]PollerSend(PRI)[3]: entry at[type=21, pid=6], ticker=300, wait=0, cnt=0/0 2025-02-03 05:49:30.512 GMT D (369769402) vehicle-poll: [1]PollerSend(PRI)[3]: entry at[type=21, pid=4], ticker=300, wait=0, cnt=0/0 2025-02-03 05:50:03.222 GMT D (369802112) vehicle-poll: Pollers: Queue SetState() 2025-02-03 05:50:03.222 GMT D (369802112) vehicle-poll: Pollers: PollState(0) 2025-02-03 05:50:03.222 GMT D (369802112) events: Signal(vehicle.charge.pilot.off) 2025-02-03 05:50:03.232 GMT D (369802122) events: Signal(vehicle.charge.state) 2025-02-03 05:50:03.322 GMT D (369802212) events: Signal(vehicle.charge.pilot.on) 2025-02-03 05:50:08.432 GMT D (369807322) events: Signal(vehicle.charge.state) 2025-02-03 05:50:16.182 GMT D (369815072) events: Signal(notify.info.charge.stopped) Subsequently it seems to have followed changes of car state in a timely manner: 2025-02-03 07:20:04.352 GMT D (375203242) vehicle-poll: Pollers: Queue SetState() 2025-02-03 07:20:04.352 GMT D (375203242) vehicle-poll: Pollers: PollState(3) 2025-02-03 07:58:32.552 GMT D (377511442) vehicle-poll: Pollers: Queue SetState() 2025-02-03 07:58:32.552 GMT D (377511442) vehicle-poll: Pollers: PollState(0) 2025-02-03 07:59:02.052 GMT D (377540942) vehicle-poll: Pollers: Queue SetState() 2025-02-03 07:59:02.052 GMT D (377540942) vehicle-poll: Pollers: PollState(1) 2025-02-03 07:59:04.332 GMT D (377543222) vehicle-poll: Pollers: Queue SetState() 2025-02-03 07:59:04.332 GMT D (377543222) vehicle-poll: Pollers: PollState(2) 2025-02-03 08:22:29.712 GMT D (378948592) vehicle-poll: Pollers: Queue SetState() 2025-02-03 08:22:29.712 GMT D (378948592) vehicle-poll: Pollers: PollState(1) 2025-02-03 08:22:32.582 GMT D (378951462) vehicle-poll: Pollers: Queue SetState() 2025-02-03 08:22:32.582 GMT D (378951462) vehicle-poll: Pollers: PollState(0) 2025-02-03 08:24:43.792 GMT D (379082672) vehicle-poll: Pollers: Queue SetState() 2025-02-03 08:24:43.792 GMT D (379082672) vehicle-poll: Pollers: PollState(1) 2025-02-03 08:24:45.382 GMT D (379084262) vehicle-poll: Pollers: Queue SetState() 2025-02-03 08:24:45.382 GMT D (379084262) vehicle-poll: Pollers: PollState(2) 2025-02-03 08:36:10.722 GMT D (379769602) vehicle-poll: Pollers: Queue SetState() 2025-02-03 08:36:10.722 GMT D (379769602) vehicle-poll: Pollers: PollState(1) 2025-02-03 08:37:10.492 GMT D (379829372) vehicle-poll: Pollers: Queue SetState() 2025-02-03 08:37:10.492 GMT D (379829372) vehicle-poll: Pollers: PollState(2) 2025-02-03 08:45:37.572 GMT D (380336452) vehicle-poll: Pollers: Queue SetState() 2025-02-03 08:45:37.582 GMT D (380336462) vehicle-poll: Pollers: PollState(1) 2025-02-03 08:45:41.462 GMT D (380340342) vehicle-poll: Pollers: Queue SetState() 2025-02-03 08:45:41.462 GMT D (380340342) vehicle-poll: Pollers: PollState(0) For the Leaf, 0 = Off 1 = On 2 = Drive 3 = Charging So it might be that the only state transition it struggles with is the one where charging is terminated by OVMS itself. Chris
Hi Michael, Am 24.01.2025 um 19:52 schrieb Michael Balzer via OvmsDev:
To test this timing, apply the attached patch, this also includes the SAE 500 kbit/s timing for can2/3.
I have adopted your change for CAN1. Are adjustments/improvements also necessary at 125KBPS for CAN2/3? Cheers, Simon
Simon, Am 25.01.25 um 21:00 schrieb Simon Ehlen via OvmsDev:
Are adjustments/improvements also necessary at 125KBPS for CAN2/3?
I've had a look at SAE J2284-1 for the 125 kbit timing, and it seems for this speed, the esp-idf, the mcp_can lib and our current driver are outside the spec. SAE recommends a sync jump width of 3 for low (nq=8) and 4 for higher resolutions, and single sampling at 62.5% (range 58.3…69.2%). The esp-idf driver would use a SJW of 3 (would better be 4 as nq=20) and single sampling at 80% (very late). The Arduino lib uses SJW=2 (too low) and triple sampling at 75% (late). Our current driver uses a SJW of 1 (much too low) and triple sampling at 56.25% (too early): case CAN_SPEED_125KBPS: cnf1=0x03; cnf2=0xf0; cnf3=0x86; // BRP=3, PRSEG=1, PS1=7, PS2=7, SJW=1, BTLMODE=1, SAM=1, SOF=1, WAKFIL=0 → Sample 3x at 9/16 = 56,25% (Note: the current comment in the source is incorrect, the tq values need each to be read as +1) Possible SAE solutions for the MCP2515: a) case CAN_SPEED_125KBPS: // SAE J2284-1: // BRP=3, PRSEG=3, PS1=6, PS2=6, SJW=4, BTLMODE=1, SAM=0, SOF=1, WAKFIL=0 → Sample point at 10/16 = 62.5% cnf1=0xc3; cnf2=0xaa; cnf3=0x85; b) case CAN_SPEED_125KBPS: // SAE J2284-1: // BRP=3, PRSEG=3, PS1=7, PS2=5, SJW=4, BTLMODE=1, SAM=0, SOF=1, WAKFIL=0 → Sample point at 11/16 = 68.8% cnf1=0xc3; cnf2=0xb2; cnf3=0x84; Please try. Btw, if anyone would like to experiment: the Microchip timing calculator needs to be set to 16 MHz (that's our MCP2515 clock), and you need to add 0x80 to the cnf3 byte generated (that's the SOF flag, cannot be set in the UI). Regards, Michael -- Michael Balzer * Am Rahmen 5 * D-58313 Herdecke Fon 02330 9104094 * Handy 0176 20698926
Hi Michael, I tried your first suggestion, but after this change the OVMS no longer boots at all. cnf1=0xc3; cnf2=0xaa; cnf3=0x85; What is the easiest way to select the firmware on the second partition? Is there a way via the SD card or do I have to connect the OVMS with USB? Cheers, Simon Am 26.01.2025 um 12:51 schrieb Michael Balzer via OvmsDev:
Simon,
Am 25.01.25 um 21:00 schrieb Simon Ehlen via OvmsDev:
Are adjustments/improvements also necessary at 125KBPS for CAN2/3?
I've had a look at SAE J2284-1 for the 125 kbit timing, and it seems for this speed, the esp-idf, the mcp_can lib and our current driver are outside the spec.
SAE recommends a sync jump width of 3 for low (nq=8) and 4 for higher resolutions, and single sampling at 62.5% (range 58.3…69.2%).
The esp-idf driver would use a SJW of 3 (would better be 4 as nq=20) and single sampling at 80% (very late). The Arduino lib uses SJW=2 (too low) and triple sampling at 75% (late).
Our current driver uses a SJW of 1 (much too low) and triple sampling at 56.25% (too early): case CAN_SPEED_125KBPS: cnf1=0x03; cnf2=0xf0; cnf3=0x86; // BRP=3, PRSEG=1, PS1=7, PS2=7, SJW=1, BTLMODE=1, SAM=1, SOF=1, WAKFIL=0 → Sample 3x at 9/16 = 56,25%
(Note: the current comment in the source is incorrect, the tq values need each to be read as +1)
Possible SAE solutions for the MCP2515:
a) case CAN_SPEED_125KBPS: // SAE J2284-1: // BRP=3, PRSEG=3, PS1=6, PS2=6, SJW=4, BTLMODE=1, SAM=0, SOF=1, WAKFIL=0 → Sample point at 10/16 = 62.5% cnf1=0xc3; cnf2=0xaa; cnf3=0x85; b) case CAN_SPEED_125KBPS: // SAE J2284-1: // BRP=3, PRSEG=3, PS1=7, PS2=5, SJW=4, BTLMODE=1, SAM=0, SOF=1, WAKFIL=0 → Sample point at 11/16 = 68.8% cnf1=0xc3; cnf2=0xb2; cnf3=0x84;
Please try.
Btw, if anyone would like to experiment: the Microchip timing calculator needs to be set to 16 MHz (that's our MCP2515 clock), and you need to add 0x80 to the cnf3 byte generated (that's the SOF flag, cannot be set in the UI).
Regards, Michael
_______________________________________________ OvmsDev mailing list OvmsDev@lists.openvehicles.com http://lists.openvehicles.com/mailman/listinfo/ovmsdev
Simon, you need to connect via USB to set the boot partition if you cannot access the module. But… there is no way a wrong MCP2515 timing could cause this. I'd look for other potential causes. Regards, Michael Am 26.01.25 um 13:58 schrieb Simon Ehlen via OvmsDev:
Hi Michael,
I tried your first suggestion, but after this change the OVMS no longer boots at all.
cnf1=0xc3; cnf2=0xaa; cnf3=0x85;
What is the easiest way to select the firmware on the second partition? Is there a way via the SD card or do I have to connect the OVMS with USB?
Cheers, Simon
Am 26.01.2025 um 12:51 schrieb Michael Balzer via OvmsDev:
Simon,
Am 25.01.25 um 21:00 schrieb Simon Ehlen via OvmsDev:
Are adjustments/improvements also necessary at 125KBPS for CAN2/3?
I've had a look at SAE J2284-1 for the 125 kbit timing, and it seems for this speed, the esp-idf, the mcp_can lib and our current driver are outside the spec.
SAE recommends a sync jump width of 3 for low (nq=8) and 4 for higher resolutions, and single sampling at 62.5% (range 58.3…69.2%).
The esp-idf driver would use a SJW of 3 (would better be 4 as nq=20) and single sampling at 80% (very late). The Arduino lib uses SJW=2 (too low) and triple sampling at 75% (late).
Our current driver uses a SJW of 1 (much too low) and triple sampling at 56.25% (too early): case CAN_SPEED_125KBPS: cnf1=0x03; cnf2=0xf0; cnf3=0x86; // BRP=3, PRSEG=1, PS1=7, PS2=7, SJW=1, BTLMODE=1, SAM=1, SOF=1, WAKFIL=0 → Sample 3x at 9/16 = 56,25%
(Note: the current comment in the source is incorrect, the tq values need each to be read as +1)
Possible SAE solutions for the MCP2515:
a) case CAN_SPEED_125KBPS: // SAE J2284-1: // BRP=3, PRSEG=3, PS1=6, PS2=6, SJW=4, BTLMODE=1, SAM=0, SOF=1, WAKFIL=0 → Sample point at 10/16 = 62.5% cnf1=0xc3; cnf2=0xaa; cnf3=0x85; b) case CAN_SPEED_125KBPS: // SAE J2284-1: // BRP=3, PRSEG=3, PS1=7, PS2=5, SJW=4, BTLMODE=1, SAM=0, SOF=1, WAKFIL=0 → Sample point at 11/16 = 68.8% cnf1=0xc3; cnf2=0xb2; cnf3=0x84;
Please try.
Btw, if anyone would like to experiment: the Microchip timing calculator needs to be set to 16 MHz (that's our MCP2515 clock), and you need to add 0x80 to the cnf3 byte generated (that's the SOF flag, cannot be set in the UI).
Regards, Michael
_______________________________________________ OvmsDev mailing list OvmsDev@lists.openvehicles.com http://lists.openvehicles.com/mailman/listinfo/ovmsdev
_______________________________________________ OvmsDev mailing list OvmsDev@lists.openvehicles.com http://lists.openvehicles.com/mailman/listinfo/ovmsdev
-- Michael Balzer * Am Rahmen 5 * D-58313 Herdecke Fon 02330 9104094 * Handy 0176 20698926
Hi, it is of course possible that it is due to something else. But that was the only code change I flashed. According to the log, it dies at this point: I (2369) v-ffe: Ford Focus Electric vehicle module I (2369) cellular-modem-auto: Power Cycle 2000ms I (2379) mcp2515: can2: SetPowerMode on D (2439) mcp2515: can2: Set register (0x2b val 0x00->0x00) D (2449) mcp2515: can2: - read register (0x2b : 0x00) D (2449) mcp2515: can2: Set register (0x60 val 0x00->0x64) D (2459) mcp2515: can2: - read register (0x60 : 0x64) D (2459) mcp2515: can2: Set register (0x0c val 0x00->0x0c) D (2469) mcp2515: can2: - read register (0x0c : 0x0c) D (2469) mcp2515: can2: Change op mode to 0x60 D (2489) mcp2515: can2: read CANSTAT register (0x0e : 0x60) E (2489) can: can2: intr=1 rxpkt=1 txpkt=0 errflags=0x23401c01 rxerr=0 txerr=0 rxinval=0 rxovr=0 txovr=0 txdelay=0 txfail=0 wdgreset=0 errreset=0 Guru Meditation Error: Core 1 panic'ed (StoreProhibited). Exception was unhandled. Core 1 register dump: PC : 0x4008a830 PS : 0x00060a30 A0 : 0x801aaa31 A1 : 0x3ffc4ab0 A2 : 0x00120000 A3 : 0x3ffc4af0 A4 : 0x00000024 A5 : 0x00120000 A6 : 0x000007e4 A7 : 0x000007ec A8 : 0x00000000 A9 : 0x3ffc4a80 A10 : 0x00000000 A11 : 0x40084a7c A12 : 0x00000003 A13 : 0x00000008 A14 : 0x00000000 A15 : 0x00000000 SAR : 0x00000010 EXCCAUSE: 0x0000001d EXCVADDR: 0x00120000 LBEG : 0x4008a82c LEND : 0x4008a848 LCOUNT : 0x00000001 ELF file SHA256: 5e6a07d4d02b1a79 Backtrace: 0x4008a830:0x3ffc4ab0 0x401aaa2e:0x3ffc4ac0 0x401aab8a:0x3ffc4ae0 0x401aada5:0x3ffc4b40 0x401ab1f7:0x3ffc4b90 0x401ab22e:0x3ffc4c00 0x401a3c07:0x3ffc4c20 0x401a453a:0x3ffc4c50 0x401a4618:0x3ffc4ca0 0x4011a697:0x3ffc4d20 0x4011a256:0x3ffc4d90 0x40119382:0x3ffc4dd0 0x4011979d:0x3ffc4e00 0x40119b8c:0x3ffc4e60 0x40119c11:0x3ffc4ea0 It then boots to a command prompt E (1378) housekeeping: Auto init inhibited: too many early crashes (5) Does that tell you anything? Cheers, Simon Am 26.01.2025 um 14:05 schrieb Michael Balzer via OvmsDev:
Simon,
you need to connect via USB to set the boot partition if you cannot access the module.
But… there is no way a wrong MCP2515 timing could cause this. I'd look for other potential causes.
Regards, Michael
Am 26.01.25 um 13:58 schrieb Simon Ehlen via OvmsDev:
Hi Michael,
I tried your first suggestion, but after this change the OVMS no longer boots at all.
cnf1=0xc3; cnf2=0xaa; cnf3=0x85;
What is the easiest way to select the firmware on the second partition? Is there a way via the SD card or do I have to connect the OVMS with USB?
Cheers, Simon
Am 26.01.2025 um 12:51 schrieb Michael Balzer via OvmsDev:
Simon,
Am 25.01.25 um 21:00 schrieb Simon Ehlen via OvmsDev:
Are adjustments/improvements also necessary at 125KBPS for CAN2/3?
I've had a look at SAE J2284-1 for the 125 kbit timing, and it seems for this speed, the esp-idf, the mcp_can lib and our current driver are outside the spec.
SAE recommends a sync jump width of 3 for low (nq=8) and 4 for higher resolutions, and single sampling at 62.5% (range 58.3…69.2%).
The esp-idf driver would use a SJW of 3 (would better be 4 as nq=20) and single sampling at 80% (very late). The Arduino lib uses SJW=2 (too low) and triple sampling at 75% (late).
Our current driver uses a SJW of 1 (much too low) and triple sampling at 56.25% (too early): case CAN_SPEED_125KBPS: cnf1=0x03; cnf2=0xf0; cnf3=0x86; // BRP=3, PRSEG=1, PS1=7, PS2=7, SJW=1, BTLMODE=1, SAM=1, SOF=1, WAKFIL=0 → Sample 3x at 9/16 = 56,25%
(Note: the current comment in the source is incorrect, the tq values need each to be read as +1)
Possible SAE solutions for the MCP2515:
a) case CAN_SPEED_125KBPS: // SAE J2284-1: // BRP=3, PRSEG=3, PS1=6, PS2=6, SJW=4, BTLMODE=1, SAM=0, SOF=1, WAKFIL=0 → Sample point at 10/16 = 62.5% cnf1=0xc3; cnf2=0xaa; cnf3=0x85; b) case CAN_SPEED_125KBPS: // SAE J2284-1: // BRP=3, PRSEG=3, PS1=7, PS2=5, SJW=4, BTLMODE=1, SAM=0, SOF=1, WAKFIL=0 → Sample point at 11/16 = 68.8% cnf1=0xc3; cnf2=0xb2; cnf3=0x84;
Please try.
Btw, if anyone would like to experiment: the Microchip timing calculator needs to be set to 16 MHz (that's our MCP2515 clock), and you need to add 0x80 to the cnf3 byte generated (that's the SOF flag, cannot be set in the UI).
Regards, Michael
_______________________________________________ OvmsDev mailing list OvmsDev@lists.openvehicles.com http://lists.openvehicles.com/mailman/listinfo/ovmsdev
_______________________________________________ OvmsDev mailing list OvmsDev@lists.openvehicles.com http://lists.openvehicles.com/mailman/listinfo/ovmsdev
_______________________________________________ OvmsDev mailing list OvmsDev@lists.openvehicles.com http://lists.openvehicles.com/mailman/listinfo/ovmsdev
Simon, you need to decode the backtrace yourself, as you have local code additions we do not have. Use the a2l script (in support). Regards, Michael Am 26.01.25 um 14:52 schrieb Simon Ehlen via OvmsDev:
Hi, it is of course possible that it is due to something else. But that was the only code change I flashed. According to the log, it dies at this point:
I (2369) v-ffe: Ford Focus Electric vehicle module I (2369) cellular-modem-auto: Power Cycle 2000ms I (2379) mcp2515: can2: SetPowerMode on D (2439) mcp2515: can2: Set register (0x2b val 0x00->0x00) D (2449) mcp2515: can2: - read register (0x2b : 0x00) D (2449) mcp2515: can2: Set register (0x60 val 0x00->0x64) D (2459) mcp2515: can2: - read register (0x60 : 0x64) D (2459) mcp2515: can2: Set register (0x0c val 0x00->0x0c) D (2469) mcp2515: can2: - read register (0x0c : 0x0c) D (2469) mcp2515: can2: Change op mode to 0x60 D (2489) mcp2515: can2: read CANSTAT register (0x0e : 0x60) E (2489) can: can2: intr=1 rxpkt=1 txpkt=0 errflags=0x23401c01 rxerr=0 txerr=0 rxinval=0 rxovr=0 txovr=0 txdelay=0 txfail=0 wdgreset=0 errreset=0 Guru Meditation Error: Core 1 panic'ed (StoreProhibited). Exception was unhandled. Core 1 register dump: PC : 0x4008a830 PS : 0x00060a30 A0 : 0x801aaa31 A1 : 0x3ffc4ab0 A2 : 0x00120000 A3 : 0x3ffc4af0 A4 : 0x00000024 A5 : 0x00120000 A6 : 0x000007e4 A7 : 0x000007ec A8 : 0x00000000 A9 : 0x3ffc4a80 A10 : 0x00000000 A11 : 0x40084a7c A12 : 0x00000003 A13 : 0x00000008 A14 : 0x00000000 A15 : 0x00000000 SAR : 0x00000010 EXCCAUSE: 0x0000001d EXCVADDR: 0x00120000 LBEG : 0x4008a82c LEND : 0x4008a848 LCOUNT : 0x00000001
ELF file SHA256: 5e6a07d4d02b1a79
Backtrace: 0x4008a830:0x3ffc4ab0 0x401aaa2e:0x3ffc4ac0 0x401aab8a:0x3ffc4ae0 0x401aada5:0x3ffc4b40 0x401ab1f7:0x3ffc4b90 0x401ab22e:0x3ffc4c00 0x401a3c07:0x3ffc4c20 0x401a453a:0x3ffc4c50 0x401a4618:0x3ffc4ca0 0x4011a697:0x3ffc4d20 0x4011a256:0x3ffc4d90 0x40119382:0x3ffc4dd0 0x4011979d:0x3ffc4e00 0x40119b8c:0x3ffc4e60 0x40119c11:0x3ffc4ea0
It then boots to a command prompt E (1378) housekeeping: Auto init inhibited: too many early crashes (5)
Does that tell you anything?
Cheers, Simon
Am 26.01.2025 um 14:05 schrieb Michael Balzer via OvmsDev:
Simon,
you need to connect via USB to set the boot partition if you cannot access the module.
But… there is no way a wrong MCP2515 timing could cause this. I'd look for other potential causes.
Regards, Michael
Am 26.01.25 um 13:58 schrieb Simon Ehlen via OvmsDev:
Hi Michael,
I tried your first suggestion, but after this change the OVMS no longer boots at all.
cnf1=0xc3; cnf2=0xaa; cnf3=0x85;
What is the easiest way to select the firmware on the second partition? Is there a way via the SD card or do I have to connect the OVMS with USB?
Cheers, Simon
Am 26.01.2025 um 12:51 schrieb Michael Balzer via OvmsDev:
Simon,
Am 25.01.25 um 21:00 schrieb Simon Ehlen via OvmsDev:
Are adjustments/improvements also necessary at 125KBPS for CAN2/3?
I've had a look at SAE J2284-1 for the 125 kbit timing, and it seems for this speed, the esp-idf, the mcp_can lib and our current driver are outside the spec.
SAE recommends a sync jump width of 3 for low (nq=8) and 4 for higher resolutions, and single sampling at 62.5% (range 58.3…69.2%).
The esp-idf driver would use a SJW of 3 (would better be 4 as nq=20) and single sampling at 80% (very late). The Arduino lib uses SJW=2 (too low) and triple sampling at 75% (late).
Our current driver uses a SJW of 1 (much too low) and triple sampling at 56.25% (too early): case CAN_SPEED_125KBPS: cnf1=0x03; cnf2=0xf0; cnf3=0x86; // BRP=3, PRSEG=1, PS1=7, PS2=7, SJW=1, BTLMODE=1, SAM=1, SOF=1, WAKFIL=0 → Sample 3x at 9/16 = 56,25%
(Note: the current comment in the source is incorrect, the tq values need each to be read as +1)
Possible SAE solutions for the MCP2515:
a) case CAN_SPEED_125KBPS: // SAE J2284-1: // BRP=3, PRSEG=3, PS1=6, PS2=6, SJW=4, BTLMODE=1, SAM=0, SOF=1, WAKFIL=0 → Sample point at 10/16 = 62.5% cnf1=0xc3; cnf2=0xaa; cnf3=0x85; b) case CAN_SPEED_125KBPS: // SAE J2284-1: // BRP=3, PRSEG=3, PS1=7, PS2=5, SJW=4, BTLMODE=1, SAM=0, SOF=1, WAKFIL=0 → Sample point at 11/16 = 68.8% cnf1=0xc3; cnf2=0xb2; cnf3=0x84;
Please try.
Btw, if anyone would like to experiment: the Microchip timing calculator needs to be set to 16 MHz (that's our MCP2515 clock), and you need to add 0x80 to the cnf3 byte generated (that's the SOF flag, cannot be set in the UI).
Regards, Michael
_______________________________________________ OvmsDev mailing list OvmsDev@lists.openvehicles.com http://lists.openvehicles.com/mailman/listinfo/ovmsdev
_______________________________________________ OvmsDev mailing list OvmsDev@lists.openvehicles.com http://lists.openvehicles.com/mailman/listinfo/ovmsdev
_______________________________________________ OvmsDev mailing list OvmsDev@lists.openvehicles.com http://lists.openvehicles.com/mailman/listinfo/ovmsdev
_______________________________________________ OvmsDev mailing list OvmsDev@lists.openvehicles.com http://lists.openvehicles.com/mailman/listinfo/ovmsdev
-- Michael Balzer * Am Rahmen 5 * D-58313 Herdecke Fon 02330 9104094 * Handy 0176 20698926
Hi Michael, please find attached the corresponding backtrace. However, I don't think it has anything to do with the code. Because on the one hand I only changed the timing for the mcp2515 and on the other hand the firmware in the other ota partition crashes with the same error now. The firmware in the other ota partition has been running for several days without a single crash, so that makes no sense to me. Unless it's a general problem with the flash. Cheers, Simon Am 26.01.2025 um 16:16 schrieb Michael Balzer via OvmsDev:
Simon,
you need to decode the backtrace yourself, as you have local code additions we do not have. Use the a2l script (in support).
Regards, Michael
Am 26.01.25 um 14:52 schrieb Simon Ehlen via OvmsDev:
Hi, it is of course possible that it is due to something else. But that was the only code change I flashed. According to the log, it dies at this point:
I (2369) v-ffe: Ford Focus Electric vehicle module I (2369) cellular-modem-auto: Power Cycle 2000ms I (2379) mcp2515: can2: SetPowerMode on D (2439) mcp2515: can2: Set register (0x2b val 0x00->0x00) D (2449) mcp2515: can2: - read register (0x2b : 0x00) D (2449) mcp2515: can2: Set register (0x60 val 0x00->0x64) D (2459) mcp2515: can2: - read register (0x60 : 0x64) D (2459) mcp2515: can2: Set register (0x0c val 0x00->0x0c) D (2469) mcp2515: can2: - read register (0x0c : 0x0c) D (2469) mcp2515: can2: Change op mode to 0x60 D (2489) mcp2515: can2: read CANSTAT register (0x0e : 0x60) E (2489) can: can2: intr=1 rxpkt=1 txpkt=0 errflags=0x23401c01 rxerr=0 txerr=0 rxinval=0 rxovr=0 txovr=0 txdelay=0 txfail=0 wdgreset=0 errreset=0 Guru Meditation Error: Core 1 panic'ed (StoreProhibited). Exception was unhandled. Core 1 register dump: PC : 0x4008a830 PS : 0x00060a30 A0 : 0x801aaa31 A1 : 0x3ffc4ab0 A2 : 0x00120000 A3 : 0x3ffc4af0 A4 : 0x00000024 A5 : 0x00120000 A6 : 0x000007e4 A7 : 0x000007ec A8 : 0x00000000 A9 : 0x3ffc4a80 A10 : 0x00000000 A11 : 0x40084a7c A12 : 0x00000003 A13 : 0x00000008 A14 : 0x00000000 A15 : 0x00000000 SAR : 0x00000010 EXCCAUSE: 0x0000001d EXCVADDR: 0x00120000 LBEG : 0x4008a82c LEND : 0x4008a848 LCOUNT : 0x00000001
ELF file SHA256: 5e6a07d4d02b1a79
Backtrace: 0x4008a830:0x3ffc4ab0 0x401aaa2e:0x3ffc4ac0 0x401aab8a:0x3ffc4ae0 0x401aada5:0x3ffc4b40 0x401ab1f7:0x3ffc4b90 0x401ab22e:0x3ffc4c00 0x401a3c07:0x3ffc4c20 0x401a453a:0x3ffc4c50 0x401a4618:0x3ffc4ca0 0x4011a697:0x3ffc4d20 0x4011a256:0x3ffc4d90 0x40119382:0x3ffc4dd0 0x4011979d:0x3ffc4e00 0x40119b8c:0x3ffc4e60 0x40119c11:0x3ffc4ea0
It then boots to a command prompt E (1378) housekeeping: Auto init inhibited: too many early crashes (5)
Does that tell you anything?
Cheers, Simon
Am 26.01.2025 um 14:05 schrieb Michael Balzer via OvmsDev:
Simon,
you need to connect via USB to set the boot partition if you cannot access the module.
But… there is no way a wrong MCP2515 timing could cause this. I'd look for other potential causes.
Regards, Michael
Am 26.01.25 um 13:58 schrieb Simon Ehlen via OvmsDev:
Hi Michael,
I tried your first suggestion, but after this change the OVMS no longer boots at all.
cnf1=0xc3; cnf2=0xaa; cnf3=0x85;
What is the easiest way to select the firmware on the second partition? Is there a way via the SD card or do I have to connect the OVMS with USB?
Cheers, Simon
Am 26.01.2025 um 12:51 schrieb Michael Balzer via OvmsDev:
Simon,
Am 25.01.25 um 21:00 schrieb Simon Ehlen via OvmsDev:
Are adjustments/improvements also necessary at 125KBPS for CAN2/3?
I've had a look at SAE J2284-1 for the 125 kbit timing, and it seems for this speed, the esp-idf, the mcp_can lib and our current driver are outside the spec.
SAE recommends a sync jump width of 3 for low (nq=8) and 4 for higher resolutions, and single sampling at 62.5% (range 58.3…69.2%).
The esp-idf driver would use a SJW of 3 (would better be 4 as nq=20) and single sampling at 80% (very late). The Arduino lib uses SJW=2 (too low) and triple sampling at 75% (late).
Our current driver uses a SJW of 1 (much too low) and triple sampling at 56.25% (too early): case CAN_SPEED_125KBPS: cnf1=0x03; cnf2=0xf0; cnf3=0x86; // BRP=3, PRSEG=1, PS1=7, PS2=7, SJW=1, BTLMODE=1, SAM=1, SOF=1, WAKFIL=0 → Sample 3x at 9/16 = 56,25%
(Note: the current comment in the source is incorrect, the tq values need each to be read as +1)
Possible SAE solutions for the MCP2515:
a) case CAN_SPEED_125KBPS: // SAE J2284-1: // BRP=3, PRSEG=3, PS1=6, PS2=6, SJW=4, BTLMODE=1, SAM=0, SOF=1, WAKFIL=0 → Sample point at 10/16 = 62.5% cnf1=0xc3; cnf2=0xaa; cnf3=0x85; b) case CAN_SPEED_125KBPS: // SAE J2284-1: // BRP=3, PRSEG=3, PS1=7, PS2=5, SJW=4, BTLMODE=1, SAM=0, SOF=1, WAKFIL=0 → Sample point at 11/16 = 68.8% cnf1=0xc3; cnf2=0xb2; cnf3=0x84;
Please try.
Btw, if anyone would like to experiment: the Microchip timing calculator needs to be set to 16 MHz (that's our MCP2515 clock), and you need to add 0x80 to the cnf3 byte generated (that's the SOF flag, cannot be set in the UI).
Regards, Michael
_______________________________________________ OvmsDev mailing list OvmsDev@lists.openvehicles.com http://lists.openvehicles.com/mailman/listinfo/ovmsdev
_______________________________________________ OvmsDev mailing list OvmsDev@lists.openvehicles.com http://lists.openvehicles.com/mailman/listinfo/ovmsdev
_______________________________________________ OvmsDev mailing list OvmsDev@lists.openvehicles.com http://lists.openvehicles.com/mailman/listinfo/ovmsdev
_______________________________________________ OvmsDev mailing list OvmsDev@lists.openvehicles.com http://lists.openvehicles.com/mailman/listinfo/ovmsdev
_______________________________________________ OvmsDev mailing list OvmsDev@lists.openvehicles.com http://lists.openvehicles.com/mailman/listinfo/ovmsdev
Simon, as you can see yourself, this looks like your `BMSSetupPolling()` tries to access some uninitialized vector. Maybe `ConfigChanged(NULL);` should be done after what follows ``// Init polling:``? Regards, Michael Am 26.01.25 um 16:25 schrieb Simon Ehlen via OvmsDev:
Hi Michael,
please find attached the corresponding backtrace. However, I don't think it has anything to do with the code. Because on the one hand I only changed the timing for the mcp2515 and on the other hand the firmware in the other ota partition crashes with the same error now. The firmware in the other ota partition has been running for several days without a single crash, so that makes no sense to me. Unless it's a general problem with the flash.
Cheers, Simon
Am 26.01.2025 um 16:16 schrieb Michael Balzer via OvmsDev:
Simon,
you need to decode the backtrace yourself, as you have local code additions we do not have. Use the a2l script (in support).
Regards, Michael
Am 26.01.25 um 14:52 schrieb Simon Ehlen via OvmsDev:
Hi, it is of course possible that it is due to something else. But that was the only code change I flashed. According to the log, it dies at this point:
I (2369) v-ffe: Ford Focus Electric vehicle module I (2369) cellular-modem-auto: Power Cycle 2000ms I (2379) mcp2515: can2: SetPowerMode on D (2439) mcp2515: can2: Set register (0x2b val 0x00->0x00) D (2449) mcp2515: can2: - read register (0x2b : 0x00) D (2449) mcp2515: can2: Set register (0x60 val 0x00->0x64) D (2459) mcp2515: can2: - read register (0x60 : 0x64) D (2459) mcp2515: can2: Set register (0x0c val 0x00->0x0c) D (2469) mcp2515: can2: - read register (0x0c : 0x0c) D (2469) mcp2515: can2: Change op mode to 0x60 D (2489) mcp2515: can2: read CANSTAT register (0x0e : 0x60) E (2489) can: can2: intr=1 rxpkt=1 txpkt=0 errflags=0x23401c01 rxerr=0 txerr=0 rxinval=0 rxovr=0 txovr=0 txdelay=0 txfail=0 wdgreset=0 errreset=0 Guru Meditation Error: Core 1 panic'ed (StoreProhibited). Exception was unhandled. Core 1 register dump: PC : 0x4008a830 PS : 0x00060a30 A0 : 0x801aaa31 A1 : 0x3ffc4ab0 A2 : 0x00120000 A3 : 0x3ffc4af0 A4 : 0x00000024 A5 : 0x00120000 A6 : 0x000007e4 A7 : 0x000007ec A8 : 0x00000000 A9 : 0x3ffc4a80 A10 : 0x00000000 A11 : 0x40084a7c A12 : 0x00000003 A13 : 0x00000008 A14 : 0x00000000 A15 : 0x00000000 SAR : 0x00000010 EXCCAUSE: 0x0000001d EXCVADDR: 0x00120000 LBEG : 0x4008a82c LEND : 0x4008a848 LCOUNT : 0x00000001
ELF file SHA256: 5e6a07d4d02b1a79
Backtrace: 0x4008a830:0x3ffc4ab0 0x401aaa2e:0x3ffc4ac0 0x401aab8a:0x3ffc4ae0 0x401aada5:0x3ffc4b40 0x401ab1f7:0x3ffc4b90 0x401ab22e:0x3ffc4c00 0x401a3c07:0x3ffc4c20 0x401a453a:0x3ffc4c50 0x401a4618:0x3ffc4ca0 0x4011a697:0x3ffc4d20 0x4011a256:0x3ffc4d90 0x40119382:0x3ffc4dd0 0x4011979d:0x3ffc4e00 0x40119b8c:0x3ffc4e60 0x40119c11:0x3ffc4ea0
It then boots to a command prompt E (1378) housekeeping: Auto init inhibited: too many early crashes (5)
Does that tell you anything?
Cheers, Simon
Am 26.01.2025 um 14:05 schrieb Michael Balzer via OvmsDev:
Simon,
you need to connect via USB to set the boot partition if you cannot access the module.
But… there is no way a wrong MCP2515 timing could cause this. I'd look for other potential causes.
Regards, Michael
Am 26.01.25 um 13:58 schrieb Simon Ehlen via OvmsDev:
Hi Michael,
I tried your first suggestion, but after this change the OVMS no longer boots at all.
cnf1=0xc3; cnf2=0xaa; cnf3=0x85;
What is the easiest way to select the firmware on the second partition? Is there a way via the SD card or do I have to connect the OVMS with USB?
Cheers, Simon
Am 26.01.2025 um 12:51 schrieb Michael Balzer via OvmsDev:
Simon,
Am 25.01.25 um 21:00 schrieb Simon Ehlen via OvmsDev: > Are adjustments/improvements also necessary at 125KBPS for CAN2/3?
I've had a look at SAE J2284-1 for the 125 kbit timing, and it seems for this speed, the esp-idf, the mcp_can lib and our current driver are outside the spec.
SAE recommends a sync jump width of 3 for low (nq=8) and 4 for higher resolutions, and single sampling at 62.5% (range 58.3…69.2%).
The esp-idf driver would use a SJW of 3 (would better be 4 as nq=20) and single sampling at 80% (very late). The Arduino lib uses SJW=2 (too low) and triple sampling at 75% (late).
Our current driver uses a SJW of 1 (much too low) and triple sampling at 56.25% (too early): case CAN_SPEED_125KBPS: cnf1=0x03; cnf2=0xf0; cnf3=0x86; // BRP=3, PRSEG=1, PS1=7, PS2=7, SJW=1, BTLMODE=1, SAM=1, SOF=1, WAKFIL=0 → Sample 3x at 9/16 = 56,25%
(Note: the current comment in the source is incorrect, the tq values need each to be read as +1)
Possible SAE solutions for the MCP2515:
a) case CAN_SPEED_125KBPS: // SAE J2284-1: // BRP=3, PRSEG=3, PS1=6, PS2=6, SJW=4, BTLMODE=1, SAM=0, SOF=1, WAKFIL=0 → Sample point at 10/16 = 62.5% cnf1=0xc3; cnf2=0xaa; cnf3=0x85; b) case CAN_SPEED_125KBPS: // SAE J2284-1: // BRP=3, PRSEG=3, PS1=7, PS2=5, SJW=4, BTLMODE=1, SAM=0, SOF=1, WAKFIL=0 → Sample point at 11/16 = 68.8% cnf1=0xc3; cnf2=0xb2; cnf3=0x84;
Please try.
Btw, if anyone would like to experiment: the Microchip timing calculator needs to be set to 16 MHz (that's our MCP2515 clock), and you need to add 0x80 to the cnf3 byte generated (that's the SOF flag, cannot be set in the UI).
Regards, Michael
_______________________________________________ OvmsDev mailing list OvmsDev@lists.openvehicles.com http://lists.openvehicles.com/mailman/listinfo/ovmsdev
_______________________________________________ OvmsDev mailing list OvmsDev@lists.openvehicles.com http://lists.openvehicles.com/mailman/listinfo/ovmsdev
_______________________________________________ OvmsDev mailing list OvmsDev@lists.openvehicles.com http://lists.openvehicles.com/mailman/listinfo/ovmsdev
_______________________________________________ OvmsDev mailing list OvmsDev@lists.openvehicles.com http://lists.openvehicles.com/mailman/listinfo/ovmsdev
_______________________________________________ OvmsDev mailing list OvmsDev@lists.openvehicles.com http://lists.openvehicles.com/mailman/listinfo/ovmsdev
_______________________________________________ OvmsDev mailing list OvmsDev@lists.openvehicles.com http://lists.openvehicles.com/mailman/listinfo/ovmsdev
-- Michael Balzer * Am Rahmen 5 * D-58313 Herdecke Fon 02330 9104094 * Handy 0176 20698926
Ok, a few thoughts on various things. if m_poll.entry.txmoduleid is 0, or the incoming moduleid doesn't match the min/max range (it should be 0 because no polls were done), then it won't call the ISOTP (or VWTP) protocol response code.. so afaict it shouldn't be sending anything. Maybe try setting CONFIG_OVMS_VEHICLE_CAN_RX_QUEUE_SIZE = 160 and see if that reduces the overflow? Though really it shouldn't alter what is happening - though may it will confirm if the atomic commands are an issue - though I would have thought they would be much, much less overhead than a critical section!!?? The overflow should be more a pressure relief valve than anything. The log itself is on the Info level of vehicle-poll but unless somehow the logs are part of the problem. it would make sense to move the task queue overflow check down a bit into the switch for case OvmsPoller::OvmsPollEntryType::Poll: This would make sense as currently it will be checking it for every message. I was thinking that the frame filter would be here: void OvmsPollers::PollerRxCallback(const CAN_frame_t* frame, bool success) { Queue_PollerFrame(*frame, success, false); } which I guess is executed in the task handling the CAN queue. (we don't know how many frames get dropped there). The only real concern is thread safety between checking and adding to the filter - so the check itself might have to be mutexed. void OvmsPollers::PollerRxCallback(const CAN_frame_t* frame, bool success) { // Check filter { OvmsRecMutexLock lock(&m_filter_mutex); if (! m_filter->IsFiltered(frame)) return; } Queue_PollerFrame(*frame, success, false); } //.ichael On Wed, 15 Jan 2025 at 14:15, Simon Ehlen via OvmsDev < ovmsdev@lists.openvehicles.com> wrote:
Thanks Mark for the explanation. So does this mean that OVMS tries to acknowledge all incoming messages in active mode? This seems to me to clearly exceed the capacity of OVMS with the mass of incoming messages.
In fact, I am currently opening the bus in active mode, as I was hoping to get my code to revive the BMS in OVMS to work. However, unlike the other data, I only get the cell voltages when I actively poll them. To be on the safe side, I will now open the bus in read mode again.
However, I am still wondering what in the poller change has altered the OVMS in such a way that the bus is now crashing completely. Currently I have undone the changes since february 2024, this only concerns code from the public repository, there was no change from me in that period. Now the OVMS is running stable again and there are neither queue overflows nor bus crashes.
I had also previously increased the following queue sizes, but unfortunately this was not successful: CONFIG_OVMS_HW_EVENT_QUEUE_SIZE=120 CONFIG_OVMS_HW_CAN_RX_QUEUE_SIZE=80 CONFIG_OVMS_VEHICLE_CAN_RX_QUEUE_SIZE=80
Cheers, Simon
Am 15.01.2025 um 02:08 schrieb Mark Webb-Johnson:
Note sure if this helps, but some comments:
- Remember than CAN protocol in normal mode is an ‘active’ protocol. Nodes on the bus are actively acknowledging messages (and that includes OVMS), even if they never write messages. So in normal mode there is no absolute ‘read access’. For example, opening the CAN port at the wrong baud rate, even if not writing messages, will mess up the bus.
- However, if you open the CAN port in ‘listen’ mode, then it is truly read-only. In that mode it will not acknowledge messages, and cannot write on the bus at all. I’ve never seen an OVMS mess up a bus in listen mode, even if the baud rate is wrong. I think the only way for that to happen would be a hardware layer issue (cabling, termination, etc).
Regards, Mark.
On 15 Jan 2025, at 6:30 AM, Simon Ehlen via OvmsDev <ovmsdev@lists.openvehicles.com> <ovmsdev@lists.openvehicles.com> wrote:
But what is the reason that a read access to the bus can cause the bus to crash? This is not critical during charging, it just aborts the charging process with an error. While driving, this results in a “stop safely now” error message on the dashboard and the engine is switched off immediately.
Cheers, Simon
Am 14.01.2025 um 23:22 schrieb Michael Geddes via OvmsDev:
You may need to increase the queue size for the poll task queue.
The poller still handles the bus to vehicle notifications even if it is off.
Any poller logging on such an intensive load of can messages is likely to be a problem. This is part of the reason it is flagged off.
The total % looks wrong :/
//.ichael
On Wed, 15 Jan 2025, 03:17 Simon Ehlen via OvmsDev, < ovmsdev@lists.openvehicles.com> wrote:
Hi,
I finally got around to merging my code with the current master (previous merge february 2024). I have rebuilt my code for a Ford Focus Electric so that it uses the new OvmsPoller class.
However, I now see a lot of entries like this in my log:
I (246448) vehicle-poll: Poller[Frame]: RX Task Queue Overflow Run 8 I (246448) vehicle-poll: Poller[Frame]: RX Task Queue Overflow Run 3 I (246448) vehicle-poll: Poller[Frame]: RX Task Queue Overflow Run 1 I (246448) vehicle-poll: Poller[Frame]: RX Task Queue Overflow Run 2 I (246448) vehicle-poll: Poller[Frame]: RX Task Queue Overflow Run 1 I (246448) vehicle-poll: Poller[Frame]: RX Task Queue Overflow Run 2 I (246448) vehicle-poll: Poller[Frame]: RX Task Queue Overflow Run 1 I (246448) vehicle-poll: Poller[Frame]: RX Task Queue Overflow Run 1 I (254448) vehicle-poll: Poller[Frame]: RX Task Queue Overflow Run 24 I (254448) vehicle-poll: Poller[Frame]: RX Task Queue Overflow Run 1 I (254448) vehicle-poll: Poller[Frame]: RX Task Queue Overflow Run 1 I (254448) vehicle-poll: Poller[Frame]: RX Task Queue Overflow Run 1 I (254448) vehicle-poll: Poller[Frame]: RX Task Queue Overflow Run 1 I (254448) vehicle-poll: Poller[Frame]: RX Task Queue Overflow Run 1 I (254448) vehicle-poll: Poller[Frame]: RX Task Queue Overflow Run 1
Was this message just hidden before or do I need to make further adjustments to my code?
My code currently does not use active polling but reads on the busses (IncomingFrameCanX) on certain modules.
When I look at poller times status, it looks very extensive to me...
OVMS# poller times status Poller timing is: on Type | count | Utlztn | Time | per s | [%] | [ms] ---------------+--------+--------+--------- Poll:PRI Avg| 0.00| 0.0000| 0.003 Peak| | 0.0014| 0.041 ---------------+--------+--------+--------- RxCan1[010] Avg| 0.00| 0.0000| 0.020 Peak| | 1.2217| 1.089 ---------------+--------+--------+--------- RxCan1[030] Avg| 0.00| 0.0000| 0.024 Peak| | 1.2193| 1.241 ---------------+--------+--------+--------- RxCan1[041] Avg| 0.00| 0.0000| 0.023 Peak| | 0.6460| 1.508 ---------------+--------+--------+--------- RxCan1[049] Avg| 0.00| 0.0000| 0.024 Peak| | 0.6320| 0.630 ---------------+--------+--------+--------- RxCan1[04c] Avg| 0.00| 0.0000| 0.023 Peak| | 0.6430| 1.474 ---------------+--------+--------+--------- RxCan1[04d] Avg| 0.00| 0.0000| 0.022 Peak| | 1.2987| 1.359 ---------------+--------+--------+--------- RxCan1[076] Avg| 0.00| 0.0000| 0.072 Peak| | 0.7818| 15.221 ---------------+--------+--------+--------- RxCan1[077] Avg| 0.00| 0.0000| 0.022 Peak| | 0.6274| 0.955 ---------------+--------+--------+--------- RxCan1[07a] Avg| 0.00| 0.0000| 0.039 Peak| | 1.7602| 1.684 ---------------+--------+--------+--------- RxCan1[07d] Avg| 0.00| 0.0000| 0.023 Peak| | 0.6621| 1.913 ---------------+--------+--------+--------- RxCan1[0c8] Avg| 0.00| 0.0000| 0.026 Peak| | 0.6292| 1.412 ---------------+--------+--------+--------- RxCan1[11a] Avg| 0.00| 0.0000| 0.023 Peak| | 1.2635| 1.508 ---------------+--------+--------+--------- RxCan1[130] Avg| 0.00| 0.0000| 0.024 Peak| | 0.6548| 0.703 ---------------+--------+--------+--------- RxCan1[139] Avg| 0.00| 0.0000| 0.021 Peak| | 0.6002| 0.984 ---------------+--------+--------+--------- RxCan1[156] Avg| 0.00| 0.0000| 0.024 Peak| | 0.1225| 0.479 ---------------+--------+--------+--------- RxCan1[160] Avg| 0.00| 0.0000| 0.028 Peak| | 0.6586| 1.376 ---------------+--------+--------+--------- RxCan1[165] Avg| 0.00| 0.0000| 0.027 Peak| | 0.6368| 1.132 ---------------+--------+--------+--------- RxCan1[167] Avg| 0.00| 0.0000| 0.024 Peak| | 1.3009| 1.067 ---------------+--------+--------+--------- RxCan1[171] Avg| 0.00| 0.0000| 0.022 Peak| | 0.6590| 4.320 ---------------+--------+--------+--------- RxCan1[178] Avg| 0.00| 0.0000| 0.023 Peak| | 0.1161| 0.311 ---------------+--------+--------+--------- RxCan1[179] Avg| 0.00| 0.0000| 0.024 Peak| | 0.1236| 0.536 ---------------+--------+--------+--------- RxCan1[180] Avg| 0.00| 0.0000| 0.022 Peak| | 0.6472| 1.193 ---------------+--------+--------+--------- RxCan1[185] Avg| 0.00| 0.0000| 0.022 Peak| | 0.6777| 1.385 ---------------+--------+--------+--------- RxCan1[1a0] Avg| 0.00| 0.0000| 0.022 Peak| | 0.6486| 2.276 ---------------+--------+--------+--------- RxCan1[1e0] Avg| 0.00| 0.0000| 0.023 Peak| | 0.6725| 1.376 ---------------+--------+--------+--------- RxCan1[1e4] Avg| 0.00| 0.0000| 0.027 Peak| | 0.7370| 1.266 ---------------+--------+--------+--------- RxCan1[1f0] Avg| 0.00| 0.0000| 0.024 Peak| | 0.4253| 0.753 ---------------+--------+--------+--------- RxCan1[200] Avg| 0.00| 0.0000| 0.025 Peak| | 0.6262| 0.791 ---------------+--------+--------+--------- RxCan1[202] Avg| 0.00| 0.0000| 0.021 Peak| | 1.2915| 1.257 ---------------+--------+--------+--------- RxCan1[204] Avg| 0.00| 0.0000| 0.022 Peak| | 1.2620| 1.010 ---------------+--------+--------+--------- RxCan1[213] Avg| 0.00| 0.0000| 0.022 Peak| | 0.6331| 1.185 ---------------+--------+--------+--------- RxCan1[214] Avg| 0.00| 0.0000| 0.023 Peak| | 0.9977| 34.527 ---------------+--------+--------+--------- RxCan1[217] Avg| 0.00| 0.0000| 0.024 Peak| | 1.2825| 1.328 ---------------+--------+--------+--------- RxCan1[218] Avg| 0.00| 0.0000| 0.022 Peak| | 0.6328| 1.110 ---------------+--------+--------+--------- RxCan1[230] Avg| 0.00| 0.0000| 0.019 Peak| | 0.6742| 5.119 ---------------+--------+--------+--------- RxCan1[240] Avg| 0.00| 0.0000| 0.022 Peak| | 0.1163| 0.343 ---------------+--------+--------+--------- RxCan1[242] Avg| 0.00| 0.0000| 0.025 Peak| | 0.3501| 1.015 ---------------+--------+--------+--------- RxCan1[24a] Avg| 0.00| 0.0000| 0.022 Peak| | 0.1212| 0.338 ---------------+--------+--------+--------- RxCan1[24b] Avg| 0.00| 0.0000| 0.023 Peak| | 0.1289| 0.330 ---------------+--------+--------+--------- RxCan1[24c] Avg| 0.00| 0.0000| 0.033 Peak| | 0.1714| 1.189 ---------------+--------+--------+--------- RxCan1[25a] Avg| 0.00| 0.0000| 0.024 Peak| | 0.1289| 0.510 ---------------+--------+--------+--------- RxCan1[25b] Avg| 0.00| 0.0000| 0.022 Peak| | 0.6685| 0.930 ---------------+--------+--------+--------- RxCan1[25c] Avg| 0.00| 0.0000| 0.027 Peak| | 1.3298| 2.670 ---------------+--------+--------+--------- RxCan1[260] Avg| 0.00| 0.0000| 0.023 Peak| | 0.1271| 0.401 ---------------+--------+--------+--------- RxCan1[270] Avg| 0.00| 0.0000| 0.022 Peak| | 0.6439| 0.898 ---------------+--------+--------+--------- RxCan1[280] Avg| 0.00| 0.0000| 0.023 Peak| | 0.6502| 1.156 ---------------+--------+--------+--------- RxCan1[2e4] Avg| 0.00| 0.0000| 0.035 Peak| | 0.3389| 0.811 ---------------+--------+--------+--------- RxCan1[2ec] Avg| 0.00| 0.0000| 0.027 Peak| | 0.1417| 0.784 ---------------+--------+--------+--------- RxCan1[2ed] Avg| 0.00| 0.0000| 0.024 Peak| | 0.1364| 0.746 ---------------+--------+--------+--------- RxCan1[2ee] Avg| 0.00| 0.0000| 0.024 Peak| | 0.1406| 0.965 ---------------+--------+--------+--------- RxCan1[312] Avg| 0.00| 0.0000| 0.023 Peak| | 0.1293| 0.978 ---------------+--------+--------+--------- RxCan1[326] Avg| 0.00| 0.0000| 0.024 Peak| | 0.1298| 0.518 ---------------+--------+--------+--------- RxCan1[336] Avg| 0.00| 0.0000| 0.028 Peak| | 0.0106| 0.329 ---------------+--------+--------+--------- RxCan1[352] Avg| 0.00| 0.0000| 0.030 Peak| | 0.1054| 0.800 ---------------+--------+--------+--------- RxCan1[355] Avg| 0.00| 0.0000| 0.027 Peak| | 0.0270| 0.546 ---------------+--------+--------+--------- RxCan1[35e] Avg| 0.00| 0.0000| 0.023 Peak| | 0.1288| 0.573 ---------------+--------+--------+--------- RxCan1[365] Avg| 0.00| 0.0000| 0.024 Peak| | 0.1297| 0.358 ---------------+--------+--------+--------- RxCan1[366] Avg| 0.00| 0.0000| 0.026 Peak| | 0.1429| 1.001 ---------------+--------+--------+--------- RxCan1[367] Avg| 0.00| 0.0000| 0.026 Peak| | 0.1472| 0.828 ---------------+--------+--------+--------- RxCan1[368] Avg| 0.00| 0.0000| 0.024 Peak| | 0.1323| 0.931 ---------------+--------+--------+--------- RxCan1[369] Avg| 0.00| 0.0000| 0.026 Peak| | 0.1498| 1.072 ---------------+--------+--------+--------- RxCan1[380] Avg| 0.00| 0.0000| 0.022 Peak| | 0.1285| 0.348 ---------------+--------+--------+--------- RxCan1[38b] Avg| 0.00| 0.0000| 0.021 Peak| | 0.3298| 1.168 ---------------+--------+--------+--------- RxCan1[3b3] Avg| 0.00| 0.0000| 0.025 Peak| | 0.1348| 0.920 ---------------+--------+--------+--------- RxCan1[400] Avg| 0.00| 0.0000| 0.022 Peak| | 0.0481| 0.445 ---------------+--------+--------+--------- RxCan1[405] Avg| 0.00| 0.0000| 0.034 Peak| | 0.0723| 0.473 ---------------+--------+--------+--------- RxCan1[40a] Avg| 0.00| 0.0000| 0.025 Peak| | 0.1040| 0.543 ---------------+--------+--------+--------- RxCan1[410] Avg| 0.00| 0.0000| 0.024 Peak| | 0.1339| 0.678 ---------------+--------+--------+--------- RxCan1[411] Avg| 0.00| 0.0000| 0.025 Peak| | 0.1376| 0.573 ---------------+--------+--------+--------- RxCan1[416] Avg| 0.00| 0.0000| 0.023 Peak| | 0.1284| 0.346 ---------------+--------+--------+--------- RxCan1[421] Avg| 0.00| 0.0000| 0.024 Peak| | 0.1323| 0.643 ---------------+--------+--------+--------- RxCan1[42d] Avg| 0.00| 0.0000| 0.023 Peak| | 0.1362| 1.146 ---------------+--------+--------+--------- RxCan1[42f] Avg| 0.00| 0.0000| 0.027 Peak| | 0.1503| 1.762 ---------------+--------+--------+--------- RxCan1[430] Avg| 0.00| 0.0000| 0.023 Peak| | 0.1352| 0.347 ---------------+--------+--------+--------- RxCan1[434] Avg| 0.00| 0.0000| 0.024 Peak| | 0.1312| 0.580 ---------------+--------+--------+--------- RxCan1[435] Avg| 0.00| 0.0000| 0.029 Peak| | 0.1109| 1.133 ---------------+--------+--------+--------- RxCan1[43e] Avg| 0.00| 0.0000| 0.023 Peak| | 0.2776| 0.686 ---------------+--------+--------+--------- RxCan1[440] Avg| 0.00| 0.0000| 0.022 Peak| | 0.0118| 0.276 ---------------+--------+--------+--------- RxCan1[465] Avg| 0.00| 0.0000| 0.022 Peak| | 0.0118| 0.279 ---------------+--------+--------+--------- RxCan1[466] Avg| 0.00| 0.0000| 0.023 Peak| | 0.0123| 0.310 ---------------+--------+--------+--------- RxCan1[467] Avg| 0.00| 0.0000| 0.025 Peak| | 0.0132| 0.314 ---------------+--------+--------+--------- RxCan1[472] Avg| 0.00| 0.0000| 0.101 Peak| | 0.0307| 1.105 ---------------+--------+--------+--------- RxCan1[473] Avg| 0.00| 0.0000| 0.051 Peak| | 0.0107| 0.575 ---------------+--------+--------+--------- RxCan1[474] Avg| 0.00| 0.0000| 0.024 Peak| | 0.0097| 0.289 ---------------+--------+--------+--------- RxCan1[475] Avg| 0.00| 0.0000| 0.023 Peak| | 0.0220| 0.327 ---------------+--------+--------+--------- RxCan1[476] Avg| 0.00| 0.0000| 0.050 Peak| | 0.0762| 5.329 ---------------+--------+--------+--------- RxCan1[477] Avg| 0.00| 0.0000| 0.032 Peak| | 0.0283| 0.669 ---------------+--------+--------+--------- RxCan1[595] Avg| 0.00| 0.0000| 0.026 Peak| | 0.0103| 0.297 ---------------+--------+--------+--------- RxCan1[59e] Avg| 0.00| 0.0000| 0.022 Peak| | 0.0114| 0.263 ---------------+--------+--------+--------- RxCan1[5a2] Avg| 0.00| 0.0000| 0.026 Peak| | 0.0119| 0.505 ---------------+--------+--------+--------- RxCan1[5ba] Avg| 0.00| 0.0000| 0.025 Peak| | 0.0139| 0.549 ---------------+--------+--------+--------- RxCan2[020] Avg| 0.00| 0.0000| 0.026 Peak| | 0.4923| 1.133 ---------------+--------+--------+--------- RxCan2[030] Avg| 0.00| 0.0000| 0.023 Peak| | 0.3297| 1.136 ---------------+--------+--------+--------- RxCan2[03a] Avg| 0.00| 0.0000| 0.022 Peak| | 0.2792| 1.275 ---------------+--------+--------+--------- RxCan2[040] Avg| 0.00| 0.0000| 0.023 Peak| | 0.2834| 1.080 ---------------+--------+--------+--------- RxCan2[060] Avg| 0.00| 0.0000| 0.029 Peak| | 0.3037| 0.991 ---------------+--------+--------+--------- RxCan2[070] Avg| 0.00| 0.0000| 0.025 Peak| | 0.2291| 0.460 ---------------+--------+--------+--------- RxCan2[080] Avg| 0.00| 0.0000| 0.043 Peak| | 0.4015| 1.007 ---------------+--------+--------+--------- RxCan2[083] Avg| 0.00| 0.0000| 0.026 Peak| | 0.2957| 0.788 ---------------+--------+--------+--------- RxCan2[090] Avg| 0.00| 0.0000| 0.027 Peak| | 0.3951| 1.231 ---------------+--------+--------+--------- RxCan2[0a0] Avg| 0.00| 0.0000| 0.026 Peak| | 0.2560| 0.722 ---------------+--------+--------+--------- RxCan2[100] Avg| 0.00| 0.0000| 0.046 Peak| | 0.4506| 21.961 ---------------+--------+--------+--------- RxCan2[108] Avg| 0.00| 0.0000| 0.024 Peak| | 0.3713| 1.125 ---------------+--------+--------+--------- RxCan2[110] Avg| 0.00| 0.0000| 0.029 Peak| | 0.2443| 0.755 ---------------+--------+--------+--------- RxCan2[130] Avg| 0.00| 0.0000| 0.023 Peak| | 0.2052| 1.097 ---------------+--------+--------+--------- RxCan2[150] Avg| 0.00| 0.0000| 0.023 Peak| | 0.2246| 0.371 ---------------+--------+--------+--------- RxCan2[160] Avg| 0.00| 0.0000| 0.024 Peak| | 0.0755| 1.125 ---------------+--------+--------+--------- RxCan2[180] Avg| 0.00| 0.0000| 0.023 Peak| | 0.2350| 0.936 ---------------+--------+--------+--------- RxCan2[190] Avg| 0.00| 0.0000| 0.022 Peak| | 0.2275| 0.592 ---------------+--------+--------+--------- RxCan2[1a0] Avg| 0.00| 0.0000| 0.025 Peak| | 0.0125| 0.273 ---------------+--------+--------+--------- RxCan2[1a4] Avg| 0.00| 0.0000| 0.022 Peak| | 0.2806| 0.632 ---------------+--------+--------+--------- RxCan2[1a8] Avg| 0.00| 0.0000| 0.022 Peak| | 0.1683| 0.740 ---------------+--------+--------+--------- RxCan2[1b0] Avg| 0.00| 0.0000| 0.023 Peak| | 0.1360| 0.490 ---------------+--------+--------+--------- RxCan2[1b4] Avg| 0.00| 0.0000| 0.027 Peak| | 0.1556| 1.119 ---------------+--------+--------+--------- RxCan2[1b8] Avg| 0.00| 0.0000| 0.022 Peak| | 0.1704| 0.616 ---------------+--------+--------+--------- RxCan2[1c0] Avg| 0.00| 0.0000| 0.023 Peak| | 0.1317| 0.488 ---------------+--------+--------+--------- RxCan2[1e0] Avg| 0.00| 0.0000| 0.025 Peak| | 0.1460| 0.675 ---------------+--------+--------+--------- RxCan2[215] Avg| 0.00| 0.0000| 0.023 Peak| | 0.1191| 0.567 ---------------+--------+--------+--------- RxCan2[217] Avg| 0.00| 0.0000| 0.023 Peak| | 0.1167| 0.869 ---------------+--------+--------+--------- RxCan2[220] Avg| 0.00| 0.0000| 0.023 Peak| | 0.0918| 0.313 ---------------+--------+--------+--------- RxCan2[225] Avg| 0.00| 0.0000| 0.025 Peak| | 0.3635| 1.018 ---------------+--------+--------+--------- RxCan2[230] Avg| 0.00| 0.0000| 0.057 Peak| | 0.2192| 1.063 ---------------+--------+--------+--------- RxCan2[240] Avg| 0.00| 0.0000| 0.023 Peak| | 0.1173| 0.760 ---------------+--------+--------+--------- RxCan2[241] Avg| 0.00| 0.0000| 0.022 Peak| | 0.2830| 1.144 ---------------+--------+--------+--------- RxCan2[250] Avg| 0.00| 0.0000| 0.026 Peak| | 0.0701| 0.698 ---------------+--------+--------+--------- RxCan2[255] Avg| 0.00| 0.0000| 0.022 Peak| | 0.1755| 1.063 ---------------+--------+--------+--------- RxCan2[265] Avg| 0.00| 0.0000| 0.024 Peak| | 0.1771| 0.729 ---------------+--------+--------+--------- RxCan2[270] Avg| 0.00| 0.0000| 0.023 Peak| | 0.0667| 0.307 ---------------+--------+--------+--------- RxCan2[290] Avg| 0.00| 0.0000| 0.022 Peak| | 0.0410| 0.280 ---------------+--------+--------+--------- RxCan2[295] Avg| 0.00| 0.0000| 0.023 Peak| | 0.0881| 0.299 ---------------+--------+--------+--------- RxCan2[2a0] Avg| 0.00| 0.0000| 0.023 Peak| | 0.0420| 0.268 ---------------+--------+--------+--------- RxCan2[2a7] Avg| 0.00| 0.0000| 0.021 Peak| | 0.1716| 0.454 ---------------+--------+--------+--------- RxCan2[2b0] Avg| 0.00| 0.0000| 0.023 Peak| | 0.0424| 0.300 ---------------+--------+--------+--------- RxCan2[2c0] Avg| 0.00| 0.0000| 0.024 Peak| | 0.0470| 0.298 ---------------+--------+--------+--------- RxCan2[2e0] Avg| 0.00| 0.0000| 0.030 Peak| | 0.0324| 1.152 ---------------+--------+--------+--------- RxCan2[2f0] Avg| 0.00| 0.0000| 0.024 Peak| | 0.0229| 0.359 ---------------+--------+--------+--------- RxCan2[2f5] Avg| 0.00| 0.0000| 0.026 Peak| | 0.1882| 0.673 ---------------+--------+--------+--------- RxCan2[300] Avg| 0.00| 0.0000| 0.022 Peak| | 0.0186| 0.263 ---------------+--------+--------+--------- RxCan2[310] Avg| 0.00| 0.0000| 0.024 Peak| | 0.0210| 0.265 ---------------+--------+--------+--------- RxCan2[320] Avg| 0.00| 0.0000| 0.025 Peak| | 0.0207| 0.354 ---------------+--------+--------+--------- RxCan2[326] Avg| 0.00| 0.0000| 0.023 Peak| | 0.1466| 0.686 ---------------+--------+--------+--------- RxCan2[330] Avg| 0.00| 0.0000| 0.022 Peak| | 0.4580| 0.708 ---------------+--------+--------+--------- RxCan2[340] Avg| 0.00| 0.0000| 0.031 Peak| | 0.1621| 0.785 ---------------+--------+--------+--------- RxCan2[345] Avg| 0.00| 0.0000| 0.021 Peak| | 0.0199| 0.261 ---------------+--------+--------+--------- RxCan2[35e] Avg| 0.00| 0.0000| 0.023 Peak| | 0.0686| 0.449 ---------------+--------+--------+--------- RxCan2[360] Avg| 0.00| 0.0000| 0.025 Peak| | 0.0204| 0.289 ---------------+--------+--------+--------- RxCan2[361] Avg| 0.00| 0.0000| 0.022 Peak| | 0.1166| 0.316 ---------------+--------+--------+--------- RxCan2[363] Avg| 0.00| 0.0000| 0.023 Peak| | 0.0146| 0.304 ---------------+--------+--------+--------- RxCan2[370] Avg| 0.00| 0.0000| 0.024 Peak| | 0.0099| 0.278 ---------------+--------+--------+--------- RxCan2[381] Avg| 0.00| 0.0000| 0.025 Peak| | 0.0468| 0.459 ---------------+--------+--------+--------- RxCan2[3a0] Avg| 0.00| 0.0000| 0.021 Peak| | 0.2339| 0.617 ---------------+--------+--------+--------- RxCan2[3d0] Avg| 0.00| 0.0000| 0.022 Peak| | 0.1351| 0.351 ---------------+--------+--------+--------- RxCan2[3d5] Avg| 0.00| 0.0000| 0.023 Peak| | 0.0796| 0.692 ---------------+--------+--------+--------- RxCan2[400] Avg| 0.00| 0.0000| 0.023 Peak| | 0.0537| 0.307 ---------------+--------+--------+--------- RxCan2[405] Avg| 0.00| 0.0000| 0.021 Peak| | 0.0513| 0.303 ---------------+--------+--------+--------- RxCan2[40a] Avg| 0.00| 0.0000| 0.022 Peak| | 0.1099| 0.313 ---------------+--------+--------+--------- RxCan2[415] Avg| 0.00| 0.0000| 0.022 Peak| | 0.0204| 0.251 ---------------+--------+--------+--------- RxCan2[435] Avg| 0.00| 0.0000| 0.028 Peak| | 0.0113| 0.342 ---------------+--------+--------+--------- RxCan2[440] Avg| 0.00| 0.0000| 0.027 Peak| | 0.0110| 0.299 ---------------+--------+--------+--------- RxCan2[465] Avg| 0.00| 0.0000| 0.023 Peak| | 0.0122| 0.295 ---------------+--------+--------+--------- RxCan2[466] Avg| 0.00| 0.0000| 0.022 Peak| | 0.0117| 0.267 ---------------+--------+--------+--------- RxCan2[467] Avg| 0.00| 0.0000| 0.022 Peak| | 0.0164| 0.325 ---------------+--------+--------+--------- RxCan2[501] Avg| 0.00| 0.0000| 0.023 Peak| | 0.0236| 0.276 ---------------+--------+--------+--------- RxCan2[503] Avg| 0.00| 0.0000| 0.023 Peak| | 0.0248| 0.349 ---------------+--------+--------+--------- RxCan2[504] Avg| 0.00| 0.0000| 0.023 Peak| | 0.0230| 0.312 ---------------+--------+--------+--------- RxCan2[505] Avg| 0.00| 0.0000| 0.025 Peak| | 0.0256| 0.310 ---------------+--------+--------+--------- RxCan2[508] Avg| 0.00| 0.0000| 0.023 Peak| | 0.0281| 0.329 ---------------+--------+--------+--------- RxCan2[511] Avg| 0.00| 0.0000| 0.022 Peak| | 0.0232| 0.282 ---------------+--------+--------+--------- RxCan2[51e] Avg| 0.00| 0.0000| 0.023 Peak| | 0.0248| 0.298 ---------------+--------+--------+--------- RxCan2[581] Avg| 0.00| 0.0000| 0.025 Peak| | 0.0166| 0.286 ===============+========+========+========= Total Avg| 0.00| 0.0000| 43.563
At the same time, calling poller times on, poller times status causes the bus to crash, although no polls are actively being sent at all.
Cheers, Simon _______________________________________________ OvmsDev mailing list OvmsDev@lists.openvehicles.com http://lists.openvehicles.com/mailman/listinfo/ovmsdev
_______________________________________________ OvmsDev mailing listOvmsDev@lists.openvehicles.comhttp://lists.openvehicles.com/mailman/listinfo/ovmsdev
_______________________________________________ OvmsDev mailing list OvmsDev@lists.openvehicles.com http://lists.openvehicles.com/mailman/listinfo/ovmsdev
_______________________________________________ OvmsDev mailing list OvmsDev@lists.openvehicles.com http://lists.openvehicles.com/mailman/listinfo/ovmsdev
participants (7)
-
 Chris Box
 -
 Derek Caudwell
 -
 frog@bunyip.wheelycreek.net
 -
 Mark Webb-Johnson
 -
 Michael Balzer
 -
Michael Geddes
-
 Simon Ehlen