
I think it is well past time for a 3.2.003 release. Things seems table in edge (although some things only partially implemented). Anything people want to include at the last minute, or can we go ahead and build? Regards, Mark.

I don't have anything imminent. -- Steve On Mon, 2 Sep 2019, Mark Webb-Johnson wrote:
I think it is well past time for a 3.2.003 release. Things seems table in edge (although some things only partially implemented).
Anything people want to include at the last minute, or can we go ahead and build?
Regards, Mark.
_______________________________________________ OvmsDev mailing list OvmsDev@lists.openvehicles.com http://lists.openvehicles.com/mailman/listinfo/ovmsdev

Hi, my pull request is still pending. But if you are planning another release, maybe it's better to make a feature freeze now for the sake of stability and merge my changes after this release. It's not just major update to Volt/Ampera but few changes to MCP2515, CAN, SIMCOM etc, so there is potential for breaks. Br, Marko On Mon, Sep 2, 2019 at 10:04 AM Mark Webb-Johnson <mark@webb-johnson.net> wrote:
I think it is well past time for a 3.2.003 release. Things seems table in edge (although some things only partially implemented).
Anything people want to include at the last minute, or can we go ahead and build?
Regards, Mark.
_______________________________________________ OvmsDev mailing list OvmsDev@lists.openvehicles.com http://lists.openvehicles.com/mailman/listinfo/ovmsdev

Nothing open from my side at the moment. I haven't had the time to look in to Markos pull request, but from a first check also think that's going too deep to be included in this release. Regards, Michael Am 02.09.19 um 04:15 schrieb Mark Webb-Johnson:
I think it is well past time for a 3.2.003 release. Things seems table in edge (although some things only partially implemented).
Anything people want to include at the last minute, or can we go ahead and build?
Regards, Mark.
_______________________________________________ OvmsDev mailing list OvmsDev@lists.openvehicles.com http://lists.openvehicles.com/mailman/listinfo/ovmsdev
-- Michael Balzer * Helkenberger Weg 9 * D-58256 Ennepetal Fon 02333 / 833 5735 * Handy 0176 / 206 989 26
Mark, please wait. I may just have found the cause for issue #241, or at least something I need to investigate before releasing. I need to dig into my logs first, and try something. Regards, Michael Am 02.09.19 um 12:23 schrieb Michael Balzer:
Nothing open from my side at the moment.
I haven't had the time to look in to Markos pull request, but from a first check also think that's going too deep to be included in this release.
Regards, Michael
Am 02.09.19 um 04:15 schrieb Mark Webb-Johnson:
I think it is well past time for a 3.2.003 release. Things seems table in edge (although some things only partially implemented).
Anything people want to include at the last minute, or can we go ahead and build?
Regards, Mark.
_______________________________________________ OvmsDev mailing list OvmsDev@lists.openvehicles.com http://lists.openvehicles.com/mailman/listinfo/ovmsdev
-- Michael Balzer * Helkenberger Weg 9 * D-58256 Ennepetal Fon 02333 / 833 5735 * Handy 0176 / 206 989 26
No problem. We can hold. I won’t commit anything for the next few days (and agree to hold-off on Markos’s pull). Let me know when you are ready. Regards, Mark.
On 3 Sep 2019, at 1:58 AM, Michael Balzer <dexter@expeedo.de> wrote:
Mark, please wait.
I may just have found the cause for issue #241, or at least something I need to investigate before releasing.
I need to dig into my logs first, and try something.
Regards, Michael
Am 02.09.19 um 12:23 schrieb Michael Balzer:
Nothing open from my side at the moment.
I haven't had the time to look in to Markos pull request, but from a first check also think that's going too deep to be included in this release.
Regards, Michael
Am 02.09.19 um 04:15 schrieb Mark Webb-Johnson:
I think it is well past time for a 3.2.003 release. Things seems table in edge (although some things only partially implemented).
Anything people want to include at the last minute, or can we go ahead and build?
Regards, Mark.
_______________________________________________ OvmsDev mailing list OvmsDev@lists.openvehicles.com http://lists.openvehicles.com/mailman/listinfo/ovmsdev
-- Michael Balzer * Helkenberger Weg 9 * D-58256 Ennepetal Fon 02333 / 833 5735 * Handy 0176 / 206 989 26
_______________________________________________ OvmsDev mailing list OvmsDev@lists.openvehicles.com http://lists.openvehicles.com/mailman/listinfo/ovmsdev
Everyone, I've pushed a change that needs some testing. I had the issue myself now parking at a certain distance from my garage wifi AP, i.e. on the edge of "in", after wifi had been disconnected for some hours, and with the module still connected via modem. The wifi blob had been trying to connect to the AP for about two hours. As seen before, the module saw no error, just the server responses and commands stopped coming in. I noticed the default interface was still "st1" despite wifi having been disconnected and modem connected. The DNS was also still configured for my wifi network, and the interface seemed to have an IP address -- but wasn't pingable from the wifi network. A power cycle of the modem solved the issue without reboot. So the cause may be in the modem/ppp subsystem, or it may be related (in some weird way) to the default interface / DNS setup. More tests showed the default interface again/still got set by the wifi blob itself at some point, overriding our modem prioritization. The events we didn't handle up to now were "sta.connected" and "sta.lostip", so I added these, and the bug didn't show up again since then. That doesn't mean anything, so we need to test this. The default interface really shouldn't affect inbound packet routing of an established connection, but there always may be strange bugs lurking in those libs. The change also reimplements the wifi signal strength reading, as the tests also showed that still wasn't working well using the CSI callback. It now seems to be much more reliable. Please test & report. The single module will be hard to test, as the bug isn't reproducable easily, but you can still try if wifi / modem transitions work well. Mark, you can check your server logs for history messages with ridiculous time offsets: [sddexter@ns27 server]$ cat log-20190903 | egrep "rx msg h [0-9]+,-[0-9]{4}" | wc -l 455283 The bug now severely affects the V2 server performance, as the server is single threaded and doesn't scale very well to this kind of bulk data bursts, especially when coming from multiple modules in parallel. So we really need to solve this now. Slow reactions or connection drops from my server lately have been due to this bug. If this change doesn't solve it, we'll need to add some reboot trigger on "too many server v2 notification retransmissions" -- or maybe a modem power cycle will do, that wouldn't discard the data. Thanks, Michael Am 03.09.19 um 07:46 schrieb Mark Webb-Johnson:
No problem. We can hold. I won’t commit anything for the next few days (and agree to hold-off on Markos’s pull). Let me know when you are ready.
Regards, Mark.
On 3 Sep 2019, at 1:58 AM, Michael Balzer <dexter@expeedo.de> wrote:
Mark, please wait.
I may just have found the cause for issue #241, or at least something I need to investigate before releasing.
I need to dig into my logs first, and try something.
Regards, Michael
Am 02.09.19 um 12:23 schrieb Michael Balzer:
Nothing open from my side at the moment.
I haven't had the time to look in to Markos pull request, but from a first check also think that's going too deep to be included in this release.
Regards, Michael
Am 02.09.19 um 04:15 schrieb Mark Webb-Johnson:
I think it is well past time for a 3.2.003 release. Things seems table in edge (although some things only partially implemented).
Anything people want to include at the last minute, or can we go ahead and build?
Regards, Mark.
_______________________________________________ OvmsDev mailing list OvmsDev@lists.openvehicles.com http://lists.openvehicles.com/mailman/listinfo/ovmsdev -- Michael Balzer * Helkenberger Weg 9 * D-58256 Ennepetal Fon 02333 / 833 5735 * Handy 0176 / 206 989 26
_______________________________________________ OvmsDev mailing list OvmsDev@lists.openvehicles.com http://lists.openvehicles.com/mailman/listinfo/ovmsdev
OvmsDev mailing list OvmsDev@lists.openvehicles.com http://lists.openvehicles.com/mailman/listinfo/ovmsdev
-- Michael Balzer * Helkenberger Weg 9 * D-58256 Ennepetal Fon 02333 / 833 5735 * Handy 0176 / 206 989 26
Michael, I have not built the OVMS software in a while, so I need to update to the current esp-idf, which I have done by the steps you prescribed a while back. But you also recommend the -93 toolchain; I currently have -80 installed. Where can I find the -93 tarball? Google didn't answer that question. -- Steve On Tue, 3 Sep 2019, Michael Balzer wrote:
Everyone,
I've pushed a change that needs some testing.
I had the issue myself now parking at a certain distance from my garage wifi AP, i.e. on the edge of "in", after wifi had been disconnected for some hours, and with the module still connected via modem. The wifi blob had been trying to connect to the AP for about two hours.
As seen before, the module saw no error, just the server responses and commands stopped coming in. I noticed the default interface was still "st1" despite wifi having been disconnected and modem connected. The DNS was also still configured for my wifi network, and the interface seemed to have an IP address -- but wasn't pingable from the wifi network.
A power cycle of the modem solved the issue without reboot. So the cause may be in the modem/ppp subsystem, or it may be related (in some weird way) to the default interface / DNS setup.
More tests showed the default interface again/still got set by the wifi blob itself at some point, overriding our modem prioritization. The events we didn't handle up to now were "sta.connected" and "sta.lostip", so I added these, and the bug didn't show up again since then. That doesn't mean anything, so we need to test this.
The default interface really shouldn't affect inbound packet routing of an established connection, but there always may be strange bugs lurking in those libs.
The change also reimplements the wifi signal strength reading, as the tests also showed that still wasn't working well using the CSI callback. It now seems to be much more reliable.
Please test & report. The single module will be hard to test, as the bug isn't reproducable easily, but you can still try if wifi / modem transitions work well.
Mark, you can check your server logs for history messages with ridiculous time offsets:
[sddexter@ns27 server]$ cat log-20190903 | egrep "rx msg h [0-9]+,-[0-9]{4}" | wc -l 455283
The bug now severely affects the V2 server performance, as the server is single threaded and doesn't scale very well to this kind of bulk data bursts, especially when coming from multiple modules in parallel. So we really need to solve this now. Slow reactions or connection drops from my server lately have been due to this bug. If this change doesn't solve it, we'll need to add some reboot trigger on "too many server v2 notification retransmissions" -- or maybe a modem power cycle will do, that wouldn't discard the data.
Thanks, Michael
Am 03.09.19 um 07:46 schrieb Mark Webb-Johnson:
No problem. We can hold. I won't commit anything for the next few days (and agree to hold-off on Markos's pull). Let me know when you are ready.
Regards, Mark.
On 3 Sep 2019, at 1:58 AM, Michael Balzer <dexter@expeedo.de> wrote:
Mark, please wait.
I may just have found the cause for issue #241, or at least something I need to investigate before releasing.
I need to dig into my logs first, and try something.
Regards, Michael
Am 02.09.19 um 12:23 schrieb Michael Balzer:
Nothing open from my side at the moment.
I haven't had the time to look in to Markos pull request, but from a first check also think that's going too deep to be included in this release.
Regards, Michael
Am 02.09.19 um 04:15 schrieb Mark Webb-Johnson:
I think it is well past time for a 3.2.003 release. Things seems table in edge (although some things only partially implemented).
Anything people want to include at the last minute, or can we go ahead and build?
Regards, Mark.
_______________________________________________ OvmsDev mailing list OvmsDev@lists.openvehicles.com http://lists.openvehicles.com/mailman/listinfo/ovmsdev -- Michael Balzer * Helkenberger Weg 9 * D-58256 Ennepetal Fon 02333 / 833 5735 * Handy 0176 / 206 989 26
_______________________________________________ OvmsDev mailing list OvmsDev@lists.openvehicles.com http://lists.openvehicles.com/mailman/listinfo/ovmsdev
OvmsDev mailing list OvmsDev@lists.openvehicles.com http://lists.openvehicles.com/mailman/listinfo/ovmsdev
-- Michael Balzer * Helkenberger Weg 9 * D-58256 Ennepetal Fon 02333 / 833 5735 * Handy 0176 / 206 989 26
Steve, I meanwhile use toolkit -98 along with the new libs provided here: https://github.com/espressif/esp-idf/issues/2892 …plus the (not yet checked in) volatile patch described here: https://github.com/espressif/esp-idf/issues/2892#issuecomment-525697255 To use the new libs I replaced (symlinked) the respective files in xtensa-esp32-elf/sysroot/lib/esp32-psram by those from the zip. Then checkout and build on our branch "spiram-fix-test". Regards, Michael Am 04.09.19 um 07:04 schrieb Stephen Casner:
Michael,
I have not built the OVMS software in a while, so I need to update to the current esp-idf, which I have done by the steps you prescribed a while back. But you also recommend the -93 toolchain; I currently have -80 installed. Where can I find the -93 tarball? Google didn't answer that question.
-- Steve
On Tue, 3 Sep 2019, Michael Balzer wrote:
Everyone,
I've pushed a change that needs some testing.
I had the issue myself now parking at a certain distance from my garage wifi AP, i.e. on the edge of "in", after wifi had been disconnected for some hours, and with the module still connected via modem. The wifi blob had been trying to connect to the AP for about two hours.
As seen before, the module saw no error, just the server responses and commands stopped coming in. I noticed the default interface was still "st1" despite wifi having been disconnected and modem connected. The DNS was also still configured for my wifi network, and the interface seemed to have an IP address -- but wasn't pingable from the wifi network.
A power cycle of the modem solved the issue without reboot. So the cause may be in the modem/ppp subsystem, or it may be related (in some weird way) to the default interface / DNS setup.
More tests showed the default interface again/still got set by the wifi blob itself at some point, overriding our modem prioritization. The events we didn't handle up to now were "sta.connected" and "sta.lostip", so I added these, and the bug didn't show up again since then. That doesn't mean anything, so we need to test this.
The default interface really shouldn't affect inbound packet routing of an established connection, but there always may be strange bugs lurking in those libs.
The change also reimplements the wifi signal strength reading, as the tests also showed that still wasn't working well using the CSI callback. It now seems to be much more reliable.
Please test & report. The single module will be hard to test, as the bug isn't reproducable easily, but you can still try if wifi / modem transitions work well.
Mark, you can check your server logs for history messages with ridiculous time offsets:
[sddexter@ns27 server]$ cat log-20190903 | egrep "rx msg h [0-9]+,-[0-9]{4}" | wc -l 455283
The bug now severely affects the V2 server performance, as the server is single threaded and doesn't scale very well to this kind of bulk data bursts, especially when coming from multiple modules in parallel. So we really need to solve this now. Slow reactions or connection drops from my server lately have been due to this bug. If this change doesn't solve it, we'll need to add some reboot trigger on "too many server v2 notification retransmissions" -- or maybe a modem power cycle will do, that wouldn't discard the data.
Thanks, Michael
Am 03.09.19 um 07:46 schrieb Mark Webb-Johnson:
No problem. We can hold. I won't commit anything for the next few days (and agree to hold-off on Markos's pull). Let me know when you are ready.
Regards, Mark.
On 3 Sep 2019, at 1:58 AM, Michael Balzer <dexter@expeedo.de> wrote:
Mark, please wait.
I may just have found the cause for issue #241, or at least something I need to investigate before releasing.
I need to dig into my logs first, and try something.
Regards, Michael
Am 02.09.19 um 12:23 schrieb Michael Balzer:
Nothing open from my side at the moment.
I haven't had the time to look in to Markos pull request, but from a first check also think that's going too deep to be included in this release.
Regards, Michael
Am 02.09.19 um 04:15 schrieb Mark Webb-Johnson:
I think it is well past time for a 3.2.003 release. Things seems table in edge (although some things only partially implemented).
Anything people want to include at the last minute, or can we go ahead and build?
Regards, Mark.
-- Michael Balzer * Helkenberger Weg 9 * D-58256 Ennepetal Fon 02333 / 833 5735 * Handy 0176 / 206 989 26
Ooops, the toolkit link hash got lost: https://github.com/espressif/esp-idf/issues/2892#issuecomment-525286663 Am 04.09.19 um 11:47 schrieb Michael Balzer:
Steve,
I meanwhile use toolkit -98 along with the new libs provided here: https://github.com/espressif/esp-idf/issues/2892
…plus the (not yet checked in) volatile patch described here: https://github.com/espressif/esp-idf/issues/2892#issuecomment-525697255
To use the new libs I replaced (symlinked) the respective files in xtensa-esp32-elf/sysroot/lib/esp32-psram by those from the zip.
Then checkout and build on our branch "spiram-fix-test".
Regards, Michael
Am 04.09.19 um 07:04 schrieb Stephen Casner:
Michael,
I have not built the OVMS software in a while, so I need to update to the current esp-idf, which I have done by the steps you prescribed a while back. But you also recommend the -93 toolchain; I currently have -80 installed. Where can I find the -93 tarball? Google didn't answer that question.
-- Steve
On Tue, 3 Sep 2019, Michael Balzer wrote:
Everyone,
I've pushed a change that needs some testing.
I had the issue myself now parking at a certain distance from my garage wifi AP, i.e. on the edge of "in", after wifi had been disconnected for some hours, and with the module still connected via modem. The wifi blob had been trying to connect to the AP for about two hours.
As seen before, the module saw no error, just the server responses and commands stopped coming in. I noticed the default interface was still "st1" despite wifi having been disconnected and modem connected. The DNS was also still configured for my wifi network, and the interface seemed to have an IP address -- but wasn't pingable from the wifi network.
A power cycle of the modem solved the issue without reboot. So the cause may be in the modem/ppp subsystem, or it may be related (in some weird way) to the default interface / DNS setup.
More tests showed the default interface again/still got set by the wifi blob itself at some point, overriding our modem prioritization. The events we didn't handle up to now were "sta.connected" and "sta.lostip", so I added these, and the bug didn't show up again since then. That doesn't mean anything, so we need to test this.
The default interface really shouldn't affect inbound packet routing of an established connection, but there always may be strange bugs lurking in those libs.
The change also reimplements the wifi signal strength reading, as the tests also showed that still wasn't working well using the CSI callback. It now seems to be much more reliable.
Please test & report. The single module will be hard to test, as the bug isn't reproducable easily, but you can still try if wifi / modem transitions work well.
Mark, you can check your server logs for history messages with ridiculous time offsets:
[sddexter@ns27 server]$ cat log-20190903 | egrep "rx msg h [0-9]+,-[0-9]{4}" | wc -l 455283
The bug now severely affects the V2 server performance, as the server is single threaded and doesn't scale very well to this kind of bulk data bursts, especially when coming from multiple modules in parallel. So we really need to solve this now. Slow reactions or connection drops from my server lately have been due to this bug. If this change doesn't solve it, we'll need to add some reboot trigger on "too many server v2 notification retransmissions" -- or maybe a modem power cycle will do, that wouldn't discard the data.
Thanks, Michael
Am 03.09.19 um 07:46 schrieb Mark Webb-Johnson:
No problem. We can hold. I won't commit anything for the next few days (and agree to hold-off on Markos's pull). Let me know when you are ready.
Regards, Mark.
On 3 Sep 2019, at 1:58 AM, Michael Balzer <dexter@expeedo.de> wrote:
Mark, please wait.
I may just have found the cause for issue #241, or at least something I need to investigate before releasing.
I need to dig into my logs first, and try something.
Regards, Michael
Am 02.09.19 um 12:23 schrieb Michael Balzer:
Nothing open from my side at the moment.
I haven't had the time to look in to Markos pull request, but from a first check also think that's going too deep to be included in this release.
Regards, Michael
Am 02.09.19 um 04:15 schrieb Mark Webb-Johnson: > I think it is well past time for a 3.2.003 release. Things seems table in edge (although some things only partially implemented). > > Anything people want to include at the last minute, or can we go ahead and build? > > Regards, Mark. >
-- Michael Balzer * Helkenberger Weg 9 * D-58256 Ennepetal Fon 02333 / 833 5735 * Handy 0176 / 206 989 26
Michael, I saw the comments introducing -98 and followup. I think I'd rather not be on the bleeding edge unless that's where your fix for 241 is that you need us to test. Is it on master, and if so, what toolchain to use for that? -- Steve On Wed, 4 Sep 2019, Michael Balzer wrote:
Steve,
I meanwhile use toolkit -98 along with the new libs provided here: https://github.com/espressif/esp-idf/issues/2892
...plus the (not yet checked in) volatile patch described here: https://github.com/espressif/esp-idf/issues/2892#issuecomment-525697255
To use the new libs I replaced (symlinked) the respective files in xtensa-esp32-elf/sysroot/lib/esp32-psram by those from the zip.
Then checkout and build on our branch "spiram-fix-test".
Regards, Michael
Am 04.09.19 um 07:04 schrieb Stephen Casner:
Michael,
I have not built the OVMS software in a while, so I need to update to the current esp-idf, which I have done by the steps you prescribed a while back. But you also recommend the -93 toolchain; I currently have -80 installed. Where can I find the -93 tarball? Google didn't answer that question.
-- Steve
On Tue, 3 Sep 2019, Michael Balzer wrote:
Everyone,
I've pushed a change that needs some testing.
I had the issue myself now parking at a certain distance from my garage wifi AP, i.e. on the edge of "in", after wifi had been disconnected for some hours, and with the module still connected via modem. The wifi blob had been trying to connect to the AP for about two hours.
As seen before, the module saw no error, just the server responses and commands stopped coming in. I noticed the default interface was still "st1" despite wifi having been disconnected and modem connected. The DNS was also still configured for my wifi network, and the interface seemed to have an IP address -- but wasn't pingable from the wifi network.
A power cycle of the modem solved the issue without reboot. So the cause may be in the modem/ppp subsystem, or it may be related (in some weird way) to the default interface / DNS setup.
More tests showed the default interface again/still got set by the wifi blob itself at some point, overriding our modem prioritization. The events we didn't handle up to now were "sta.connected" and "sta.lostip", so I added these, and the bug didn't show up again since then. That doesn't mean anything, so we need to test this.
The default interface really shouldn't affect inbound packet routing of an established connection, but there always may be strange bugs lurking in those libs.
The change also reimplements the wifi signal strength reading, as the tests also showed that still wasn't working well using the CSI callback. It now seems to be much more reliable.
Please test & report. The single module will be hard to test, as the bug isn't reproducable easily, but you can still try if wifi / modem transitions work well.
Mark, you can check your server logs for history messages with ridiculous time offsets:
[sddexter@ns27 server]$ cat log-20190903 | egrep "rx msg h [0-9]+,-[0-9]{4}" | wc -l 455283
The bug now severely affects the V2 server performance, as the server is single threaded and doesn't scale very well to this kind of bulk data bursts, especially when coming from multiple modules in parallel. So we really need to solve this now. Slow reactions or connection drops from my server lately have been due to this bug. If this change doesn't solve it, we'll need to add some reboot trigger on "too many server v2 notification retransmissions" -- or maybe a modem power cycle will do, that wouldn't discard the data.
Thanks, Michael
Am 03.09.19 um 07:46 schrieb Mark Webb-Johnson:
No problem. We can hold. I won't commit anything for the next few days (and agree to hold-off on Markos's pull). Let me know when you are ready.
Regards, Mark.
On 3 Sep 2019, at 1:58 AM, Michael Balzer <dexter@expeedo.de> wrote:
Mark, please wait.
I may just have found the cause for issue #241, or at least something I need to investigate before releasing.
I need to dig into my logs first, and try something.
Regards, Michael
Am 02.09.19 um 12:23 schrieb Michael Balzer:
Nothing open from my side at the moment.
I haven't had the time to look in to Markos pull request, but from a first check also think that's going too deep to be included in this release.
Regards, Michael
Am 02.09.19 um 04:15 schrieb Mark Webb-Johnson: > I think it is well past time for a 3.2.003 release. Things seems table in edge (although some things only partially implemented). > > Anything people want to include at the last minute, or can we go ahead and build? > > Regards, Mark. >
-- Michael Balzer * Helkenberger Weg 9 * D-58256 Ennepetal Fon 02333 / 833 5735 * Handy 0176 / 206 989 26
_______________________________________________ OvmsDev mailing list OvmsDev@lists.openvehicles.com http://lists.openvehicles.com/mailman/listinfo/ovmsdev
Steve, everyone, master is identical, spiram-fix-test only differs in the changes necessary for the new toolchain. Bad news: I see issue #241 in today's v2 server log from at least two vehicles having already updated to my edge release. So, sadly, that didn't fix it. That means the bug is most probably in the pppos stack or in our modem driver. There is that open issue about the very slow ppp data transfer, the modem code definitely needs some refinement. But finding that specific bug will take time, except someone has a direct idea where to look. I'll implement that nasty workaround now for the release… Regards, Michael Am 04.09.19 um 19:16 schrieb Stephen Casner:
Michael,
I saw the comments introducing -98 and followup. I think I'd rather not be on the bleeding edge unless that's where your fix for 241 is that you need us to test. Is it on master, and if so, what toolchain to use for that?
-- Steve
On Wed, 4 Sep 2019, Michael Balzer wrote:
Steve,
I meanwhile use toolkit -98 along with the new libs provided here: https://github.com/espressif/esp-idf/issues/2892
...plus the (not yet checked in) volatile patch described here: https://github.com/espressif/esp-idf/issues/2892#issuecomment-525697255
To use the new libs I replaced (symlinked) the respective files in xtensa-esp32-elf/sysroot/lib/esp32-psram by those from the zip.
Then checkout and build on our branch "spiram-fix-test".
Regards, Michael
Am 04.09.19 um 07:04 schrieb Stephen Casner:
Michael,
I have not built the OVMS software in a while, so I need to update to the current esp-idf, which I have done by the steps you prescribed a while back. But you also recommend the -93 toolchain; I currently have -80 installed. Where can I find the -93 tarball? Google didn't answer that question.
-- Steve
On Tue, 3 Sep 2019, Michael Balzer wrote:
Everyone,
I've pushed a change that needs some testing.
I had the issue myself now parking at a certain distance from my garage wifi AP, i.e. on the edge of "in", after wifi had been disconnected for some hours, and with the module still connected via modem. The wifi blob had been trying to connect to the AP for about two hours.
As seen before, the module saw no error, just the server responses and commands stopped coming in. I noticed the default interface was still "st1" despite wifi having been disconnected and modem connected. The DNS was also still configured for my wifi network, and the interface seemed to have an IP address -- but wasn't pingable from the wifi network.
A power cycle of the modem solved the issue without reboot. So the cause may be in the modem/ppp subsystem, or it may be related (in some weird way) to the default interface / DNS setup.
More tests showed the default interface again/still got set by the wifi blob itself at some point, overriding our modem prioritization. The events we didn't handle up to now were "sta.connected" and "sta.lostip", so I added these, and the bug didn't show up again since then. That doesn't mean anything, so we need to test this.
The default interface really shouldn't affect inbound packet routing of an established connection, but there always may be strange bugs lurking in those libs.
The change also reimplements the wifi signal strength reading, as the tests also showed that still wasn't working well using the CSI callback. It now seems to be much more reliable.
Please test & report. The single module will be hard to test, as the bug isn't reproducable easily, but you can still try if wifi / modem transitions work well.
Mark, you can check your server logs for history messages with ridiculous time offsets:
[sddexter@ns27 server]$ cat log-20190903 | egrep "rx msg h [0-9]+,-[0-9]{4}" | wc -l 455283
The bug now severely affects the V2 server performance, as the server is single threaded and doesn't scale very well to this kind of bulk data bursts, especially when coming from multiple modules in parallel. So we really need to solve this now. Slow reactions or connection drops from my server lately have been due to this bug. If this change doesn't solve it, we'll need to add some reboot trigger on "too many server v2 notification retransmissions" -- or maybe a modem power cycle will do, that wouldn't discard the data.
Thanks, Michael
Am 03.09.19 um 07:46 schrieb Mark Webb-Johnson:
No problem. We can hold. I won't commit anything for the next few days (and agree to hold-off on Markos's pull). Let me know when you are ready.
Regards, Mark.
On 3 Sep 2019, at 1:58 AM, Michael Balzer <dexter@expeedo.de> wrote:
Mark, please wait.
I may just have found the cause for issue #241, or at least something I need to investigate before releasing.
I need to dig into my logs first, and try something.
Regards, Michael
Am 02.09.19 um 12:23 schrieb Michael Balzer: > Nothing open from my side at the moment. > > I haven't had the time to look in to Markos pull request, but from a first check also think that's going too deep to be included in this release. > > Regards, > Michael > > > Am 02.09.19 um 04:15 schrieb Mark Webb-Johnson: >> I think it is well past time for a 3.2.003 release. Things seems table in edge (although some things only partially implemented). >> >> Anything people want to include at the last minute, or can we go ahead and build? >> >> Regards, Mark. >> -- Michael Balzer * Helkenberger Weg 9 * D-58256 Ennepetal Fon 02333 / 833 5735 * Handy 0176 / 206 989 26
_______________________________________________ OvmsDev mailing list OvmsDev@lists.openvehicles.com http://lists.openvehicles.com/mailman/listinfo/ovmsdev
_______________________________________________ OvmsDev mailing list OvmsDev@lists.openvehicles.com http://lists.openvehicles.com/mailman/listinfo/ovmsdev
-- Michael Balzer * Helkenberger Weg 9 * D-58256 Ennepetal Fon 02333 / 833 5735 * Handy 0176 / 206 989 26
Mark, you can check your server logs for history messages with ridiculous time offsets: [sddexter@ns27 server]$ cat log-20190903 | egrep "rx msg h [0-9]+,-[0-9]{4}" | wc -l 455283
I checked my logs and see 12 vehicles showing this. But, 2 only show this for a debugcrash log (which is expected, I guess, if the time is not synced at report time). I’ve got 4 cars with the offset > 10,000. Regards, Mark.
On 4 Sep 2019, at 4:45 AM, Michael Balzer <dexter@expeedo.de> wrote:
Everyone,
I've pushed a change that needs some testing.
I had the issue myself now parking at a certain distance from my garage wifi AP, i.e. on the edge of "in", after wifi had been disconnected for some hours, and with the module still connected via modem. The wifi blob had been trying to connect to the AP for about two hours.
As seen before, the module saw no error, just the server responses and commands stopped coming in. I noticed the default interface was still "st1" despite wifi having been disconnected and modem connected. The DNS was also still configured for my wifi network, and the interface seemed to have an IP address -- but wasn't pingable from the wifi network.
A power cycle of the modem solved the issue without reboot. So the cause may be in the modem/ppp subsystem, or it may be related (in some weird way) to the default interface / DNS setup.
More tests showed the default interface again/still got set by the wifi blob itself at some point, overriding our modem prioritization. The events we didn't handle up to now were "sta.connected" and "sta.lostip", so I added these, and the bug didn't show up again since then. That doesn't mean anything, so we need to test this.
The default interface really shouldn't affect inbound packet routing of an established connection, but there always may be strange bugs lurking in those libs.
The change also reimplements the wifi signal strength reading, as the tests also showed that still wasn't working well using the CSI callback. It now seems to be much more reliable.
Please test & report. The single module will be hard to test, as the bug isn't reproducable easily, but you can still try if wifi / modem transitions work well.
Mark, you can check your server logs for history messages with ridiculous time offsets: [sddexter@ns27 server]$ cat log-20190903 | egrep "rx msg h [0-9]+,-[0-9]{4}" | wc -l 455283 The bug now severely affects the V2 server performance, as the server is single threaded and doesn't scale very well to this kind of bulk data bursts, especially when coming from multiple modules in parallel. So we really need to solve this now. Slow reactions or connection drops from my server lately have been due to this bug. If this change doesn't solve it, we'll need to add some reboot trigger on "too many server v2 notification retransmissions" -- or maybe a modem power cycle will do, that wouldn't discard the data.
Thanks, Michael
Am 03.09.19 um 07:46 schrieb Mark Webb-Johnson:
No problem. We can hold. I won’t commit anything for the next few days (and agree to hold-off on Markos’s pull). Let me know when you are ready.
Regards, Mark.
On 3 Sep 2019, at 1:58 AM, Michael Balzer <dexter@expeedo.de> <mailto:dexter@expeedo.de> wrote:
Mark, please wait.
I may just have found the cause for issue #241, or at least something I need to investigate before releasing.
I need to dig into my logs first, and try something.
Regards, Michael
Am 02.09.19 um 12:23 schrieb Michael Balzer:
Nothing open from my side at the moment.
I haven't had the time to look in to Markos pull request, but from a first check also think that's going too deep to be included in this release.
Regards, Michael
Am 02.09.19 um 04:15 schrieb Mark Webb-Johnson:
I think it is well past time for a 3.2.003 release. Things seems table in edge (although some things only partially implemented).
Anything people want to include at the last minute, or can we go ahead and build?
Regards, Mark.
_______________________________________________ OvmsDev mailing list OvmsDev@lists.openvehicles.com <mailto:OvmsDev@lists.openvehicles.com> http://lists.openvehicles.com/mailman/listinfo/ovmsdev <http://lists.openvehicles.com/mailman/listinfo/ovmsdev> -- Michael Balzer * Helkenberger Weg 9 * D-58256 Ennepetal Fon 02333 / 833 5735 * Handy 0176 / 206 989 26
_______________________________________________ OvmsDev mailing list OvmsDev@lists.openvehicles.com <mailto:OvmsDev@lists.openvehicles.com> http://lists.openvehicles.com/mailman/listinfo/ovmsdev <http://lists.openvehicles.com/mailman/listinfo/ovmsdev>
OvmsDev mailing list OvmsDev@lists.openvehicles.com <mailto:OvmsDev@lists.openvehicles.com> http://lists.openvehicles.com/mailman/listinfo/ovmsdev <http://lists.openvehicles.com/mailman/listinfo/ovmsdev>
-- Michael Balzer * Helkenberger Weg 9 * D-58256 Ennepetal Fon 02333 / 833 5735 * Handy 0176 / 206 989 26 _______________________________________________ OvmsDev mailing list OvmsDev@lists.openvehicles.com http://lists.openvehicles.com/mailman/listinfo/ovmsdev
I've pushed the nasty workaround: the v2 server checks for no RX over 15 minutes, then restarts the network (wifi & modem) as configured for autostart. Rolled out on my server in edge as 3.2.002-237-ge075f655. Please test. Regards, Michael Am 05.09.19 um 01:58 schrieb Mark Webb-Johnson:
Mark, you can check your server logs for history messages with ridiculous time offsets:
[sddexter@ns27 server]$ cat log-20190903 | egrep "rx msg h [0-9]+,-[0-9]{4}" | wc -l 455283
I checked my logs and see 12 vehicles showing this. But, 2 only show this for a debugcrash log (which is expected, I guess, if the time is not synced at report time). I’ve got 4 cars with the offset > 10,000.
Regards, Mark.
On 4 Sep 2019, at 4:45 AM, Michael Balzer <dexter@expeedo.de <mailto:dexter@expeedo.de>> wrote:
Everyone,
I've pushed a change that needs some testing.
I had the issue myself now parking at a certain distance from my garage wifi AP, i.e. on the edge of "in", after wifi had been disconnected for some hours, and with the module still connected via modem. The wifi blob had been trying to connect to the AP for about two hours.
As seen before, the module saw no error, just the server responses and commands stopped coming in. I noticed the default interface was still "st1" despite wifi having been disconnected and modem connected. The DNS was also still configured for my wifi network, and the interface seemed to have an IP address -- but wasn't pingable from the wifi network.
A power cycle of the modem solved the issue without reboot. So the cause may be in the modem/ppp subsystem, or it may be related (in some weird way) to the default interface / DNS setup.
More tests showed the default interface again/still got set by the wifi blob itself at some point, overriding our modem prioritization. The events we didn't handle up to now were "sta.connected" and "sta.lostip", so I added these, and the bug didn't show up again since then. That doesn't mean anything, so we need to test this.
The default interface really shouldn't affect inbound packet routing of an established connection, but there always may be strange bugs lurking in those libs.
The change also reimplements the wifi signal strength reading, as the tests also showed that still wasn't working well using the CSI callback. It now seems to be much more reliable.
Please test & report. The single module will be hard to test, as the bug isn't reproducable easily, but you can still try if wifi / modem transitions work well.
Mark, you can check your server logs for history messages with ridiculous time offsets:
[sddexter@ns27 server]$ cat log-20190903 | egrep "rx msg h [0-9]+,-[0-9]{4}" | wc -l 455283
The bug now severely affects the V2 server performance, as the server is single threaded and doesn't scale very well to this kind of bulk data bursts, especially when coming from multiple modules in parallel. So we really need to solve this now. Slow reactions or connection drops from my server lately have been due to this bug. If this change doesn't solve it, we'll need to add some reboot trigger on "too many server v2 notification retransmissions" -- or maybe a modem power cycle will do, that wouldn't discard the data.
Thanks, Michael
Am 03.09.19 um 07:46 schrieb Mark Webb-Johnson:
No problem. We can hold. I won’t commit anything for the next few days (and agree to hold-off on Markos’s pull). Let me know when you are ready.
Regards, Mark.
On 3 Sep 2019, at 1:58 AM, Michael Balzer <dexter@expeedo.de> wrote:
Mark, please wait.
I may just have found the cause for issue #241, or at least something I need to investigate before releasing.
I need to dig into my logs first, and try something.
Regards, Michael
Am 02.09.19 um 12:23 schrieb Michael Balzer:
Nothing open from my side at the moment.
I haven't had the time to look in to Markos pull request, but from a first check also think that's going too deep to be included in this release.
Regards, Michael
Am 02.09.19 um 04:15 schrieb Mark Webb-Johnson:
I think it is well past time for a 3.2.003 release. Things seems table in edge (although some things only partially implemented).
Anything people want to include at the last minute, or can we go ahead and build?
Regards, Mark.
_______________________________________________ OvmsDev mailing list OvmsDev@lists.openvehicles.com http://lists.openvehicles.com/mailman/listinfo/ovmsdev -- Michael Balzer * Helkenberger Weg 9 * D-58256 Ennepetal Fon 02333 / 833 5735 * Handy 0176 / 206 989 26
_______________________________________________ OvmsDev mailing list OvmsDev@lists.openvehicles.com http://lists.openvehicles.com/mailman/listinfo/ovmsdev
OvmsDev mailing list OvmsDev@lists.openvehicles.com http://lists.openvehicles.com/mailman/listinfo/ovmsdev
-- Michael Balzer * Helkenberger Weg 9 * D-58256 Ennepetal Fon 02333 / 833 5735 * Handy 0176 / 206 989 26 _______________________________________________ OvmsDev mailing list OvmsDev@lists.openvehicles.com <mailto:OvmsDev@lists.openvehicles.com> http://lists.openvehicles.com/mailman/listinfo/ovmsdev
_______________________________________________ OvmsDev mailing list OvmsDev@lists.openvehicles.com http://lists.openvehicles.com/mailman/listinfo/ovmsdev
-- Michael Balzer * Helkenberger Weg 9 * D-58256 Ennepetal Fon 02333 / 833 5735 * Handy 0176 / 206 989 26
Mark & anyone else running a V2 server, as most cars don't send history records, this also needs the change to the server I just pushed, i.e. server version 2.4.2. https://github.com/openvehicles/Open-Vehicle-Monitoring-System/commits/maste... Regards, Michael Am 05.09.19 um 19:55 schrieb Michael Balzer:
I've pushed the nasty workaround: the v2 server checks for no RX over 15 minutes, then restarts the network (wifi & modem) as configured for autostart.
Rolled out on my server in edge as 3.2.002-237-ge075f655.
Please test.
Regards, Michael
Am 05.09.19 um 01:58 schrieb Mark Webb-Johnson:
Mark, you can check your server logs for history messages with ridiculous time offsets:
[sddexter@ns27 server]$ cat log-20190903 | egrep "rx msg h [0-9]+,-[0-9]{4}" | wc -l 455283
I checked my logs and see 12 vehicles showing this. But, 2 only show this for a debugcrash log (which is expected, I guess, if the time is not synced at report time). I’ve got 4 cars with the offset > 10,000.
Regards, Mark.
On 4 Sep 2019, at 4:45 AM, Michael Balzer <dexter@expeedo.de <mailto:dexter@expeedo.de>> wrote:
Everyone,
I've pushed a change that needs some testing.
I had the issue myself now parking at a certain distance from my garage wifi AP, i.e. on the edge of "in", after wifi had been disconnected for some hours, and with the module still connected via modem. The wifi blob had been trying to connect to the AP for about two hours.
As seen before, the module saw no error, just the server responses and commands stopped coming in. I noticed the default interface was still "st1" despite wifi having been disconnected and modem connected. The DNS was also still configured for my wifi network, and the interface seemed to have an IP address -- but wasn't pingable from the wifi network.
A power cycle of the modem solved the issue without reboot. So the cause may be in the modem/ppp subsystem, or it may be related (in some weird way) to the default interface / DNS setup.
More tests showed the default interface again/still got set by the wifi blob itself at some point, overriding our modem prioritization. The events we didn't handle up to now were "sta.connected" and "sta.lostip", so I added these, and the bug didn't show up again since then. That doesn't mean anything, so we need to test this.
The default interface really shouldn't affect inbound packet routing of an established connection, but there always may be strange bugs lurking in those libs.
The change also reimplements the wifi signal strength reading, as the tests also showed that still wasn't working well using the CSI callback. It now seems to be much more reliable.
Please test & report. The single module will be hard to test, as the bug isn't reproducable easily, but you can still try if wifi / modem transitions work well.
Mark, you can check your server logs for history messages with ridiculous time offsets:
[sddexter@ns27 server]$ cat log-20190903 | egrep "rx msg h [0-9]+,-[0-9]{4}" | wc -l 455283
The bug now severely affects the V2 server performance, as the server is single threaded and doesn't scale very well to this kind of bulk data bursts, especially when coming from multiple modules in parallel. So we really need to solve this now. Slow reactions or connection drops from my server lately have been due to this bug. If this change doesn't solve it, we'll need to add some reboot trigger on "too many server v2 notification retransmissions" -- or maybe a modem power cycle will do, that wouldn't discard the data.
Thanks, Michael
Am 03.09.19 um 07:46 schrieb Mark Webb-Johnson:
No problem. We can hold. I won’t commit anything for the next few days (and agree to hold-off on Markos’s pull). Let me know when you are ready.
Regards, Mark.
On 3 Sep 2019, at 1:58 AM, Michael Balzer <dexter@expeedo.de> wrote:
Mark, please wait.
I may just have found the cause for issue #241, or at least something I need to investigate before releasing.
I need to dig into my logs first, and try something.
Regards, Michael
Am 02.09.19 um 12:23 schrieb Michael Balzer:
Nothing open from my side at the moment.
I haven't had the time to look in to Markos pull request, but from a first check also think that's going too deep to be included in this release.
Regards, Michael
Am 02.09.19 um 04:15 schrieb Mark Webb-Johnson: > I think it is well past time for a 3.2.003 release. Things seems table in edge (although some things only partially implemented). > > Anything people want to include at the last minute, or can we go ahead and build? > > Regards, Mark. > > _______________________________________________ > OvmsDev mailing list > OvmsDev@lists.openvehicles.com > http://lists.openvehicles.com/mailman/listinfo/ovmsdev -- Michael Balzer * Helkenberger Weg 9 * D-58256 Ennepetal Fon 02333 / 833 5735 * Handy 0176 / 206 989 26
_______________________________________________ OvmsDev mailing list OvmsDev@lists.openvehicles.com http://lists.openvehicles.com/mailman/listinfo/ovmsdev
OvmsDev mailing list OvmsDev@lists.openvehicles.com http://lists.openvehicles.com/mailman/listinfo/ovmsdev
-- Michael Balzer * Helkenberger Weg 9 * D-58256 Ennepetal Fon 02333 / 833 5735 * Handy 0176 / 206 989 26 _______________________________________________ OvmsDev mailing list OvmsDev@lists.openvehicles.com <mailto:OvmsDev@lists.openvehicles.com> http://lists.openvehicles.com/mailman/listinfo/ovmsdev
_______________________________________________ OvmsDev mailing list OvmsDev@lists.openvehicles.com http://lists.openvehicles.com/mailman/listinfo/ovmsdev
-- Michael Balzer * Helkenberger Weg 9 * D-58256 Ennepetal Fon 02333 / 833 5735 * Handy 0176 / 206 989 26
_______________________________________________ OvmsDev mailing list OvmsDev@lists.openvehicles.com http://lists.openvehicles.com/mailman/listinfo/ovmsdev
-- Michael Balzer * Helkenberger Weg 9 * D-58256 Ennepetal Fon 02333 / 833 5735 * Handy 0176 / 206 989 26
The workaround is based on the monotonictime being updated per second, as do the history record offsets. Apparently, that mechanism doesn't work reliably. That may be an indicator for some bigger underlying issue. Example log excerpt: 2019-09-06 22:07:48.126919 +0200 info main: #173 C MITPROHB rx msg h 964,0,RT-BAT-C,5,86400,2,1,3830,3795,3830,-10,25,25,25,0 2019-09-06 22:09:03.089031 +0200 info main: #173 C MITPROHB rx msg h 964,-10,RT-BAT-C,5,86400,2,1,3830,3795,3830,-10,25,25,25,0 2019-09-06 22:09:05.041574 +0200 info main: #173 C MITPROHB rx msg h 964,-20,RT-BAT-C,5,86400,2,1,3830,3795,3830,-10,25,25,25,0 2019-09-06 22:09:05.052644 +0200 info main: #173 C MITPROHB rx msg h 964,-30,RT-BAT-C,5,86400,2,1,3830,3795,3830,-10,25,25,25,0 2019-09-06 22:09:05.063617 +0200 info main: #173 C MITPROHB rx msg h 964,-49,RT-BAT-C,5,86400,2,1,3830,3795,3830,-10,25,25,25,0 2019-09-06 22:09:05.077527 +0200 info main: #173 C MITPROHB rx msg h 964,-59,RT-BAT-C,5,86400,2,1,3830,3795,3830,-10,25,25,25,0 2019-09-06 22:09:05.193775 +0200 info main: #173 C MITPROHB rx msg h 964,-70,RT-BAT-C,5,86400,2,1,3830,3795,3830,-10,25,25,25,0 2019-09-06 22:09:13.190645 +0200 info main: #173 C MITPROHB rx msg h 964,-80,RT-BAT-C,5,86400,2,1,3830,3795,3830,-10,25,25,25,0 2019-09-06 22:09:22.077994 +0200 info main: #173 C MITPROHB rx msg h 964,-90,RT-BAT-C,5,86400,2,1,3830,3795,3830,-10,25,25,25,0 2019-09-06 22:09:54.590300 +0200 info main: #173 C MITPROHB rx msg h 964,-109,RT-BAT-C,5,86400,2,1,3830,3795,3830,-10,25,25,25,0 2019-09-06 22:11:10.127054 +0200 info main: #173 C MITPROHB rx msg h 964,-119,RT-BAT-C,5,86400,2,1,3830,3795,3830,-10,25,25,25,0 2019-09-06 22:11:16.794200 +0200 info main: #173 C MITPROHB rx msg h 964,-130,RT-BAT-C,5,86400,2,1,3830,3795,3830,-10,25,25,25,0 2019-09-06 22:11:22.455652 +0200 info main: #173 C MITPROHB rx msg h 964,-140,RT-BAT-C,5,86400,2,1,3830,3795,3830,-10,25,25,25,0 2019-09-06 22:12:49.423412 +0200 info main: #173 C MITPROHB rx msg h 964,-150,RT-BAT-C,5,86400,2,1,3830,3795,3830,-10,25,25,25,0 2019-09-06 22:12:49.442096 +0200 info main: #173 C MITPROHB rx msg h 964,-169,RT-BAT-C,5,86400,2,1,3830,3795,3830,-10,25,25,25,0 2019-09-06 22:12:49.461941 +0200 info main: #173 C MITPROHB rx msg h 964,-179,RT-BAT-C,5,86400,2,1,3830,3795,3830,-10,25,25,25,0 2019-09-06 22:14:39.828133 +0200 info main: #173 C MITPROHB rx msg h 964,-190,RT-BAT-C,5,86400,2,1,3830,3795,3830,-10,25,25,25,0 2019-09-06 22:14:39.858144 +0200 info main: #173 C MITPROHB rx msg h 964,-200,RT-BAT-C,5,86400,2,1,3830,3795,3830,-10,25,25,25,0 2019-09-06 22:14:52.020319 +0200 info main: #173 C MITPROHB rx msg h 964,-210,RT-BAT-C,5,86400,2,1,3830,3795,3830,-10,25,25,25,0 2019-09-06 22:14:54.452637 +0200 info main: #173 C MITPROHB rx msg h 964,-229,RT-BAT-C,5,86400,2,1,3830,3795,3830,-10,25,25,25,0 2019-09-06 22:15:12.613935 +0200 info main: #173 C MITPROHB rx msg h 964,-239,RT-BAT-C,5,86400,2,1,3830,3795,3830,-10,25,25,25,0 2019-09-06 22:15:35.223845 +0200 info main: #173 C MITPROHB rx msg h 964,-250,RT-BAT-C,5,86400,2,1,3830,3795,3830,-10,25,25,25,0 2019-09-06 22:16:09.255059 +0200 info main: #173 C MITPROHB rx msg h 964,-260,RT-BAT-C,5,86400,2,1,3830,3795,3830,-10,25,25,25,0 2019-09-06 22:17:31.919754 +0200 info main: #173 C MITPROHB rx msg h 964,-270,RT-BAT-C,5,86400,2,1,3830,3795,3830,-10,25,25,25,0 2019-09-06 22:19:23.366267 +0200 info main: #173 C MITPROHB rx msg h 964,-289,RT-BAT-C,5,86400,2,1,3830,3795,3830,-10,25,25,25,0 2019-09-06 22:21:57.344609 +0200 info main: #173 C MITPROHB rx msg h 964,-299,RT-BAT-C,5,86400,2,1,3830,3795,3830,-10,25,25,25,0 2019-09-06 22:23:40.082406 +0200 info main: #31 C MITPROHB rx msg h 964,-1027,RT-BAT-C,5,86400,2,1,3830,3795,3830,-10,25,25,25,0 2019-09-06 22:25:58.061883 +0200 info main: #31 C MITPROHB rx msg h 964,-1040,RT-BAT-C,5,86400,2,1,3830,3795,3830,-10,25,25,25,0 This shows the ticker was only run 299 times from 22:07:48 to 22:21:57. After 22:21:57 the workaround was triggered and did a reconnect. Apparently during that network reinitialization of 103 seconds, the per second ticker was run 628 times. That can't be catching up on the event queue, as that queue has only 20 slots. So something strange is going on here. Any ideas? Regards, Michael Am 06.09.19 um 08:04 schrieb Michael Balzer:
Mark & anyone else running a V2 server,
as most cars don't send history records, this also needs the change to the server I just pushed, i.e. server version 2.4.2.
https://github.com/openvehicles/Open-Vehicle-Monitoring-System/commits/maste...
Regards, Michael
Am 05.09.19 um 19:55 schrieb Michael Balzer:
I've pushed the nasty workaround: the v2 server checks for no RX over 15 minutes, then restarts the network (wifi & modem) as configured for autostart.
Rolled out on my server in edge as 3.2.002-237-ge075f655.
Please test.
Regards, Michael
Am 05.09.19 um 01:58 schrieb Mark Webb-Johnson:
Mark, you can check your server logs for history messages with ridiculous time offsets:
[sddexter@ns27 server]$ cat log-20190903 | egrep "rx msg h [0-9]+,-[0-9]{4}" | wc -l 455283
I checked my logs and see 12 vehicles showing this. But, 2 only show this for a debugcrash log (which is expected, I guess, if the time is not synced at report time). I’ve got 4 cars with the offset > 10,000.
Regards, Mark.
On 4 Sep 2019, at 4:45 AM, Michael Balzer <dexter@expeedo.de <mailto:dexter@expeedo.de>> wrote:
Everyone,
I've pushed a change that needs some testing.
I had the issue myself now parking at a certain distance from my garage wifi AP, i.e. on the edge of "in", after wifi had been disconnected for some hours, and with the module still connected via modem. The wifi blob had been trying to connect to the AP for about two hours.
As seen before, the module saw no error, just the server responses and commands stopped coming in. I noticed the default interface was still "st1" despite wifi having been disconnected and modem connected. The DNS was also still configured for my wifi network, and the interface seemed to have an IP address -- but wasn't pingable from the wifi network.
A power cycle of the modem solved the issue without reboot. So the cause may be in the modem/ppp subsystem, or it may be related (in some weird way) to the default interface / DNS setup.
More tests showed the default interface again/still got set by the wifi blob itself at some point, overriding our modem prioritization. The events we didn't handle up to now were "sta.connected" and "sta.lostip", so I added these, and the bug didn't show up again since then. That doesn't mean anything, so we need to test this.
The default interface really shouldn't affect inbound packet routing of an established connection, but there always may be strange bugs lurking in those libs.
The change also reimplements the wifi signal strength reading, as the tests also showed that still wasn't working well using the CSI callback. It now seems to be much more reliable.
Please test & report. The single module will be hard to test, as the bug isn't reproducable easily, but you can still try if wifi / modem transitions work well.
Mark, you can check your server logs for history messages with ridiculous time offsets:
[sddexter@ns27 server]$ cat log-20190903 | egrep "rx msg h [0-9]+,-[0-9]{4}" | wc -l 455283
The bug now severely affects the V2 server performance, as the server is single threaded and doesn't scale very well to this kind of bulk data bursts, especially when coming from multiple modules in parallel. So we really need to solve this now. Slow reactions or connection drops from my server lately have been due to this bug. If this change doesn't solve it, we'll need to add some reboot trigger on "too many server v2 notification retransmissions" -- or maybe a modem power cycle will do, that wouldn't discard the data.
Thanks, Michael
Am 03.09.19 um 07:46 schrieb Mark Webb-Johnson:
No problem. We can hold. I won’t commit anything for the next few days (and agree to hold-off on Markos’s pull). Let me know when you are ready.
Regards, Mark.
On 3 Sep 2019, at 1:58 AM, Michael Balzer <dexter@expeedo.de> wrote:
Mark, please wait.
I may just have found the cause for issue #241, or at least something I need to investigate before releasing.
I need to dig into my logs first, and try something.
Regards, Michael
Am 02.09.19 um 12:23 schrieb Michael Balzer: > Nothing open from my side at the moment. > > I haven't had the time to look in to Markos pull request, but from a first check also think that's going too deep to be included in this release. > > Regards, > Michael > > > Am 02.09.19 um 04:15 schrieb Mark Webb-Johnson: >> I think it is well past time for a 3.2.003 release. Things seems table in edge (although some things only partially implemented). >> >> Anything people want to include at the last minute, or can we go ahead and build? >> >> Regards, Mark. >> >> _______________________________________________ >> OvmsDev mailing list >> OvmsDev@lists.openvehicles.com >> http://lists.openvehicles.com/mailman/listinfo/ovmsdev -- Michael Balzer * Helkenberger Weg 9 * D-58256 Ennepetal Fon 02333 / 833 5735 * Handy 0176 / 206 989 26
_______________________________________________ OvmsDev mailing list OvmsDev@lists.openvehicles.com http://lists.openvehicles.com/mailman/listinfo/ovmsdev
OvmsDev mailing list OvmsDev@lists.openvehicles.com http://lists.openvehicles.com/mailman/listinfo/ovmsdev
-- Michael Balzer * Helkenberger Weg 9 * D-58256 Ennepetal Fon 02333 / 833 5735 * Handy 0176 / 206 989 26 _______________________________________________ OvmsDev mailing list OvmsDev@lists.openvehicles.com <mailto:OvmsDev@lists.openvehicles.com> http://lists.openvehicles.com/mailman/listinfo/ovmsdev
_______________________________________________ OvmsDev mailing list OvmsDev@lists.openvehicles.com http://lists.openvehicles.com/mailman/listinfo/ovmsdev
-- Michael Balzer * Helkenberger Weg 9 * D-58256 Ennepetal Fon 02333 / 833 5735 * Handy 0176 / 206 989 26
_______________________________________________ OvmsDev mailing list OvmsDev@lists.openvehicles.com http://lists.openvehicles.com/mailman/listinfo/ovmsdev
-- Michael Balzer * Helkenberger Weg 9 * D-58256 Ennepetal Fon 02333 / 833 5735 * Handy 0176 / 206 989 26
_______________________________________________ OvmsDev mailing list OvmsDev@lists.openvehicles.com http://lists.openvehicles.com/mailman/listinfo/ovmsdev
-- Michael Balzer * Helkenberger Weg 9 * D-58256 Ennepetal Fon 02333 / 833 5735 * Handy 0176 / 206 989 26
I think the RTOS timer service task starves. It's running on core 0 with priority 1. Taks on core 0 sorted by priority: Number of Tasks = 20 Stack: Now Max Total Heap 32-bit SPIRAM C# PRI 3FFC84A8 6 Blk ipc0 388 500 1024 7788 0 0 0 24 3FFC77F0 5 Blk OVMS CanRx 428 428 2048 3052 0 31844 0 23 3FFAFBF4 1 Blk esp_timer 400 656 4096 35928 644 25804 0 22 3FFD3240 19 Blk wifi 460 2716 3584 43720 0 20 0 22 3FFC03C4 2 Blk eventTask 448 1984 4608 104 0 0 0 20 3FFC8F14 17 Blk tiT 500 2308 3072 6552 0 0 * 18 3FFE14F0 26 Blk OVMS COrx 456 456 4096 0 0 0 0 7 3FFE19D4 27 Blk OVMS COwrk 476 476 3072 0 0 0 0 7 3FFCBC34 12 Blk Tmr Svc 352 928 3072 88 0 0 0 1 3FFE7708 23 Blk mdns 468 1396 4096 108 0 0 0 1 I don't think it's our CanRx, as that only fetches and queues CAN frames, the actual work is done by the listeners. The CO tasks only run for CANopen jobs, which are few for normal operation. That leaves the system tasks, with main suspect -once again- the wifi blob. We need to know how much CPU time the tasks actually use now. I think I saw some option for this in the FreeRTOS config. Regards, Michael Am 06.09.19 um 23:15 schrieb Michael Balzer:
The workaround is based on the monotonictime being updated per second, as do the history record offsets.
Apparently, that mechanism doesn't work reliably. That may be an indicator for some bigger underlying issue.
Example log excerpt:
2019-09-06 22:07:48.126919 +0200 info main: #173 C MITPROHB rx msg h 964,0,RT-BAT-C,5,86400,2,1,3830,3795,3830,-10,25,25,25,0 2019-09-06 22:09:03.089031 +0200 info main: #173 C MITPROHB rx msg h 964,-10,RT-BAT-C,5,86400,2,1,3830,3795,3830,-10,25,25,25,0 2019-09-06 22:09:05.041574 +0200 info main: #173 C MITPROHB rx msg h 964,-20,RT-BAT-C,5,86400,2,1,3830,3795,3830,-10,25,25,25,0 2019-09-06 22:09:05.052644 +0200 info main: #173 C MITPROHB rx msg h 964,-30,RT-BAT-C,5,86400,2,1,3830,3795,3830,-10,25,25,25,0 2019-09-06 22:09:05.063617 +0200 info main: #173 C MITPROHB rx msg h 964,-49,RT-BAT-C,5,86400,2,1,3830,3795,3830,-10,25,25,25,0 2019-09-06 22:09:05.077527 +0200 info main: #173 C MITPROHB rx msg h 964,-59,RT-BAT-C,5,86400,2,1,3830,3795,3830,-10,25,25,25,0 2019-09-06 22:09:05.193775 +0200 info main: #173 C MITPROHB rx msg h 964,-70,RT-BAT-C,5,86400,2,1,3830,3795,3830,-10,25,25,25,0 2019-09-06 22:09:13.190645 +0200 info main: #173 C MITPROHB rx msg h 964,-80,RT-BAT-C,5,86400,2,1,3830,3795,3830,-10,25,25,25,0 2019-09-06 22:09:22.077994 +0200 info main: #173 C MITPROHB rx msg h 964,-90,RT-BAT-C,5,86400,2,1,3830,3795,3830,-10,25,25,25,0 2019-09-06 22:09:54.590300 +0200 info main: #173 C MITPROHB rx msg h 964,-109,RT-BAT-C,5,86400,2,1,3830,3795,3830,-10,25,25,25,0 2019-09-06 22:11:10.127054 +0200 info main: #173 C MITPROHB rx msg h 964,-119,RT-BAT-C,5,86400,2,1,3830,3795,3830,-10,25,25,25,0 2019-09-06 22:11:16.794200 +0200 info main: #173 C MITPROHB rx msg h 964,-130,RT-BAT-C,5,86400,2,1,3830,3795,3830,-10,25,25,25,0 2019-09-06 22:11:22.455652 +0200 info main: #173 C MITPROHB rx msg h 964,-140,RT-BAT-C,5,86400,2,1,3830,3795,3830,-10,25,25,25,0 2019-09-06 22:12:49.423412 +0200 info main: #173 C MITPROHB rx msg h 964,-150,RT-BAT-C,5,86400,2,1,3830,3795,3830,-10,25,25,25,0 2019-09-06 22:12:49.442096 +0200 info main: #173 C MITPROHB rx msg h 964,-169,RT-BAT-C,5,86400,2,1,3830,3795,3830,-10,25,25,25,0 2019-09-06 22:12:49.461941 +0200 info main: #173 C MITPROHB rx msg h 964,-179,RT-BAT-C,5,86400,2,1,3830,3795,3830,-10,25,25,25,0 2019-09-06 22:14:39.828133 +0200 info main: #173 C MITPROHB rx msg h 964,-190,RT-BAT-C,5,86400,2,1,3830,3795,3830,-10,25,25,25,0 2019-09-06 22:14:39.858144 +0200 info main: #173 C MITPROHB rx msg h 964,-200,RT-BAT-C,5,86400,2,1,3830,3795,3830,-10,25,25,25,0 2019-09-06 22:14:52.020319 +0200 info main: #173 C MITPROHB rx msg h 964,-210,RT-BAT-C,5,86400,2,1,3830,3795,3830,-10,25,25,25,0 2019-09-06 22:14:54.452637 +0200 info main: #173 C MITPROHB rx msg h 964,-229,RT-BAT-C,5,86400,2,1,3830,3795,3830,-10,25,25,25,0 2019-09-06 22:15:12.613935 +0200 info main: #173 C MITPROHB rx msg h 964,-239,RT-BAT-C,5,86400,2,1,3830,3795,3830,-10,25,25,25,0 2019-09-06 22:15:35.223845 +0200 info main: #173 C MITPROHB rx msg h 964,-250,RT-BAT-C,5,86400,2,1,3830,3795,3830,-10,25,25,25,0 2019-09-06 22:16:09.255059 +0200 info main: #173 C MITPROHB rx msg h 964,-260,RT-BAT-C,5,86400,2,1,3830,3795,3830,-10,25,25,25,0 2019-09-06 22:17:31.919754 +0200 info main: #173 C MITPROHB rx msg h 964,-270,RT-BAT-C,5,86400,2,1,3830,3795,3830,-10,25,25,25,0 2019-09-06 22:19:23.366267 +0200 info main: #173 C MITPROHB rx msg h 964,-289,RT-BAT-C,5,86400,2,1,3830,3795,3830,-10,25,25,25,0 2019-09-06 22:21:57.344609 +0200 info main: #173 C MITPROHB rx msg h 964,-299,RT-BAT-C,5,86400,2,1,3830,3795,3830,-10,25,25,25,0 2019-09-06 22:23:40.082406 +0200 info main: #31 C MITPROHB rx msg h 964,-1027,RT-BAT-C,5,86400,2,1,3830,3795,3830,-10,25,25,25,0 2019-09-06 22:25:58.061883 +0200 info main: #31 C MITPROHB rx msg h 964,-1040,RT-BAT-C,5,86400,2,1,3830,3795,3830,-10,25,25,25,0
This shows the ticker was only run 299 times from 22:07:48 to 22:21:57.
After 22:21:57 the workaround was triggered and did a reconnect. Apparently during that network reinitialization of 103 seconds, the per second ticker was run 628 times.
That can't be catching up on the event queue, as that queue has only 20 slots. So something strange is going on here.
Any ideas?
Regards, Michael
Am 06.09.19 um 08:04 schrieb Michael Balzer:
Mark & anyone else running a V2 server,
as most cars don't send history records, this also needs the change to the server I just pushed, i.e. server version 2.4.2.
https://github.com/openvehicles/Open-Vehicle-Monitoring-System/commits/maste...
Regards, Michael
Am 05.09.19 um 19:55 schrieb Michael Balzer:
I've pushed the nasty workaround: the v2 server checks for no RX over 15 minutes, then restarts the network (wifi & modem) as configured for autostart.
Rolled out on my server in edge as 3.2.002-237-ge075f655.
Please test.
Regards, Michael
Am 05.09.19 um 01:58 schrieb Mark Webb-Johnson:
Mark, you can check your server logs for history messages with ridiculous time offsets:
[sddexter@ns27 server]$ cat log-20190903 | egrep "rx msg h [0-9]+,-[0-9]{4}" | wc -l 455283
I checked my logs and see 12 vehicles showing this. But, 2 only show this for a debugcrash log (which is expected, I guess, if the time is not synced at report time). I’ve got 4 cars with the offset > 10,000.
Regards, Mark.
On 4 Sep 2019, at 4:45 AM, Michael Balzer <dexter@expeedo.de <mailto:dexter@expeedo.de>> wrote:
Everyone,
I've pushed a change that needs some testing.
I had the issue myself now parking at a certain distance from my garage wifi AP, i.e. on the edge of "in", after wifi had been disconnected for some hours, and with the module still connected via modem. The wifi blob had been trying to connect to the AP for about two hours.
As seen before, the module saw no error, just the server responses and commands stopped coming in. I noticed the default interface was still "st1" despite wifi having been disconnected and modem connected. The DNS was also still configured for my wifi network, and the interface seemed to have an IP address -- but wasn't pingable from the wifi network.
A power cycle of the modem solved the issue without reboot. So the cause may be in the modem/ppp subsystem, or it may be related (in some weird way) to the default interface / DNS setup.
More tests showed the default interface again/still got set by the wifi blob itself at some point, overriding our modem prioritization. The events we didn't handle up to now were "sta.connected" and "sta.lostip", so I added these, and the bug didn't show up again since then. That doesn't mean anything, so we need to test this.
The default interface really shouldn't affect inbound packet routing of an established connection, but there always may be strange bugs lurking in those libs.
The change also reimplements the wifi signal strength reading, as the tests also showed that still wasn't working well using the CSI callback. It now seems to be much more reliable.
Please test & report. The single module will be hard to test, as the bug isn't reproducable easily, but you can still try if wifi / modem transitions work well.
Mark, you can check your server logs for history messages with ridiculous time offsets:
[sddexter@ns27 server]$ cat log-20190903 | egrep "rx msg h [0-9]+,-[0-9]{4}" | wc -l 455283
The bug now severely affects the V2 server performance, as the server is single threaded and doesn't scale very well to this kind of bulk data bursts, especially when coming from multiple modules in parallel. So we really need to solve this now. Slow reactions or connection drops from my server lately have been due to this bug. If this change doesn't solve it, we'll need to add some reboot trigger on "too many server v2 notification retransmissions" -- or maybe a modem power cycle will do, that wouldn't discard the data.
Thanks, Michael
Am 03.09.19 um 07:46 schrieb Mark Webb-Johnson:
No problem. We can hold. I won’t commit anything for the next few days (and agree to hold-off on Markos’s pull). Let me know when you are ready.
Regards, Mark.
> On 3 Sep 2019, at 1:58 AM, Michael Balzer <dexter@expeedo.de> wrote: > > Mark, please wait. > > I may just have found the cause for issue #241, or at least something I need to investigate before releasing. > > I need to dig into my logs first, and try something. > > Regards, > Michael > > > Am 02.09.19 um 12:23 schrieb Michael Balzer: >> Nothing open from my side at the moment. >> >> I haven't had the time to look in to Markos pull request, but from a first check also think that's going too deep to be included in this release. >> >> Regards, >> Michael >> >> >> Am 02.09.19 um 04:15 schrieb Mark Webb-Johnson: >>> I think it is well past time for a 3.2.003 release. Things seems table in edge (although some things only partially implemented). >>> >>> Anything people want to include at the last minute, or can we go ahead and build? >>> >>> Regards, Mark. >>> >>> _______________________________________________ >>> OvmsDev mailing list >>> OvmsDev@lists.openvehicles.com >>> http://lists.openvehicles.com/mailman/listinfo/ovmsdev > -- > Michael Balzer * Helkenberger Weg 9 * D-58256 Ennepetal > Fon 02333 / 833 5735 * Handy 0176 / 206 989 26 > > _______________________________________________ > OvmsDev mailing list > OvmsDev@lists.openvehicles.com > http://lists.openvehicles.com/mailman/listinfo/ovmsdev _______________________________________________ OvmsDev mailing list OvmsDev@lists.openvehicles.com http://lists.openvehicles.com/mailman/listinfo/ovmsdev
-- Michael Balzer * Helkenberger Weg 9 * D-58256 Ennepetal Fon 02333 / 833 5735 * Handy 0176 / 206 989 26 _______________________________________________ OvmsDev mailing list OvmsDev@lists.openvehicles.com <mailto:OvmsDev@lists.openvehicles.com> http://lists.openvehicles.com/mailman/listinfo/ovmsdev
_______________________________________________ OvmsDev mailing list OvmsDev@lists.openvehicles.com http://lists.openvehicles.com/mailman/listinfo/ovmsdev
-- Michael Balzer * Helkenberger Weg 9 * D-58256 Ennepetal Fon 02333 / 833 5735 * Handy 0176 / 206 989 26
_______________________________________________ OvmsDev mailing list OvmsDev@lists.openvehicles.com http://lists.openvehicles.com/mailman/listinfo/ovmsdev
-- Michael Balzer * Helkenberger Weg 9 * D-58256 Ennepetal Fon 02333 / 833 5735 * Handy 0176 / 206 989 26
_______________________________________________ OvmsDev mailing list OvmsDev@lists.openvehicles.com http://lists.openvehicles.com/mailman/listinfo/ovmsdev
-- Michael Balzer * Helkenberger Weg 9 * D-58256 Ennepetal Fon 02333 / 833 5735 * Handy 0176 / 206 989 26
_______________________________________________ OvmsDev mailing list OvmsDev@lists.openvehicles.com http://lists.openvehicles.com/mailman/listinfo/ovmsdev
-- Michael Balzer * Helkenberger Weg 9 * D-58256 Ennepetal Fon 02333 / 833 5735 * Handy 0176 / 206 989 26
Hi, not sure if this is relevant, but my modifications have caused stack overflow in few modules, and required increasing the stack size. Might happen sporadically in some execution branches in your fork too? See if increasing stack size in these modules help: CONFIG_OVMS_HW_CAN_RX_QUEUE_SIZE -> 4096 CONFIG_OVMS_VEHICLE_RXTASK_STACK -> 8192 CONFIG_OVMS_SYS_COMMAND_STACK_SIZE *2 Br, Marko On Sat, Sep 7, 2019 at 11:56 AM Michael Balzer <dexter@expeedo.de> wrote:
I think the RTOS timer service task starves. It's running on core 0 with priority 1.
Taks on core 0 sorted by priority:
Number of Tasks = 20 Stack: Now Max Total Heap 32-bit SPIRAM C# PRI 3FFC84A8 6 Blk ipc0 388 500 1024 7788 0 0 0 24 3FFC77F0 5 Blk OVMS CanRx 428 428 2048 3052 0 31844 0 23 3FFAFBF4 1 Blk esp_timer 400 656 4096 35928 644 25804 0 22 3FFD3240 19 Blk wifi 460 2716 3584 43720 0 20 0 22 3FFC03C4 2 Blk eventTask 448 1984 4608 104 0 0 0 20 3FFC8F14 17 Blk tiT 500 2308 3072 6552 0 0 * 18 3FFE14F0 26 Blk OVMS COrx 456 456 4096 0 0 0 0 7 3FFE19D4 27 Blk OVMS COwrk 476 476 3072 0 0 0 0 7 3FFCBC34 12 Blk Tmr Svc 352 928 3072 88 0 0 0 1 3FFE7708 23 Blk mdns 468 1396 4096 108 0 0 0 1
I don't think it's our CanRx, as that only fetches and queues CAN frames, the actual work is done by the listeners. The CO tasks only run for CANopen jobs, which are few for normal operation.
That leaves the system tasks, with main suspect -once again- the wifi blob.
We need to know how much CPU time the tasks actually use now. I think I saw some option for this in the FreeRTOS config.
Regards, Michael
Am 06.09.19 um 23:15 schrieb Michael Balzer:
The workaround is based on the monotonictime being updated per second, as do the history record offsets.
Apparently, that mechanism doesn't work reliably. That may be an indicator for some bigger underlying issue.
Example log excerpt:
2019-09-06 22:07:48.126919 +0200 info main: #173 C MITPROHB rx msg h 964,0,RT-BAT-C,5,86400,2,1,3830,3795,3830,-10,25,25,25,0 2019-09-06 22:09:03.089031 +0200 info main: #173 C MITPROHB rx msg h 964,-10,RT-BAT-C,5,86400,2,1,3830,3795,3830,-10,25,25,25,0 2019-09-06 22:09:05.041574 +0200 info main: #173 C MITPROHB rx msg h 964,-20,RT-BAT-C,5,86400,2,1,3830,3795,3830,-10,25,25,25,0 2019-09-06 22:09:05.052644 +0200 info main: #173 C MITPROHB rx msg h 964,-30,RT-BAT-C,5,86400,2,1,3830,3795,3830,-10,25,25,25,0 2019-09-06 22:09:05.063617 +0200 info main: #173 C MITPROHB rx msg h 964,-49,RT-BAT-C,5,86400,2,1,3830,3795,3830,-10,25,25,25,0 2019-09-06 22:09:05.077527 +0200 info main: #173 C MITPROHB rx msg h 964,-59,RT-BAT-C,5,86400,2,1,3830,3795,3830,-10,25,25,25,0 2019-09-06 22:09:05.193775 +0200 info main: #173 C MITPROHB rx msg h 964,-70,RT-BAT-C,5,86400,2,1,3830,3795,3830,-10,25,25,25,0 2019-09-06 22:09:13.190645 +0200 info main: #173 C MITPROHB rx msg h 964,-80,RT-BAT-C,5,86400,2,1,3830,3795,3830,-10,25,25,25,0 2019-09-06 22:09:22.077994 +0200 info main: #173 C MITPROHB rx msg h 964,-90,RT-BAT-C,5,86400,2,1,3830,3795,3830,-10,25,25,25,0 2019-09-06 22:09:54.590300 +0200 info main: #173 C MITPROHB rx msg h 964,-109,RT-BAT-C,5,86400,2,1,3830,3795,3830,-10,25,25,25,0 2019-09-06 22:11:10.127054 +0200 info main: #173 C MITPROHB rx msg h 964,-119,RT-BAT-C,5,86400,2,1,3830,3795,3830,-10,25,25,25,0 2019-09-06 22:11:16.794200 +0200 info main: #173 C MITPROHB rx msg h 964,-130,RT-BAT-C,5,86400,2,1,3830,3795,3830,-10,25,25,25,0 2019-09-06 22:11:22.455652 +0200 info main: #173 C MITPROHB rx msg h 964,-140,RT-BAT-C,5,86400,2,1,3830,3795,3830,-10,25,25,25,0 2019-09-06 22:12:49.423412 +0200 info main: #173 C MITPROHB rx msg h 964,-150,RT-BAT-C,5,86400,2,1,3830,3795,3830,-10,25,25,25,0 2019-09-06 22:12:49.442096 +0200 info main: #173 C MITPROHB rx msg h 964,-169,RT-BAT-C,5,86400,2,1,3830,3795,3830,-10,25,25,25,0 2019-09-06 22:12:49.461941 +0200 info main: #173 C MITPROHB rx msg h 964,-179,RT-BAT-C,5,86400,2,1,3830,3795,3830,-10,25,25,25,0 2019-09-06 22:14:39.828133 +0200 info main: #173 C MITPROHB rx msg h 964,-190,RT-BAT-C,5,86400,2,1,3830,3795,3830,-10,25,25,25,0 2019-09-06 22:14:39.858144 +0200 info main: #173 C MITPROHB rx msg h 964,-200,RT-BAT-C,5,86400,2,1,3830,3795,3830,-10,25,25,25,0 2019-09-06 22:14:52.020319 +0200 info main: #173 C MITPROHB rx msg h 964,-210,RT-BAT-C,5,86400,2,1,3830,3795,3830,-10,25,25,25,0 2019-09-06 22:14:54.452637 +0200 info main: #173 C MITPROHB rx msg h 964,-229,RT-BAT-C,5,86400,2,1,3830,3795,3830,-10,25,25,25,0 2019-09-06 22:15:12.613935 +0200 info main: #173 C MITPROHB rx msg h 964,-239,RT-BAT-C,5,86400,2,1,3830,3795,3830,-10,25,25,25,0 2019-09-06 22:15:35.223845 +0200 info main: #173 C MITPROHB rx msg h 964,-250,RT-BAT-C,5,86400,2,1,3830,3795,3830,-10,25,25,25,0 2019-09-06 22:16:09.255059 +0200 info main: #173 C MITPROHB rx msg h 964,-260,RT-BAT-C,5,86400,2,1,3830,3795,3830,-10,25,25,25,0 2019-09-06 22:17:31.919754 +0200 info main: #173 C MITPROHB rx msg h 964,-270,RT-BAT-C,5,86400,2,1,3830,3795,3830,-10,25,25,25,0 2019-09-06 22:19:23.366267 +0200 info main: #173 C MITPROHB rx msg h 964,-289,RT-BAT-C,5,86400,2,1,3830,3795,3830,-10,25,25,25,0 2019-09-06 22:21:57.344609 +0200 info main: #173 C MITPROHB rx msg h 964,-299,RT-BAT-C,5,86400,2,1,3830,3795,3830,-10,25,25,25,0 2019-09-06 22:23:40.082406 +0200 info main: #31 C MITPROHB rx msg h 964,-1027,RT-BAT-C,5,86400,2,1,3830,3795,3830,-10,25,25,25,0 2019-09-06 22:25:58.061883 +0200 info main: #31 C MITPROHB rx msg h 964,-1040,RT-BAT-C,5,86400,2,1,3830,3795,3830,-10,25,25,25,0
This shows the ticker was only run 299 times from 22:07:48 to 22:21:57.
After 22:21:57 the workaround was triggered and did a reconnect. Apparently during that network reinitialization of 103 seconds, the per second ticker was run 628 times.
That can't be catching up on the event queue, as that queue has only 20 slots. So something strange is going on here.
Any ideas?
Regards, Michael
Am 06.09.19 um 08:04 schrieb Michael Balzer:
Mark & anyone else running a V2 server,
as most cars don't send history records, this also needs the change to the server I just pushed, i.e. server version 2.4.2.
https://github.com/openvehicles/Open-Vehicle-Monitoring-System/commits/maste...
Regards, Michael
Am 05.09.19 um 19:55 schrieb Michael Balzer:
I've pushed the nasty workaround: the v2 server checks for no RX over 15 minutes, then restarts the network (wifi & modem) as configured for autostart.
Rolled out on my server in edge as 3.2.002-237-ge075f655.
Please test.
Regards, Michael
Am 05.09.19 um 01:58 schrieb Mark Webb-Johnson:
Mark, you can check your server logs for history messages with ridiculous time offsets:
[sddexter@ns27 server]$ cat log-20190903 | egrep "rx msg h [0-9]+,-[0-9]{4}" | wc -l 455283
I checked my logs and see 12 vehicles showing this. But, 2 only show this for a debugcrash log (which is expected, I guess, if the time is not synced at report time). I’ve got 4 cars with the offset > 10,000.
Regards, Mark.
On 4 Sep 2019, at 4:45 AM, Michael Balzer <dexter@expeedo.de> wrote:
Everyone,
I've pushed a change that needs some testing.
I had the issue myself now parking at a certain distance from my garage wifi AP, i.e. on the edge of "in", after wifi had been disconnected for some hours, and with the module still connected via modem. The wifi blob had been trying to connect to the AP for about two hours.
As seen before, the module saw no error, just the server responses and commands stopped coming in. I noticed the default interface was still "st1" despite wifi having been disconnected and modem connected. The DNS was also still configured for my wifi network, and the interface seemed to have an IP address -- but wasn't pingable from the wifi network.
A power cycle of the modem solved the issue without reboot. So the cause may be in the modem/ppp subsystem, or it may be related (in some weird way) to the default interface / DNS setup.
More tests showed the default interface again/still got set by the wifi blob itself at some point, overriding our modem prioritization. The events we didn't handle up to now were "sta.connected" and "sta.lostip", so I added these, and the bug didn't show up again since then. That doesn't mean anything, so we need to test this.
The default interface really shouldn't affect inbound packet routing of an established connection, but there always may be strange bugs lurking in those libs.
The change also reimplements the wifi signal strength reading, as the tests also showed that still wasn't working well using the CSI callback. It now seems to be much more reliable.
Please test & report. The single module will be hard to test, as the bug isn't reproducable easily, but you can still try if wifi / modem transitions work well.
Mark, you can check your server logs for history messages with ridiculous time offsets:
[sddexter@ns27 server]$ cat log-20190903 | egrep "rx msg h [0-9]+,-[0-9]{4}" | wc -l 455283
The bug now severely affects the V2 server performance, as the server is single threaded and doesn't scale very well to this kind of bulk data bursts, especially when coming from multiple modules in parallel. So we really need to solve this now. Slow reactions or connection drops from my server lately have been due to this bug. If this change doesn't solve it, we'll need to add some reboot trigger on "too many server v2 notification retransmissions" -- or maybe a modem power cycle will do, that wouldn't discard the data.
Thanks, Michael
Am 03.09.19 um 07:46 schrieb Mark Webb-Johnson:
No problem. We can hold. I won’t commit anything for the next few days (and agree to hold-off on Markos’s pull). Let me know when you are ready.
Regards, Mark.
On 3 Sep 2019, at 1:58 AM, Michael Balzer <dexter@expeedo.de> <dexter@expeedo.de> wrote:
Mark, please wait.
I may just have found the cause for issue #241, or at least something I need to investigate before releasing.
I need to dig into my logs first, and try something.
Regards, Michael
Am 02.09.19 um 12:23 schrieb Michael Balzer:
Nothing open from my side at the moment.
I haven't had the time to look in to Markos pull request, but from a first check also think that's going too deep to be included in this release.
Regards, Michael
Am 02.09.19 um 04:15 schrieb Mark Webb-Johnson:
I think it is well past time for a 3.2.003 release. Things seems table in edge (although some things only partially implemented).
Anything people want to include at the last minute, or can we go ahead and build?
Regards, Mark.
_______________________________________________ OvmsDev mailing listOvmsDev@lists.openvehicles.comhttp://lists.openvehicles.com/mailman/listinfo/ovmsdev
-- Michael Balzer * Helkenberger Weg 9 * D-58256 Ennepetal Fon 02333 / 833 5735 * Handy 0176 / 206 989 26
_______________________________________________ OvmsDev mailing listOvmsDev@lists.openvehicles.comhttp://lists.openvehicles.com/mailman/listinfo/ovmsdev
_______________________________________________ OvmsDev mailing listOvmsDev@lists.openvehicles.comhttp://lists.openvehicles.com/mailman/listinfo/ovmsdev
-- Michael Balzer * Helkenberger Weg 9 * D-58256 Ennepetal Fon 02333 / 833 5735 * Handy 0176 / 206 989 26
_______________________________________________ OvmsDev mailing list OvmsDev@lists.openvehicles.com http://lists.openvehicles.com/mailman/listinfo/ovmsdev
_______________________________________________ OvmsDev mailing listOvmsDev@lists.openvehicles.comhttp://lists.openvehicles.com/mailman/listinfo/ovmsdev
-- Michael Balzer * Helkenberger Weg 9 * D-58256 Ennepetal Fon 02333 / 833 5735 * Handy 0176 / 206 989 26
_______________________________________________ OvmsDev mailing listOvmsDev@lists.openvehicles.comhttp://lists.openvehicles.com/mailman/listinfo/ovmsdev
-- Michael Balzer * Helkenberger Weg 9 * D-58256 Ennepetal Fon 02333 / 833 5735 * Handy 0176 / 206 989 26
_______________________________________________ OvmsDev mailing listOvmsDev@lists.openvehicles.comhttp://lists.openvehicles.com/mailman/listinfo/ovmsdev
-- Michael Balzer * Helkenberger Weg 9 * D-58256 Ennepetal Fon 02333 / 833 5735 * Handy 0176 / 206 989 26
_______________________________________________ OvmsDev mailing listOvmsDev@lists.openvehicles.comhttp://lists.openvehicles.com/mailman/listinfo/ovmsdev
-- Michael Balzer * Helkenberger Weg 9 * D-58256 Ennepetal Fon 02333 / 833 5735 * Handy 0176 / 206 989 26
_______________________________________________ OvmsDev mailing list OvmsDev@lists.openvehicles.com http://lists.openvehicles.com/mailman/listinfo/ovmsdev
Marko, probably no connection here, if stack was an issue the module would rather crash than drop events. Regards, Michael Am 07.09.19 um 11:16 schrieb Marko Juhanne:
Hi,
not sure if this is relevant, but my modifications have caused stack overflow in few modules, and required increasing the stack size. Might happen sporadically in some execution branches in your fork too?
See if increasing stack size in these modules help: CONFIG_OVMS_HW_CAN_RX_QUEUE_SIZE -> 4096 CONFIG_OVMS_VEHICLE_RXTASK_STACK -> 8192 CONFIG_OVMS_SYS_COMMAND_STACK_SIZE *2 Br, Marko
-- Michael Balzer * Helkenberger Weg 9 * D-58256 Ennepetal Fon 02333 / 833 5735 * Handy 0176 / 206 989 26
I've pushed some modifications and improvements to (hopefully) fix the timer issue or at least be able to debug it. Some sdkconfig changes are necessary. The build including these updates is on my edge release as 3.2.002-258-g20ae554b. Btw: the network restart strategy seems to mitigate issue #241; I've seen a major drop on record repetitions on my server since the rollout. commit 99e4e48bdd40b7004c0976f51aba9e3da4ecab53 Module: add per task CPU usage statistics, add task stats history records To enable CPU usage statistics, apply the changes to sdkconfig included. The CPU usage shown by the commands is calculated against the last task status retrieved (or system boot). Command changes: - "module tasks" -- added CPU (core) usage in percent per task New command: - "module tasks data" -- output task stats in history record form New config: - [module] debug.tasks -- yes (default) = send task stats every 5 minutes New history record: - "*-OVM-DebugTasks" v1: <taskcnt,totaltime> + per task: <tasknum,name,state,stack_now,stack_max,stack_total, heap_total,heap_32bit,heap_spi,runtime> Note: CPU core use percentage = runtime / totaltime commit 950172c216a72beb4da0bc7a40a46995a6105955 Build config: default timer service task priority raised to 20 Background: the FreeRTOS timer service shall only be used for very short and non-blocking jobs. We delegate event processing to our events task, anything else in timers needs to run with high priority. commit 31ac19d187480046c16356b80668de45cacbb83d DukTape: add build config for task priority, default lowered to 3 Background: the DukTape garbage collector shall run on lower priority than tasks like SIMCOM & events commit e0a44791fbcfb5a4e4cad24c9d1163b76e637b4f Server V2: use esp_log_timestamp for timeout detection, add timeout config, limit data records & size per second New config: - [server.v2] timeout.rx -- timeout in seconds, default 960 commit 684a4ce9525175a910040f0d1ca82ac212fbf5de Notify: use esp_log_timestamp for creation time instead of monotonictime to harden against timer service starvation / ticker event drops Regards, Michael Am 07.09.19 um 10:55 schrieb Michael Balzer:
I think the RTOS timer service task starves. It's running on core 0 with priority 1.
Taks on core 0 sorted by priority:
Number of Tasks = 20 Stack: Now Max Total Heap 32-bit SPIRAM C# PRI 3FFC84A8 6 Blk ipc0 388 500 1024 7788 0 0 0 24 3FFC77F0 5 Blk OVMS CanRx 428 428 2048 3052 0 31844 0 23 3FFAFBF4 1 Blk esp_timer 400 656 4096 35928 644 25804 0 22 3FFD3240 19 Blk wifi 460 2716 3584 43720 0 20 0 22 3FFC03C4 2 Blk eventTask 448 1984 4608 104 0 0 0 20 3FFC8F14 17 Blk tiT 500 2308 3072 6552 0 0 * 18 3FFE14F0 26 Blk OVMS COrx 456 456 4096 0 0 0 0 7 3FFE19D4 27 Blk OVMS COwrk 476 476 3072 0 0 0 0 7 3FFCBC34 12 Blk Tmr Svc 352 928 3072 88 0 0 0 1 3FFE7708 23 Blk mdns 468 1396 4096 108 0 0 0 1
I don't think it's our CanRx, as that only fetches and queues CAN frames, the actual work is done by the listeners. The CO tasks only run for CANopen jobs, which are few for normal operation.
That leaves the system tasks, with main suspect -once again- the wifi blob.
We need to know how much CPU time the tasks actually use now. I think I saw some option for this in the FreeRTOS config.
Regards, Michael
Am 06.09.19 um 23:15 schrieb Michael Balzer:
The workaround is based on the monotonictime being updated per second, as do the history record offsets.
Apparently, that mechanism doesn't work reliably. That may be an indicator for some bigger underlying issue.
Example log excerpt:
2019-09-06 22:07:48.126919 +0200 info main: #173 C MITPROHB rx msg h 964,0,RT-BAT-C,5,86400,2,1,3830,3795,3830,-10,25,25,25,0 2019-09-06 22:09:03.089031 +0200 info main: #173 C MITPROHB rx msg h 964,-10,RT-BAT-C,5,86400,2,1,3830,3795,3830,-10,25,25,25,0 2019-09-06 22:09:05.041574 +0200 info main: #173 C MITPROHB rx msg h 964,-20,RT-BAT-C,5,86400,2,1,3830,3795,3830,-10,25,25,25,0 2019-09-06 22:09:05.052644 +0200 info main: #173 C MITPROHB rx msg h 964,-30,RT-BAT-C,5,86400,2,1,3830,3795,3830,-10,25,25,25,0 2019-09-06 22:09:05.063617 +0200 info main: #173 C MITPROHB rx msg h 964,-49,RT-BAT-C,5,86400,2,1,3830,3795,3830,-10,25,25,25,0 2019-09-06 22:09:05.077527 +0200 info main: #173 C MITPROHB rx msg h 964,-59,RT-BAT-C,5,86400,2,1,3830,3795,3830,-10,25,25,25,0 2019-09-06 22:09:05.193775 +0200 info main: #173 C MITPROHB rx msg h 964,-70,RT-BAT-C,5,86400,2,1,3830,3795,3830,-10,25,25,25,0 2019-09-06 22:09:13.190645 +0200 info main: #173 C MITPROHB rx msg h 964,-80,RT-BAT-C,5,86400,2,1,3830,3795,3830,-10,25,25,25,0 2019-09-06 22:09:22.077994 +0200 info main: #173 C MITPROHB rx msg h 964,-90,RT-BAT-C,5,86400,2,1,3830,3795,3830,-10,25,25,25,0 2019-09-06 22:09:54.590300 +0200 info main: #173 C MITPROHB rx msg h 964,-109,RT-BAT-C,5,86400,2,1,3830,3795,3830,-10,25,25,25,0 2019-09-06 22:11:10.127054 +0200 info main: #173 C MITPROHB rx msg h 964,-119,RT-BAT-C,5,86400,2,1,3830,3795,3830,-10,25,25,25,0 2019-09-06 22:11:16.794200 +0200 info main: #173 C MITPROHB rx msg h 964,-130,RT-BAT-C,5,86400,2,1,3830,3795,3830,-10,25,25,25,0 2019-09-06 22:11:22.455652 +0200 info main: #173 C MITPROHB rx msg h 964,-140,RT-BAT-C,5,86400,2,1,3830,3795,3830,-10,25,25,25,0 2019-09-06 22:12:49.423412 +0200 info main: #173 C MITPROHB rx msg h 964,-150,RT-BAT-C,5,86400,2,1,3830,3795,3830,-10,25,25,25,0 2019-09-06 22:12:49.442096 +0200 info main: #173 C MITPROHB rx msg h 964,-169,RT-BAT-C,5,86400,2,1,3830,3795,3830,-10,25,25,25,0 2019-09-06 22:12:49.461941 +0200 info main: #173 C MITPROHB rx msg h 964,-179,RT-BAT-C,5,86400,2,1,3830,3795,3830,-10,25,25,25,0 2019-09-06 22:14:39.828133 +0200 info main: #173 C MITPROHB rx msg h 964,-190,RT-BAT-C,5,86400,2,1,3830,3795,3830,-10,25,25,25,0 2019-09-06 22:14:39.858144 +0200 info main: #173 C MITPROHB rx msg h 964,-200,RT-BAT-C,5,86400,2,1,3830,3795,3830,-10,25,25,25,0 2019-09-06 22:14:52.020319 +0200 info main: #173 C MITPROHB rx msg h 964,-210,RT-BAT-C,5,86400,2,1,3830,3795,3830,-10,25,25,25,0 2019-09-06 22:14:54.452637 +0200 info main: #173 C MITPROHB rx msg h 964,-229,RT-BAT-C,5,86400,2,1,3830,3795,3830,-10,25,25,25,0 2019-09-06 22:15:12.613935 +0200 info main: #173 C MITPROHB rx msg h 964,-239,RT-BAT-C,5,86400,2,1,3830,3795,3830,-10,25,25,25,0 2019-09-06 22:15:35.223845 +0200 info main: #173 C MITPROHB rx msg h 964,-250,RT-BAT-C,5,86400,2,1,3830,3795,3830,-10,25,25,25,0 2019-09-06 22:16:09.255059 +0200 info main: #173 C MITPROHB rx msg h 964,-260,RT-BAT-C,5,86400,2,1,3830,3795,3830,-10,25,25,25,0 2019-09-06 22:17:31.919754 +0200 info main: #173 C MITPROHB rx msg h 964,-270,RT-BAT-C,5,86400,2,1,3830,3795,3830,-10,25,25,25,0 2019-09-06 22:19:23.366267 +0200 info main: #173 C MITPROHB rx msg h 964,-289,RT-BAT-C,5,86400,2,1,3830,3795,3830,-10,25,25,25,0 2019-09-06 22:21:57.344609 +0200 info main: #173 C MITPROHB rx msg h 964,-299,RT-BAT-C,5,86400,2,1,3830,3795,3830,-10,25,25,25,0 2019-09-06 22:23:40.082406 +0200 info main: #31 C MITPROHB rx msg h 964,-1027,RT-BAT-C,5,86400,2,1,3830,3795,3830,-10,25,25,25,0 2019-09-06 22:25:58.061883 +0200 info main: #31 C MITPROHB rx msg h 964,-1040,RT-BAT-C,5,86400,2,1,3830,3795,3830,-10,25,25,25,0
This shows the ticker was only run 299 times from 22:07:48 to 22:21:57.
After 22:21:57 the workaround was triggered and did a reconnect. Apparently during that network reinitialization of 103 seconds, the per second ticker was run 628 times.
That can't be catching up on the event queue, as that queue has only 20 slots. So something strange is going on here.
Any ideas?
Regards, Michael
Am 06.09.19 um 08:04 schrieb Michael Balzer:
Mark & anyone else running a V2 server,
as most cars don't send history records, this also needs the change to the server I just pushed, i.e. server version 2.4.2.
https://github.com/openvehicles/Open-Vehicle-Monitoring-System/commits/maste...
Regards, Michael
Am 05.09.19 um 19:55 schrieb Michael Balzer:
I've pushed the nasty workaround: the v2 server checks for no RX over 15 minutes, then restarts the network (wifi & modem) as configured for autostart.
Rolled out on my server in edge as 3.2.002-237-ge075f655.
Please test.
Regards, Michael
Am 05.09.19 um 01:58 schrieb Mark Webb-Johnson:
Mark, you can check your server logs for history messages with ridiculous time offsets:
[sddexter@ns27 server]$ cat log-20190903 | egrep "rx msg h [0-9]+,-[0-9]{4}" | wc -l 455283
I checked my logs and see 12 vehicles showing this. But, 2 only show this for a debugcrash log (which is expected, I guess, if the time is not synced at report time). I’ve got 4 cars with the offset > 10,000.
Regards, Mark.
On 4 Sep 2019, at 4:45 AM, Michael Balzer <dexter@expeedo.de <mailto:dexter@expeedo.de>> wrote:
Everyone,
I've pushed a change that needs some testing.
I had the issue myself now parking at a certain distance from my garage wifi AP, i.e. on the edge of "in", after wifi had been disconnected for some hours, and with the module still connected via modem. The wifi blob had been trying to connect to the AP for about two hours.
As seen before, the module saw no error, just the server responses and commands stopped coming in. I noticed the default interface was still "st1" despite wifi having been disconnected and modem connected. The DNS was also still configured for my wifi network, and the interface seemed to have an IP address -- but wasn't pingable from the wifi network.
A power cycle of the modem solved the issue without reboot. So the cause may be in the modem/ppp subsystem, or it may be related (in some weird way) to the default interface / DNS setup.
More tests showed the default interface again/still got set by the wifi blob itself at some point, overriding our modem prioritization. The events we didn't handle up to now were "sta.connected" and "sta.lostip", so I added these, and the bug didn't show up again since then. That doesn't mean anything, so we need to test this.
The default interface really shouldn't affect inbound packet routing of an established connection, but there always may be strange bugs lurking in those libs.
The change also reimplements the wifi signal strength reading, as the tests also showed that still wasn't working well using the CSI callback. It now seems to be much more reliable.
Please test & report. The single module will be hard to test, as the bug isn't reproducable easily, but you can still try if wifi / modem transitions work well.
Mark, you can check your server logs for history messages with ridiculous time offsets:
[sddexter@ns27 server]$ cat log-20190903 | egrep "rx msg h [0-9]+,-[0-9]{4}" | wc -l 455283
The bug now severely affects the V2 server performance, as the server is single threaded and doesn't scale very well to this kind of bulk data bursts, especially when coming from multiple modules in parallel. So we really need to solve this now. Slow reactions or connection drops from my server lately have been due to this bug. If this change doesn't solve it, we'll need to add some reboot trigger on "too many server v2 notification retransmissions" -- or maybe a modem power cycle will do, that wouldn't discard the data.
Thanks, Michael
Am 03.09.19 um 07:46 schrieb Mark Webb-Johnson: > No problem. We can hold. I won’t commit anything for the next few days (and agree to hold-off on Markos’s pull). Let me know when you are ready. > > Regards, Mark. > >> On 3 Sep 2019, at 1:58 AM, Michael Balzer <dexter@expeedo.de> wrote: >> >> Mark, please wait. >> >> I may just have found the cause for issue #241, or at least something I need to investigate before releasing. >> >> I need to dig into my logs first, and try something. >> >> Regards, >> Michael >> >> >> Am 02.09.19 um 12:23 schrieb Michael Balzer: >>> Nothing open from my side at the moment. >>> >>> I haven't had the time to look in to Markos pull request, but from a first check also think that's going too deep to be included in this release. >>> >>> Regards, >>> Michael >>> >>> >>> Am 02.09.19 um 04:15 schrieb Mark Webb-Johnson: >>>> I think it is well past time for a 3.2.003 release. Things seems table in edge (although some things only partially implemented). >>>> >>>> Anything people want to include at the last minute, or can we go ahead and build? >>>> >>>> Regards, Mark. >>>> >>>> _______________________________________________ >>>> OvmsDev mailing list >>>> OvmsDev@lists.openvehicles.com >>>> http://lists.openvehicles.com/mailman/listinfo/ovmsdev >> -- >> Michael Balzer * Helkenberger Weg 9 * D-58256 Ennepetal >> Fon 02333 / 833 5735 * Handy 0176 / 206 989 26 >> >> _______________________________________________ >> OvmsDev mailing list >> OvmsDev@lists.openvehicles.com >> http://lists.openvehicles.com/mailman/listinfo/ovmsdev > _______________________________________________ > OvmsDev mailing list > OvmsDev@lists.openvehicles.com > http://lists.openvehicles.com/mailman/listinfo/ovmsdev
-- Michael Balzer * Helkenberger Weg 9 * D-58256 Ennepetal Fon 02333 / 833 5735 * Handy 0176 / 206 989 26 _______________________________________________ OvmsDev mailing list OvmsDev@lists.openvehicles.com <mailto:OvmsDev@lists.openvehicles.com> http://lists.openvehicles.com/mailman/listinfo/ovmsdev
_______________________________________________ OvmsDev mailing list OvmsDev@lists.openvehicles.com http://lists.openvehicles.com/mailman/listinfo/ovmsdev
-- Michael Balzer * Helkenberger Weg 9 * D-58256 Ennepetal Fon 02333 / 833 5735 * Handy 0176 / 206 989 26
_______________________________________________ OvmsDev mailing list OvmsDev@lists.openvehicles.com http://lists.openvehicles.com/mailman/listinfo/ovmsdev
-- Michael Balzer * Helkenberger Weg 9 * D-58256 Ennepetal Fon 02333 / 833 5735 * Handy 0176 / 206 989 26
_______________________________________________ OvmsDev mailing list OvmsDev@lists.openvehicles.com http://lists.openvehicles.com/mailman/listinfo/ovmsdev
-- Michael Balzer * Helkenberger Weg 9 * D-58256 Ennepetal Fon 02333 / 833 5735 * Handy 0176 / 206 989 26
_______________________________________________ OvmsDev mailing list OvmsDev@lists.openvehicles.com http://lists.openvehicles.com/mailman/listinfo/ovmsdev
-- Michael Balzer * Helkenberger Weg 9 * D-58256 Ennepetal Fon 02333 / 833 5735 * Handy 0176 / 206 989 26
_______________________________________________ OvmsDev mailing list OvmsDev@lists.openvehicles.com http://lists.openvehicles.com/mailman/listinfo/ovmsdev
-- Michael Balzer * Helkenberger Weg 9 * D-58256 Ennepetal Fon 02333 / 833 5735 * Handy 0176 / 206 989 26
To enable CPU usage statistics, apply the changes to sdkconfig included. New history record: - "*-OVM-DebugTasks" v1: <taskcnt,totaltime> + per task: <tasknum,name,state,stack_now,stack_max,stack_total, heap_total,heap_32bit,heap_spi,runtime> Note: CPU core use percentage = runtime / totaltime
I’ve just noticed that this is enabled by default now (my production build has the sdkconfig updated, as per defaults). I am seeing 758 bytes of history record, every 5 minutes. About 218KB/day, or 654KB/month. Should this be opt-in? Regards, Mark.
On 8 Sep 2019, at 5:43 PM, Michael Balzer <dexter@expeedo.de> wrote:
I've pushed some modifications and improvements to (hopefully) fix the timer issue or at least be able to debug it.
Some sdkconfig changes are necessary.
The build including these updates is on my edge release as 3.2.002-258-g20ae554b.
Btw: the network restart strategy seems to mitigate issue #241; I've seen a major drop on record repetitions on my server since the rollout.
commit 99e4e48bdd40b7004c0976f51aba9e3da4ecab53
Module: add per task CPU usage statistics, add task stats history records
To enable CPU usage statistics, apply the changes to sdkconfig included. The CPU usage shown by the commands is calculated against the last task status retrieved (or system boot).
Command changes: - "module tasks" -- added CPU (core) usage in percent per task
New command: - "module tasks data" -- output task stats in history record form
New config: - [module] debug.tasks -- yes (default) = send task stats every 5 minutes
New history record: - "*-OVM-DebugTasks" v1: <taskcnt,totaltime> + per task: <tasknum,name,state,stack_now,stack_max,stack_total, heap_total,heap_32bit,heap_spi,runtime> Note: CPU core use percentage = runtime / totaltime
commit 950172c216a72beb4da0bc7a40a46995a6105955
Build config: default timer service task priority raised to 20
Background: the FreeRTOS timer service shall only be used for very short and non-blocking jobs. We delegate event processing to our events task, anything else in timers needs to run with high priority.
commit 31ac19d187480046c16356b80668de45cacbb83d
DukTape: add build config for task priority, default lowered to 3
Background: the DukTape garbage collector shall run on lower priority than tasks like SIMCOM & events
commit e0a44791fbcfb5a4e4cad24c9d1163b76e637b4f
Server V2: use esp_log_timestamp for timeout detection, add timeout config, limit data records & size per second
New config: - [server.v2] timeout.rx -- timeout in seconds, default 960
commit 684a4ce9525175a910040f0d1ca82ac212fbf5de
Notify: use esp_log_timestamp for creation time instead of monotonictime to harden against timer service starvation / ticker event drops
Regards, Michael
Am 07.09.19 um 10:55 schrieb Michael Balzer:
I think the RTOS timer service task starves. It's running on core 0 with priority 1.
Taks on core 0 sorted by priority:
Number of Tasks = 20 Stack: Now Max Total Heap 32-bit SPIRAM C# PRI 3FFC84A8 6 Blk ipc0 388 500 1024 7788 0 0 0 24 3FFC77F0 5 Blk OVMS CanRx 428 428 2048 3052 0 31844 0 23 3FFAFBF4 1 Blk esp_timer 400 656 4096 35928 644 25804 0 22 3FFD3240 19 Blk wifi 460 2716 3584 43720 0 20 0 22 3FFC03C4 2 Blk eventTask 448 1984 4608 104 0 0 0 20 3FFC8F14 17 Blk tiT 500 2308 3072 6552 0 0 * 18 3FFE14F0 26 Blk OVMS COrx 456 456 4096 0 0 0 0 7 3FFE19D4 27 Blk OVMS COwrk 476 476 3072 0 0 0 0 7 3FFCBC34 12 Blk Tmr Svc 352 928 3072 88 0 0 0 1 3FFE7708 23 Blk mdns 468 1396 4096 108 0 0 0 1
I don't think it's our CanRx, as that only fetches and queues CAN frames, the actual work is done by the listeners. The CO tasks only run for CANopen jobs, which are few for normal operation.
That leaves the system tasks, with main suspect -once again- the wifi blob.
We need to know how much CPU time the tasks actually use now. I think I saw some option for this in the FreeRTOS config.
Regards, Michael
Am 06.09.19 um 23:15 schrieb Michael Balzer:
The workaround is based on the monotonictime being updated per second, as do the history record offsets.
Apparently, that mechanism doesn't work reliably. That may be an indicator for some bigger underlying issue.
Example log excerpt:
2019-09-06 22:07:48.126919 +0200 info main: #173 C MITPROHB rx msg h 964,0,RT-BAT-C,5,86400,2,1,3830,3795,3830,-10,25,25,25,0 2019-09-06 22:09:03.089031 +0200 info main: #173 C MITPROHB rx msg h 964,-10,RT-BAT-C,5,86400,2,1,3830,3795,3830,-10,25,25,25,0 2019-09-06 22:09:05.041574 +0200 info main: #173 C MITPROHB rx msg h 964,-20,RT-BAT-C,5,86400,2,1,3830,3795,3830,-10,25,25,25,0 2019-09-06 22:09:05.052644 +0200 info main: #173 C MITPROHB rx msg h 964,-30,RT-BAT-C,5,86400,2,1,3830,3795,3830,-10,25,25,25,0 2019-09-06 22:09:05.063617 +0200 info main: #173 C MITPROHB rx msg h 964,-49,RT-BAT-C,5,86400,2,1,3830,3795,3830,-10,25,25,25,0 2019-09-06 22:09:05.077527 +0200 info main: #173 C MITPROHB rx msg h 964,-59,RT-BAT-C,5,86400,2,1,3830,3795,3830,-10,25,25,25,0 2019-09-06 22:09:05.193775 +0200 info main: #173 C MITPROHB rx msg h 964,-70,RT-BAT-C,5,86400,2,1,3830,3795,3830,-10,25,25,25,0 2019-09-06 22:09:13.190645 +0200 info main: #173 C MITPROHB rx msg h 964,-80,RT-BAT-C,5,86400,2,1,3830,3795,3830,-10,25,25,25,0 2019-09-06 22:09:22.077994 +0200 info main: #173 C MITPROHB rx msg h 964,-90,RT-BAT-C,5,86400,2,1,3830,3795,3830,-10,25,25,25,0 2019-09-06 22:09:54.590300 +0200 info main: #173 C MITPROHB rx msg h 964,-109,RT-BAT-C,5,86400,2,1,3830,3795,3830,-10,25,25,25,0 2019-09-06 22:11:10.127054 +0200 info main: #173 C MITPROHB rx msg h 964,-119,RT-BAT-C,5,86400,2,1,3830,3795,3830,-10,25,25,25,0 2019-09-06 22:11:16.794200 +0200 info main: #173 C MITPROHB rx msg h 964,-130,RT-BAT-C,5,86400,2,1,3830,3795,3830,-10,25,25,25,0 2019-09-06 22:11:22.455652 +0200 info main: #173 C MITPROHB rx msg h 964,-140,RT-BAT-C,5,86400,2,1,3830,3795,3830,-10,25,25,25,0 2019-09-06 22:12:49.423412 +0200 info main: #173 C MITPROHB rx msg h 964,-150,RT-BAT-C,5,86400,2,1,3830,3795,3830,-10,25,25,25,0 2019-09-06 22:12:49.442096 +0200 info main: #173 C MITPROHB rx msg h 964,-169,RT-BAT-C,5,86400,2,1,3830,3795,3830,-10,25,25,25,0 2019-09-06 22:12:49.461941 +0200 info main: #173 C MITPROHB rx msg h 964,-179,RT-BAT-C,5,86400,2,1,3830,3795,3830,-10,25,25,25,0 2019-09-06 22:14:39.828133 +0200 info main: #173 C MITPROHB rx msg h 964,-190,RT-BAT-C,5,86400,2,1,3830,3795,3830,-10,25,25,25,0 2019-09-06 22:14:39.858144 +0200 info main: #173 C MITPROHB rx msg h 964,-200,RT-BAT-C,5,86400,2,1,3830,3795,3830,-10,25,25,25,0 2019-09-06 22:14:52.020319 +0200 info main: #173 C MITPROHB rx msg h 964,-210,RT-BAT-C,5,86400,2,1,3830,3795,3830,-10,25,25,25,0 2019-09-06 22:14:54.452637 +0200 info main: #173 C MITPROHB rx msg h 964,-229,RT-BAT-C,5,86400,2,1,3830,3795,3830,-10,25,25,25,0 2019-09-06 22:15:12.613935 +0200 info main: #173 C MITPROHB rx msg h 964,-239,RT-BAT-C,5,86400,2,1,3830,3795,3830,-10,25,25,25,0 2019-09-06 22:15:35.223845 +0200 info main: #173 C MITPROHB rx msg h 964,-250,RT-BAT-C,5,86400,2,1,3830,3795,3830,-10,25,25,25,0 2019-09-06 22:16:09.255059 +0200 info main: #173 C MITPROHB rx msg h 964,-260,RT-BAT-C,5,86400,2,1,3830,3795,3830,-10,25,25,25,0 2019-09-06 22:17:31.919754 +0200 info main: #173 C MITPROHB rx msg h 964,-270,RT-BAT-C,5,86400,2,1,3830,3795,3830,-10,25,25,25,0 2019-09-06 22:19:23.366267 +0200 info main: #173 C MITPROHB rx msg h 964,-289,RT-BAT-C,5,86400,2,1,3830,3795,3830,-10,25,25,25,0 2019-09-06 22:21:57.344609 +0200 info main: #173 C MITPROHB rx msg h 964,-299,RT-BAT-C,5,86400,2,1,3830,3795,3830,-10,25,25,25,0 2019-09-06 22:23:40.082406 +0200 info main: #31 C MITPROHB rx msg h 964,-1027,RT-BAT-C,5,86400,2,1,3830,3795,3830,-10,25,25,25,0 2019-09-06 22:25:58.061883 +0200 info main: #31 C MITPROHB rx msg h 964,-1040,RT-BAT-C,5,86400,2,1,3830,3795,3830,-10,25,25,25,0
This shows the ticker was only run 299 times from 22:07:48 to 22:21:57.
After 22:21:57 the workaround was triggered and did a reconnect. Apparently during that network reinitialization of 103 seconds, the per second ticker was run 628 times.
That can't be catching up on the event queue, as that queue has only 20 slots. So something strange is going on here.
Any ideas?
Regards, Michael
Am 06.09.19 um 08:04 schrieb Michael Balzer:
Mark & anyone else running a V2 server,
as most cars don't send history records, this also needs the change to the server I just pushed, i.e. server version 2.4.2.
https://github.com/openvehicles/Open-Vehicle-Monitoring-System/commits/maste... <https://github.com/openvehicles/Open-Vehicle-Monitoring-System/commits/master>
Regards, Michael
Am 05.09.19 um 19:55 schrieb Michael Balzer:
I've pushed the nasty workaround: the v2 server checks for no RX over 15 minutes, then restarts the network (wifi & modem) as configured for autostart.
Rolled out on my server in edge as 3.2.002-237-ge075f655.
Please test.
Regards, Michael
Am 05.09.19 um 01:58 schrieb Mark Webb-Johnson:
> Mark, you can check your server logs for history messages with ridiculous time offsets: > [sddexter@ns27 server]$ cat log-20190903 | egrep "rx msg h [0-9]+,-[0-9]{4}" | wc -l > 455283
I checked my logs and see 12 vehicles showing this. But, 2 only show this for a debugcrash log (which is expected, I guess, if the time is not synced at report time). I’ve got 4 cars with the offset > 10,000.
Regards, Mark.
> On 4 Sep 2019, at 4:45 AM, Michael Balzer <dexter@expeedo.de <mailto:dexter@expeedo.de>> wrote: > > Everyone, > > I've pushed a change that needs some testing. > > I had the issue myself now parking at a certain distance from my garage wifi AP, i.e. on the edge of "in", after wifi had been disconnected for some hours, and with the module still connected via modem. The wifi blob had been trying to connect to the AP for about two hours. > > As seen before, the module saw no error, just the server responses and commands stopped coming in. I noticed the default interface was still "st1" despite wifi having been disconnected and modem connected. The DNS was also still configured for my wifi network, and the interface seemed to have an IP address -- but wasn't pingable from the wifi network. > > A power cycle of the modem solved the issue without reboot. So the cause may be in the modem/ppp subsystem, or it may be related (in some weird way) to the default interface / DNS setup. > > More tests showed the default interface again/still got set by the wifi blob itself at some point, overriding our modem prioritization. The events we didn't handle up to now were "sta.connected" and "sta.lostip", so I added these, and the bug didn't show up again since then. That doesn't mean anything, so we need to test this. > > The default interface really shouldn't affect inbound packet routing of an established connection, but there always may be strange bugs lurking in those libs. > > The change also reimplements the wifi signal strength reading, as the tests also showed that still wasn't working well using the CSI callback. It now seems to be much more reliable. > > Please test & report. The single module will be hard to test, as the bug isn't reproducable easily, but you can still try if wifi / modem transitions work well. > > Mark, you can check your server logs for history messages with ridiculous time offsets: > [sddexter@ns27 server]$ cat log-20190903 | egrep "rx msg h [0-9]+,-[0-9]{4}" | wc -l > 455283 > The bug now severely affects the V2 server performance, as the server is single threaded and doesn't scale very well to this kind of bulk data bursts, especially when coming from multiple modules in parallel. So we really need to solve this now. Slow reactions or connection drops from my server lately have been due to this bug. If this change doesn't solve it, we'll need to add some reboot trigger on "too many server v2 notification retransmissions" -- or maybe a modem power cycle will do, that wouldn't discard the data. > > Thanks, > Michael > > > Am 03.09.19 um 07:46 schrieb Mark Webb-Johnson: >> No problem. We can hold. I won’t commit anything for the next few days (and agree to hold-off on Markos’s pull). Let me know when you are ready. >> >> Regards, Mark. >> >>> On 3 Sep 2019, at 1:58 AM, Michael Balzer <dexter@expeedo.de> <mailto:dexter@expeedo.de> wrote: >>> >>> Mark, please wait. >>> >>> I may just have found the cause for issue #241, or at least something I need to investigate before releasing. >>> >>> I need to dig into my logs first, and try something. >>> >>> Regards, >>> Michael >>> >>> >>> Am 02.09.19 um 12:23 schrieb Michael Balzer: >>>> Nothing open from my side at the moment. >>>> >>>> I haven't had the time to look in to Markos pull request, but from a first check also think that's going too deep to be included in this release. >>>> >>>> Regards, >>>> Michael >>>> >>>> >>>> Am 02.09.19 um 04:15 schrieb Mark Webb-Johnson: >>>>> I think it is well past time for a 3.2.003 release. Things seems table in edge (although some things only partially implemented). >>>>> >>>>> Anything people want to include at the last minute, or can we go ahead and build? >>>>> >>>>> Regards, Mark. >>>>> >>>>> _______________________________________________ >>>>> OvmsDev mailing list >>>>> OvmsDev@lists.openvehicles.com <mailto:OvmsDev@lists.openvehicles.com> >>>>> http://lists.openvehicles.com/mailman/listinfo/ovmsdev <http://lists.openvehicles.com/mailman/listinfo/ovmsdev> >>> -- >>> Michael Balzer * Helkenberger Weg 9 * D-58256 Ennepetal >>> Fon 02333 / 833 5735 * Handy 0176 / 206 989 26 >>> >>> _______________________________________________ >>> OvmsDev mailing list >>> OvmsDev@lists.openvehicles.com <mailto:OvmsDev@lists.openvehicles.com> >>> http://lists.openvehicles.com/mailman/listinfo/ovmsdev <http://lists.openvehicles.com/mailman/listinfo/ovmsdev> >> _______________________________________________ >> OvmsDev mailing list >> OvmsDev@lists.openvehicles.com <mailto:OvmsDev@lists.openvehicles.com> >> http://lists.openvehicles.com/mailman/listinfo/ovmsdev <http://lists.openvehicles.com/mailman/listinfo/ovmsdev> > > -- > Michael Balzer * Helkenberger Weg 9 * D-58256 Ennepetal > Fon 02333 / 833 5735 * Handy 0176 / 206 989 26 > _______________________________________________ > OvmsDev mailing list > OvmsDev@lists.openvehicles.com <mailto:OvmsDev@lists.openvehicles.com> > http://lists.openvehicles.com/mailman/listinfo/ovmsdev <http://lists.openvehicles.com/mailman/listinfo/ovmsdev>
_______________________________________________ OvmsDev mailing list OvmsDev@lists.openvehicles.com <mailto:OvmsDev@lists.openvehicles.com> http://lists.openvehicles.com/mailman/listinfo/ovmsdev <http://lists.openvehicles.com/mailman/listinfo/ovmsdev>
-- Michael Balzer * Helkenberger Weg 9 * D-58256 Ennepetal Fon 02333 / 833 5735 * Handy 0176 / 206 989 26
_______________________________________________ OvmsDev mailing list OvmsDev@lists.openvehicles.com <mailto:OvmsDev@lists.openvehicles.com> http://lists.openvehicles.com/mailman/listinfo/ovmsdev <http://lists.openvehicles.com/mailman/listinfo/ovmsdev>
-- Michael Balzer * Helkenberger Weg 9 * D-58256 Ennepetal Fon 02333 / 833 5735 * Handy 0176 / 206 989 26 _______________________________________________ OvmsDev mailing list OvmsDev@lists.openvehicles.com http://lists.openvehicles.com/mailman/listinfo/ovmsdev
That's 6.55MB/month, unless you have unusually short months! :-) In what space is that data stored? A log written to SD? That's not likely to fill up the SD card too fast, but what happens if no SD card is installed? -- Steve On Thu, 19 Sep 2019, Mark Webb-Johnson wrote:
To enable CPU usage statistics, apply the changes to sdkconfig included. New history record: - "*-OVM-DebugTasks" v1: <taskcnt,totaltime> + per task: <tasknum,name,state,stack_now,stack_max,stack_total, heap_total,heap_32bit,heap_spi,runtime> Note: CPU core use percentage = runtime / totaltime
I’ve just noticed that this is enabled by default now (my production build has the sdkconfig updated, as per defaults).
I am seeing 758 bytes of history record, every 5 minutes. About 218KB/day, or 654KB/month.
Should this be opt-in?
Regards, Mark.
On 8 Sep 2019, at 5:43 PM, Michael Balzer <dexter@expeedo.de> wrote:
I've pushed some modifications and improvements to (hopefully) fix the timer issue or at least be able to debug it.
Some sdkconfig changes are necessary.
The build including these updates is on my edge release as 3.2.002-258-g20ae554b.
Btw: the network restart strategy seems to mitigate issue #241; I've seen a major drop on record repetitions on my server since the rollout.
commit 99e4e48bdd40b7004c0976f51aba9e3da4ecab53
Module: add per task CPU usage statistics, add task stats history records
To enable CPU usage statistics, apply the changes to sdkconfig included. The CPU usage shown by the commands is calculated against the last task status retrieved (or system boot).
Command changes: - "module tasks" -- added CPU (core) usage in percent per task
New command: - "module tasks data" -- output task stats in history record form
New config: - [module] debug.tasks -- yes (default) = send task stats every 5 minutes
New history record: - "*-OVM-DebugTasks" v1: <taskcnt,totaltime> + per task: <tasknum,name,state,stack_now,stack_max,stack_total, heap_total,heap_32bit,heap_spi,runtime> Note: CPU core use percentage = runtime / totaltime
commit 950172c216a72beb4da0bc7a40a46995a6105955
Build config: default timer service task priority raised to 20
Background: the FreeRTOS timer service shall only be used for very short and non-blocking jobs. We delegate event processing to our events task, anything else in timers needs to run with high priority.
commit 31ac19d187480046c16356b80668de45cacbb83d
DukTape: add build config for task priority, default lowered to 3
Background: the DukTape garbage collector shall run on lower priority than tasks like SIMCOM & events
commit e0a44791fbcfb5a4e4cad24c9d1163b76e637b4f
Server V2: use esp_log_timestamp for timeout detection, add timeout config, limit data records & size per second
New config: - [server.v2] timeout.rx -- timeout in seconds, default 960
commit 684a4ce9525175a910040f0d1ca82ac212fbf5de
Notify: use esp_log_timestamp for creation time instead of monotonictime to harden against timer service starvation / ticker event drops
Regards, Michael
Am 07.09.19 um 10:55 schrieb Michael Balzer:
I think the RTOS timer service task starves. It's running on core 0 with priority 1.
Taks on core 0 sorted by priority:
Number of Tasks = 20 Stack: Now Max Total Heap 32-bit SPIRAM C# PRI 3FFC84A8 6 Blk ipc0 388 500 1024 7788 0 0 0 24 3FFC77F0 5 Blk OVMS CanRx 428 428 2048 3052 0 31844 0 23 3FFAFBF4 1 Blk esp_timer 400 656 4096 35928 644 25804 0 22 3FFD3240 19 Blk wifi 460 2716 3584 43720 0 20 0 22 3FFC03C4 2 Blk eventTask 448 1984 4608 104 0 0 0 20 3FFC8F14 17 Blk tiT 500 2308 3072 6552 0 0 * 18 3FFE14F0 26 Blk OVMS COrx 456 456 4096 0 0 0 0 7 3FFE19D4 27 Blk OVMS COwrk 476 476 3072 0 0 0 0 7 3FFCBC34 12 Blk Tmr Svc 352 928 3072 88 0 0 0 1 3FFE7708 23 Blk mdns 468 1396 4096 108 0 0 0 1
I don't think it's our CanRx, as that only fetches and queues CAN frames, the actual work is done by the listeners. The CO tasks only run for CANopen jobs, which are few for normal operation.
That leaves the system tasks, with main suspect -once again- the wifi blob.
We need to know how much CPU time the tasks actually use now. I think I saw some option for this in the FreeRTOS config.
Regards, Michael
Am 06.09.19 um 23:15 schrieb Michael Balzer:
The workaround is based on the monotonictime being updated per second, as do the history record offsets.
Apparently, that mechanism doesn't work reliably. That may be an indicator for some bigger underlying issue.
Example log excerpt:
2019-09-06 22:07:48.126919 +0200 info main: #173 C MITPROHB rx msg h 964,0,RT-BAT-C,5,86400,2,1,3830,3795,3830,-10,25,25,25,0 2019-09-06 22:09:03.089031 +0200 info main: #173 C MITPROHB rx msg h 964,-10,RT-BAT-C,5,86400,2,1,3830,3795,3830,-10,25,25,25,0 2019-09-06 22:09:05.041574 +0200 info main: #173 C MITPROHB rx msg h 964,-20,RT-BAT-C,5,86400,2,1,3830,3795,3830,-10,25,25,25,0 2019-09-06 22:09:05.052644 +0200 info main: #173 C MITPROHB rx msg h 964,-30,RT-BAT-C,5,86400,2,1,3830,3795,3830,-10,25,25,25,0 2019-09-06 22:09:05.063617 +0200 info main: #173 C MITPROHB rx msg h 964,-49,RT-BAT-C,5,86400,2,1,3830,3795,3830,-10,25,25,25,0 2019-09-06 22:09:05.077527 +0200 info main: #173 C MITPROHB rx msg h 964,-59,RT-BAT-C,5,86400,2,1,3830,3795,3830,-10,25,25,25,0 2019-09-06 22:09:05.193775 +0200 info main: #173 C MITPROHB rx msg h 964,-70,RT-BAT-C,5,86400,2,1,3830,3795,3830,-10,25,25,25,0 2019-09-06 22:09:13.190645 +0200 info main: #173 C MITPROHB rx msg h 964,-80,RT-BAT-C,5,86400,2,1,3830,3795,3830,-10,25,25,25,0 2019-09-06 22:09:22.077994 +0200 info main: #173 C MITPROHB rx msg h 964,-90,RT-BAT-C,5,86400,2,1,3830,3795,3830,-10,25,25,25,0 2019-09-06 22:09:54.590300 +0200 info main: #173 C MITPROHB rx msg h 964,-109,RT-BAT-C,5,86400,2,1,3830,3795,3830,-10,25,25,25,0 2019-09-06 22:11:10.127054 +0200 info main: #173 C MITPROHB rx msg h 964,-119,RT-BAT-C,5,86400,2,1,3830,3795,3830,-10,25,25,25,0 2019-09-06 22:11:16.794200 +0200 info main: #173 C MITPROHB rx msg h 964,-130,RT-BAT-C,5,86400,2,1,3830,3795,3830,-10,25,25,25,0 2019-09-06 22:11:22.455652 +0200 info main: #173 C MITPROHB rx msg h 964,-140,RT-BAT-C,5,86400,2,1,3830,3795,3830,-10,25,25,25,0 2019-09-06 22:12:49.423412 +0200 info main: #173 C MITPROHB rx msg h 964,-150,RT-BAT-C,5,86400,2,1,3830,3795,3830,-10,25,25,25,0 2019-09-06 22:12:49.442096 +0200 info main: #173 C MITPROHB rx msg h 964,-169,RT-BAT-C,5,86400,2,1,3830,3795,3830,-10,25,25,25,0 2019-09-06 22:12:49.461941 +0200 info main: #173 C MITPROHB rx msg h 964,-179,RT-BAT-C,5,86400,2,1,3830,3795,3830,-10,25,25,25,0 2019-09-06 22:14:39.828133 +0200 info main: #173 C MITPROHB rx msg h 964,-190,RT-BAT-C,5,86400,2,1,3830,3795,3830,-10,25,25,25,0 2019-09-06 22:14:39.858144 +0200 info main: #173 C MITPROHB rx msg h 964,-200,RT-BAT-C,5,86400,2,1,3830,3795,3830,-10,25,25,25,0 2019-09-06 22:14:52.020319 +0200 info main: #173 C MITPROHB rx msg h 964,-210,RT-BAT-C,5,86400,2,1,3830,3795,3830,-10,25,25,25,0 2019-09-06 22:14:54.452637 +0200 info main: #173 C MITPROHB rx msg h 964,-229,RT-BAT-C,5,86400,2,1,3830,3795,3830,-10,25,25,25,0 2019-09-06 22:15:12.613935 +0200 info main: #173 C MITPROHB rx msg h 964,-239,RT-BAT-C,5,86400,2,1,3830,3795,3830,-10,25,25,25,0 2019-09-06 22:15:35.223845 +0200 info main: #173 C MITPROHB rx msg h 964,-250,RT-BAT-C,5,86400,2,1,3830,3795,3830,-10,25,25,25,0 2019-09-06 22:16:09.255059 +0200 info main: #173 C MITPROHB rx msg h 964,-260,RT-BAT-C,5,86400,2,1,3830,3795,3830,-10,25,25,25,0 2019-09-06 22:17:31.919754 +0200 info main: #173 C MITPROHB rx msg h 964,-270,RT-BAT-C,5,86400,2,1,3830,3795,3830,-10,25,25,25,0 2019-09-06 22:19:23.366267 +0200 info main: #173 C MITPROHB rx msg h 964,-289,RT-BAT-C,5,86400,2,1,3830,3795,3830,-10,25,25,25,0 2019-09-06 22:21:57.344609 +0200 info main: #173 C MITPROHB rx msg h 964,-299,RT-BAT-C,5,86400,2,1,3830,3795,3830,-10,25,25,25,0 2019-09-06 22:23:40.082406 +0200 info main: #31 C MITPROHB rx msg h 964,-1027,RT-BAT-C,5,86400,2,1,3830,3795,3830,-10,25,25,25,0 2019-09-06 22:25:58.061883 +0200 info main: #31 C MITPROHB rx msg h 964,-1040,RT-BAT-C,5,86400,2,1,3830,3795,3830,-10,25,25,25,0
This shows the ticker was only run 299 times from 22:07:48 to 22:21:57.
After 22:21:57 the workaround was triggered and did a reconnect. Apparently during that network reinitialization of 103 seconds, the per second ticker was run 628 times.
That can't be catching up on the event queue, as that queue has only 20 slots. So something strange is going on here.
Any ideas?
Regards, Michael
Am 06.09.19 um 08:04 schrieb Michael Balzer:
Mark & anyone else running a V2 server,
as most cars don't send history records, this also needs the change to the server I just pushed, i.e. server version 2.4.2.
https://github.com/openvehicles/Open-Vehicle-Monitoring-System/commits/maste... <https://github.com/openvehicles/Open-Vehicle-Monitoring-System/commits/master>
Regards, Michael
Am 05.09.19 um 19:55 schrieb Michael Balzer:
I've pushed the nasty workaround: the v2 server checks for no RX over 15 minutes, then restarts the network (wifi & modem) as configured for autostart.
Rolled out on my server in edge as 3.2.002-237-ge075f655.
Please test.
Regards, Michael
Am 05.09.19 um 01:58 schrieb Mark Webb-Johnson: >> Mark, you can check your server logs for history messages with ridiculous time offsets: >> [sddexter@ns27 server]$ cat log-20190903 | egrep "rx msg h [0-9]+,-[0-9]{4}" | wc -l >> 455283 > > I checked my logs and see 12 vehicles showing this. But, 2 only show this for a debugcrash log (which is expected, I guess, if the time is not synced at report time). I’ve got 4 cars with the offset > 10,000. > > Regards, Mark. > >> On 4 Sep 2019, at 4:45 AM, Michael Balzer <dexter@expeedo.de <mailto:dexter@expeedo.de>> wrote: >> >> Everyone, >> >> I've pushed a change that needs some testing. >> >> I had the issue myself now parking at a certain distance from my garage wifi AP, i.e. on the edge of "in", after wifi had been disconnected for some hours, and with the module still connected via modem. The wifi blob had been trying to connect to the AP for about two hours. >> >> As seen before, the module saw no error, just the server responses and commands stopped coming in. I noticed the default interface was still "st1" despite wifi having been disconnected and modem connected. The DNS was also still configured for my wifi network, and the interface seemed to have an IP address -- but wasn't pingable from the wifi network. >> >> A power cycle of the modem solved the issue without reboot. So the cause may be in the modem/ppp subsystem, or it may be related (in some weird way) to the default interface / DNS setup. >> >> More tests showed the default interface again/still got set by the wifi blob itself at some point, overriding our modem prioritization. The events we didn't handle up to now were "sta.connected" and "sta.lostip", so I added these, and the bug didn't show up again since then. That doesn't mean anything, so we need to test this. >> >> The default interface really shouldn't affect inbound packet routing of an established connection, but there always may be strange bugs lurking in those libs. >> >> The change also reimplements the wifi signal strength reading, as the tests also showed that still wasn't working well using the CSI callback. It now seems to be much more reliable. >> >> Please test & report. The single module will be hard to test, as the bug isn't reproducable easily, but you can still try if wifi / modem transitions work well. >> >> Mark, you can check your server logs for history messages with ridiculous time offsets: >> [sddexter@ns27 server]$ cat log-20190903 | egrep "rx msg h [0-9]+,-[0-9]{4}" | wc -l >> 455283 >> The bug now severely affects the V2 server performance, as the server is single threaded and doesn't scale very well to this kind of bulk data bursts, especially when coming from multiple modules in parallel. So we really need to solve this now. Slow reactions or connection drops from my server lately have been due to this bug. If this change doesn't solve it, we'll need to add some reboot trigger on "too many server v2 notification retransmissions" -- or maybe a modem power cycle will do, that wouldn't discard the data. >> >> Thanks, >> Michael >> >> >> Am 03.09.19 um 07:46 schrieb Mark Webb-Johnson: >>> No problem. We can hold. I won’t commit anything for the next few days (and agree to hold-off on Markos’s pull). Let me know when you are ready. >>> >>> Regards, Mark. >>> >>>> On 3 Sep 2019, at 1:58 AM, Michael Balzer <dexter@expeedo.de> <mailto:dexter@expeedo.de> wrote: >>>> >>>> Mark, please wait. >>>> >>>> I may just have found the cause for issue #241, or at least something I need to investigate before releasing. >>>> >>>> I need to dig into my logs first, and try something. >>>> >>>> Regards, >>>> Michael >>>> >>>> >>>> Am 02.09.19 um 12:23 schrieb Michael Balzer: >>>>> Nothing open from my side at the moment. >>>>> >>>>> I haven't had the time to look in to Markos pull request, but from a first check also think that's going too deep to be included in this release. >>>>> >>>>> Regards, >>>>> Michael >>>>> >>>>> >>>>> Am 02.09.19 um 04:15 schrieb Mark Webb-Johnson: >>>>>> I think it is well past time for a 3.2.003 release. Things seems table in edge (although some things only partially implemented). >>>>>> >>>>>> Anything people want to include at the last minute, or can we go ahead and build? >>>>>> >>>>>> Regards, Mark. >>>>>> >>>>>> _______________________________________________ >>>>>> OvmsDev mailing list >>>>>> OvmsDev@lists.openvehicles.com <mailto:OvmsDev@lists.openvehicles.com> >>>>>> http://lists.openvehicles.com/mailman/listinfo/ovmsdev <http://lists.openvehicles.com/mailman/listinfo/ovmsdev> >>>> -- >>>> Michael Balzer * Helkenberger Weg 9 * D-58256 Ennepetal >>>> Fon 02333 / 833 5735 * Handy 0176 / 206 989 26 >>>> >>>> _______________________________________________ >>>> OvmsDev mailing list >>>> OvmsDev@lists.openvehicles.com <mailto:OvmsDev@lists.openvehicles.com> >>>> http://lists.openvehicles.com/mailman/listinfo/ovmsdev <http://lists.openvehicles.com/mailman/listinfo/ovmsdev> >>> _______________________________________________ >>> OvmsDev mailing list >>> OvmsDev@lists.openvehicles.com <mailto:OvmsDev@lists.openvehicles.com> >>> http://lists.openvehicles.com/mailman/listinfo/ovmsdev <http://lists.openvehicles.com/mailman/listinfo/ovmsdev> >> >> -- >> Michael Balzer * Helkenberger Weg 9 * D-58256 Ennepetal >> Fon 02333 / 833 5735 * Handy 0176 / 206 989 26 >> _______________________________________________ >> OvmsDev mailing list >> OvmsDev@lists.openvehicles.com <mailto:OvmsDev@lists.openvehicles.com> >> http://lists.openvehicles.com/mailman/listinfo/ovmsdev <http://lists.openvehicles.com/mailman/listinfo/ovmsdev> > > > > _______________________________________________ > OvmsDev mailing list > OvmsDev@lists.openvehicles.com <mailto:OvmsDev@lists.openvehicles.com> > http://lists.openvehicles.com/mailman/listinfo/ovmsdev <http://lists.openvehicles.com/mailman/listinfo/ovmsdev>
-- Michael Balzer * Helkenberger Weg 9 * D-58256 Ennepetal Fon 02333 / 833 5735 * Handy 0176 / 206 989 26
_______________________________________________ OvmsDev mailing list OvmsDev@lists.openvehicles.com <mailto:OvmsDev@lists.openvehicles.com> http://lists.openvehicles.com/mailman/listinfo/ovmsdev <http://lists.openvehicles.com/mailman/listinfo/ovmsdev>
-- Michael Balzer * Helkenberger Weg 9 * D-58256 Ennepetal Fon 02333 / 833 5735 * Handy 0176 / 206 989 26 _______________________________________________ OvmsDev mailing list OvmsDev@lists.openvehicles.com http://lists.openvehicles.com/mailman/listinfo/ovmsdev
Yep: 758 bytes * (86400 / 300) * 30 = 6.5MB/month That is going over data (not SD). Presumably cellular data for a large portion of the time. I think we need to default this to OFF, and make a 3.2.004 to avoid this becoming an issue. Regards, Mark.
On 19 Sep 2019, at 2:04 PM, Stephen Casner <casner@acm.org> wrote:
That's 6.55MB/month, unless you have unusually short months! :-)
In what space is that data stored? A log written to SD? That's not likely to fill up the SD card too fast, but what happens if no SD card is installed?
-- Steve
On Thu, 19 Sep 2019, Mark Webb-Johnson wrote:
To enable CPU usage statistics, apply the changes to sdkconfig included. New history record: - "*-OVM-DebugTasks" v1: <taskcnt,totaltime> + per task: <tasknum,name,state,stack_now,stack_max,stack_total, heap_total,heap_32bit,heap_spi,runtime> Note: CPU core use percentage = runtime / totaltime
I’ve just noticed that this is enabled by default now (my production build has the sdkconfig updated, as per defaults).
I am seeing 758 bytes of history record, every 5 minutes. About 218KB/day, or 654KB/month.
Should this be opt-in?
Regards, Mark.
On 8 Sep 2019, at 5:43 PM, Michael Balzer <dexter@expeedo.de> wrote:
I've pushed some modifications and improvements to (hopefully) fix the timer issue or at least be able to debug it.
Some sdkconfig changes are necessary.
The build including these updates is on my edge release as 3.2.002-258-g20ae554b.
Btw: the network restart strategy seems to mitigate issue #241; I've seen a major drop on record repetitions on my server since the rollout.
commit 99e4e48bdd40b7004c0976f51aba9e3da4ecab53
Module: add per task CPU usage statistics, add task stats history records
To enable CPU usage statistics, apply the changes to sdkconfig included. The CPU usage shown by the commands is calculated against the last task status retrieved (or system boot).
Command changes: - "module tasks" -- added CPU (core) usage in percent per task
New command: - "module tasks data" -- output task stats in history record form
New config: - [module] debug.tasks -- yes (default) = send task stats every 5 minutes
New history record: - "*-OVM-DebugTasks" v1: <taskcnt,totaltime> + per task: <tasknum,name,state,stack_now,stack_max,stack_total, heap_total,heap_32bit,heap_spi,runtime> Note: CPU core use percentage = runtime / totaltime
commit 950172c216a72beb4da0bc7a40a46995a6105955
Build config: default timer service task priority raised to 20
Background: the FreeRTOS timer service shall only be used for very short and non-blocking jobs. We delegate event processing to our events task, anything else in timers needs to run with high priority.
commit 31ac19d187480046c16356b80668de45cacbb83d
DukTape: add build config for task priority, default lowered to 3
Background: the DukTape garbage collector shall run on lower priority than tasks like SIMCOM & events
commit e0a44791fbcfb5a4e4cad24c9d1163b76e637b4f
Server V2: use esp_log_timestamp for timeout detection, add timeout config, limit data records & size per second
New config: - [server.v2] timeout.rx -- timeout in seconds, default 960
commit 684a4ce9525175a910040f0d1ca82ac212fbf5de
Notify: use esp_log_timestamp for creation time instead of monotonictime to harden against timer service starvation / ticker event drops
Regards, Michael
Am 07.09.19 um 10:55 schrieb Michael Balzer:
I think the RTOS timer service task starves. It's running on core 0 with priority 1.
Taks on core 0 sorted by priority:
Number of Tasks = 20 Stack: Now Max Total Heap 32-bit SPIRAM C# PRI 3FFC84A8 6 Blk ipc0 388 500 1024 7788 0 0 0 24 3FFC77F0 5 Blk OVMS CanRx 428 428 2048 3052 0 31844 0 23 3FFAFBF4 1 Blk esp_timer 400 656 4096 35928 644 25804 0 22 3FFD3240 19 Blk wifi 460 2716 3584 43720 0 20 0 22 3FFC03C4 2 Blk eventTask 448 1984 4608 104 0 0 0 20 3FFC8F14 17 Blk tiT 500 2308 3072 6552 0 0 * 18 3FFE14F0 26 Blk OVMS COrx 456 456 4096 0 0 0 0 7 3FFE19D4 27 Blk OVMS COwrk 476 476 3072 0 0 0 0 7 3FFCBC34 12 Blk Tmr Svc 352 928 3072 88 0 0 0 1 3FFE7708 23 Blk mdns 468 1396 4096 108 0 0 0 1
I don't think it's our CanRx, as that only fetches and queues CAN frames, the actual work is done by the listeners. The CO tasks only run for CANopen jobs, which are few for normal operation.
That leaves the system tasks, with main suspect -once again- the wifi blob.
We need to know how much CPU time the tasks actually use now. I think I saw some option for this in the FreeRTOS config.
Regards, Michael
Am 06.09.19 um 23:15 schrieb Michael Balzer:
The workaround is based on the monotonictime being updated per second, as do the history record offsets.
Apparently, that mechanism doesn't work reliably. That may be an indicator for some bigger underlying issue.
Example log excerpt:
2019-09-06 22:07:48.126919 +0200 info main: #173 C MITPROHB rx msg h 964,0,RT-BAT-C,5,86400,2,1,3830,3795,3830,-10,25,25,25,0 2019-09-06 22:09:03.089031 +0200 info main: #173 C MITPROHB rx msg h 964,-10,RT-BAT-C,5,86400,2,1,3830,3795,3830,-10,25,25,25,0 2019-09-06 22:09:05.041574 +0200 info main: #173 C MITPROHB rx msg h 964,-20,RT-BAT-C,5,86400,2,1,3830,3795,3830,-10,25,25,25,0 2019-09-06 22:09:05.052644 +0200 info main: #173 C MITPROHB rx msg h 964,-30,RT-BAT-C,5,86400,2,1,3830,3795,3830,-10,25,25,25,0 2019-09-06 22:09:05.063617 +0200 info main: #173 C MITPROHB rx msg h 964,-49,RT-BAT-C,5,86400,2,1,3830,3795,3830,-10,25,25,25,0 2019-09-06 22:09:05.077527 +0200 info main: #173 C MITPROHB rx msg h 964,-59,RT-BAT-C,5,86400,2,1,3830,3795,3830,-10,25,25,25,0 2019-09-06 22:09:05.193775 +0200 info main: #173 C MITPROHB rx msg h 964,-70,RT-BAT-C,5,86400,2,1,3830,3795,3830,-10,25,25,25,0 2019-09-06 22:09:13.190645 +0200 info main: #173 C MITPROHB rx msg h 964,-80,RT-BAT-C,5,86400,2,1,3830,3795,3830,-10,25,25,25,0 2019-09-06 22:09:22.077994 +0200 info main: #173 C MITPROHB rx msg h 964,-90,RT-BAT-C,5,86400,2,1,3830,3795,3830,-10,25,25,25,0 2019-09-06 22:09:54.590300 +0200 info main: #173 C MITPROHB rx msg h 964,-109,RT-BAT-C,5,86400,2,1,3830,3795,3830,-10,25,25,25,0 2019-09-06 22:11:10.127054 +0200 info main: #173 C MITPROHB rx msg h 964,-119,RT-BAT-C,5,86400,2,1,3830,3795,3830,-10,25,25,25,0 2019-09-06 22:11:16.794200 +0200 info main: #173 C MITPROHB rx msg h 964,-130,RT-BAT-C,5,86400,2,1,3830,3795,3830,-10,25,25,25,0 2019-09-06 22:11:22.455652 +0200 info main: #173 C MITPROHB rx msg h 964,-140,RT-BAT-C,5,86400,2,1,3830,3795,3830,-10,25,25,25,0 2019-09-06 22:12:49.423412 +0200 info main: #173 C MITPROHB rx msg h 964,-150,RT-BAT-C,5,86400,2,1,3830,3795,3830,-10,25,25,25,0 2019-09-06 22:12:49.442096 +0200 info main: #173 C MITPROHB rx msg h 964,-169,RT-BAT-C,5,86400,2,1,3830,3795,3830,-10,25,25,25,0 2019-09-06 22:12:49.461941 +0200 info main: #173 C MITPROHB rx msg h 964,-179,RT-BAT-C,5,86400,2,1,3830,3795,3830,-10,25,25,25,0 2019-09-06 22:14:39.828133 +0200 info main: #173 C MITPROHB rx msg h 964,-190,RT-BAT-C,5,86400,2,1,3830,3795,3830,-10,25,25,25,0 2019-09-06 22:14:39.858144 +0200 info main: #173 C MITPROHB rx msg h 964,-200,RT-BAT-C,5,86400,2,1,3830,3795,3830,-10,25,25,25,0 2019-09-06 22:14:52.020319 +0200 info main: #173 C MITPROHB rx msg h 964,-210,RT-BAT-C,5,86400,2,1,3830,3795,3830,-10,25,25,25,0 2019-09-06 22:14:54.452637 +0200 info main: #173 C MITPROHB rx msg h 964,-229,RT-BAT-C,5,86400,2,1,3830,3795,3830,-10,25,25,25,0 2019-09-06 22:15:12.613935 +0200 info main: #173 C MITPROHB rx msg h 964,-239,RT-BAT-C,5,86400,2,1,3830,3795,3830,-10,25,25,25,0 2019-09-06 22:15:35.223845 +0200 info main: #173 C MITPROHB rx msg h 964,-250,RT-BAT-C,5,86400,2,1,3830,3795,3830,-10,25,25,25,0 2019-09-06 22:16:09.255059 +0200 info main: #173 C MITPROHB rx msg h 964,-260,RT-BAT-C,5,86400,2,1,3830,3795,3830,-10,25,25,25,0 2019-09-06 22:17:31.919754 +0200 info main: #173 C MITPROHB rx msg h 964,-270,RT-BAT-C,5,86400,2,1,3830,3795,3830,-10,25,25,25,0 2019-09-06 22:19:23.366267 +0200 info main: #173 C MITPROHB rx msg h 964,-289,RT-BAT-C,5,86400,2,1,3830,3795,3830,-10,25,25,25,0 2019-09-06 22:21:57.344609 +0200 info main: #173 C MITPROHB rx msg h 964,-299,RT-BAT-C,5,86400,2,1,3830,3795,3830,-10,25,25,25,0 2019-09-06 22:23:40.082406 +0200 info main: #31 C MITPROHB rx msg h 964,-1027,RT-BAT-C,5,86400,2,1,3830,3795,3830,-10,25,25,25,0 2019-09-06 22:25:58.061883 +0200 info main: #31 C MITPROHB rx msg h 964,-1040,RT-BAT-C,5,86400,2,1,3830,3795,3830,-10,25,25,25,0
This shows the ticker was only run 299 times from 22:07:48 to 22:21:57.
After 22:21:57 the workaround was triggered and did a reconnect. Apparently during that network reinitialization of 103 seconds, the per second ticker was run 628 times.
That can't be catching up on the event queue, as that queue has only 20 slots. So something strange is going on here.
Any ideas?
Regards, Michael
Am 06.09.19 um 08:04 schrieb Michael Balzer:
Mark & anyone else running a V2 server,
as most cars don't send history records, this also needs the change to the server I just pushed, i.e. server version 2.4.2.
https://github.com/openvehicles/Open-Vehicle-Monitoring-System/commits/maste... <https://github.com/openvehicles/Open-Vehicle-Monitoring-System/commits/master>
Regards, Michael
Am 05.09.19 um 19:55 schrieb Michael Balzer: > I've pushed the nasty workaround: the v2 server checks for no RX over 15 minutes, then restarts the network (wifi & modem) as configured for autostart. > > Rolled out on my server in edge as 3.2.002-237-ge075f655. > > Please test. > > Regards, > Michael > > > Am 05.09.19 um 01:58 schrieb Mark Webb-Johnson: >>> Mark, you can check your server logs for history messages with ridiculous time offsets: >>> [sddexter@ns27 server]$ cat log-20190903 | egrep "rx msg h [0-9]+,-[0-9]{4}" | wc -l >>> 455283 >> >> I checked my logs and see 12 vehicles showing this. But, 2 only show this for a debugcrash log (which is expected, I guess, if the time is not synced at report time). I’ve got 4 cars with the offset > 10,000. >> >> Regards, Mark. >> >>> On 4 Sep 2019, at 4:45 AM, Michael Balzer <dexter@expeedo.de <mailto:dexter@expeedo.de>> wrote: >>> >>> Everyone, >>> >>> I've pushed a change that needs some testing. >>> >>> I had the issue myself now parking at a certain distance from my garage wifi AP, i.e. on the edge of "in", after wifi had been disconnected for some hours, and with the module still connected via modem. The wifi blob had been trying to connect to the AP for about two hours. >>> >>> As seen before, the module saw no error, just the server responses and commands stopped coming in. I noticed the default interface was still "st1" despite wifi having been disconnected and modem connected. The DNS was also still configured for my wifi network, and the interface seemed to have an IP address -- but wasn't pingable from the wifi network. >>> >>> A power cycle of the modem solved the issue without reboot. So the cause may be in the modem/ppp subsystem, or it may be related (in some weird way) to the default interface / DNS setup. >>> >>> More tests showed the default interface again/still got set by the wifi blob itself at some point, overriding our modem prioritization. The events we didn't handle up to now were "sta.connected" and "sta.lostip", so I added these, and the bug didn't show up again since then. That doesn't mean anything, so we need to test this. >>> >>> The default interface really shouldn't affect inbound packet routing of an established connection, but there always may be strange bugs lurking in those libs. >>> >>> The change also reimplements the wifi signal strength reading, as the tests also showed that still wasn't working well using the CSI callback. It now seems to be much more reliable. >>> >>> Please test & report. The single module will be hard to test, as the bug isn't reproducable easily, but you can still try if wifi / modem transitions work well. >>> >>> Mark, you can check your server logs for history messages with ridiculous time offsets: >>> [sddexter@ns27 server]$ cat log-20190903 | egrep "rx msg h [0-9]+,-[0-9]{4}" | wc -l >>> 455283 >>> The bug now severely affects the V2 server performance, as the server is single threaded and doesn't scale very well to this kind of bulk data bursts, especially when coming from multiple modules in parallel. So we really need to solve this now. Slow reactions or connection drops from my server lately have been due to this bug. If this change doesn't solve it, we'll need to add some reboot trigger on "too many server v2 notification retransmissions" -- or maybe a modem power cycle will do, that wouldn't discard the data. >>> >>> Thanks, >>> Michael >>> >>> >>> Am 03.09.19 um 07:46 schrieb Mark Webb-Johnson: >>>> No problem. We can hold. I won’t commit anything for the next few days (and agree to hold-off on Markos’s pull). Let me know when you are ready. >>>> >>>> Regards, Mark. >>>> >>>>> On 3 Sep 2019, at 1:58 AM, Michael Balzer <dexter@expeedo.de> <mailto:dexter@expeedo.de> wrote: >>>>> >>>>> Mark, please wait. >>>>> >>>>> I may just have found the cause for issue #241, or at least something I need to investigate before releasing. >>>>> >>>>> I need to dig into my logs first, and try something. >>>>> >>>>> Regards, >>>>> Michael >>>>> >>>>> >>>>> Am 02.09.19 um 12:23 schrieb Michael Balzer: >>>>>> Nothing open from my side at the moment. >>>>>> >>>>>> I haven't had the time to look in to Markos pull request, but from a first check also think that's going too deep to be included in this release. >>>>>> >>>>>> Regards, >>>>>> Michael >>>>>> >>>>>> >>>>>> Am 02.09.19 um 04:15 schrieb Mark Webb-Johnson: >>>>>>> I think it is well past time for a 3.2.003 release. Things seems table in edge (although some things only partially implemented). >>>>>>> >>>>>>> Anything people want to include at the last minute, or can we go ahead and build? >>>>>>> >>>>>>> Regards, Mark. >>>>>>> >>>>>>> _______________________________________________ >>>>>>> OvmsDev mailing list >>>>>>> OvmsDev@lists.openvehicles.com <mailto:OvmsDev@lists.openvehicles.com> >>>>>>> http://lists.openvehicles.com/mailman/listinfo/ovmsdev <http://lists.openvehicles.com/mailman/listinfo/ovmsdev> >>>>> -- >>>>> Michael Balzer * Helkenberger Weg 9 * D-58256 Ennepetal >>>>> Fon 02333 / 833 5735 * Handy 0176 / 206 989 26 >>>>> >>>>> _______________________________________________ >>>>> OvmsDev mailing list >>>>> OvmsDev@lists.openvehicles.com <mailto:OvmsDev@lists.openvehicles.com> >>>>> http://lists.openvehicles.com/mailman/listinfo/ovmsdev <http://lists.openvehicles.com/mailman/listinfo/ovmsdev> >>>> _______________________________________________ >>>> OvmsDev mailing list >>>> OvmsDev@lists.openvehicles.com <mailto:OvmsDev@lists.openvehicles.com> >>>> http://lists.openvehicles.com/mailman/listinfo/ovmsdev <http://lists.openvehicles.com/mailman/listinfo/ovmsdev> >>> >>> -- >>> Michael Balzer * Helkenberger Weg 9 * D-58256 Ennepetal >>> Fon 02333 / 833 5735 * Handy 0176 / 206 989 26 >>> _______________________________________________ >>> OvmsDev mailing list >>> OvmsDev@lists.openvehicles.com <mailto:OvmsDev@lists.openvehicles.com> >>> http://lists.openvehicles.com/mailman/listinfo/ovmsdev <http://lists.openvehicles.com/mailman/listinfo/ovmsdev> >> >> >> >> _______________________________________________ >> OvmsDev mailing list >> OvmsDev@lists.openvehicles.com <mailto:OvmsDev@lists.openvehicles.com> >> http://lists.openvehicles.com/mailman/listinfo/ovmsdev <http://lists.openvehicles.com/mailman/listinfo/ovmsdev> > > -- > Michael Balzer * Helkenberger Weg 9 * D-58256 Ennepetal > Fon 02333 / 833 5735 * Handy 0176 / 206 989 26 > > > _______________________________________________ > OvmsDev mailing list > OvmsDev@lists.openvehicles.com <mailto:OvmsDev@lists.openvehicles.com> > http://lists.openvehicles.com/mailman/listinfo/ovmsdev <http://lists.openvehicles.com/mailman/listinfo/ovmsdev>
-- Michael Balzer * Helkenberger Weg 9 * D-58256 Ennepetal Fon 02333 / 833 5735 * Handy 0176 / 206 989 26
_______________________________________________ OvmsDev mailing list OvmsDev@lists.openvehicles.com <mailto:OvmsDev@lists.openvehicles.com> http://lists.openvehicles.com/mailman/listinfo/ovmsdev <http://lists.openvehicles.com/mailman/listinfo/ovmsdev>
-- Michael Balzer * Helkenberger Weg 9 * D-58256 Ennepetal Fon 02333 / 833 5735 * Handy 0176 / 206 989 26 _______________________________________________ OvmsDev mailing list OvmsDev@lists.openvehicles.com http://lists.openvehicles.com/mailman/listinfo/ovmsdev
_______________________________________________ OvmsDev mailing list OvmsDev@lists.openvehicles.com http://lists.openvehicles.com/mailman/listinfo/ovmsdev
Sorry, I didn't think about this being an issue elsewhere -- german data plans typically start at minimum 100 MB/month flat (that's my current plan at 3 € / month). No need for a new release, it can be turned off OTA by issueing config set module debug.tasks no Regards, Michael Am 19.09.19 um 09:08 schrieb Mark Webb-Johnson:
Yep:
758 bytes * (86400 / 300) * 30 = 6.5MB/month
That is going over data (not SD). Presumably cellular data for a large portion of the time.
I think we need to default this to OFF, and make a 3.2.004 to avoid this becoming an issue.
Regards, Mark.
On 19 Sep 2019, at 2:04 PM, Stephen Casner <casner@acm.org <mailto:casner@acm.org>> wrote:
That's 6.55MB/month, unless you have unusually short months! :-)
In what space is that data stored? A log written to SD? That's not likely to fill up the SD card too fast, but what happens if no SD card is installed?
-- Steve
On Thu, 19 Sep 2019, Mark Webb-Johnson wrote:
To enable CPU usage statistics, apply the changes to sdkconfig included. New history record: - "*-OVM-DebugTasks" v1: <taskcnt,totaltime> + per task: <tasknum,name,state,stack_now,stack_max,stack_total, heap_total,heap_32bit,heap_spi,runtime> Note: CPU core use percentage = runtime / totaltime
I’ve just noticed that this is enabled by default now (my production build has the sdkconfig updated, as per defaults).
I am seeing 758 bytes of history record, every 5 minutes. About 218KB/day, or 654KB/month.
Should this be opt-in?
Regards, Mark.
On 8 Sep 2019, at 5:43 PM, Michael Balzer <dexter@expeedo.de <mailto:dexter@expeedo.de>> wrote:
I've pushed some modifications and improvements to (hopefully) fix the timer issue or at least be able to debug it.
Some sdkconfig changes are necessary.
The build including these updates is on my edge release as 3.2.002-258-g20ae554b.
Btw: the network restart strategy seems to mitigate issue #241; I've seen a major drop on record repetitions on my server since the rollout.
commit 99e4e48bdd40b7004c0976f51aba9e3da4ecab53
Module: add per task CPU usage statistics, add task stats history records
To enable CPU usage statistics, apply the changes to sdkconfig included. The CPU usage shown by the commands is calculated against the last task status retrieved (or system boot).
Command changes: - "module tasks" -- added CPU (core) usage in percent per task
New command: - "module tasks data" -- output task stats in history record form
New config: - [module] debug.tasks -- yes (default) = send task stats every 5 minutes
New history record: - "*-OVM-DebugTasks" v1: <taskcnt,totaltime> + per task: <tasknum,name,state,stack_now,stack_max,stack_total, heap_total,heap_32bit,heap_spi,runtime> Note: CPU core use percentage = runtime / totaltime
commit 950172c216a72beb4da0bc7a40a46995a6105955
Build config: default timer service task priority raised to 20
Background: the FreeRTOS timer service shall only be used for very short and non-blocking jobs. We delegate event processing to our events task, anything else in timers needs to run with high priority.
commit 31ac19d187480046c16356b80668de45cacbb83d
DukTape: add build config for task priority, default lowered to 3
Background: the DukTape garbage collector shall run on lower priority than tasks like SIMCOM & events
commit e0a44791fbcfb5a4e4cad24c9d1163b76e637b4f
Server V2: use esp_log_timestamp for timeout detection, add timeout config, limit data records & size per second
New config: - [server.v2] timeout.rx -- timeout in seconds, default 960
commit 684a4ce9525175a910040f0d1ca82ac212fbf5de
Notify: use esp_log_timestamp for creation time instead of monotonictime to harden against timer service starvation / ticker event drops
Regards, Michael
Am 07.09.19 um 10:55 schrieb Michael Balzer:
I think the RTOS timer service task starves. It's running on core 0 with priority 1.
Taks on core 0 sorted by priority:
Number of Tasks = 20 Stack: Now Max Total Heap 32-bit SPIRAM C# PRI 3FFC84A8 6 Blk ipc0 388 500 1024 7788 0 0 0 24 3FFC77F0 5 Blk OVMS CanRx 428 428 2048 3052 0 31844 0 23 3FFAFBF4 1 Blk esp_timer 400 656 4096 35928 644 25804 0 22 3FFD3240 19 Blk wifi 460 2716 3584 43720 0 20 0 22 3FFC03C4 2 Blk eventTask 448 1984 4608 104 0 0 0 20 3FFC8F14 17 Blk tiT 500 2308 3072 6552 0 0 * 18 3FFE14F0 26 Blk OVMS COrx 456 456 4096 0 0 0 0 7 3FFE19D4 27 Blk OVMS COwrk 476 476 3072 0 0 0 0 7 3FFCBC34 12 Blk Tmr Svc 352 928 3072 88 0 0 0 1 3FFE7708 23 Blk mdns 468 1396 4096 108 0 0 0 1
I don't think it's our CanRx, as that only fetches and queues CAN frames, the actual work is done by the listeners. The CO tasks only run for CANopen jobs, which are few for normal operation.
That leaves the system tasks, with main suspect -once again- the wifi blob.
We need to know how much CPU time the tasks actually use now. I think I saw some option for this in the FreeRTOS config.
Regards, Michael
Am 06.09.19 um 23:15 schrieb Michael Balzer:
The workaround is based on the monotonictime being updated per second, as do the history record offsets.
Apparently, that mechanism doesn't work reliably. That may be an indicator for some bigger underlying issue.
Example log excerpt:
2019-09-06 22:07:48.126919 +0200 info main: #173 C MITPROHB rx msg h 964,0,RT-BAT-C,5,86400,2,1,3830,3795,3830,-10,25,25,25,0 2019-09-06 22:09:03.089031 +0200 info main: #173 C MITPROHB rx msg h 964,-10,RT-BAT-C,5,86400,2,1,3830,3795,3830,-10,25,25,25,0 2019-09-06 22:09:05.041574 +0200 info main: #173 C MITPROHB rx msg h 964,-20,RT-BAT-C,5,86400,2,1,3830,3795,3830,-10,25,25,25,0 2019-09-06 22:09:05.052644 +0200 info main: #173 C MITPROHB rx msg h 964,-30,RT-BAT-C,5,86400,2,1,3830,3795,3830,-10,25,25,25,0 2019-09-06 22:09:05.063617 +0200 info main: #173 C MITPROHB rx msg h 964,-49,RT-BAT-C,5,86400,2,1,3830,3795,3830,-10,25,25,25,0 2019-09-06 22:09:05.077527 +0200 info main: #173 C MITPROHB rx msg h 964,-59,RT-BAT-C,5,86400,2,1,3830,3795,3830,-10,25,25,25,0 2019-09-06 22:09:05.193775 +0200 info main: #173 C MITPROHB rx msg h 964,-70,RT-BAT-C,5,86400,2,1,3830,3795,3830,-10,25,25,25,0 2019-09-06 22:09:13.190645 +0200 info main: #173 C MITPROHB rx msg h 964,-80,RT-BAT-C,5,86400,2,1,3830,3795,3830,-10,25,25,25,0 2019-09-06 22:09:22.077994 +0200 info main: #173 C MITPROHB rx msg h 964,-90,RT-BAT-C,5,86400,2,1,3830,3795,3830,-10,25,25,25,0 2019-09-06 22:09:54.590300 +0200 info main: #173 C MITPROHB rx msg h 964,-109,RT-BAT-C,5,86400,2,1,3830,3795,3830,-10,25,25,25,0 2019-09-06 22:11:10.127054 +0200 info main: #173 C MITPROHB rx msg h 964,-119,RT-BAT-C,5,86400,2,1,3830,3795,3830,-10,25,25,25,0 2019-09-06 22:11:16.794200 +0200 info main: #173 C MITPROHB rx msg h 964,-130,RT-BAT-C,5,86400,2,1,3830,3795,3830,-10,25,25,25,0 2019-09-06 22:11:22.455652 +0200 info main: #173 C MITPROHB rx msg h 964,-140,RT-BAT-C,5,86400,2,1,3830,3795,3830,-10,25,25,25,0 2019-09-06 22:12:49.423412 +0200 info main: #173 C MITPROHB rx msg h 964,-150,RT-BAT-C,5,86400,2,1,3830,3795,3830,-10,25,25,25,0 2019-09-06 22:12:49.442096 +0200 info main: #173 C MITPROHB rx msg h 964,-169,RT-BAT-C,5,86400,2,1,3830,3795,3830,-10,25,25,25,0 2019-09-06 22:12:49.461941 +0200 info main: #173 C MITPROHB rx msg h 964,-179,RT-BAT-C,5,86400,2,1,3830,3795,3830,-10,25,25,25,0 2019-09-06 22:14:39.828133 +0200 info main: #173 C MITPROHB rx msg h 964,-190,RT-BAT-C,5,86400,2,1,3830,3795,3830,-10,25,25,25,0 2019-09-06 22:14:39.858144 +0200 info main: #173 C MITPROHB rx msg h 964,-200,RT-BAT-C,5,86400,2,1,3830,3795,3830,-10,25,25,25,0 2019-09-06 22:14:52.020319 +0200 info main: #173 C MITPROHB rx msg h 964,-210,RT-BAT-C,5,86400,2,1,3830,3795,3830,-10,25,25,25,0 2019-09-06 22:14:54.452637 +0200 info main: #173 C MITPROHB rx msg h 964,-229,RT-BAT-C,5,86400,2,1,3830,3795,3830,-10,25,25,25,0 2019-09-06 22:15:12.613935 +0200 info main: #173 C MITPROHB rx msg h 964,-239,RT-BAT-C,5,86400,2,1,3830,3795,3830,-10,25,25,25,0 2019-09-06 22:15:35.223845 +0200 info main: #173 C MITPROHB rx msg h 964,-250,RT-BAT-C,5,86400,2,1,3830,3795,3830,-10,25,25,25,0 2019-09-06 22:16:09.255059 +0200 info main: #173 C MITPROHB rx msg h 964,-260,RT-BAT-C,5,86400,2,1,3830,3795,3830,-10,25,25,25,0 2019-09-06 22:17:31.919754 +0200 info main: #173 C MITPROHB rx msg h 964,-270,RT-BAT-C,5,86400,2,1,3830,3795,3830,-10,25,25,25,0 2019-09-06 22:19:23.366267 +0200 info main: #173 C MITPROHB rx msg h 964,-289,RT-BAT-C,5,86400,2,1,3830,3795,3830,-10,25,25,25,0 2019-09-06 22:21:57.344609 +0200 info main: #173 C MITPROHB rx msg h 964,-299,RT-BAT-C,5,86400,2,1,3830,3795,3830,-10,25,25,25,0 2019-09-06 22:23:40.082406 +0200 info main: #31 C MITPROHB rx msg h 964,-1027,RT-BAT-C,5,86400,2,1,3830,3795,3830,-10,25,25,25,0 2019-09-06 22:25:58.061883 +0200 info main: #31 C MITPROHB rx msg h 964,-1040,RT-BAT-C,5,86400,2,1,3830,3795,3830,-10,25,25,25,0
This shows the ticker was only run 299 times from 22:07:48 to 22:21:57.
After 22:21:57 the workaround was triggered and did a reconnect. Apparently during that network reinitialization of 103 seconds, the per second ticker was run 628 times.
That can't be catching up on the event queue, as that queue has only 20 slots. So something strange is going on here.
Any ideas?
Regards, Michael
Am 06.09.19 um 08:04 schrieb Michael Balzer: > Mark & anyone else running a V2 server, > > as most cars don't send history records, this also needs the change to the server I just pushed, i.e. server version 2.4.2. > > https://github.com/openvehicles/Open-Vehicle-Monitoring-System/commits/maste... > <https://github.com/openvehicles/Open-Vehicle-Monitoring-System/commits/master> > > Regards, > Michael > > > Am 05.09.19 um 19:55 schrieb Michael Balzer: >> I've pushed the nasty workaround: the v2 server checks for no RX over 15 minutes, then restarts the network (wifi & modem) as >> configured for autostart. >> >> Rolled out on my server in edge as 3.2.002-237-ge075f655. >> >> Please test. >> >> Regards, >> Michael >> >> >> Am 05.09.19 um 01:58 schrieb Mark Webb-Johnson: >>>> Mark, you can check your server logs for history messages with ridiculous time offsets: >>>> [sddexter@ns27 server]$ cat log-20190903 | egrep "rx msg h [0-9]+,-[0-9]{4}" | wc -l >>>> 455283 >>> >>> I checked my logs and see 12 vehicles showing this. But, 2 only show this for a debugcrash log (which is expected, I guess, if the >>> time is not synced at report time). I’ve got 4 cars with the offset > 10,000. >>> >>> Regards, Mark. >>> >>>> On 4 Sep 2019, at 4:45 AM, Michael Balzer <dexter@expeedo.de <mailto:dexter@expeedo.de> <mailto:dexter@expeedo.de>> wrote: >>>> >>>> Everyone, >>>> >>>> I've pushed a change that needs some testing. >>>> >>>> I had the issue myself now parking at a certain distance from my garage wifi AP, i.e. on the edge of "in", after wifi had been >>>> disconnected for some hours, and with the module still connected via modem. The wifi blob had been trying to connect to the AP for >>>> about two hours. >>>> >>>> As seen before, the module saw no error, just the server responses and commands stopped coming in. I noticed the default interface >>>> was still "st1" despite wifi having been disconnected and modem connected. The DNS was also still configured for my wifi network, and >>>> the interface seemed to have an IP address -- but wasn't pingable from the wifi network. >>>> >>>> A power cycle of the modem solved the issue without reboot. So the cause may be in the modem/ppp subsystem, or it may be related (in >>>> some weird way) to the default interface / DNS setup. >>>> >>>> More tests showed the default interface again/still got set by the wifi blob itself at some point, overriding our modem >>>> prioritization. The events we didn't handle up to now were "sta.connected" and "sta.lostip", so I added these, and the bug didn't >>>> show up again since then. That doesn't mean anything, so we need to test this. >>>> >>>> The default interface really shouldn't affect inbound packet routing of an established connection, but there always may be strange >>>> bugs lurking in those libs. >>>> >>>> The change also reimplements the wifi signal strength reading, as the tests also showed that still wasn't working well using the CSI >>>> callback. It now seems to be much more reliable. >>>> >>>> Please test & report. The single module will be hard to test, as the bug isn't reproducable easily, but you can still try if wifi / >>>> modem transitions work well. >>>> >>>> Mark, you can check your server logs for history messages with ridiculous time offsets: >>>> [sddexter@ns27 server]$ cat log-20190903 | egrep "rx msg h [0-9]+,-[0-9]{4}" | wc -l >>>> 455283 >>>> The bug now severely affects the V2 server performance, as the server is single threaded and doesn't scale very well to this kind of >>>> bulk data bursts, especially when coming from multiple modules in parallel. So we really need to solve this now. Slow reactions or >>>> connection drops from my server lately have been due to this bug. If this change doesn't solve it, we'll need to add some reboot >>>> trigger on "too many server v2 notification retransmissions" -- or maybe a modem power cycle will do, that wouldn't discard the data. >>>> >>>> Thanks, >>>> Michael >>>> >>>> >>>> Am 03.09.19 um 07:46 schrieb Mark Webb-Johnson: >>>>> No problem. We can hold. I won’t commit anything for the next few days (and agree to hold-off on Markos’s pull). Let me know when >>>>> you are ready. >>>>> >>>>> Regards, Mark. >>>>> >>>>>> On 3 Sep 2019, at 1:58 AM, Michael Balzer <dexter@expeedo.de <mailto:dexter@expeedo.de>> <mailto:dexter@expeedo.de> wrote: >>>>>> >>>>>> Mark, please wait. >>>>>> >>>>>> I may just have found the cause for issue #241, or at least something I need to investigate before releasing. >>>>>> >>>>>> I need to dig into my logs first, and try something. >>>>>> >>>>>> Regards, >>>>>> Michael >>>>>> >>>>>> >>>>>> Am 02.09.19 um 12:23 schrieb Michael Balzer: >>>>>>> Nothing open from my side at the moment. >>>>>>> >>>>>>> I haven't had the time to look in to Markos pull request, but from a first check also think that's going too deep to be included >>>>>>> in this release. >>>>>>> >>>>>>> Regards, >>>>>>> Michael >>>>>>> >>>>>>> >>>>>>> Am 02.09.19 um 04:15 schrieb Mark Webb-Johnson: >>>>>>>> I think it is well past time for a 3.2.003 release. Things seems table in edge (although some things only partially implemented). >>>>>>>> >>>>>>>> Anything people want to include at the last minute, or can we go ahead and build? >>>>>>>> >>>>>>>> Regards, Mark. >>>>>>>>
-- Michael Balzer * Helkenberger Weg 9 * D-58256 Ennepetal Fon 02333 / 833 5735 * Handy 0176 / 206 989 26
I’m just worried about the users who don’t know about this new feature. When they deploy this version, they suddenly start sending 6MB of data a month up to us. I think the ‘fix’ is just to change ovms_module.c: MyConfig.GetParamValueBool("module", "debug.tasks", true) to MyConfig.GetParamValueBool("module", "debug.tasks", false) That would then only submit these logs for those that explicitly turn it on? Regards, Mark.
On 19 Sep 2019, at 3:23 PM, Michael Balzer <dexter@expeedo.de> wrote:
Sorry, I didn't think about this being an issue elsewhere -- german data plans typically start at minimum 100 MB/month flat (that's my current plan at 3 € / month).
No need for a new release, it can be turned off OTA by issueing
config set module debug.tasks no
Regards, Michael
Am 19.09.19 um 09:08 schrieb Mark Webb-Johnson:
Yep:
758 bytes * (86400 / 300) * 30 = 6.5MB/month
That is going over data (not SD). Presumably cellular data for a large portion of the time.
I think we need to default this to OFF, and make a 3.2.004 to avoid this becoming an issue.
Regards, Mark.
On 19 Sep 2019, at 2:04 PM, Stephen Casner <casner@acm.org <mailto:casner@acm.org>> wrote:
That's 6.55MB/month, unless you have unusually short months! :-)
In what space is that data stored? A log written to SD? That's not likely to fill up the SD card too fast, but what happens if no SD card is installed?
-- Steve
On Thu, 19 Sep 2019, Mark Webb-Johnson wrote:
To enable CPU usage statistics, apply the changes to sdkconfig included. New history record: - "*-OVM-DebugTasks" v1: <taskcnt,totaltime> + per task: <tasknum,name,state,stack_now,stack_max,stack_total, heap_total,heap_32bit,heap_spi,runtime> Note: CPU core use percentage = runtime / totaltime
I’ve just noticed that this is enabled by default now (my production build has the sdkconfig updated, as per defaults).
I am seeing 758 bytes of history record, every 5 minutes. About 218KB/day, or 654KB/month.
Should this be opt-in?
Regards, Mark.
On 8 Sep 2019, at 5:43 PM, Michael Balzer <dexter@expeedo.de <mailto:dexter@expeedo.de>> wrote:
I've pushed some modifications and improvements to (hopefully) fix the timer issue or at least be able to debug it.
Some sdkconfig changes are necessary.
The build including these updates is on my edge release as 3.2.002-258-g20ae554b.
Btw: the network restart strategy seems to mitigate issue #241; I've seen a major drop on record repetitions on my server since the rollout.
commit 99e4e48bdd40b7004c0976f51aba9e3da4ecab53
Module: add per task CPU usage statistics, add task stats history records
To enable CPU usage statistics, apply the changes to sdkconfig included. The CPU usage shown by the commands is calculated against the last task status retrieved (or system boot).
Command changes: - "module tasks" -- added CPU (core) usage in percent per task
New command: - "module tasks data" -- output task stats in history record form
New config: - [module] debug.tasks -- yes (default) = send task stats every 5 minutes
New history record: - "*-OVM-DebugTasks" v1: <taskcnt,totaltime> + per task: <tasknum,name,state,stack_now,stack_max,stack_total, heap_total,heap_32bit,heap_spi,runtime> Note: CPU core use percentage = runtime / totaltime
commit 950172c216a72beb4da0bc7a40a46995a6105955
Build config: default timer service task priority raised to 20
Background: the FreeRTOS timer service shall only be used for very short and non-blocking jobs. We delegate event processing to our events task, anything else in timers needs to run with high priority.
commit 31ac19d187480046c16356b80668de45cacbb83d
DukTape: add build config for task priority, default lowered to 3
Background: the DukTape garbage collector shall run on lower priority than tasks like SIMCOM & events
commit e0a44791fbcfb5a4e4cad24c9d1163b76e637b4f
Server V2: use esp_log_timestamp for timeout detection, add timeout config, limit data records & size per second
New config: - [server.v2] timeout.rx -- timeout in seconds, default 960
commit 684a4ce9525175a910040f0d1ca82ac212fbf5de
Notify: use esp_log_timestamp for creation time instead of monotonictime to harden against timer service starvation / ticker event drops
Regards, Michael
Am 07.09.19 um 10:55 schrieb Michael Balzer:
I think the RTOS timer service task starves. It's running on core 0 with priority 1.
Taks on core 0 sorted by priority:
Number of Tasks = 20 Stack: Now Max Total Heap 32-bit SPIRAM C# PRI 3FFC84A8 6 Blk ipc0 388 500 1024 7788 0 0 0 24 3FFC77F0 5 Blk OVMS CanRx 428 428 2048 3052 0 31844 0 23 3FFAFBF4 1 Blk esp_timer 400 656 4096 35928 644 25804 0 22 3FFD3240 19 Blk wifi 460 2716 3584 43720 0 20 0 22 3FFC03C4 2 Blk eventTask 448 1984 4608 104 0 0 0 20 3FFC8F14 17 Blk tiT 500 2308 3072 6552 0 0 * 18 3FFE14F0 26 Blk OVMS COrx 456 456 4096 0 0 0 0 7 3FFE19D4 27 Blk OVMS COwrk 476 476 3072 0 0 0 0 7 3FFCBC34 12 Blk Tmr Svc 352 928 3072 88 0 0 0 1 3FFE7708 23 Blk mdns 468 1396 4096 108 0 0 0 1
I don't think it's our CanRx, as that only fetches and queues CAN frames, the actual work is done by the listeners. The CO tasks only run for CANopen jobs, which are few for normal operation.
That leaves the system tasks, with main suspect -once again- the wifi blob.
We need to know how much CPU time the tasks actually use now. I think I saw some option for this in the FreeRTOS config.
Regards, Michael
Am 06.09.19 um 23:15 schrieb Michael Balzer: > The workaround is based on the monotonictime being updated per second, as do the history record offsets. > > Apparently, that mechanism doesn't work reliably. That may be an indicator for some bigger underlying issue. > > Example log excerpt: > > 2019-09-06 22:07:48.126919 +0200 info main: #173 C MITPROHB rx msg h 964,0,RT-BAT-C,5,86400,2,1,3830,3795,3830,-10,25,25,25,0 > 2019-09-06 22:09:03.089031 +0200 info main: #173 C MITPROHB rx msg h 964,-10,RT-BAT-C,5,86400,2,1,3830,3795,3830,-10,25,25,25,0 > 2019-09-06 22:09:05.041574 +0200 info main: #173 C MITPROHB rx msg h 964,-20,RT-BAT-C,5,86400,2,1,3830,3795,3830,-10,25,25,25,0 > 2019-09-06 22:09:05.052644 +0200 info main: #173 C MITPROHB rx msg h 964,-30,RT-BAT-C,5,86400,2,1,3830,3795,3830,-10,25,25,25,0 > 2019-09-06 22:09:05.063617 +0200 info main: #173 C MITPROHB rx msg h 964,-49,RT-BAT-C,5,86400,2,1,3830,3795,3830,-10,25,25,25,0 > 2019-09-06 22:09:05.077527 +0200 info main: #173 C MITPROHB rx msg h 964,-59,RT-BAT-C,5,86400,2,1,3830,3795,3830,-10,25,25,25,0 > 2019-09-06 22:09:05.193775 +0200 info main: #173 C MITPROHB rx msg h 964,-70,RT-BAT-C,5,86400,2,1,3830,3795,3830,-10,25,25,25,0 > 2019-09-06 22:09:13.190645 +0200 info main: #173 C MITPROHB rx msg h 964,-80,RT-BAT-C,5,86400,2,1,3830,3795,3830,-10,25,25,25,0 > 2019-09-06 22:09:22.077994 +0200 info main: #173 C MITPROHB rx msg h 964,-90,RT-BAT-C,5,86400,2,1,3830,3795,3830,-10,25,25,25,0 > 2019-09-06 22:09:54.590300 +0200 info main: #173 C MITPROHB rx msg h 964,-109,RT-BAT-C,5,86400,2,1,3830,3795,3830,-10,25,25,25,0 > 2019-09-06 22:11:10.127054 +0200 info main: #173 C MITPROHB rx msg h 964,-119,RT-BAT-C,5,86400,2,1,3830,3795,3830,-10,25,25,25,0 > 2019-09-06 22:11:16.794200 +0200 info main: #173 C MITPROHB rx msg h 964,-130,RT-BAT-C,5,86400,2,1,3830,3795,3830,-10,25,25,25,0 > 2019-09-06 22:11:22.455652 +0200 info main: #173 C MITPROHB rx msg h 964,-140,RT-BAT-C,5,86400,2,1,3830,3795,3830,-10,25,25,25,0 > 2019-09-06 22:12:49.423412 +0200 info main: #173 C MITPROHB rx msg h 964,-150,RT-BAT-C,5,86400,2,1,3830,3795,3830,-10,25,25,25,0 > 2019-09-06 22:12:49.442096 +0200 info main: #173 C MITPROHB rx msg h 964,-169,RT-BAT-C,5,86400,2,1,3830,3795,3830,-10,25,25,25,0 > 2019-09-06 22:12:49.461941 +0200 info main: #173 C MITPROHB rx msg h 964,-179,RT-BAT-C,5,86400,2,1,3830,3795,3830,-10,25,25,25,0 > 2019-09-06 22:14:39.828133 +0200 info main: #173 C MITPROHB rx msg h 964,-190,RT-BAT-C,5,86400,2,1,3830,3795,3830,-10,25,25,25,0 > 2019-09-06 22:14:39.858144 +0200 info main: #173 C MITPROHB rx msg h 964,-200,RT-BAT-C,5,86400,2,1,3830,3795,3830,-10,25,25,25,0 > 2019-09-06 22:14:52.020319 +0200 info main: #173 C MITPROHB rx msg h 964,-210,RT-BAT-C,5,86400,2,1,3830,3795,3830,-10,25,25,25,0 > 2019-09-06 22:14:54.452637 +0200 info main: #173 C MITPROHB rx msg h 964,-229,RT-BAT-C,5,86400,2,1,3830,3795,3830,-10,25,25,25,0 > 2019-09-06 22:15:12.613935 +0200 info main: #173 C MITPROHB rx msg h 964,-239,RT-BAT-C,5,86400,2,1,3830,3795,3830,-10,25,25,25,0 > 2019-09-06 22:15:35.223845 +0200 info main: #173 C MITPROHB rx msg h 964,-250,RT-BAT-C,5,86400,2,1,3830,3795,3830,-10,25,25,25,0 > 2019-09-06 22:16:09.255059 +0200 info main: #173 C MITPROHB rx msg h 964,-260,RT-BAT-C,5,86400,2,1,3830,3795,3830,-10,25,25,25,0 > 2019-09-06 22:17:31.919754 +0200 info main: #173 C MITPROHB rx msg h 964,-270,RT-BAT-C,5,86400,2,1,3830,3795,3830,-10,25,25,25,0 > 2019-09-06 22:19:23.366267 +0200 info main: #173 C MITPROHB rx msg h 964,-289,RT-BAT-C,5,86400,2,1,3830,3795,3830,-10,25,25,25,0 > 2019-09-06 22:21:57.344609 +0200 info main: #173 C MITPROHB rx msg h 964,-299,RT-BAT-C,5,86400,2,1,3830,3795,3830,-10,25,25,25,0 > 2019-09-06 22:23:40.082406 +0200 info main: #31 C MITPROHB rx msg h 964,-1027,RT-BAT-C,5,86400,2,1,3830,3795,3830,-10,25,25,25,0 > 2019-09-06 22:25:58.061883 +0200 info main: #31 C MITPROHB rx msg h 964,-1040,RT-BAT-C,5,86400,2,1,3830,3795,3830,-10,25,25,25,0 > > > This shows the ticker was only run 299 times from 22:07:48 to 22:21:57. > > After 22:21:57 the workaround was triggered and did a reconnect. Apparently during that network reinitialization of 103 seconds, the per second ticker was run 628 times. > > That can't be catching up on the event queue, as that queue has only 20 slots. So something strange is going on here. > > Any ideas? > > Regards, > Michael > > > Am 06.09.19 um 08:04 schrieb Michael Balzer: >> Mark & anyone else running a V2 server, >> >> as most cars don't send history records, this also needs the change to the server I just pushed, i.e. server version 2.4.2. >> >> https://github.com/openvehicles/Open-Vehicle-Monitoring-System/commits/maste... <https://github.com/openvehicles/Open-Vehicle-Monitoring-System/commits/master> <https://github.com/openvehicles/Open-Vehicle-Monitoring-System/commits/maste... <https://github.com/openvehicles/Open-Vehicle-Monitoring-System/commits/master>> >> >> Regards, >> Michael >> >> >> Am 05.09.19 um 19:55 schrieb Michael Balzer: >>> I've pushed the nasty workaround: the v2 server checks for no RX over 15 minutes, then restarts the network (wifi & modem) as configured for autostart. >>> >>> Rolled out on my server in edge as 3.2.002-237-ge075f655. >>> >>> Please test. >>> >>> Regards, >>> Michael >>> >>> >>> Am 05.09.19 um 01:58 schrieb Mark Webb-Johnson: >>>>> Mark, you can check your server logs for history messages with ridiculous time offsets: >>>>> [sddexter@ns27 server]$ cat log-20190903 | egrep "rx msg h [0-9]+,-[0-9]{4}" | wc -l >>>>> 455283 >>>> >>>> I checked my logs and see 12 vehicles showing this. But, 2 only show this for a debugcrash log (which is expected, I guess, if the time is not synced at report time). I’ve got 4 cars with the offset > 10,000. >>>> >>>> Regards, Mark. >>>> >>>>> On 4 Sep 2019, at 4:45 AM, Michael Balzer <dexter@expeedo.de <mailto:dexter@expeedo.de> <mailto:dexter@expeedo.de <mailto:dexter@expeedo.de>>> wrote: >>>>> >>>>> Everyone, >>>>> >>>>> I've pushed a change that needs some testing. >>>>> >>>>> I had the issue myself now parking at a certain distance from my garage wifi AP, i.e. on the edge of "in", after wifi had been disconnected for some hours, and with the module still connected via modem. The wifi blob had been trying to connect to the AP for about two hours. >>>>> >>>>> As seen before, the module saw no error, just the server responses and commands stopped coming in. I noticed the default interface was still "st1" despite wifi having been disconnected and modem connected. The DNS was also still configured for my wifi network, and the interface seemed to have an IP address -- but wasn't pingable from the wifi network. >>>>> >>>>> A power cycle of the modem solved the issue without reboot. So the cause may be in the modem/ppp subsystem, or it may be related (in some weird way) to the default interface / DNS setup. >>>>> >>>>> More tests showed the default interface again/still got set by the wifi blob itself at some point, overriding our modem prioritization. The events we didn't handle up to now were "sta.connected" and "sta.lostip", so I added these, and the bug didn't show up again since then. That doesn't mean anything, so we need to test this. >>>>> >>>>> The default interface really shouldn't affect inbound packet routing of an established connection, but there always may be strange bugs lurking in those libs. >>>>> >>>>> The change also reimplements the wifi signal strength reading, as the tests also showed that still wasn't working well using the CSI callback. It now seems to be much more reliable. >>>>> >>>>> Please test & report. The single module will be hard to test, as the bug isn't reproducable easily, but you can still try if wifi / modem transitions work well. >>>>> >>>>> Mark, you can check your server logs for history messages with ridiculous time offsets: >>>>> [sddexter@ns27 server]$ cat log-20190903 | egrep "rx msg h [0-9]+,-[0-9]{4}" | wc -l >>>>> 455283 >>>>> The bug now severely affects the V2 server performance, as the server is single threaded and doesn't scale very well to this kind of bulk data bursts, especially when coming from multiple modules in parallel. So we really need to solve this now. Slow reactions or connection drops from my server lately have been due to this bug. If this change doesn't solve it, we'll need to add some reboot trigger on "too many server v2 notification retransmissions" -- or maybe a modem power cycle will do, that wouldn't discard the data. >>>>> >>>>> Thanks, >>>>> Michael >>>>> >>>>> >>>>> Am 03.09.19 um 07:46 schrieb Mark Webb-Johnson: >>>>>> No problem. We can hold. I won’t commit anything for the next few days (and agree to hold-off on Markos’s pull). Let me know when you are ready. >>>>>> >>>>>> Regards, Mark. >>>>>> >>>>>>> On 3 Sep 2019, at 1:58 AM, Michael Balzer <dexter@expeedo.de <mailto:dexter@expeedo.de>> <mailto:dexter@expeedo.de <mailto:dexter@expeedo.de>> wrote: >>>>>>> >>>>>>> Mark, please wait. >>>>>>> >>>>>>> I may just have found the cause for issue #241, or at least something I need to investigate before releasing. >>>>>>> >>>>>>> I need to dig into my logs first, and try something. >>>>>>> >>>>>>> Regards, >>>>>>> Michael >>>>>>> >>>>>>> >>>>>>> Am 02.09.19 um 12:23 schrieb Michael Balzer: >>>>>>>> Nothing open from my side at the moment. >>>>>>>> >>>>>>>> I haven't had the time to look in to Markos pull request, but from a first check also think that's going too deep to be included in this release. >>>>>>>> >>>>>>>> Regards, >>>>>>>> Michael >>>>>>>> >>>>>>>> >>>>>>>> Am 02.09.19 um 04:15 schrieb Mark Webb-Johnson: >>>>>>>>> I think it is well past time for a 3.2.003 release. Things seems table in edge (although some things only partially implemented). >>>>>>>>> >>>>>>>>> Anything people want to include at the last minute, or can we go ahead and build? >>>>>>>>> >>>>>>>>> Regards, Mark. >>>>>>>>>
-- Michael Balzer * Helkenberger Weg 9 * D-58256 Ennepetal Fon 02333 / 833 5735 * Handy 0176 / 206 989 26 _______________________________________________ OvmsDev mailing list OvmsDev@lists.openvehicles.com http://lists.openvehicles.com/mailman/listinfo/ovmsdev
Correct. Regards, Michael Am 19.09.19 um 09:29 schrieb Mark Webb-Johnson:
I’m just worried about the users who don’t know about this new feature. When they deploy this version, they suddenly start sending 6MB of data a month up to us.
I think the ‘fix’ is just to change ovms_module.c:
MyConfig.GetParamValueBool("module", "debug.tasks", true)
to
MyConfig.GetParamValueBool("module", "debug.tasks", false)
That would then only submit these logs for those that explicitly turn it on?
Regards, Mark.
On 19 Sep 2019, at 3:23 PM, Michael Balzer <dexter@expeedo.de <mailto:dexter@expeedo.de>> wrote:
Sorry, I didn't think about this being an issue elsewhere -- german data plans typically start at minimum 100 MB/month flat (that's my current plan at 3 € / month).
No need for a new release, it can be turned off OTA by issueing
config set module debug.tasks no
Regards, Michael
Am 19.09.19 um 09:08 schrieb Mark Webb-Johnson:
Yep:
758 bytes * (86400 / 300) * 30 = 6.5MB/month
That is going over data (not SD). Presumably cellular data for a large portion of the time.
I think we need to default this to OFF, and make a 3.2.004 to avoid this becoming an issue.
Regards, Mark.
On 19 Sep 2019, at 2:04 PM, Stephen Casner <casner@acm.org <mailto:casner@acm.org>> wrote:
That's 6.55MB/month, unless you have unusually short months! :-)
In what space is that data stored? A log written to SD? That's not likely to fill up the SD card too fast, but what happens if no SD card is installed?
-- Steve
On Thu, 19 Sep 2019, Mark Webb-Johnson wrote:
To enable CPU usage statistics, apply the changes to sdkconfig included. New history record: - "*-OVM-DebugTasks" v1: <taskcnt,totaltime> + per task: <tasknum,name,state,stack_now,stack_max,stack_total, heap_total,heap_32bit,heap_spi,runtime> Note: CPU core use percentage = runtime / totaltime
I’ve just noticed that this is enabled by default now (my production build has the sdkconfig updated, as per defaults).
I am seeing 758 bytes of history record, every 5 minutes. About 218KB/day, or 654KB/month.
Should this be opt-in?
Regards, Mark.
On 8 Sep 2019, at 5:43 PM, Michael Balzer <dexter@expeedo.de <mailto:dexter@expeedo.de>> wrote:
I've pushed some modifications and improvements to (hopefully) fix the timer issue or at least be able to debug it.
Some sdkconfig changes are necessary.
The build including these updates is on my edge release as 3.2.002-258-g20ae554b.
Btw: the network restart strategy seems to mitigate issue #241; I've seen a major drop on record repetitions on my server since the rollout.
commit 99e4e48bdd40b7004c0976f51aba9e3da4ecab53
Module: add per task CPU usage statistics, add task stats history records
To enable CPU usage statistics, apply the changes to sdkconfig included. The CPU usage shown by the commands is calculated against the last task status retrieved (or system boot).
Command changes: - "module tasks" -- added CPU (core) usage in percent per task
New command: - "module tasks data" -- output task stats in history record form
New config: - [module] debug.tasks -- yes (default) = send task stats every 5 minutes
New history record: - "*-OVM-DebugTasks" v1: <taskcnt,totaltime> + per task: <tasknum,name,state,stack_now,stack_max,stack_total, heap_total,heap_32bit,heap_spi,runtime> Note: CPU core use percentage = runtime / totaltime
commit 950172c216a72beb4da0bc7a40a46995a6105955
Build config: default timer service task priority raised to 20
Background: the FreeRTOS timer service shall only be used for very short and non-blocking jobs. We delegate event processing to our events task, anything else in timers needs to run with high priority.
commit 31ac19d187480046c16356b80668de45cacbb83d
DukTape: add build config for task priority, default lowered to 3
Background: the DukTape garbage collector shall run on lower priority than tasks like SIMCOM & events
commit e0a44791fbcfb5a4e4cad24c9d1163b76e637b4f
Server V2: use esp_log_timestamp for timeout detection, add timeout config, limit data records & size per second
New config: - [server.v2] timeout.rx -- timeout in seconds, default 960
commit 684a4ce9525175a910040f0d1ca82ac212fbf5de
Notify: use esp_log_timestamp for creation time instead of monotonictime to harden against timer service starvation / ticker event drops
Regards, Michael
Am 07.09.19 um 10:55 schrieb Michael Balzer: > I think the RTOS timer service task starves. It's running on core 0 with priority 1. > > Taks on core 0 sorted by priority: > > Number of Tasks = 20 Stack: Now Max Total Heap 32-bit SPIRAM C# PRI > 3FFC84A8 6 Blk ipc0 388 500 1024 7788 0 0 0 24 > 3FFC77F0 5 Blk OVMS CanRx 428 428 2048 3052 0 31844 0 23 > 3FFAFBF4 1 Blk esp_timer 400 656 4096 35928 644 25804 0 22 > 3FFD3240 19 Blk wifi 460 2716 3584 43720 0 20 0 22 > 3FFC03C4 2 Blk eventTask 448 1984 4608 104 0 0 0 20 > 3FFC8F14 17 Blk tiT 500 2308 3072 6552 0 0 * 18 > 3FFE14F0 26 Blk OVMS COrx 456 456 4096 0 0 0 0 7 > 3FFE19D4 27 Blk OVMS COwrk 476 476 3072 0 0 0 0 7 > 3FFCBC34 12 Blk Tmr Svc 352 928 3072 88 0 0 0 1 > 3FFE7708 23 Blk mdns 468 1396 4096 108 0 0 0 1 > > I don't think it's our CanRx, as that only fetches and queues CAN frames, the actual work is done by the listeners. The CO tasks only > run for CANopen jobs, which are few for normal operation. > > That leaves the system tasks, with main suspect -once again- the wifi blob. > > We need to know how much CPU time the tasks actually use now. I think I saw some option for this in the FreeRTOS config. > > Regards, > Michael > > > Am 06.09.19 um 23:15 schrieb Michael Balzer: >> The workaround is based on the monotonictime being updated per second, as do the history record offsets. >> >> Apparently, that mechanism doesn't work reliably. That may be an indicator for some bigger underlying issue. >> >> Example log excerpt: >> >> 2019-09-06 22:07:48.126919 +0200 info main: #173 C MITPROHB rx msg h 964,0,RT-BAT-C,5,86400,2,1,3830,3795,3830,-10,25,25,25,0 >> 2019-09-06 22:09:03.089031 +0200 info main: #173 C MITPROHB rx msg h 964,-10,RT-BAT-C,5,86400,2,1,3830,3795,3830,-10,25,25,25,0 >> 2019-09-06 22:09:05.041574 +0200 info main: #173 C MITPROHB rx msg h 964,-20,RT-BAT-C,5,86400,2,1,3830,3795,3830,-10,25,25,25,0 >> 2019-09-06 22:09:05.052644 +0200 info main: #173 C MITPROHB rx msg h 964,-30,RT-BAT-C,5,86400,2,1,3830,3795,3830,-10,25,25,25,0 >> 2019-09-06 22:09:05.063617 +0200 info main: #173 C MITPROHB rx msg h 964,-49,RT-BAT-C,5,86400,2,1,3830,3795,3830,-10,25,25,25,0 >> 2019-09-06 22:09:05.077527 +0200 info main: #173 C MITPROHB rx msg h 964,-59,RT-BAT-C,5,86400,2,1,3830,3795,3830,-10,25,25,25,0 >> 2019-09-06 22:09:05.193775 +0200 info main: #173 C MITPROHB rx msg h 964,-70,RT-BAT-C,5,86400,2,1,3830,3795,3830,-10,25,25,25,0 >> 2019-09-06 22:09:13.190645 +0200 info main: #173 C MITPROHB rx msg h 964,-80,RT-BAT-C,5,86400,2,1,3830,3795,3830,-10,25,25,25,0 >> 2019-09-06 22:09:22.077994 +0200 info main: #173 C MITPROHB rx msg h 964,-90,RT-BAT-C,5,86400,2,1,3830,3795,3830,-10,25,25,25,0 >> 2019-09-06 22:09:54.590300 +0200 info main: #173 C MITPROHB rx msg h 964,-109,RT-BAT-C,5,86400,2,1,3830,3795,3830,-10,25,25,25,0 >> 2019-09-06 22:11:10.127054 +0200 info main: #173 C MITPROHB rx msg h 964,-119,RT-BAT-C,5,86400,2,1,3830,3795,3830,-10,25,25,25,0 >> 2019-09-06 22:11:16.794200 +0200 info main: #173 C MITPROHB rx msg h 964,-130,RT-BAT-C,5,86400,2,1,3830,3795,3830,-10,25,25,25,0 >> 2019-09-06 22:11:22.455652 +0200 info main: #173 C MITPROHB rx msg h 964,-140,RT-BAT-C,5,86400,2,1,3830,3795,3830,-10,25,25,25,0 >> 2019-09-06 22:12:49.423412 +0200 info main: #173 C MITPROHB rx msg h 964,-150,RT-BAT-C,5,86400,2,1,3830,3795,3830,-10,25,25,25,0 >> 2019-09-06 22:12:49.442096 +0200 info main: #173 C MITPROHB rx msg h 964,-169,RT-BAT-C,5,86400,2,1,3830,3795,3830,-10,25,25,25,0 >> 2019-09-06 22:12:49.461941 +0200 info main: #173 C MITPROHB rx msg h 964,-179,RT-BAT-C,5,86400,2,1,3830,3795,3830,-10,25,25,25,0 >> 2019-09-06 22:14:39.828133 +0200 info main: #173 C MITPROHB rx msg h 964,-190,RT-BAT-C,5,86400,2,1,3830,3795,3830,-10,25,25,25,0 >> 2019-09-06 22:14:39.858144 +0200 info main: #173 C MITPROHB rx msg h 964,-200,RT-BAT-C,5,86400,2,1,3830,3795,3830,-10,25,25,25,0 >> 2019-09-06 22:14:52.020319 +0200 info main: #173 C MITPROHB rx msg h 964,-210,RT-BAT-C,5,86400,2,1,3830,3795,3830,-10,25,25,25,0 >> 2019-09-06 22:14:54.452637 +0200 info main: #173 C MITPROHB rx msg h 964,-229,RT-BAT-C,5,86400,2,1,3830,3795,3830,-10,25,25,25,0 >> 2019-09-06 22:15:12.613935 +0200 info main: #173 C MITPROHB rx msg h 964,-239,RT-BAT-C,5,86400,2,1,3830,3795,3830,-10,25,25,25,0 >> 2019-09-06 22:15:35.223845 +0200 info main: #173 C MITPROHB rx msg h 964,-250,RT-BAT-C,5,86400,2,1,3830,3795,3830,-10,25,25,25,0 >> 2019-09-06 22:16:09.255059 +0200 info main: #173 C MITPROHB rx msg h 964,-260,RT-BAT-C,5,86400,2,1,3830,3795,3830,-10,25,25,25,0 >> 2019-09-06 22:17:31.919754 +0200 info main: #173 C MITPROHB rx msg h 964,-270,RT-BAT-C,5,86400,2,1,3830,3795,3830,-10,25,25,25,0 >> 2019-09-06 22:19:23.366267 +0200 info main: #173 C MITPROHB rx msg h 964,-289,RT-BAT-C,5,86400,2,1,3830,3795,3830,-10,25,25,25,0 >> 2019-09-06 22:21:57.344609 +0200 info main: #173 C MITPROHB rx msg h 964,-299,RT-BAT-C,5,86400,2,1,3830,3795,3830,-10,25,25,25,0 >> 2019-09-06 22:23:40.082406 +0200 info main: #31 C MITPROHB rx msg h 964,-1027,RT-BAT-C,5,86400,2,1,3830,3795,3830,-10,25,25,25,0 >> 2019-09-06 22:25:58.061883 +0200 info main: #31 C MITPROHB rx msg h 964,-1040,RT-BAT-C,5,86400,2,1,3830,3795,3830,-10,25,25,25,0 >> >> >> This shows the ticker was only run 299 times from 22:07:48 to 22:21:57. >> >> After 22:21:57 the workaround was triggered and did a reconnect. Apparently during that network reinitialization of 103 seconds, the >> per second ticker was run 628 times. >> >> That can't be catching up on the event queue, as that queue has only 20 slots. So something strange is going on here. >> >> Any ideas? >> >> Regards, >> Michael >> >> >> Am 06.09.19 um 08:04 schrieb Michael Balzer: >>> Mark & anyone else running a V2 server, >>> >>> as most cars don't send history records, this also needs the change to the server I just pushed, i.e. server version 2.4.2. >>> >>> https://github.com/openvehicles/Open-Vehicle-Monitoring-System/commits/maste... >>> <https://github.com/openvehicles/Open-Vehicle-Monitoring-System/commits/master> >>> >>> Regards, >>> Michael >>> >>> >>> Am 05.09.19 um 19:55 schrieb Michael Balzer: >>>> I've pushed the nasty workaround: the v2 server checks for no RX over 15 minutes, then restarts the network (wifi & modem) as >>>> configured for autostart. >>>> >>>> Rolled out on my server in edge as 3.2.002-237-ge075f655. >>>> >>>> Please test. >>>> >>>> Regards, >>>> Michael >>>> >>>> >>>> Am 05.09.19 um 01:58 schrieb Mark Webb-Johnson: >>>>>> Mark, you can check your server logs for history messages with ridiculous time offsets: >>>>>> [sddexter@ns27 server]$ cat log-20190903 | egrep "rx msg h [0-9]+,-[0-9]{4}" | wc -l >>>>>> 455283 >>>>> >>>>> I checked my logs and see 12 vehicles showing this. But, 2 only show this for a debugcrash log (which is expected, I guess, if the >>>>> time is not synced at report time). I’ve got 4 cars with the offset > 10,000. >>>>> >>>>> Regards, Mark. >>>>> >>>>>> On 4 Sep 2019, at 4:45 AM, Michael Balzer <dexter@expeedo.de <mailto:dexter@expeedo.de> <mailto:dexter@expeedo.de>> wrote: >>>>>> >>>>>> Everyone, >>>>>> >>>>>> I've pushed a change that needs some testing. >>>>>> >>>>>> I had the issue myself now parking at a certain distance from my garage wifi AP, i.e. on the edge of "in", after wifi had been >>>>>> disconnected for some hours, and with the module still connected via modem. The wifi blob had been trying to connect to the AP for >>>>>> about two hours. >>>>>> >>>>>> As seen before, the module saw no error, just the server responses and commands stopped coming in. I noticed the default interface >>>>>> was still "st1" despite wifi having been disconnected and modem connected. The DNS was also still configured for my wifi network, >>>>>> and the interface seemed to have an IP address -- but wasn't pingable from the wifi network. >>>>>> >>>>>> A power cycle of the modem solved the issue without reboot. So the cause may be in the modem/ppp subsystem, or it may be related >>>>>> (in some weird way) to the default interface / DNS setup. >>>>>> >>>>>> More tests showed the default interface again/still got set by the wifi blob itself at some point, overriding our modem >>>>>> prioritization. The events we didn't handle up to now were "sta.connected" and "sta.lostip", so I added these, and the bug didn't >>>>>> show up again since then. That doesn't mean anything, so we need to test this. >>>>>> >>>>>> The default interface really shouldn't affect inbound packet routing of an established connection, but there always may be strange >>>>>> bugs lurking in those libs. >>>>>> >>>>>> The change also reimplements the wifi signal strength reading, as the tests also showed that still wasn't working well using the >>>>>> CSI callback. It now seems to be much more reliable. >>>>>> >>>>>> Please test & report. The single module will be hard to test, as the bug isn't reproducable easily, but you can still try if wifi / >>>>>> modem transitions work well. >>>>>> >>>>>> Mark, you can check your server logs for history messages with ridiculous time offsets: >>>>>> [sddexter@ns27 server]$ cat log-20190903 | egrep "rx msg h [0-9]+,-[0-9]{4}" | wc -l >>>>>> 455283 >>>>>> The bug now severely affects the V2 server performance, as the server is single threaded and doesn't scale very well to this kind >>>>>> of bulk data bursts, especially when coming from multiple modules in parallel. So we really need to solve this now. Slow reactions >>>>>> or connection drops from my server lately have been due to this bug. If this change doesn't solve it, we'll need to add some reboot >>>>>> trigger on "too many server v2 notification retransmissions" -- or maybe a modem power cycle will do, that wouldn't discard the data. >>>>>> >>>>>> Thanks, >>>>>> Michael >>>>>> >>>>>> >>>>>> Am 03.09.19 um 07:46 schrieb Mark Webb-Johnson: >>>>>>> No problem. We can hold. I won’t commit anything for the next few days (and agree to hold-off on Markos’s pull). Let me know when >>>>>>> you are ready. >>>>>>> >>>>>>> Regards, Mark. >>>>>>> >>>>>>>> On 3 Sep 2019, at 1:58 AM, Michael Balzer <dexter@expeedo.de <mailto:dexter@expeedo.de>> <mailto:dexter@expeedo.de> wrote: >>>>>>>> >>>>>>>> Mark, please wait. >>>>>>>> >>>>>>>> I may just have found the cause for issue #241, or at least something I need to investigate before releasing. >>>>>>>> >>>>>>>> I need to dig into my logs first, and try something. >>>>>>>> >>>>>>>> Regards, >>>>>>>> Michael >>>>>>>> >>>>>>>> >>>>>>>> Am 02.09.19 um 12:23 schrieb Michael Balzer: >>>>>>>>> Nothing open from my side at the moment. >>>>>>>>> >>>>>>>>> I haven't had the time to look in to Markos pull request, but from a first check also think that's going too deep to be included >>>>>>>>> in this release. >>>>>>>>> >>>>>>>>> Regards, >>>>>>>>> Michael >>>>>>>>> >>>>>>>>> >>>>>>>>> Am 02.09.19 um 04:15 schrieb Mark Webb-Johnson: >>>>>>>>>> I think it is well past time for a 3.2.003 release. Things seems table in edge (although some things only partially implemented). >>>>>>>>>> >>>>>>>>>> Anything people want to include at the last minute, or can we go ahead and build? >>>>>>>>>> >>>>>>>>>> Regards, Mark. >>>>>>>>>>
-- Michael Balzer * Helkenberger Weg 9 * D-58256 Ennepetal Fon 02333 / 833 5735 * Handy 0176 / 206 989 26 _______________________________________________ OvmsDev mailing list OvmsDev@lists.openvehicles.com <mailto:OvmsDev@lists.openvehicles.com> http://lists.openvehicles.com/mailman/listinfo/ovmsdev
_______________________________________________ OvmsDev mailing list OvmsDev@lists.openvehicles.com http://lists.openvehicles.com/mailman/listinfo/ovmsdev
-- Michael Balzer * Helkenberger Weg 9 * D-58256 Ennepetal Fon 02333 / 833 5735 * Handy 0176 / 206 989 26
OK, I’ve built: 2019-09-19 MWJ 3.2.005 OTA release - Default module/debug.tasks to FALSE Users that volunteer to submit tasks debug historical data to the Open Vehicles project, should (with appreciation) set: config set module debug.tasks yes This will be transmit approximately 700MB of data a month (over cellular/wifi). 2019-09-19 MWJ 3.2.004 OTA release - Skipped for Chinese superstitous reasons In EAP now, and I will announce. Regards, Mark.
On 19 Sep 2019, at 3:34 PM, Michael Balzer <dexter@expeedo.de> wrote:
Correct.
Regards, Michael
Am 19.09.19 um 09:29 schrieb Mark Webb-Johnson:
I’m just worried about the users who don’t know about this new feature. When they deploy this version, they suddenly start sending 6MB of data a month up to us.
I think the ‘fix’ is just to change ovms_module.c:
MyConfig.GetParamValueBool("module", "debug.tasks", true)
to
MyConfig.GetParamValueBool("module", "debug.tasks", false)
That would then only submit these logs for those that explicitly turn it on?
Regards, Mark.
On 19 Sep 2019, at 3:23 PM, Michael Balzer <dexter@expeedo.de <mailto:dexter@expeedo.de>> wrote:
Sorry, I didn't think about this being an issue elsewhere -- german data plans typically start at minimum 100 MB/month flat (that's my current plan at 3 € / month).
No need for a new release, it can be turned off OTA by issueing
config set module debug.tasks no
Regards, Michael
Am 19.09.19 um 09:08 schrieb Mark Webb-Johnson:
Yep:
758 bytes * (86400 / 300) * 30 = 6.5MB/month
That is going over data (not SD). Presumably cellular data for a large portion of the time.
I think we need to default this to OFF, and make a 3.2.004 to avoid this becoming an issue.
Regards, Mark.
On 19 Sep 2019, at 2:04 PM, Stephen Casner <casner@acm.org <mailto:casner@acm.org>> wrote:
That's 6.55MB/month, unless you have unusually short months! :-)
In what space is that data stored? A log written to SD? That's not likely to fill up the SD card too fast, but what happens if no SD card is installed?
-- Steve
On Thu, 19 Sep 2019, Mark Webb-Johnson wrote:
> To enable CPU usage statistics, apply the changes to sdkconfig > included. > New history record: > - "*-OVM-DebugTasks" v1: <taskcnt,totaltime> + per task: > <tasknum,name,state,stack_now,stack_max,stack_total, > heap_total,heap_32bit,heap_spi,runtime> > Note: CPU core use percentage = runtime / totaltime
I’ve just noticed that this is enabled by default now (my production build has the sdkconfig updated, as per defaults).
I am seeing 758 bytes of history record, every 5 minutes. About 218KB/day, or 654KB/month.
Should this be opt-in?
Regards, Mark.
> On 8 Sep 2019, at 5:43 PM, Michael Balzer <dexter@expeedo.de <mailto:dexter@expeedo.de>> wrote: > > I've pushed some modifications and improvements to (hopefully) fix the timer issue or at least be able to debug it. > > Some sdkconfig changes are necessary. > > The build including these updates is on my edge release as 3.2.002-258-g20ae554b. > > Btw: the network restart strategy seems to mitigate issue #241; I've seen a major drop on record repetitions on my server since the rollout. > > > commit 99e4e48bdd40b7004c0976f51aba9e3da4ecab53 > > Module: add per task CPU usage statistics, add task stats history records > > To enable CPU usage statistics, apply the changes to sdkconfig > included. The CPU usage shown by the commands is calculated against > the last task status retrieved (or system boot). > > Command changes: > - "module tasks" -- added CPU (core) usage in percent per task > > New command: > - "module tasks data" -- output task stats in history record form > > New config: > - [module] debug.tasks -- yes (default) = send task stats every 5 minutes > > New history record: > - "*-OVM-DebugTasks" v1: <taskcnt,totaltime> + per task: > <tasknum,name,state,stack_now,stack_max,stack_total, > heap_total,heap_32bit,heap_spi,runtime> > Note: CPU core use percentage = runtime / totaltime > > commit 950172c216a72beb4da0bc7a40a46995a6105955 > > Build config: default timer service task priority raised to 20 > > Background: the FreeRTOS timer service shall only be used for very > short and non-blocking jobs. We delegate event processing to our > events task, anything else in timers needs to run with high > priority. > > commit 31ac19d187480046c16356b80668de45cacbb83d > > DukTape: add build config for task priority, default lowered to 3 > > Background: the DukTape garbage collector shall run on lower > priority than tasks like SIMCOM & events > > commit e0a44791fbcfb5a4e4cad24c9d1163b76e637b4f > > Server V2: use esp_log_timestamp for timeout detection, > add timeout config, limit data records & size per second > > New config: > - [server.v2] timeout.rx -- timeout in seconds, default 960 > > commit 684a4ce9525175a910040f0d1ca82ac212fbf5de > > Notify: use esp_log_timestamp for creation time instead of monotonictime > to harden against timer service starvation / ticker event drops > > > Regards, > Michael > > > Am 07.09.19 um 10:55 schrieb Michael Balzer: >> I think the RTOS timer service task starves. It's running on core 0 with priority 1. >> >> Taks on core 0 sorted by priority: >> >> Number of Tasks = 20 Stack: Now Max Total Heap 32-bit SPIRAM C# PRI >> 3FFC84A8 6 Blk ipc0 388 500 1024 7788 0 0 0 24 >> 3FFC77F0 5 Blk OVMS CanRx 428 428 2048 3052 0 31844 0 23 >> 3FFAFBF4 1 Blk esp_timer 400 656 4096 35928 644 25804 0 22 >> 3FFD3240 19 Blk wifi 460 2716 3584 43720 0 20 0 22 >> 3FFC03C4 2 Blk eventTask 448 1984 4608 104 0 0 0 20 >> 3FFC8F14 17 Blk tiT 500 2308 3072 6552 0 0 * 18 >> 3FFE14F0 26 Blk OVMS COrx 456 456 4096 0 0 0 0 7 >> 3FFE19D4 27 Blk OVMS COwrk 476 476 3072 0 0 0 0 7 >> 3FFCBC34 12 Blk Tmr Svc 352 928 3072 88 0 0 0 1 >> 3FFE7708 23 Blk mdns 468 1396 4096 108 0 0 0 1 >> >> I don't think it's our CanRx, as that only fetches and queues CAN frames, the actual work is done by the listeners. The CO tasks only run for CANopen jobs, which are few for normal operation. >> >> That leaves the system tasks, with main suspect -once again- the wifi blob. >> >> We need to know how much CPU time the tasks actually use now. I think I saw some option for this in the FreeRTOS config. >> >> Regards, >> Michael >> >> >> Am 06.09.19 um 23:15 schrieb Michael Balzer: >>> The workaround is based on the monotonictime being updated per second, as do the history record offsets. >>> >>> Apparently, that mechanism doesn't work reliably. That may be an indicator for some bigger underlying issue. >>> >>> Example log excerpt: >>> >>> 2019-09-06 22:07:48.126919 +0200 info main: #173 C MITPROHB rx msg h 964,0,RT-BAT-C,5,86400,2,1,3830,3795,3830,-10,25,25,25,0 >>> 2019-09-06 22:09:03.089031 +0200 info main: #173 C MITPROHB rx msg h 964,-10,RT-BAT-C,5,86400,2,1,3830,3795,3830,-10,25,25,25,0 >>> 2019-09-06 22:09:05.041574 +0200 info main: #173 C MITPROHB rx msg h 964,-20,RT-BAT-C,5,86400,2,1,3830,3795,3830,-10,25,25,25,0 >>> 2019-09-06 22:09:05.052644 +0200 info main: #173 C MITPROHB rx msg h 964,-30,RT-BAT-C,5,86400,2,1,3830,3795,3830,-10,25,25,25,0 >>> 2019-09-06 22:09:05.063617 +0200 info main: #173 C MITPROHB rx msg h 964,-49,RT-BAT-C,5,86400,2,1,3830,3795,3830,-10,25,25,25,0 >>> 2019-09-06 22:09:05.077527 +0200 info main: #173 C MITPROHB rx msg h 964,-59,RT-BAT-C,5,86400,2,1,3830,3795,3830,-10,25,25,25,0 >>> 2019-09-06 22:09:05.193775 +0200 info main: #173 C MITPROHB rx msg h 964,-70,RT-BAT-C,5,86400,2,1,3830,3795,3830,-10,25,25,25,0 >>> 2019-09-06 22:09:13.190645 +0200 info main: #173 C MITPROHB rx msg h 964,-80,RT-BAT-C,5,86400,2,1,3830,3795,3830,-10,25,25,25,0 >>> 2019-09-06 22:09:22.077994 +0200 info main: #173 C MITPROHB rx msg h 964,-90,RT-BAT-C,5,86400,2,1,3830,3795,3830,-10,25,25,25,0 >>> 2019-09-06 22:09:54.590300 +0200 info main: #173 C MITPROHB rx msg h 964,-109,RT-BAT-C,5,86400,2,1,3830,3795,3830,-10,25,25,25,0 >>> 2019-09-06 22:11:10.127054 +0200 info main: #173 C MITPROHB rx msg h 964,-119,RT-BAT-C,5,86400,2,1,3830,3795,3830,-10,25,25,25,0 >>> 2019-09-06 22:11:16.794200 +0200 info main: #173 C MITPROHB rx msg h 964,-130,RT-BAT-C,5,86400,2,1,3830,3795,3830,-10,25,25,25,0 >>> 2019-09-06 22:11:22.455652 +0200 info main: #173 C MITPROHB rx msg h 964,-140,RT-BAT-C,5,86400,2,1,3830,3795,3830,-10,25,25,25,0 >>> 2019-09-06 22:12:49.423412 +0200 info main: #173 C MITPROHB rx msg h 964,-150,RT-BAT-C,5,86400,2,1,3830,3795,3830,-10,25,25,25,0 >>> 2019-09-06 22:12:49.442096 +0200 info main: #173 C MITPROHB rx msg h 964,-169,RT-BAT-C,5,86400,2,1,3830,3795,3830,-10,25,25,25,0 >>> 2019-09-06 22:12:49.461941 +0200 info main: #173 C MITPROHB rx msg h 964,-179,RT-BAT-C,5,86400,2,1,3830,3795,3830,-10,25,25,25,0 >>> 2019-09-06 22:14:39.828133 +0200 info main: #173 C MITPROHB rx msg h 964,-190,RT-BAT-C,5,86400,2,1,3830,3795,3830,-10,25,25,25,0 >>> 2019-09-06 22:14:39.858144 +0200 info main: #173 C MITPROHB rx msg h 964,-200,RT-BAT-C,5,86400,2,1,3830,3795,3830,-10,25,25,25,0 >>> 2019-09-06 22:14:52.020319 +0200 info main: #173 C MITPROHB rx msg h 964,-210,RT-BAT-C,5,86400,2,1,3830,3795,3830,-10,25,25,25,0 >>> 2019-09-06 22:14:54.452637 +0200 info main: #173 C MITPROHB rx msg h 964,-229,RT-BAT-C,5,86400,2,1,3830,3795,3830,-10,25,25,25,0 >>> 2019-09-06 22:15:12.613935 +0200 info main: #173 C MITPROHB rx msg h 964,-239,RT-BAT-C,5,86400,2,1,3830,3795,3830,-10,25,25,25,0 >>> 2019-09-06 22:15:35.223845 +0200 info main: #173 C MITPROHB rx msg h 964,-250,RT-BAT-C,5,86400,2,1,3830,3795,3830,-10,25,25,25,0 >>> 2019-09-06 22:16:09.255059 +0200 info main: #173 C MITPROHB rx msg h 964,-260,RT-BAT-C,5,86400,2,1,3830,3795,3830,-10,25,25,25,0 >>> 2019-09-06 22:17:31.919754 +0200 info main: #173 C MITPROHB rx msg h 964,-270,RT-BAT-C,5,86400,2,1,3830,3795,3830,-10,25,25,25,0 >>> 2019-09-06 22:19:23.366267 +0200 info main: #173 C MITPROHB rx msg h 964,-289,RT-BAT-C,5,86400,2,1,3830,3795,3830,-10,25,25,25,0 >>> 2019-09-06 22:21:57.344609 +0200 info main: #173 C MITPROHB rx msg h 964,-299,RT-BAT-C,5,86400,2,1,3830,3795,3830,-10,25,25,25,0 >>> 2019-09-06 22:23:40.082406 +0200 info main: #31 C MITPROHB rx msg h 964,-1027,RT-BAT-C,5,86400,2,1,3830,3795,3830,-10,25,25,25,0 >>> 2019-09-06 22:25:58.061883 +0200 info main: #31 C MITPROHB rx msg h 964,-1040,RT-BAT-C,5,86400,2,1,3830,3795,3830,-10,25,25,25,0 >>> >>> >>> This shows the ticker was only run 299 times from 22:07:48 to 22:21:57. >>> >>> After 22:21:57 the workaround was triggered and did a reconnect. Apparently during that network reinitialization of 103 seconds, the per second ticker was run 628 times. >>> >>> That can't be catching up on the event queue, as that queue has only 20 slots. So something strange is going on here. >>> >>> Any ideas? >>> >>> Regards, >>> Michael >>> >>> >>> Am 06.09.19 um 08:04 schrieb Michael Balzer: >>>> Mark & anyone else running a V2 server, >>>> >>>> as most cars don't send history records, this also needs the change to the server I just pushed, i.e. server version 2.4.2. >>>> >>>> https://github.com/openvehicles/Open-Vehicle-Monitoring-System/commits/maste... <https://github.com/openvehicles/Open-Vehicle-Monitoring-System/commits/master> <https://github.com/openvehicles/Open-Vehicle-Monitoring-System/commits/maste... <https://github.com/openvehicles/Open-Vehicle-Monitoring-System/commits/master>> >>>> >>>> Regards, >>>> Michael >>>> >>>> >>>> Am 05.09.19 um 19:55 schrieb Michael Balzer: >>>>> I've pushed the nasty workaround: the v2 server checks for no RX over 15 minutes, then restarts the network (wifi & modem) as configured for autostart. >>>>> >>>>> Rolled out on my server in edge as 3.2.002-237-ge075f655. >>>>> >>>>> Please test. >>>>> >>>>> Regards, >>>>> Michael >>>>> >>>>> >>>>> Am 05.09.19 um 01:58 schrieb Mark Webb-Johnson: >>>>>>> Mark, you can check your server logs for history messages with ridiculous time offsets: >>>>>>> [sddexter@ns27 server]$ cat log-20190903 | egrep "rx msg h [0-9]+,-[0-9]{4}" | wc -l >>>>>>> 455283 >>>>>> >>>>>> I checked my logs and see 12 vehicles showing this. But, 2 only show this for a debugcrash log (which is expected, I guess, if the time is not synced at report time). I’ve got 4 cars with the offset > 10,000. >>>>>> >>>>>> Regards, Mark. >>>>>> >>>>>>> On 4 Sep 2019, at 4:45 AM, Michael Balzer <dexter@expeedo.de <mailto:dexter@expeedo.de> <mailto:dexter@expeedo.de <mailto:dexter@expeedo.de>>> wrote: >>>>>>> >>>>>>> Everyone, >>>>>>> >>>>>>> I've pushed a change that needs some testing. >>>>>>> >>>>>>> I had the issue myself now parking at a certain distance from my garage wifi AP, i.e. on the edge of "in", after wifi had been disconnected for some hours, and with the module still connected via modem. The wifi blob had been trying to connect to the AP for about two hours. >>>>>>> >>>>>>> As seen before, the module saw no error, just the server responses and commands stopped coming in. I noticed the default interface was still "st1" despite wifi having been disconnected and modem connected. The DNS was also still configured for my wifi network, and the interface seemed to have an IP address -- but wasn't pingable from the wifi network. >>>>>>> >>>>>>> A power cycle of the modem solved the issue without reboot. So the cause may be in the modem/ppp subsystem, or it may be related (in some weird way) to the default interface / DNS setup. >>>>>>> >>>>>>> More tests showed the default interface again/still got set by the wifi blob itself at some point, overriding our modem prioritization. The events we didn't handle up to now were "sta.connected" and "sta.lostip", so I added these, and the bug didn't show up again since then. That doesn't mean anything, so we need to test this. >>>>>>> >>>>>>> The default interface really shouldn't affect inbound packet routing of an established connection, but there always may be strange bugs lurking in those libs. >>>>>>> >>>>>>> The change also reimplements the wifi signal strength reading, as the tests also showed that still wasn't working well using the CSI callback. It now seems to be much more reliable. >>>>>>> >>>>>>> Please test & report. The single module will be hard to test, as the bug isn't reproducable easily, but you can still try if wifi / modem transitions work well. >>>>>>> >>>>>>> Mark, you can check your server logs for history messages with ridiculous time offsets: >>>>>>> [sddexter@ns27 server]$ cat log-20190903 | egrep "rx msg h [0-9]+,-[0-9]{4}" | wc -l >>>>>>> 455283 >>>>>>> The bug now severely affects the V2 server performance, as the server is single threaded and doesn't scale very well to this kind of bulk data bursts, especially when coming from multiple modules in parallel. So we really need to solve this now. Slow reactions or connection drops from my server lately have been due to this bug. If this change doesn't solve it, we'll need to add some reboot trigger on "too many server v2 notification retransmissions" -- or maybe a modem power cycle will do, that wouldn't discard the data. >>>>>>> >>>>>>> Thanks, >>>>>>> Michael >>>>>>> >>>>>>> >>>>>>> Am 03.09.19 um 07:46 schrieb Mark Webb-Johnson: >>>>>>>> No problem. We can hold. I won’t commit anything for the next few days (and agree to hold-off on Markos’s pull). Let me know when you are ready. >>>>>>>> >>>>>>>> Regards, Mark. >>>>>>>> >>>>>>>>> On 3 Sep 2019, at 1:58 AM, Michael Balzer <dexter@expeedo.de <mailto:dexter@expeedo.de>> <mailto:dexter@expeedo.de <mailto:dexter@expeedo.de>> wrote: >>>>>>>>> >>>>>>>>> Mark, please wait. >>>>>>>>> >>>>>>>>> I may just have found the cause for issue #241, or at least something I need to investigate before releasing. >>>>>>>>> >>>>>>>>> I need to dig into my logs first, and try something. >>>>>>>>> >>>>>>>>> Regards, >>>>>>>>> Michael >>>>>>>>> >>>>>>>>> >>>>>>>>> Am 02.09.19 um 12:23 schrieb Michael Balzer: >>>>>>>>>> Nothing open from my side at the moment. >>>>>>>>>> >>>>>>>>>> I haven't had the time to look in to Markos pull request, but from a first check also think that's going too deep to be included in this release. >>>>>>>>>> >>>>>>>>>> Regards, >>>>>>>>>> Michael >>>>>>>>>> >>>>>>>>>> >>>>>>>>>> Am 02.09.19 um 04:15 schrieb Mark Webb-Johnson: >>>>>>>>>>> I think it is well past time for a 3.2.003 release. Things seems table in edge (although some things only partially implemented). >>>>>>>>>>> >>>>>>>>>>> Anything people want to include at the last minute, or can we go ahead and build? >>>>>>>>>>> >>>>>>>>>>> Regards, Mark. >>>>>>>>>>>
-- Michael Balzer * Helkenberger Weg 9 * D-58256 Ennepetal Fon 02333 / 833 5735 * Handy 0176 / 206 989 26 _______________________________________________ OvmsDev mailing list OvmsDev@lists.openvehicles.com <mailto:OvmsDev@lists.openvehicles.com> http://lists.openvehicles.com/mailman/listinfo/ovmsdev <http://lists.openvehicles.com/mailman/listinfo/ovmsdev>
_______________________________________________ OvmsDev mailing list OvmsDev@lists.openvehicles.com <mailto:OvmsDev@lists.openvehicles.com> http://lists.openvehicles.com/mailman/listinfo/ovmsdev <http://lists.openvehicles.com/mailman/listinfo/ovmsdev>
-- Michael Balzer * Helkenberger Weg 9 * D-58256 Ennepetal Fon 02333 / 833 5735 * Handy 0176 / 206 989 26 _______________________________________________ OvmsDev mailing list OvmsDev@lists.openvehicles.com http://lists.openvehicles.com/mailman/listinfo/ovmsdev
OK, but 700 MB is a bit exaggerated now ;) Regards, Michael Am 19.09.19 um 10:22 schrieb Mark Webb-Johnson:
OK, I’ve built:
2019-09-19 MWJ 3.2.005 OTA release - Default module/debug.tasks to FALSE Users that volunteer to submit tasks debug historical data to the Open Vehicles project, should (with appreciation) set: config set module debug.tasks yes This will be transmit approximately 700MB of data a month (over cellular/wifi).
2019-09-19 MWJ 3.2.004 OTA release - Skipped for Chinese superstitous reasons
In EAP now, and I will announce.
Regards, Mark.
On 19 Sep 2019, at 3:34 PM, Michael Balzer <dexter@expeedo.de <mailto:dexter@expeedo.de>> wrote:
Correct.
Regards, Michael
Am 19.09.19 um 09:29 schrieb Mark Webb-Johnson:
I’m just worried about the users who don’t know about this new feature. When they deploy this version, they suddenly start sending 6MB of data a month up to us.
I think the ‘fix’ is just to change ovms_module.c:
MyConfig.GetParamValueBool("module", "debug.tasks", true)
to
MyConfig.GetParamValueBool("module", "debug.tasks", false)
That would then only submit these logs for those that explicitly turn it on?
Regards, Mark.
On 19 Sep 2019, at 3:23 PM, Michael Balzer <dexter@expeedo.de <mailto:dexter@expeedo.de>> wrote:
Sorry, I didn't think about this being an issue elsewhere -- german data plans typically start at minimum 100 MB/month flat (that's my current plan at 3 € / month).
No need for a new release, it can be turned off OTA by issueing
config set module debug.tasks no
Regards, Michael
Am 19.09.19 um 09:08 schrieb Mark Webb-Johnson:
Yep:
758 bytes * (86400 / 300) * 30 = 6.5MB/month
That is going over data (not SD). Presumably cellular data for a large portion of the time.
I think we need to default this to OFF, and make a 3.2.004 to avoid this becoming an issue.
Regards, Mark.
On 19 Sep 2019, at 2:04 PM, Stephen Casner <casner@acm.org <mailto:casner@acm.org>> wrote:
That's 6.55MB/month, unless you have unusually short months! :-)
In what space is that data stored? A log written to SD? That's not likely to fill up the SD card too fast, but what happens if no SD card is installed?
-- Steve
On Thu, 19 Sep 2019, Mark Webb-Johnson wrote:
>> To enable CPU usage statistics, apply the changes to sdkconfig >> included. >> New history record: >> - "*-OVM-DebugTasks" v1: <taskcnt,totaltime> + per task: >> <tasknum,name,state,stack_now,stack_max,stack_total, >> heap_total,heap_32bit,heap_spi,runtime> >> Note: CPU core use percentage = runtime / totaltime > > I’ve just noticed that this is enabled by default now (my production build has the sdkconfig updated, as per defaults). > > I am seeing 758 bytes of history record, every 5 minutes. About 218KB/day, or 654KB/month. > > Should this be opt-in? > > Regards, Mark. > >> On 8 Sep 2019, at 5:43 PM, Michael Balzer <dexter@expeedo.de <mailto:dexter@expeedo.de>> wrote: >> >> I've pushed some modifications and improvements to (hopefully) fix the timer issue or at least be able to debug it. >> >> Some sdkconfig changes are necessary. >> >> The build including these updates is on my edge release as 3.2.002-258-g20ae554b. >> >> Btw: the network restart strategy seems to mitigate issue #241; I've seen a major drop on record repetitions on my server since the >> rollout. >> >> >> commit 99e4e48bdd40b7004c0976f51aba9e3da4ecab53 >> >> Module: add per task CPU usage statistics, add task stats history records >> >> To enable CPU usage statistics, apply the changes to sdkconfig >> included. The CPU usage shown by the commands is calculated against >> the last task status retrieved (or system boot). >> >> Command changes: >> - "module tasks" -- added CPU (core) usage in percent per task >> >> New command: >> - "module tasks data" -- output task stats in history record form >> >> New config: >> - [module] debug.tasks -- yes (default) = send task stats every 5 minutes >> >> New history record: >> - "*-OVM-DebugTasks" v1: <taskcnt,totaltime> + per task: >> <tasknum,name,state,stack_now,stack_max,stack_total, >> heap_total,heap_32bit,heap_spi,runtime> >> Note: CPU core use percentage = runtime / totaltime >> >> commit 950172c216a72beb4da0bc7a40a46995a6105955 >> >> Build config: default timer service task priority raised to 20 >> >> Background: the FreeRTOS timer service shall only be used for very >> short and non-blocking jobs. We delegate event processing to our >> events task, anything else in timers needs to run with high >> priority. >> >> commit 31ac19d187480046c16356b80668de45cacbb83d >> >> DukTape: add build config for task priority, default lowered to 3 >> >> Background: the DukTape garbage collector shall run on lower >> priority than tasks like SIMCOM & events >> >> commit e0a44791fbcfb5a4e4cad24c9d1163b76e637b4f >> >> Server V2: use esp_log_timestamp for timeout detection, >> add timeout config, limit data records & size per second >> >> New config: >> - [server.v2] timeout.rx -- timeout in seconds, default 960 >> >> commit 684a4ce9525175a910040f0d1ca82ac212fbf5de >> >> Notify: use esp_log_timestamp for creation time instead of monotonictime >> to harden against timer service starvation / ticker event drops >> >> >> Regards, >> Michael >> >> >> Am 07.09.19 um 10:55 schrieb Michael Balzer: >>> I think the RTOS timer service task starves. It's running on core 0 with priority 1. >>> >>> Taks on core 0 sorted by priority: >>> >>> Number of Tasks = 20 Stack: Now Max Total Heap 32-bit SPIRAM C# PRI >>> 3FFC84A8 6 Blk ipc0 388 500 1024 7788 0 0 0 24 >>> 3FFC77F0 5 Blk OVMS CanRx 428 428 2048 3052 0 31844 0 23 >>> 3FFAFBF4 1 Blk esp_timer 400 656 4096 35928 644 25804 0 22 >>> 3FFD3240 19 Blk wifi 460 2716 3584 43720 0 20 0 22 >>> 3FFC03C4 2 Blk eventTask 448 1984 4608 104 0 0 0 20 >>> 3FFC8F14 17 Blk tiT 500 2308 3072 6552 0 0 * 18 >>> 3FFE14F0 26 Blk OVMS COrx 456 456 4096 0 0 0 0 7 >>> 3FFE19D4 27 Blk OVMS COwrk 476 476 3072 0 0 0 0 7 >>> 3FFCBC34 12 Blk Tmr Svc 352 928 3072 88 0 0 0 1 >>> 3FFE7708 23 Blk mdns 468 1396 4096 108 0 0 0 1 >>> >>> I don't think it's our CanRx, as that only fetches and queues CAN frames, the actual work is done by the listeners. The CO tasks only >>> run for CANopen jobs, which are few for normal operation. >>> >>> That leaves the system tasks, with main suspect -once again- the wifi blob. >>> >>> We need to know how much CPU time the tasks actually use now. I think I saw some option for this in the FreeRTOS config. >>> >>> Regards, >>> Michael >>> >>> >>> Am 06.09.19 um 23:15 schrieb Michael Balzer: >>>> The workaround is based on the monotonictime being updated per second, as do the history record offsets. >>>> >>>> Apparently, that mechanism doesn't work reliably. That may be an indicator for some bigger underlying issue. >>>> >>>> Example log excerpt: >>>> >>>> 2019-09-06 22:07:48.126919 +0200 info main: #173 C MITPROHB rx msg h 964,0,RT-BAT-C,5,86400,2,1,3830,3795,3830,-10,25,25,25,0 >>>> 2019-09-06 22:09:03.089031 +0200 info main: #173 C MITPROHB rx msg h 964,-10,RT-BAT-C,5,86400,2,1,3830,3795,3830,-10,25,25,25,0 >>>> 2019-09-06 22:09:05.041574 +0200 info main: #173 C MITPROHB rx msg h 964,-20,RT-BAT-C,5,86400,2,1,3830,3795,3830,-10,25,25,25,0 >>>> 2019-09-06 22:09:05.052644 +0200 info main: #173 C MITPROHB rx msg h 964,-30,RT-BAT-C,5,86400,2,1,3830,3795,3830,-10,25,25,25,0 >>>> 2019-09-06 22:09:05.063617 +0200 info main: #173 C MITPROHB rx msg h 964,-49,RT-BAT-C,5,86400,2,1,3830,3795,3830,-10,25,25,25,0 >>>> 2019-09-06 22:09:05.077527 +0200 info main: #173 C MITPROHB rx msg h 964,-59,RT-BAT-C,5,86400,2,1,3830,3795,3830,-10,25,25,25,0 >>>> 2019-09-06 22:09:05.193775 +0200 info main: #173 C MITPROHB rx msg h 964,-70,RT-BAT-C,5,86400,2,1,3830,3795,3830,-10,25,25,25,0 >>>> 2019-09-06 22:09:13.190645 +0200 info main: #173 C MITPROHB rx msg h 964,-80,RT-BAT-C,5,86400,2,1,3830,3795,3830,-10,25,25,25,0 >>>> 2019-09-06 22:09:22.077994 +0200 info main: #173 C MITPROHB rx msg h 964,-90,RT-BAT-C,5,86400,2,1,3830,3795,3830,-10,25,25,25,0 >>>> 2019-09-06 22:09:54.590300 +0200 info main: #173 C MITPROHB rx msg h 964,-109,RT-BAT-C,5,86400,2,1,3830,3795,3830,-10,25,25,25,0 >>>> 2019-09-06 22:11:10.127054 +0200 info main: #173 C MITPROHB rx msg h 964,-119,RT-BAT-C,5,86400,2,1,3830,3795,3830,-10,25,25,25,0 >>>> 2019-09-06 22:11:16.794200 +0200 info main: #173 C MITPROHB rx msg h 964,-130,RT-BAT-C,5,86400,2,1,3830,3795,3830,-10,25,25,25,0 >>>> 2019-09-06 22:11:22.455652 +0200 info main: #173 C MITPROHB rx msg h 964,-140,RT-BAT-C,5,86400,2,1,3830,3795,3830,-10,25,25,25,0 >>>> 2019-09-06 22:12:49.423412 +0200 info main: #173 C MITPROHB rx msg h 964,-150,RT-BAT-C,5,86400,2,1,3830,3795,3830,-10,25,25,25,0 >>>> 2019-09-06 22:12:49.442096 +0200 info main: #173 C MITPROHB rx msg h 964,-169,RT-BAT-C,5,86400,2,1,3830,3795,3830,-10,25,25,25,0 >>>> 2019-09-06 22:12:49.461941 +0200 info main: #173 C MITPROHB rx msg h 964,-179,RT-BAT-C,5,86400,2,1,3830,3795,3830,-10,25,25,25,0 >>>> 2019-09-06 22:14:39.828133 +0200 info main: #173 C MITPROHB rx msg h 964,-190,RT-BAT-C,5,86400,2,1,3830,3795,3830,-10,25,25,25,0 >>>> 2019-09-06 22:14:39.858144 +0200 info main: #173 C MITPROHB rx msg h 964,-200,RT-BAT-C,5,86400,2,1,3830,3795,3830,-10,25,25,25,0 >>>> 2019-09-06 22:14:52.020319 +0200 info main: #173 C MITPROHB rx msg h 964,-210,RT-BAT-C,5,86400,2,1,3830,3795,3830,-10,25,25,25,0 >>>> 2019-09-06 22:14:54.452637 +0200 info main: #173 C MITPROHB rx msg h 964,-229,RT-BAT-C,5,86400,2,1,3830,3795,3830,-10,25,25,25,0 >>>> 2019-09-06 22:15:12.613935 +0200 info main: #173 C MITPROHB rx msg h 964,-239,RT-BAT-C,5,86400,2,1,3830,3795,3830,-10,25,25,25,0 >>>> 2019-09-06 22:15:35.223845 +0200 info main: #173 C MITPROHB rx msg h 964,-250,RT-BAT-C,5,86400,2,1,3830,3795,3830,-10,25,25,25,0 >>>> 2019-09-06 22:16:09.255059 +0200 info main: #173 C MITPROHB rx msg h 964,-260,RT-BAT-C,5,86400,2,1,3830,3795,3830,-10,25,25,25,0 >>>> 2019-09-06 22:17:31.919754 +0200 info main: #173 C MITPROHB rx msg h 964,-270,RT-BAT-C,5,86400,2,1,3830,3795,3830,-10,25,25,25,0 >>>> 2019-09-06 22:19:23.366267 +0200 info main: #173 C MITPROHB rx msg h 964,-289,RT-BAT-C,5,86400,2,1,3830,3795,3830,-10,25,25,25,0 >>>> 2019-09-06 22:21:57.344609 +0200 info main: #173 C MITPROHB rx msg h 964,-299,RT-BAT-C,5,86400,2,1,3830,3795,3830,-10,25,25,25,0 >>>> 2019-09-06 22:23:40.082406 +0200 info main: #31 C MITPROHB rx msg h 964,-1027,RT-BAT-C,5,86400,2,1,3830,3795,3830,-10,25,25,25,0 >>>> 2019-09-06 22:25:58.061883 +0200 info main: #31 C MITPROHB rx msg h 964,-1040,RT-BAT-C,5,86400,2,1,3830,3795,3830,-10,25,25,25,0 >>>> >>>> >>>> This shows the ticker was only run 299 times from 22:07:48 to 22:21:57. >>>> >>>> After 22:21:57 the workaround was triggered and did a reconnect. Apparently during that network reinitialization of 103 seconds, the >>>> per second ticker was run 628 times. >>>> >>>> That can't be catching up on the event queue, as that queue has only 20 slots. So something strange is going on here. >>>> >>>> Any ideas? >>>> >>>> Regards, >>>> Michael >>>> >>>> >>>> Am 06.09.19 um 08:04 schrieb Michael Balzer: >>>>> Mark & anyone else running a V2 server, >>>>> >>>>> as most cars don't send history records, this also needs the change to the server I just pushed, i.e. server version 2.4.2. >>>>> >>>>> https://github.com/openvehicles/Open-Vehicle-Monitoring-System/commits/maste... >>>>> <https://github.com/openvehicles/Open-Vehicle-Monitoring-System/commits/master> >>>>> >>>>> Regards, >>>>> Michael >>>>> >>>>> >>>>> Am 05.09.19 um 19:55 schrieb Michael Balzer: >>>>>> I've pushed the nasty workaround: the v2 server checks for no RX over 15 minutes, then restarts the network (wifi & modem) as >>>>>> configured for autostart. >>>>>> >>>>>> Rolled out on my server in edge as 3.2.002-237-ge075f655. >>>>>> >>>>>> Please test. >>>>>> >>>>>> Regards, >>>>>> Michael >>>>>> >>>>>> >>>>>> Am 05.09.19 um 01:58 schrieb Mark Webb-Johnson: >>>>>>>> Mark, you can check your server logs for history messages with ridiculous time offsets: >>>>>>>> [sddexter@ns27 server]$ cat log-20190903 | egrep "rx msg h [0-9]+,-[0-9]{4}" | wc -l >>>>>>>> 455283 >>>>>>> >>>>>>> I checked my logs and see 12 vehicles showing this. But, 2 only show this for a debugcrash log (which is expected, I guess, if the >>>>>>> time is not synced at report time). I’ve got 4 cars with the offset > 10,000. >>>>>>> >>>>>>> Regards, Mark. >>>>>>> >>>>>>>> On 4 Sep 2019, at 4:45 AM, Michael Balzer <dexter@expeedo.de <mailto:dexter@expeedo.de> <mailto:dexter@expeedo.de>> wrote: >>>>>>>> >>>>>>>> Everyone, >>>>>>>> >>>>>>>> I've pushed a change that needs some testing. >>>>>>>> >>>>>>>> I had the issue myself now parking at a certain distance from my garage wifi AP, i.e. on the edge of "in", after wifi had been >>>>>>>> disconnected for some hours, and with the module still connected via modem. The wifi blob had been trying to connect to the AP >>>>>>>> for about two hours. >>>>>>>> >>>>>>>> As seen before, the module saw no error, just the server responses and commands stopped coming in. I noticed the default >>>>>>>> interface was still "st1" despite wifi having been disconnected and modem connected. The DNS was also still configured for my >>>>>>>> wifi network, and the interface seemed to have an IP address -- but wasn't pingable from the wifi network. >>>>>>>> >>>>>>>> A power cycle of the modem solved the issue without reboot. So the cause may be in the modem/ppp subsystem, or it may be related >>>>>>>> (in some weird way) to the default interface / DNS setup. >>>>>>>> >>>>>>>> More tests showed the default interface again/still got set by the wifi blob itself at some point, overriding our modem >>>>>>>> prioritization. The events we didn't handle up to now were "sta.connected" and "sta.lostip", so I added these, and the bug didn't >>>>>>>> show up again since then. That doesn't mean anything, so we need to test this. >>>>>>>> >>>>>>>> The default interface really shouldn't affect inbound packet routing of an established connection, but there always may be >>>>>>>> strange bugs lurking in those libs. >>>>>>>> >>>>>>>> The change also reimplements the wifi signal strength reading, as the tests also showed that still wasn't working well using the >>>>>>>> CSI callback. It now seems to be much more reliable. >>>>>>>> >>>>>>>> Please test & report. The single module will be hard to test, as the bug isn't reproducable easily, but you can still try if wifi >>>>>>>> / modem transitions work well. >>>>>>>> >>>>>>>> Mark, you can check your server logs for history messages with ridiculous time offsets: >>>>>>>> [sddexter@ns27 server]$ cat log-20190903 | egrep "rx msg h [0-9]+,-[0-9]{4}" | wc -l >>>>>>>> 455283 >>>>>>>> The bug now severely affects the V2 server performance, as the server is single threaded and doesn't scale very well to this kind >>>>>>>> of bulk data bursts, especially when coming from multiple modules in parallel. So we really need to solve this now. Slow >>>>>>>> reactions or connection drops from my server lately have been due to this bug. If this change doesn't solve it, we'll need to add >>>>>>>> some reboot trigger on "too many server v2 notification retransmissions" -- or maybe a modem power cycle will do, that wouldn't >>>>>>>> discard the data. >>>>>>>> >>>>>>>> Thanks, >>>>>>>> Michael >>>>>>>> >>>>>>>> >>>>>>>> Am 03.09.19 um 07:46 schrieb Mark Webb-Johnson: >>>>>>>>> No problem. We can hold. I won’t commit anything for the next few days (and agree to hold-off on Markos’s pull). Let me know >>>>>>>>> when you are ready. >>>>>>>>> >>>>>>>>> Regards, Mark. >>>>>>>>> >>>>>>>>>> On 3 Sep 2019, at 1:58 AM, Michael Balzer <dexter@expeedo.de <mailto:dexter@expeedo.de>> <mailto:dexter@expeedo.de> wrote: >>>>>>>>>> >>>>>>>>>> Mark, please wait. >>>>>>>>>> >>>>>>>>>> I may just have found the cause for issue #241, or at least something I need to investigate before releasing. >>>>>>>>>> >>>>>>>>>> I need to dig into my logs first, and try something. >>>>>>>>>> >>>>>>>>>> Regards, >>>>>>>>>> Michael >>>>>>>>>> >>>>>>>>>> >>>>>>>>>> Am 02.09.19 um 12:23 schrieb Michael Balzer: >>>>>>>>>>> Nothing open from my side at the moment. >>>>>>>>>>> >>>>>>>>>>> I haven't had the time to look in to Markos pull request, but from a first check also think that's going too deep to be >>>>>>>>>>> included in this release. >>>>>>>>>>> >>>>>>>>>>> Regards, >>>>>>>>>>> Michael >>>>>>>>>>> >>>>>>>>>>> >>>>>>>>>>> Am 02.09.19 um 04:15 schrieb Mark Webb-Johnson: >>>>>>>>>>>> I think it is well past time for a 3.2.003 release. Things seems table in edge (although some things only partially implemented). >>>>>>>>>>>> >>>>>>>>>>>> Anything people want to include at the last minute, or can we go ahead and build? >>>>>>>>>>>> >>>>>>>>>>>> Regards, Mark. >>>>>>>>>>>>
-- Michael Balzer * Helkenberger Weg 9 * D-58256 Ennepetal Fon 02333 / 833 5735 * Handy 0176 / 206 989 26
It has been a very very very long day 😵 Fixed to 7MB. Regards, Mark.
On 19 Sep 2019, at 4:52 PM, Michael Balzer <dexter@expeedo.de> wrote:
OK, but 700 MB is a bit exaggerated now ;)
Regards, Michael
Am 19.09.19 um 10:22 schrieb Mark Webb-Johnson:
OK, I’ve built:
2019-09-19 MWJ 3.2.005 OTA release - Default module/debug.tasks to FALSE Users that volunteer to submit tasks debug historical data to the Open Vehicles project, should (with appreciation) set: config set module debug.tasks yes This will be transmit approximately 700MB of data a month (over cellular/wifi).
2019-09-19 MWJ 3.2.004 OTA release - Skipped for Chinese superstitous reasons
In EAP now, and I will announce.
Regards, Mark.
On 19 Sep 2019, at 3:34 PM, Michael Balzer <dexter@expeedo.de <mailto:dexter@expeedo.de>> wrote:
Correct.
Regards, Michael
Am 19.09.19 um 09:29 schrieb Mark Webb-Johnson:
I’m just worried about the users who don’t know about this new feature. When they deploy this version, they suddenly start sending 6MB of data a month up to us.
I think the ‘fix’ is just to change ovms_module.c:
MyConfig.GetParamValueBool("module", "debug.tasks", true)
to
MyConfig.GetParamValueBool("module", "debug.tasks", false)
That would then only submit these logs for those that explicitly turn it on?
Regards, Mark.
On 19 Sep 2019, at 3:23 PM, Michael Balzer <dexter@expeedo.de <mailto:dexter@expeedo.de>> wrote:
Sorry, I didn't think about this being an issue elsewhere -- german data plans typically start at minimum 100 MB/month flat (that's my current plan at 3 € / month).
No need for a new release, it can be turned off OTA by issueing
config set module debug.tasks no
Regards, Michael
Am 19.09.19 um 09:08 schrieb Mark Webb-Johnson:
Yep:
758 bytes * (86400 / 300) * 30 = 6.5MB/month
That is going over data (not SD). Presumably cellular data for a large portion of the time.
I think we need to default this to OFF, and make a 3.2.004 to avoid this becoming an issue.
Regards, Mark.
> On 19 Sep 2019, at 2:04 PM, Stephen Casner <casner@acm.org <mailto:casner@acm.org>> wrote: > > That's 6.55MB/month, unless you have unusually short months! :-) > > In what space is that data stored? A log written to SD? That's not > likely to fill up the SD card too fast, but what happens if no SD card > is installed? > > -- Steve > > On Thu, 19 Sep 2019, Mark Webb-Johnson wrote: > >>> To enable CPU usage statistics, apply the changes to sdkconfig >>> included. >>> New history record: >>> - "*-OVM-DebugTasks" v1: <taskcnt,totaltime> + per task: >>> <tasknum,name,state,stack_now,stack_max,stack_total, >>> heap_total,heap_32bit,heap_spi,runtime> >>> Note: CPU core use percentage = runtime / totaltime >> >> I’ve just noticed that this is enabled by default now (my production build has the sdkconfig updated, as per defaults). >> >> I am seeing 758 bytes of history record, every 5 minutes. About 218KB/day, or 654KB/month. >> >> Should this be opt-in? >> >> Regards, Mark. >> >>> On 8 Sep 2019, at 5:43 PM, Michael Balzer <dexter@expeedo.de <mailto:dexter@expeedo.de>> wrote: >>> >>> I've pushed some modifications and improvements to (hopefully) fix the timer issue or at least be able to debug it. >>> >>> Some sdkconfig changes are necessary. >>> >>> The build including these updates is on my edge release as 3.2.002-258-g20ae554b. >>> >>> Btw: the network restart strategy seems to mitigate issue #241; I've seen a major drop on record repetitions on my server since the rollout. >>> >>> >>> commit 99e4e48bdd40b7004c0976f51aba9e3da4ecab53 >>> >>> Module: add per task CPU usage statistics, add task stats history records >>> >>> To enable CPU usage statistics, apply the changes to sdkconfig >>> included. The CPU usage shown by the commands is calculated against >>> the last task status retrieved (or system boot). >>> >>> Command changes: >>> - "module tasks" -- added CPU (core) usage in percent per task >>> >>> New command: >>> - "module tasks data" -- output task stats in history record form >>> >>> New config: >>> - [module] debug.tasks -- yes (default) = send task stats every 5 minutes >>> >>> New history record: >>> - "*-OVM-DebugTasks" v1: <taskcnt,totaltime> + per task: >>> <tasknum,name,state,stack_now,stack_max,stack_total, >>> heap_total,heap_32bit,heap_spi,runtime> >>> Note: CPU core use percentage = runtime / totaltime >>> >>> commit 950172c216a72beb4da0bc7a40a46995a6105955 >>> >>> Build config: default timer service task priority raised to 20 >>> >>> Background: the FreeRTOS timer service shall only be used for very >>> short and non-blocking jobs. We delegate event processing to our >>> events task, anything else in timers needs to run with high >>> priority. >>> >>> commit 31ac19d187480046c16356b80668de45cacbb83d >>> >>> DukTape: add build config for task priority, default lowered to 3 >>> >>> Background: the DukTape garbage collector shall run on lower >>> priority than tasks like SIMCOM & events >>> >>> commit e0a44791fbcfb5a4e4cad24c9d1163b76e637b4f >>> >>> Server V2: use esp_log_timestamp for timeout detection, >>> add timeout config, limit data records & size per second >>> >>> New config: >>> - [server.v2] timeout.rx -- timeout in seconds, default 960 >>> >>> commit 684a4ce9525175a910040f0d1ca82ac212fbf5de >>> >>> Notify: use esp_log_timestamp for creation time instead of monotonictime >>> to harden against timer service starvation / ticker event drops >>> >>> >>> Regards, >>> Michael >>> >>> >>> Am 07.09.19 um 10:55 schrieb Michael Balzer: >>>> I think the RTOS timer service task starves. It's running on core 0 with priority 1. >>>> >>>> Taks on core 0 sorted by priority: >>>> >>>> Number of Tasks = 20 Stack: Now Max Total Heap 32-bit SPIRAM C# PRI >>>> 3FFC84A8 6 Blk ipc0 388 500 1024 7788 0 0 0 24 >>>> 3FFC77F0 5 Blk OVMS CanRx 428 428 2048 3052 0 31844 0 23 >>>> 3FFAFBF4 1 Blk esp_timer 400 656 4096 35928 644 25804 0 22 >>>> 3FFD3240 19 Blk wifi 460 2716 3584 43720 0 20 0 22 >>>> 3FFC03C4 2 Blk eventTask 448 1984 4608 104 0 0 0 20 >>>> 3FFC8F14 17 Blk tiT 500 2308 3072 6552 0 0 * 18 >>>> 3FFE14F0 26 Blk OVMS COrx 456 456 4096 0 0 0 0 7 >>>> 3FFE19D4 27 Blk OVMS COwrk 476 476 3072 0 0 0 0 7 >>>> 3FFCBC34 12 Blk Tmr Svc 352 928 3072 88 0 0 0 1 >>>> 3FFE7708 23 Blk mdns 468 1396 4096 108 0 0 0 1 >>>> >>>> I don't think it's our CanRx, as that only fetches and queues CAN frames, the actual work is done by the listeners. The CO tasks only run for CANopen jobs, which are few for normal operation. >>>> >>>> That leaves the system tasks, with main suspect -once again- the wifi blob. >>>> >>>> We need to know how much CPU time the tasks actually use now. I think I saw some option for this in the FreeRTOS config. >>>> >>>> Regards, >>>> Michael >>>> >>>> >>>> Am 06.09.19 um 23:15 schrieb Michael Balzer: >>>>> The workaround is based on the monotonictime being updated per second, as do the history record offsets. >>>>> >>>>> Apparently, that mechanism doesn't work reliably. That may be an indicator for some bigger underlying issue. >>>>> >>>>> Example log excerpt: >>>>> >>>>> 2019-09-06 22:07:48.126919 +0200 info main: #173 C MITPROHB rx msg h 964,0,RT-BAT-C,5,86400,2,1,3830,3795,3830,-10,25,25,25,0 >>>>> 2019-09-06 22:09:03.089031 +0200 info main: #173 C MITPROHB rx msg h 964,-10,RT-BAT-C,5,86400,2,1,3830,3795,3830,-10,25,25,25,0 >>>>> 2019-09-06 22:09:05.041574 +0200 info main: #173 C MITPROHB rx msg h 964,-20,RT-BAT-C,5,86400,2,1,3830,3795,3830,-10,25,25,25,0 >>>>> 2019-09-06 22:09:05.052644 +0200 info main: #173 C MITPROHB rx msg h 964,-30,RT-BAT-C,5,86400,2,1,3830,3795,3830,-10,25,25,25,0 >>>>> 2019-09-06 22:09:05.063617 +0200 info main: #173 C MITPROHB rx msg h 964,-49,RT-BAT-C,5,86400,2,1,3830,3795,3830,-10,25,25,25,0 >>>>> 2019-09-06 22:09:05.077527 +0200 info main: #173 C MITPROHB rx msg h 964,-59,RT-BAT-C,5,86400,2,1,3830,3795,3830,-10,25,25,25,0 >>>>> 2019-09-06 22:09:05.193775 +0200 info main: #173 C MITPROHB rx msg h 964,-70,RT-BAT-C,5,86400,2,1,3830,3795,3830,-10,25,25,25,0 >>>>> 2019-09-06 22:09:13.190645 +0200 info main: #173 C MITPROHB rx msg h 964,-80,RT-BAT-C,5,86400,2,1,3830,3795,3830,-10,25,25,25,0 >>>>> 2019-09-06 22:09:22.077994 +0200 info main: #173 C MITPROHB rx msg h 964,-90,RT-BAT-C,5,86400,2,1,3830,3795,3830,-10,25,25,25,0 >>>>> 2019-09-06 22:09:54.590300 +0200 info main: #173 C MITPROHB rx msg h 964,-109,RT-BAT-C,5,86400,2,1,3830,3795,3830,-10,25,25,25,0 >>>>> 2019-09-06 22:11:10.127054 +0200 info main: #173 C MITPROHB rx msg h 964,-119,RT-BAT-C,5,86400,2,1,3830,3795,3830,-10,25,25,25,0 >>>>> 2019-09-06 22:11:16.794200 +0200 info main: #173 C MITPROHB rx msg h 964,-130,RT-BAT-C,5,86400,2,1,3830,3795,3830,-10,25,25,25,0 >>>>> 2019-09-06 22:11:22.455652 +0200 info main: #173 C MITPROHB rx msg h 964,-140,RT-BAT-C,5,86400,2,1,3830,3795,3830,-10,25,25,25,0 >>>>> 2019-09-06 22:12:49.423412 +0200 info main: #173 C MITPROHB rx msg h 964,-150,RT-BAT-C,5,86400,2,1,3830,3795,3830,-10,25,25,25,0 >>>>> 2019-09-06 22:12:49.442096 +0200 info main: #173 C MITPROHB rx msg h 964,-169,RT-BAT-C,5,86400,2,1,3830,3795,3830,-10,25,25,25,0 >>>>> 2019-09-06 22:12:49.461941 +0200 info main: #173 C MITPROHB rx msg h 964,-179,RT-BAT-C,5,86400,2,1,3830,3795,3830,-10,25,25,25,0 >>>>> 2019-09-06 22:14:39.828133 +0200 info main: #173 C MITPROHB rx msg h 964,-190,RT-BAT-C,5,86400,2,1,3830,3795,3830,-10,25,25,25,0 >>>>> 2019-09-06 22:14:39.858144 +0200 info main: #173 C MITPROHB rx msg h 964,-200,RT-BAT-C,5,86400,2,1,3830,3795,3830,-10,25,25,25,0 >>>>> 2019-09-06 22:14:52.020319 +0200 info main: #173 C MITPROHB rx msg h 964,-210,RT-BAT-C,5,86400,2,1,3830,3795,3830,-10,25,25,25,0 >>>>> 2019-09-06 22:14:54.452637 +0200 info main: #173 C MITPROHB rx msg h 964,-229,RT-BAT-C,5,86400,2,1,3830,3795,3830,-10,25,25,25,0 >>>>> 2019-09-06 22:15:12.613935 +0200 info main: #173 C MITPROHB rx msg h 964,-239,RT-BAT-C,5,86400,2,1,3830,3795,3830,-10,25,25,25,0 >>>>> 2019-09-06 22:15:35.223845 +0200 info main: #173 C MITPROHB rx msg h 964,-250,RT-BAT-C,5,86400,2,1,3830,3795,3830,-10,25,25,25,0 >>>>> 2019-09-06 22:16:09.255059 +0200 info main: #173 C MITPROHB rx msg h 964,-260,RT-BAT-C,5,86400,2,1,3830,3795,3830,-10,25,25,25,0 >>>>> 2019-09-06 22:17:31.919754 +0200 info main: #173 C MITPROHB rx msg h 964,-270,RT-BAT-C,5,86400,2,1,3830,3795,3830,-10,25,25,25,0 >>>>> 2019-09-06 22:19:23.366267 +0200 info main: #173 C MITPROHB rx msg h 964,-289,RT-BAT-C,5,86400,2,1,3830,3795,3830,-10,25,25,25,0 >>>>> 2019-09-06 22:21:57.344609 +0200 info main: #173 C MITPROHB rx msg h 964,-299,RT-BAT-C,5,86400,2,1,3830,3795,3830,-10,25,25,25,0 >>>>> 2019-09-06 22:23:40.082406 +0200 info main: #31 C MITPROHB rx msg h 964,-1027,RT-BAT-C,5,86400,2,1,3830,3795,3830,-10,25,25,25,0 >>>>> 2019-09-06 22:25:58.061883 +0200 info main: #31 C MITPROHB rx msg h 964,-1040,RT-BAT-C,5,86400,2,1,3830,3795,3830,-10,25,25,25,0 >>>>> >>>>> >>>>> This shows the ticker was only run 299 times from 22:07:48 to 22:21:57. >>>>> >>>>> After 22:21:57 the workaround was triggered and did a reconnect. Apparently during that network reinitialization of 103 seconds, the per second ticker was run 628 times. >>>>> >>>>> That can't be catching up on the event queue, as that queue has only 20 slots. So something strange is going on here. >>>>> >>>>> Any ideas? >>>>> >>>>> Regards, >>>>> Michael >>>>> >>>>> >>>>> Am 06.09.19 um 08:04 schrieb Michael Balzer: >>>>>> Mark & anyone else running a V2 server, >>>>>> >>>>>> as most cars don't send history records, this also needs the change to the server I just pushed, i.e. server version 2.4.2. >>>>>> >>>>>> https://github.com/openvehicles/Open-Vehicle-Monitoring-System/commits/maste... <https://github.com/openvehicles/Open-Vehicle-Monitoring-System/commits/master> <https://github.com/openvehicles/Open-Vehicle-Monitoring-System/commits/maste... <https://github.com/openvehicles/Open-Vehicle-Monitoring-System/commits/master>> >>>>>> >>>>>> Regards, >>>>>> Michael >>>>>> >>>>>> >>>>>> Am 05.09.19 um 19:55 schrieb Michael Balzer: >>>>>>> I've pushed the nasty workaround: the v2 server checks for no RX over 15 minutes, then restarts the network (wifi & modem) as configured for autostart. >>>>>>> >>>>>>> Rolled out on my server in edge as 3.2.002-237-ge075f655. >>>>>>> >>>>>>> Please test. >>>>>>> >>>>>>> Regards, >>>>>>> Michael >>>>>>> >>>>>>> >>>>>>> Am 05.09.19 um 01:58 schrieb Mark Webb-Johnson: >>>>>>>>> Mark, you can check your server logs for history messages with ridiculous time offsets: >>>>>>>>> [sddexter@ns27 server]$ cat log-20190903 | egrep "rx msg h [0-9]+,-[0-9]{4}" | wc -l >>>>>>>>> 455283 >>>>>>>> >>>>>>>> I checked my logs and see 12 vehicles showing this. But, 2 only show this for a debugcrash log (which is expected, I guess, if the time is not synced at report time). I’ve got 4 cars with the offset > 10,000. >>>>>>>> >>>>>>>> Regards, Mark. >>>>>>>> >>>>>>>>> On 4 Sep 2019, at 4:45 AM, Michael Balzer <dexter@expeedo.de <mailto:dexter@expeedo.de> <mailto:dexter@expeedo.de <mailto:dexter@expeedo.de>>> wrote: >>>>>>>>> >>>>>>>>> Everyone, >>>>>>>>> >>>>>>>>> I've pushed a change that needs some testing. >>>>>>>>> >>>>>>>>> I had the issue myself now parking at a certain distance from my garage wifi AP, i.e. on the edge of "in", after wifi had been disconnected for some hours, and with the module still connected via modem. The wifi blob had been trying to connect to the AP for about two hours. >>>>>>>>> >>>>>>>>> As seen before, the module saw no error, just the server responses and commands stopped coming in. I noticed the default interface was still "st1" despite wifi having been disconnected and modem connected. The DNS was also still configured for my wifi network, and the interface seemed to have an IP address -- but wasn't pingable from the wifi network. >>>>>>>>> >>>>>>>>> A power cycle of the modem solved the issue without reboot. So the cause may be in the modem/ppp subsystem, or it may be related (in some weird way) to the default interface / DNS setup. >>>>>>>>> >>>>>>>>> More tests showed the default interface again/still got set by the wifi blob itself at some point, overriding our modem prioritization. The events we didn't handle up to now were "sta.connected" and "sta.lostip", so I added these, and the bug didn't show up again since then. That doesn't mean anything, so we need to test this. >>>>>>>>> >>>>>>>>> The default interface really shouldn't affect inbound packet routing of an established connection, but there always may be strange bugs lurking in those libs. >>>>>>>>> >>>>>>>>> The change also reimplements the wifi signal strength reading, as the tests also showed that still wasn't working well using the CSI callback. It now seems to be much more reliable. >>>>>>>>> >>>>>>>>> Please test & report. The single module will be hard to test, as the bug isn't reproducable easily, but you can still try if wifi / modem transitions work well. >>>>>>>>> >>>>>>>>> Mark, you can check your server logs for history messages with ridiculous time offsets: >>>>>>>>> [sddexter@ns27 server]$ cat log-20190903 | egrep "rx msg h [0-9]+,-[0-9]{4}" | wc -l >>>>>>>>> 455283 >>>>>>>>> The bug now severely affects the V2 server performance, as the server is single threaded and doesn't scale very well to this kind of bulk data bursts, especially when coming from multiple modules in parallel. So we really need to solve this now. Slow reactions or connection drops from my server lately have been due to this bug. If this change doesn't solve it, we'll need to add some reboot trigger on "too many server v2 notification retransmissions" -- or maybe a modem power cycle will do, that wouldn't discard the data. >>>>>>>>> >>>>>>>>> Thanks, >>>>>>>>> Michael >>>>>>>>> >>>>>>>>> >>>>>>>>> Am 03.09.19 um 07:46 schrieb Mark Webb-Johnson: >>>>>>>>>> No problem. We can hold. I won’t commit anything for the next few days (and agree to hold-off on Markos’s pull). Let me know when you are ready. >>>>>>>>>> >>>>>>>>>> Regards, Mark. >>>>>>>>>> >>>>>>>>>>> On 3 Sep 2019, at 1:58 AM, Michael Balzer <dexter@expeedo.de <mailto:dexter@expeedo.de>> <mailto:dexter@expeedo.de <mailto:dexter@expeedo.de>> wrote: >>>>>>>>>>> >>>>>>>>>>> Mark, please wait. >>>>>>>>>>> >>>>>>>>>>> I may just have found the cause for issue #241, or at least something I need to investigate before releasing. >>>>>>>>>>> >>>>>>>>>>> I need to dig into my logs first, and try something. >>>>>>>>>>> >>>>>>>>>>> Regards, >>>>>>>>>>> Michael >>>>>>>>>>> >>>>>>>>>>> >>>>>>>>>>> Am 02.09.19 um 12:23 schrieb Michael Balzer: >>>>>>>>>>>> Nothing open from my side at the moment. >>>>>>>>>>>> >>>>>>>>>>>> I haven't had the time to look in to Markos pull request, but from a first check also think that's going too deep to be included in this release. >>>>>>>>>>>> >>>>>>>>>>>> Regards, >>>>>>>>>>>> Michael >>>>>>>>>>>> >>>>>>>>>>>> >>>>>>>>>>>> Am 02.09.19 um 04:15 schrieb Mark Webb-Johnson: >>>>>>>>>>>>> I think it is well past time for a 3.2.003 release. Things seems table in edge (although some things only partially implemented). >>>>>>>>>>>>> >>>>>>>>>>>>> Anything people want to include at the last minute, or can we go ahead and build? >>>>>>>>>>>>> >>>>>>>>>>>>> Regards, Mark. >>>>>>>>>>>>>
-- Michael Balzer * Helkenberger Weg 9 * D-58256 Ennepetal Fon 02333 / 833 5735 * Handy 0176 / 206 989 26 _______________________________________________ OvmsDev mailing list OvmsDev@lists.openvehicles.com http://lists.openvehicles.com/mailman/listinfo/ovmsdev

Thanks for the fix, sending that much data would drain my Hologram account quite rapidly. I'm still using the included $5. So far OVMS has drained about 15c in 8 months and that already seems like too much. On Thu., Sep. 19, 2019, 05:04 Mark Webb-Johnson, <mark@webb-johnson.net> wrote:
It has been a very very very long day 😵
Fixed to 7MB.
Regards, Mark.
On 19 Sep 2019, at 4:52 PM, Michael Balzer <dexter@expeedo.de> wrote:
OK, but 700 MB is a bit exaggerated now ;)
Regards, Michael
Am 19.09.19 um 10:22 schrieb Mark Webb-Johnson:
OK, I’ve built:
2019-09-19 MWJ 3.2.005 OTA release - Default module/debug.tasks to FALSE Users that volunteer to submit tasks debug historical data to the Open Vehicles project, should (with appreciation) set: config set module debug.tasks yes This will be transmit approximately 700MB of data a month (over cellular/wifi).
2019-09-19 MWJ 3.2.004 OTA release - Skipped for Chinese superstitous reasons
In EAP now, and I will announce.
Regards, Mark.
On 19 Sep 2019, at 3:34 PM, Michael Balzer <dexter@expeedo.de> wrote:
Correct.
Regards, Michael
Am 19.09.19 um 09:29 schrieb Mark Webb-Johnson:
I’m just worried about the users who don’t know about this new feature. When they deploy this version, they suddenly start sending 6MB of data a month up to us.
I think the ‘fix’ is just to change ovms_module.c:
MyConfig.GetParamValueBool("module", "debug.tasks", true)
to
MyConfig.GetParamValueBool("module", "debug.tasks", false)
That would then only submit these logs for those that explicitly turn it on?
Regards, Mark.
On 19 Sep 2019, at 3:23 PM, Michael Balzer <dexter@expeedo.de> wrote:
Sorry, I didn't think about this being an issue elsewhere -- german data plans typically start at minimum 100 MB/month flat (that's my current plan at 3 € / month).
No need for a new release, it can be turned off OTA by issueing
config set module debug.tasks no
Regards, Michael
Am 19.09.19 um 09:08 schrieb Mark Webb-Johnson:
Yep:
758 bytes * (86400 / 300) * 30 = 6.5MB/month
That is going over data (not SD). Presumably cellular data for a large portion of the time.
I think we need to default this to OFF, and make a 3.2.004 to avoid this becoming an issue.
Regards, Mark.
On 19 Sep 2019, at 2:04 PM, Stephen Casner <casner@acm.org> wrote:
That's 6.55MB/month, unless you have unusually short months! :-)
In what space is that data stored? A log written to SD? That's not likely to fill up the SD card too fast, but what happens if no SD card is installed?
-- Steve
On Thu, 19 Sep 2019, Mark Webb-Johnson wrote:
To enable CPU usage statistics, apply the changes to sdkconfig included. New history record: - "*-OVM-DebugTasks" v1: <taskcnt,totaltime> + per task: <tasknum,name,state,stack_now,stack_max,stack_total, heap_total,heap_32bit,heap_spi,runtime> Note: CPU core use percentage = runtime / totaltime
I’ve just noticed that this is enabled by default now (my production build has the sdkconfig updated, as per defaults).
I am seeing 758 bytes of history record, every 5 minutes. About 218KB/day, or 654KB/month.
Should this be opt-in?
Regards, Mark.
On 8 Sep 2019, at 5:43 PM, Michael Balzer <dexter@expeedo.de> wrote:
I've pushed some modifications and improvements to (hopefully) fix the timer issue or at least be able to debug it.
Some sdkconfig changes are necessary.
The build including these updates is on my edge release as 3.2.002-258-g20ae554b.
Btw: the network restart strategy seems to mitigate issue #241; I've seen a major drop on record repetitions on my server since the rollout.
commit 99e4e48bdd40b7004c0976f51aba9e3da4ecab53
Module: add per task CPU usage statistics, add task stats history records
To enable CPU usage statistics, apply the changes to sdkconfig included. The CPU usage shown by the commands is calculated against the last task status retrieved (or system boot).
Command changes: - "module tasks" -- added CPU (core) usage in percent per task
New command: - "module tasks data" -- output task stats in history record form
New config: - [module] debug.tasks -- yes (default) = send task stats every 5 minutes
New history record: - "*-OVM-DebugTasks" v1: <taskcnt,totaltime> + per task: <tasknum,name,state,stack_now,stack_max,stack_total, heap_total,heap_32bit,heap_spi,runtime> Note: CPU core use percentage = runtime / totaltime
commit 950172c216a72beb4da0bc7a40a46995a6105955
Build config: default timer service task priority raised to 20
Background: the FreeRTOS timer service shall only be used for very short and non-blocking jobs. We delegate event processing to our events task, anything else in timers needs to run with high priority.
commit 31ac19d187480046c16356b80668de45cacbb83d
DukTape: add build config for task priority, default lowered to 3
Background: the DukTape garbage collector shall run on lower priority than tasks like SIMCOM & events
commit e0a44791fbcfb5a4e4cad24c9d1163b76e637b4f
Server V2: use esp_log_timestamp for timeout detection, add timeout config, limit data records & size per second
New config: - [server.v2] timeout.rx -- timeout in seconds, default 960
commit 684a4ce9525175a910040f0d1ca82ac212fbf5de
Notify: use esp_log_timestamp for creation time instead of monotonictime to harden against timer service starvation / ticker event drops
Regards, Michael
Am 07.09.19 um 10:55 schrieb Michael Balzer:
I think the RTOS timer service task starves. It's running on core 0 with priority 1.
Taks on core 0 sorted by priority:
Number of Tasks = 20 Stack: Now Max Total Heap 32-bit SPIRAM C# PRI 3FFC84A8 6 Blk ipc0 388 500 1024 7788 0 0 0 24 3FFC77F0 5 Blk OVMS CanRx 428 428 2048 3052 0 31844 0 23 3FFAFBF4 1 Blk esp_timer 400 656 4096 35928 644 25804 0 22 3FFD3240 19 Blk wifi 460 2716 3584 43720 0 20 0 22 3FFC03C4 2 Blk eventTask 448 1984 4608 104 0 0 0 20 3FFC8F14 17 Blk tiT 500 2308 3072 6552 0 0 * 18 3FFE14F0 26 Blk OVMS COrx 456 456 4096 0 0 0 0 7 3FFE19D4 27 Blk OVMS COwrk 476 476 3072 0 0 0 0 7 3FFCBC34 12 Blk Tmr Svc 352 928 3072 88 0 0 0 1 3FFE7708 23 Blk mdns 468 1396 4096 108 0 0 0 1
I don't think it's our CanRx, as that only fetches and queues CAN frames, the actual work is done by the listeners. The CO tasks only run for CANopen jobs, which are few for normal operation.
That leaves the system tasks, with main suspect -once again- the wifi blob.
We need to know how much CPU time the tasks actually use now. I think I saw some option for this in the FreeRTOS config.
Regards, Michael
Am 06.09.19 um 23:15 schrieb Michael Balzer:
The workaround is based on the monotonictime being updated per second, as do the history record offsets.
Apparently, that mechanism doesn't work reliably. That may be an indicator for some bigger underlying issue.
Example log excerpt:
2019-09-06 22:07:48.126919 +0200 info main: #173 C MITPROHB rx msg h 964,0,RT-BAT-C,5,86400,2,1,3830,3795,3830,-10,25,25,25,0 2019-09-06 22:09:03.089031 +0200 info main: #173 C MITPROHB rx msg h 964,-10,RT-BAT-C,5,86400,2,1,3830,3795,3830,-10,25,25,25,0 2019-09-06 22:09:05.041574 +0200 info main: #173 C MITPROHB rx msg h 964,-20,RT-BAT-C,5,86400,2,1,3830,3795,3830,-10,25,25,25,0 2019-09-06 22:09:05.052644 +0200 info main: #173 C MITPROHB rx msg h 964,-30,RT-BAT-C,5,86400,2,1,3830,3795,3830,-10,25,25,25,0 2019-09-06 22:09:05.063617 +0200 info main: #173 C MITPROHB rx msg h 964,-49,RT-BAT-C,5,86400,2,1,3830,3795,3830,-10,25,25,25,0 2019-09-06 22:09:05.077527 +0200 info main: #173 C MITPROHB rx msg h 964,-59,RT-BAT-C,5,86400,2,1,3830,3795,3830,-10,25,25,25,0 2019-09-06 22:09:05.193775 +0200 info main: #173 C MITPROHB rx msg h 964,-70,RT-BAT-C,5,86400,2,1,3830,3795,3830,-10,25,25,25,0 2019-09-06 22:09:13.190645 +0200 info main: #173 C MITPROHB rx msg h 964,-80,RT-BAT-C,5,86400,2,1,3830,3795,3830,-10,25,25,25,0 2019-09-06 22:09:22.077994 +0200 info main: #173 C MITPROHB rx msg h 964,-90,RT-BAT-C,5,86400,2,1,3830,3795,3830,-10,25,25,25,0 2019-09-06 22:09:54.590300 +0200 info main: #173 C MITPROHB rx msg h 964,-109,RT-BAT-C,5,86400,2,1,3830,3795,3830,-10,25,25,25,0 2019-09-06 22:11:10.127054 +0200 info main: #173 C MITPROHB rx msg h 964,-119,RT-BAT-C,5,86400,2,1,3830,3795,3830,-10,25,25,25,0 2019-09-06 22:11:16.794200 +0200 info main: #173 C MITPROHB rx msg h 964,-130,RT-BAT-C,5,86400,2,1,3830,3795,3830,-10,25,25,25,0 2019-09-06 22:11:22.455652 +0200 info main: #173 C MITPROHB rx msg h 964,-140,RT-BAT-C,5,86400,2,1,3830,3795,3830,-10,25,25,25,0 2019-09-06 22:12:49.423412 +0200 info main: #173 C MITPROHB rx msg h 964,-150,RT-BAT-C,5,86400,2,1,3830,3795,3830,-10,25,25,25,0 2019-09-06 22:12:49.442096 +0200 info main: #173 C MITPROHB rx msg h 964,-169,RT-BAT-C,5,86400,2,1,3830,3795,3830,-10,25,25,25,0 2019-09-06 22:12:49.461941 +0200 info main: #173 C MITPROHB rx msg h 964,-179,RT-BAT-C,5,86400,2,1,3830,3795,3830,-10,25,25,25,0 2019-09-06 22:14:39.828133 +0200 info main: #173 C MITPROHB rx msg h 964,-190,RT-BAT-C,5,86400,2,1,3830,3795,3830,-10,25,25,25,0 2019-09-06 22:14:39.858144 +0200 info main: #173 C MITPROHB rx msg h 964,-200,RT-BAT-C,5,86400,2,1,3830,3795,3830,-10,25,25,25,0 2019-09-06 22:14:52.020319 +0200 info main: #173 C MITPROHB rx msg h 964,-210,RT-BAT-C,5,86400,2,1,3830,3795,3830,-10,25,25,25,0 2019-09-06 22:14:54.452637 +0200 info main: #173 C MITPROHB rx msg h 964,-229,RT-BAT-C,5,86400,2,1,3830,3795,3830,-10,25,25,25,0 2019-09-06 22:15:12.613935 +0200 info main: #173 C MITPROHB rx msg h 964,-239,RT-BAT-C,5,86400,2,1,3830,3795,3830,-10,25,25,25,0 2019-09-06 22:15:35.223845 +0200 info main: #173 C MITPROHB rx msg h 964,-250,RT-BAT-C,5,86400,2,1,3830,3795,3830,-10,25,25,25,0 2019-09-06 22:16:09.255059 +0200 info main: #173 C MITPROHB rx msg h 964,-260,RT-BAT-C,5,86400,2,1,3830,3795,3830,-10,25,25,25,0 2019-09-06 22:17:31.919754 +0200 info main: #173 C MITPROHB rx msg h 964,-270,RT-BAT-C,5,86400,2,1,3830,3795,3830,-10,25,25,25,0 2019-09-06 22:19:23.366267 +0200 info main: #173 C MITPROHB rx msg h 964,-289,RT-BAT-C,5,86400,2,1,3830,3795,3830,-10,25,25,25,0 2019-09-06 22:21:57.344609 +0200 info main: #173 C MITPROHB rx msg h 964,-299,RT-BAT-C,5,86400,2,1,3830,3795,3830,-10,25,25,25,0 2019-09-06 22:23:40.082406 +0200 info main: #31 C MITPROHB rx msg h 964,-1027,RT-BAT-C,5,86400,2,1,3830,3795,3830,-10,25,25,25,0 2019-09-06 22:25:58.061883 +0200 info main: #31 C MITPROHB rx msg h 964,-1040,RT-BAT-C,5,86400,2,1,3830,3795,3830,-10,25,25,25,0
This shows the ticker was only run 299 times from 22:07:48 to 22:21:57.
After 22:21:57 the workaround was triggered and did a reconnect. Apparently during that network reinitialization of 103 seconds, the per second ticker was run 628 times.
That can't be catching up on the event queue, as that queue has only 20 slots. So something strange is going on here.
Any ideas?
Regards, Michael
Am 06.09.19 um 08:04 schrieb Michael Balzer:
Mark & anyone else running a V2 server,
as most cars don't send history records, this also needs the change to the server I just pushed, i.e. server version 2.4.2.
https://github.com/openvehicles/Open-Vehicle-Monitoring-System/commits/maste... < https://github.com/openvehicles/Open-Vehicle-Monitoring-System/commits/maste...
Regards, Michael
Am 05.09.19 um 19:55 schrieb Michael Balzer:
I've pushed the nasty workaround: the v2 server checks for no RX over 15 minutes, then restarts the network (wifi & modem) as configured for autostart.
Rolled out on my server in edge as 3.2.002-237-ge075f655.
Please test.
Regards, Michael
Am 05.09.19 um 01:58 schrieb Mark Webb-Johnson:
Mark, you can check your server logs for history messages with ridiculous time offsets: [sddexter@ns27 server]$ cat log-20190903 | egrep "rx msg h [0-9]+,-[0-9]{4}" | wc -l 455283
I checked my logs and see 12 vehicles showing this. But, 2 only show this for a debugcrash log (which is expected, I guess, if the time is not synced at report time). I’ve got 4 cars with the offset > 10,000.
Regards, Mark.
On 4 Sep 2019, at 4:45 AM, Michael Balzer <dexter@expeedo.de < mailto:dexter@expeedo.de <dexter@expeedo.de>>> wrote:
Everyone,
I've pushed a change that needs some testing.
I had the issue myself now parking at a certain distance from my garage wifi AP, i.e. on the edge of "in", after wifi had been disconnected for some hours, and with the module still connected via modem. The wifi blob had been trying to connect to the AP for about two hours.
As seen before, the module saw no error, just the server responses and commands stopped coming in. I noticed the default interface was still "st1" despite wifi having been disconnected and modem connected. The DNS was also still configured for my wifi network, and the interface seemed to have an IP address -- but wasn't pingable from the wifi network.
A power cycle of the modem solved the issue without reboot. So the cause may be in the modem/ppp subsystem, or it may be related (in some weird way) to the default interface / DNS setup.
More tests showed the default interface again/still got set by the wifi blob itself at some point, overriding our modem prioritization. The events we didn't handle up to now were "sta.connected" and "sta.lostip", so I added these, and the bug didn't show up again since then. That doesn't mean anything, so we need to test this.
The default interface really shouldn't affect inbound packet routing of an established connection, but there always may be strange bugs lurking in those libs.
The change also reimplements the wifi signal strength reading, as the tests also showed that still wasn't working well using the CSI callback. It now seems to be much more reliable.
Please test & report. The single module will be hard to test, as the bug isn't reproducable easily, but you can still try if wifi / modem transitions work well.
Mark, you can check your server logs for history messages with ridiculous time offsets: [sddexter@ns27 server]$ cat log-20190903 | egrep "rx msg h [0-9]+,-[0-9]{4}" | wc -l 455283 The bug now severely affects the V2 server performance, as the server is single threaded and doesn't scale very well to this kind of bulk data bursts, especially when coming from multiple modules in parallel. So we really need to solve this now. Slow reactions or connection drops from my server lately have been due to this bug. If this change doesn't solve it, we'll need to add some reboot trigger on "too many server v2 notification retransmissions" -- or maybe a modem power cycle will do, that wouldn't discard the data.
Thanks, Michael
Am 03.09.19 um 07:46 schrieb Mark Webb-Johnson:
No problem. We can hold. I won’t commit anything for the next few days (and agree to hold-off on Markos’s pull). Let me know when you are ready.
Regards, Mark.
On 3 Sep 2019, at 1:58 AM, Michael Balzer <dexter@expeedo.de> < mailto:dexter@expeedo.de <dexter@expeedo.de>> wrote:
Mark, please wait.
I may just have found the cause for issue #241, or at least something I need to investigate before releasing.
I need to dig into my logs first, and try something.
Regards, Michael
Am 02.09.19 um 12:23 schrieb Michael Balzer:
Nothing open from my side at the moment.
I haven't had the time to look in to Markos pull request, but from a first check also think that's going too deep to be included in this release.
Regards, Michael
Am 02.09.19 um 04:15 schrieb Mark Webb-Johnson:
I think it is well past time for a 3.2.003 release. Things seems table in edge (although some things only partially implemented).
Anything people want to include at the last minute, or can we go ahead and build?
Regards, Mark.
-- Michael Balzer * Helkenberger Weg 9 * D-58256 Ennepetal Fon 02333 / 833 5735 * Handy 0176 / 206 989 26
_______________________________________________ OvmsDev mailing list OvmsDev@lists.openvehicles.com http://lists.openvehicles.com/mailman/listinfo/ovmsdev
_______________________________________________ OvmsDev mailing list OvmsDev@lists.openvehicles.com http://lists.openvehicles.com/mailman/listinfo/ovmsdev
Bernd, please check your Wifi signal level against the default thresholds (see commit 057f14442ba96c2711d1887a5da2faf85b0f2517), also provide a debug level log of the failing reconnect situation. Regards, Michael Am 19.09.19 um 13:28 schrieb Bernd Geistert:
It seems that with 3.2.003 the module doesn't reconnect toa sufficient wifi, as before. I don't like to send all the data through 1 MB/month Hologram plan, also.
-- Michael Balzer * Helkenberger Weg 9 * D-58256 Ennepetal Fon 02333 / 833 5735 * Handy 0176 / 206 989 26

Numerology and pronunciation. The number 4 (pronounced like ’say’ in cantonese - the dialect we speak in Hong Kong) sounds similar to ‘death’. It is considered unlucky and generally avoided. While you may not have a 13th floor in western cultures, in China the floor numbers in apartment blocks generally go 1, 2, 3, 5, …, 12, 13, 15, … In contrast, Chinese people love the number 8 (pronounced ‘baat' in cantonese) as it is similar to ‘luck' (pronounced 'faat'). I live in house #8 in my housing estate, which is considered good luck. However, as we don’t have a house #4, I guess my place is really the seventh, and house #9 should be considered the lucky one - but we don’t think too much about that. We do have a house #13. In cantonese, the one I hate is 14 (pronounced 'sup say'), which sounds almost the same as 'water death'. We can never stop after swimming 14 laps in a pool - always have to stop at 13 or go on to 15. The Cantonese and Mandarin dialects of Chinese have different pronunciations, but the numbers 4 and 8 are generally treated unlucky and lucky universally out here. Regards, Mark.
On 20 Sep 2019, at 9:38 AM, Greg D. <gregd2350@gmail.com> wrote:
Always curious about other cultures... What is the superstition, or would it be a problem to discuss for superstitious reasons?
Greg
Mark Webb-Johnson wrote:
2019-09-19 MWJ 3.2.004 OTA release - Skipped for Chinese superstitous reasons
_______________________________________________ OvmsDev mailing list OvmsDev@lists.openvehicles.com http://lists.openvehicles.com/mailman/listinfo/ovmsdev

IMHO, currently: - in MAIN is 3.2.002 - in EAP is 3.2.003 - in EDGE is 3.2.005-1-g7f86e9c Am 19.09.2019 um 10:22 schrieb Mark Webb-Johnson:
OK, I’ve built:
2019-09-19 MWJ 3.2.005 OTA release - Default module/debug.tasks to FALSE Users that volunteer to submit tasks debug historical data to the Open Vehicles project, should (with appreciation) set: config set module debug.tasks yes This will be transmit approximately 700MB of data a month (over cellular/wifi).
2019-09-19 MWJ 3.2.004 OTA release - Skipped for Chinese superstitous reasons
In EAP now, and I will announce.
Regards, Mark.
On 19 Sep 2019, at 3:34 PM, Michael Balzer <dexter@expeedo.de <mailto:dexter@expeedo.de>> wrote:
Correct.
Regards, Michael
Am 19.09.19 um 09:29 schrieb Mark Webb-Johnson:
I’m just worried about the users who don’t know about this new feature. When they deploy this version, they suddenly start sending 6MB of data a month up to us.
I think the ‘fix’ is just to change ovms_module.c:
MyConfig.GetParamValueBool("module", "debug.tasks", true)
to
MyConfig.GetParamValueBool("module", "debug.tasks", false)
That would then only submit these logs for those that explicitly turn it on?
Regards, Mark.
On 19 Sep 2019, at 3:23 PM, Michael Balzer <dexter@expeedo.de <mailto:dexter@expeedo.de>> wrote:
Sorry, I didn't think about this being an issue elsewhere -- german data plans typically start at minimum 100 MB/month flat (that's my current plan at 3 € / month).
No need for a new release, it can be turned off OTA by issueing
config set module debug.tasks no
Regards, Michael
Am 19.09.19 um 09:08 schrieb Mark Webb-Johnson:
Yep:
758 bytes * (86400 / 300) * 30 = 6.5MB/month
That is going over data (not SD). Presumably cellular data for a large portion of the time.
I think we need to default this to OFF, and make a 3.2.004 to avoid this becoming an issue.
Regards, Mark.
On 19 Sep 2019, at 2:04 PM, Stephen Casner <casner@acm.org <mailto:casner@acm.org>> wrote:
That's 6.55MB/month, unless you have unusually short months! :-)
In what space is that data stored? A log written to SD? That's not likely to fill up the SD card too fast, but what happens if no SD card is installed?
-- Steve
On Thu, 19 Sep 2019, Mark Webb-Johnson wrote:
>> To enable CPU usage statistics, apply the changes to sdkconfig >> included. >> New history record: >> - "*-OVM-DebugTasks" v1: <taskcnt,totaltime> + per task: >> <tasknum,name,state,stack_now,stack_max,stack_total, >> heap_total,heap_32bit,heap_spi,runtime> >> Note: CPU core use percentage = runtime / totaltime > > I’ve just noticed that this is enabled by default now (my > production build has the sdkconfig updated, as per defaults). > > I am seeing 758 bytes of history record, every 5 minutes. About > 218KB/day, or 654KB/month. > > Should this be opt-in? > > Regards, Mark. > >> On 8 Sep 2019, at 5:43 PM, Michael Balzer <dexter@expeedo.de >> <mailto:dexter@expeedo.de>> wrote: >> >> I've pushed some modifications and improvements to (hopefully) >> fix the timer issue or at least be able to debug it. >> >> Some sdkconfig changes are necessary. >> >> The build including these updates is on my edge release as >> 3.2.002-258-g20ae554b. >> >> Btw: the network restart strategy seems to mitigate issue #241; >> I've seen a major drop on record repetitions on my server since >> the rollout. >> >> >> commit 99e4e48bdd40b7004c0976f51aba9e3da4ecab53 >> >> Module: add per task CPU usage statistics, add task stats >> history records >> >> To enable CPU usage statistics, apply the changes to sdkconfig >> included. The CPU usage shown by the commands is calculated >> against >> the last task status retrieved (or system boot). >> >> Command changes: >> - "module tasks" -- added CPU (core) usage in percent per task >> >> New command: >> - "module tasks data" -- output task stats in history record >> form >> >> New config: >> - [module] debug.tasks -- yes (default) = send task stats >> every 5 minutes >> >> New history record: >> - "*-OVM-DebugTasks" v1: <taskcnt,totaltime> + per task: >> <tasknum,name,state,stack_now,stack_max,stack_total, >> heap_total,heap_32bit,heap_spi,runtime> >> Note: CPU core use percentage = runtime / totaltime >> >> commit 950172c216a72beb4da0bc7a40a46995a6105955 >> >> Build config: default timer service task priority raised to 20 >> >> Background: the FreeRTOS timer service shall only be used >> for very >> short and non-blocking jobs. We delegate event processing >> to our >> events task, anything else in timers needs to run with high >> priority. >> >> commit 31ac19d187480046c16356b80668de45cacbb83d >> >> DukTape: add build config for task priority, default lowered >> to 3 >> >> Background: the DukTape garbage collector shall run on lower >> priority than tasks like SIMCOM & events >> >> commit e0a44791fbcfb5a4e4cad24c9d1163b76e637b4f >> >> Server V2: use esp_log_timestamp for timeout detection, >> add timeout config, limit data records & size per second >> >> New config: >> - [server.v2] timeout.rx -- timeout in seconds, default 960 >> >> commit 684a4ce9525175a910040f0d1ca82ac212fbf5de >> >> Notify: use esp_log_timestamp for creation time instead of >> monotonictime >> to harden against timer service starvation / ticker event >> drops >> >> >> Regards, >> Michael >> >> >> Am 07.09.19 um 10:55 schrieb Michael Balzer: >>> I think the RTOS timer service task starves. It's running on >>> core 0 with priority 1. >>> >>> Taks on core 0 sorted by priority: >>> >>> Number of Tasks = 20 Stack: Now Max Total Heap >>> 32-bit SPIRAM C# PRI >>> 3FFC84A8 6 Blk ipc0 388 500 1024 7788 >>> 0 0 0 24 >>> 3FFC77F0 5 Blk OVMS CanRx 428 428 2048 3052 >>> 0 31844 0 23 >>> 3FFAFBF4 1 Blk esp_timer 400 656 4096 35928 >>> 644 25804 0 22 >>> 3FFD3240 19 Blk wifi 460 2716 3584 43720 >>> 0 20 0 22 >>> 3FFC03C4 2 Blk eventTask 448 1984 4608 104 >>> 0 0 0 20 >>> 3FFC8F14 17 Blk tiT 500 2308 3072 6552 >>> 0 0 * 18 >>> 3FFE14F0 26 Blk OVMS COrx 456 456 4096 0 >>> 0 0 0 7 >>> 3FFE19D4 27 Blk OVMS COwrk 476 476 3072 0 >>> 0 0 0 7 >>> 3FFCBC34 12 Blk Tmr Svc 352 928 3072 88 >>> 0 0 0 1 >>> 3FFE7708 23 Blk mdns 468 1396 4096 108 >>> 0 0 0 1 >>> >>> I don't think it's our CanRx, as that only fetches and queues >>> CAN frames, the actual work is done by the listeners. The CO >>> tasks only run for CANopen jobs, which are few for normal >>> operation. >>> >>> That leaves the system tasks, with main suspect -once again- >>> the wifi blob. >>> >>> We need to know how much CPU time the tasks actually use now. >>> I think I saw some option for this in the FreeRTOS config. >>> >>> Regards, >>> Michael >>> >>> >>> Am 06.09.19 um 23:15 schrieb Michael Balzer: >>>> The workaround is based on the monotonictime being updated >>>> per second, as do the history record offsets. >>>> >>>> Apparently, that mechanism doesn't work reliably. That may be >>>> an indicator for some bigger underlying issue. >>>> >>>> Example log excerpt: >>>> >>>> 2019-09-06 22:07:48.126919 +0200 info main: #173 C MITPROHB >>>> rx msg h 964,0,RT-BAT-C,5,86400,2,1,3830,3795,3830,-10,25,25,25,0 >>>> 2019-09-06 22:09:03.089031 +0200 info main: #173 C MITPROHB >>>> rx msg h >>>> 964,-10,RT-BAT-C,5,86400,2,1,3830,3795,3830,-10,25,25,25,0 >>>> 2019-09-06 22:09:05.041574 +0200 info main: #173 C MITPROHB >>>> rx msg h >>>> 964,-20,RT-BAT-C,5,86400,2,1,3830,3795,3830,-10,25,25,25,0 >>>> 2019-09-06 22:09:05.052644 +0200 info main: #173 C MITPROHB >>>> rx msg h >>>> 964,-30,RT-BAT-C,5,86400,2,1,3830,3795,3830,-10,25,25,25,0 >>>> 2019-09-06 22:09:05.063617 +0200 info main: #173 C MITPROHB >>>> rx msg h >>>> 964,-49,RT-BAT-C,5,86400,2,1,3830,3795,3830,-10,25,25,25,0 >>>> 2019-09-06 22:09:05.077527 +0200 info main: #173 C MITPROHB >>>> rx msg h >>>> 964,-59,RT-BAT-C,5,86400,2,1,3830,3795,3830,-10,25,25,25,0 >>>> 2019-09-06 22:09:05.193775 +0200 info main: #173 C MITPROHB >>>> rx msg h >>>> 964,-70,RT-BAT-C,5,86400,2,1,3830,3795,3830,-10,25,25,25,0 >>>> 2019-09-06 22:09:13.190645 +0200 info main: #173 C MITPROHB >>>> rx msg h >>>> 964,-80,RT-BAT-C,5,86400,2,1,3830,3795,3830,-10,25,25,25,0 >>>> 2019-09-06 22:09:22.077994 +0200 info main: #173 C MITPROHB >>>> rx msg h >>>> 964,-90,RT-BAT-C,5,86400,2,1,3830,3795,3830,-10,25,25,25,0 >>>> 2019-09-06 22:09:54.590300 +0200 info main: #173 C MITPROHB >>>> rx msg h >>>> 964,-109,RT-BAT-C,5,86400,2,1,3830,3795,3830,-10,25,25,25,0 >>>> 2019-09-06 22:11:10.127054 +0200 info main: #173 C MITPROHB >>>> rx msg h >>>> 964,-119,RT-BAT-C,5,86400,2,1,3830,3795,3830,-10,25,25,25,0 >>>> 2019-09-06 22:11:16.794200 +0200 info main: #173 C MITPROHB >>>> rx msg h >>>> 964,-130,RT-BAT-C,5,86400,2,1,3830,3795,3830,-10,25,25,25,0 >>>> 2019-09-06 22:11:22.455652 +0200 info main: #173 C MITPROHB >>>> rx msg h >>>> 964,-140,RT-BAT-C,5,86400,2,1,3830,3795,3830,-10,25,25,25,0 >>>> 2019-09-06 22:12:49.423412 +0200 info main: #173 C MITPROHB >>>> rx msg h >>>> 964,-150,RT-BAT-C,5,86400,2,1,3830,3795,3830,-10,25,25,25,0 >>>> 2019-09-06 22:12:49.442096 +0200 info main: #173 C MITPROHB >>>> rx msg h >>>> 964,-169,RT-BAT-C,5,86400,2,1,3830,3795,3830,-10,25,25,25,0 >>>> 2019-09-06 22:12:49.461941 +0200 info main: #173 C MITPROHB >>>> rx msg h >>>> 964,-179,RT-BAT-C,5,86400,2,1,3830,3795,3830,-10,25,25,25,0 >>>> 2019-09-06 22:14:39.828133 +0200 info main: #173 C MITPROHB >>>> rx msg h >>>> 964,-190,RT-BAT-C,5,86400,2,1,3830,3795,3830,-10,25,25,25,0 >>>> 2019-09-06 22:14:39.858144 +0200 info main: #173 C MITPROHB >>>> rx msg h >>>> 964,-200,RT-BAT-C,5,86400,2,1,3830,3795,3830,-10,25,25,25,0 >>>> 2019-09-06 22:14:52.020319 +0200 info main: #173 C MITPROHB >>>> rx msg h >>>> 964,-210,RT-BAT-C,5,86400,2,1,3830,3795,3830,-10,25,25,25,0 >>>> 2019-09-06 22:14:54.452637 +0200 info main: #173 C MITPROHB >>>> rx msg h >>>> 964,-229,RT-BAT-C,5,86400,2,1,3830,3795,3830,-10,25,25,25,0 >>>> 2019-09-06 22:15:12.613935 +0200 info main: #173 C MITPROHB >>>> rx msg h >>>> 964,-239,RT-BAT-C,5,86400,2,1,3830,3795,3830,-10,25,25,25,0 >>>> 2019-09-06 22:15:35.223845 +0200 info main: #173 C MITPROHB >>>> rx msg h >>>> 964,-250,RT-BAT-C,5,86400,2,1,3830,3795,3830,-10,25,25,25,0 >>>> 2019-09-06 22:16:09.255059 +0200 info main: #173 C MITPROHB >>>> rx msg h >>>> 964,-260,RT-BAT-C,5,86400,2,1,3830,3795,3830,-10,25,25,25,0 >>>> 2019-09-06 22:17:31.919754 +0200 info main: #173 C MITPROHB >>>> rx msg h >>>> 964,-270,RT-BAT-C,5,86400,2,1,3830,3795,3830,-10,25,25,25,0 >>>> 2019-09-06 22:19:23.366267 +0200 info main: #173 C MITPROHB >>>> rx msg h >>>> 964,-289,RT-BAT-C,5,86400,2,1,3830,3795,3830,-10,25,25,25,0 >>>> 2019-09-06 22:21:57.344609 +0200 info main: #173 C MITPROHB >>>> rx msg h >>>> 964,-299,RT-BAT-C,5,86400,2,1,3830,3795,3830,-10,25,25,25,0 >>>> 2019-09-06 22:23:40.082406 +0200 info main: #31 C MITPROHB >>>> rx msg h >>>> 964,-1027,RT-BAT-C,5,86400,2,1,3830,3795,3830,-10,25,25,25,0 >>>> 2019-09-06 22:25:58.061883 +0200 info main: #31 C MITPROHB >>>> rx msg h >>>> 964,-1040,RT-BAT-C,5,86400,2,1,3830,3795,3830,-10,25,25,25,0 >>>> >>>> >>>> This shows the ticker was only run 299 times from 22:07:48 to >>>> 22:21:57. >>>> >>>> After 22:21:57 the workaround was triggered and did a >>>> reconnect. Apparently during that network reinitialization of >>>> 103 seconds, the per second ticker was run 628 times. >>>> >>>> That can't be catching up on the event queue, as that queue >>>> has only 20 slots. So something strange is going on here. >>>> >>>> Any ideas? >>>> >>>> Regards, >>>> Michael >>>> >>>> >>>> Am 06.09.19 um 08:04 schrieb Michael Balzer: >>>>> Mark & anyone else running a V2 server, >>>>> >>>>> as most cars don't send history records, this also needs the >>>>> change to the server I just pushed, i.e. server version 2.4.2. >>>>> >>>>> https://github.com/openvehicles/Open-Vehicle-Monitoring-System/commits/maste... >>>>> <https://github.com/openvehicles/Open-Vehicle-Monitoring-System/commits/master> >>>>> >>>>> Regards, >>>>> Michael >>>>> >>>>> >>>>> Am 05.09.19 um 19:55 schrieb Michael Balzer: >>>>>> I've pushed the nasty workaround: the v2 server checks for >>>>>> no RX over 15 minutes, then restarts the network (wifi & >>>>>> modem) as configured for autostart. >>>>>> >>>>>> Rolled out on my server in edge as 3.2.002-237-ge075f655. >>>>>> >>>>>> Please test. >>>>>> >>>>>> Regards, >>>>>> Michael >>>>>> >>>>>> >>>>>> Am 05.09.19 um 01:58 schrieb Mark Webb-Johnson: >>>>>>>> Mark, you can check your server logs for history messages >>>>>>>> with ridiculous time offsets: >>>>>>>> [sddexter@ns27 server]$ cat log-20190903 | egrep "rx msg >>>>>>>> h [0-9]+,-[0-9]{4}" | wc -l >>>>>>>> 455283 >>>>>>> >>>>>>> I checked my logs and see 12 vehicles showing this. But, 2 >>>>>>> only show this for a debugcrash log (which is expected, I >>>>>>> guess, if the time is not synced at report time). I’ve got >>>>>>> 4 cars with the offset > 10,000. >>>>>>> >>>>>>> Regards, Mark. >>>>>>> >>>>>>>> On 4 Sep 2019, at 4:45 AM, Michael Balzer >>>>>>>> <dexter@expeedo.de <mailto:dexter@expeedo.de> >>>>>>>> <mailto:dexter@expeedo.de>> wrote: >>>>>>>> >>>>>>>> Everyone, >>>>>>>> >>>>>>>> I've pushed a change that needs some testing. >>>>>>>> >>>>>>>> I had the issue myself now parking at a certain distance >>>>>>>> from my garage wifi AP, i.e. on the edge of "in", after >>>>>>>> wifi had been disconnected for some hours, and with the >>>>>>>> module still connected via modem. The wifi blob had been >>>>>>>> trying to connect to the AP for about two hours. >>>>>>>> >>>>>>>> As seen before, the module saw no error, just the server >>>>>>>> responses and commands stopped coming in. I noticed the >>>>>>>> default interface was still "st1" despite wifi having >>>>>>>> been disconnected and modem connected. The DNS was also >>>>>>>> still configured for my wifi network, and the interface >>>>>>>> seemed to have an IP address -- but wasn't pingable from >>>>>>>> the wifi network. >>>>>>>> >>>>>>>> A power cycle of the modem solved the issue without >>>>>>>> reboot. So the cause may be in the modem/ppp subsystem, >>>>>>>> or it may be related (in some weird way) to the default >>>>>>>> interface / DNS setup. >>>>>>>> >>>>>>>> More tests showed the default interface again/still got >>>>>>>> set by the wifi blob itself at some point, overriding our >>>>>>>> modem prioritization. The events we didn't handle up to >>>>>>>> now were "sta.connected" and "sta.lostip", so I added >>>>>>>> these, and the bug didn't show up again since then. That >>>>>>>> doesn't mean anything, so we need to test this. >>>>>>>> >>>>>>>> The default interface really shouldn't affect inbound >>>>>>>> packet routing of an established connection, but there >>>>>>>> always may be strange bugs lurking in those libs. >>>>>>>> >>>>>>>> The change also reimplements the wifi signal strength >>>>>>>> reading, as the tests also showed that still wasn't >>>>>>>> working well using the CSI callback. It now seems to be >>>>>>>> much more reliable. >>>>>>>> >>>>>>>> Please test & report. The single module will be hard to >>>>>>>> test, as the bug isn't reproducable easily, but you can >>>>>>>> still try if wifi / modem transitions work well. >>>>>>>> >>>>>>>> Mark, you can check your server logs for history messages >>>>>>>> with ridiculous time offsets: >>>>>>>> [sddexter@ns27 server]$ cat log-20190903 | egrep "rx msg >>>>>>>> h [0-9]+,-[0-9]{4}" | wc -l >>>>>>>> 455283 >>>>>>>> The bug now severely affects the V2 server performance, >>>>>>>> as the server is single threaded and doesn't scale very >>>>>>>> well to this kind of bulk data bursts, especially when >>>>>>>> coming from multiple modules in parallel. So we really >>>>>>>> need to solve this now. Slow reactions or connection >>>>>>>> drops from my server lately have been due to this bug. If >>>>>>>> this change doesn't solve it, we'll need to add some >>>>>>>> reboot trigger on "too many server v2 notification >>>>>>>> retransmissions" -- or maybe a modem power cycle will do, >>>>>>>> that wouldn't discard the data. >>>>>>>> >>>>>>>> Thanks, >>>>>>>> Michael >>>>>>>> >>>>>>>> >>>>>>>> Am 03.09.19 um 07:46 schrieb Mark Webb-Johnson: >>>>>>>>> No problem. We can hold. I won’t commit anything for the >>>>>>>>> next few days (and agree to hold-off on Markos’s pull). >>>>>>>>> Let me know when you are ready. >>>>>>>>> >>>>>>>>> Regards, Mark. >>>>>>>>> >>>>>>>>>> On 3 Sep 2019, at 1:58 AM, Michael Balzer >>>>>>>>>> <dexter@expeedo.de <mailto:dexter@expeedo.de>> >>>>>>>>>> <mailto:dexter@expeedo.de> wrote: >>>>>>>>>> >>>>>>>>>> Mark, please wait. >>>>>>>>>> >>>>>>>>>> I may just have found the cause for issue #241, or at >>>>>>>>>> least something I need to investigate before releasing. >>>>>>>>>> >>>>>>>>>> I need to dig into my logs first, and try something. >>>>>>>>>> >>>>>>>>>> Regards, >>>>>>>>>> Michael >>>>>>>>>> >>>>>>>>>> >>>>>>>>>> Am 02.09.19 um 12:23 schrieb Michael Balzer: >>>>>>>>>>> Nothing open from my side at the moment. >>>>>>>>>>> >>>>>>>>>>> I haven't had the time to look in to Markos pull >>>>>>>>>>> request, but from a first check also think that's >>>>>>>>>>> going too deep to be included in this release. >>>>>>>>>>> >>>>>>>>>>> Regards, >>>>>>>>>>> Michael >>>>>>>>>>> >>>>>>>>>>> >>>>>>>>>>> Am 02.09.19 um 04:15 schrieb Mark Webb-Johnson: >>>>>>>>>>>> I think it is well past time for a 3.2.003 release. >>>>>>>>>>>> Things seems table in edge (although some things only >>>>>>>>>>>> partially implemented). >>>>>>>>>>>> >>>>>>>>>>>> Anything people want to include at the last minute, >>>>>>>>>>>> or can we go ahead and build? >>>>>>>>>>>> >>>>>>>>>>>> Regards, Mark. >>>>>>>>>>>>
-- Michael Balzer * Helkenberger Weg 9 * D-58256 Ennepetal Fon 02333 / 833 5735 * Handy 0176 / 206 989 26 _______________________________________________ OvmsDev mailing list OvmsDev@lists.openvehicles.com <mailto:OvmsDev@lists.openvehicles.com> http://lists.openvehicles.com/mailman/listinfo/ovmsdev
_______________________________________________ OvmsDev mailing list OvmsDev@lists.openvehicles.com http://lists.openvehicles.com/mailman/listinfo/ovmsdev
This is what I have (api.openvehicles.com <http://api.openvehicles.com/>): ==> eap/ovms3.ver <== 3.2.005 Tue Sep 19 08:00:00 UTC 2019 OTA release ==> edge/ovms3.ver <== 3.2.005-1-g7f86e9c Thu Sep 19 16:01:18 UTC 2019 Automated build (markhk8) ==> main/ovms3.ver <== 3.2.002 Sun May 12 08:00:00 UTC 2019 OTA release The 3.2.005 seems stable, so I think it can now go eap->main. @Michael: Should we co-ordinate and do this later today, or have you already released 3.2.005 to main? Regards, Mark.
On 25 Sep 2019, at 2:21 AM, Bernd Geistert <b_ghosti@gmx.de> wrote:
IMHO, currently: - in MAIN is 3.2.002 - in EAP is 3.2.003 - in EDGE is 3.2.005-1-g7f86e9c
Am 19.09.2019 um 10:22 schrieb Mark Webb-Johnson:
OK, I’ve built:
2019-09-19 MWJ 3.2.005 OTA release - Default module/debug.tasks to FALSE Users that volunteer to submit tasks debug historical data to the Open Vehicles project, should (with appreciation) set: config set module debug.tasks yes This will be transmit approximately 700MB of data a month (over cellular/wifi).
2019-09-19 MWJ 3.2.004 OTA release - Skipped for Chinese superstitous reasons
In EAP now, and I will announce.
Regards, Mark.
On 19 Sep 2019, at 3:34 PM, Michael Balzer <dexter@expeedo.de <mailto:dexter@expeedo.de>> wrote:
Correct.
Regards, Michael
Am 19.09.19 um 09:29 schrieb Mark Webb-Johnson:
I’m just worried about the users who don’t know about this new feature. When they deploy this version, they suddenly start sending 6MB of data a month up to us.
I think the ‘fix’ is just to change ovms_module.c:
MyConfig.GetParamValueBool("module", "debug.tasks", true)
to
MyConfig.GetParamValueBool("module", "debug.tasks", false)
That would then only submit these logs for those that explicitly turn it on?
Regards, Mark.
On 19 Sep 2019, at 3:23 PM, Michael Balzer <dexter@expeedo.de <mailto:dexter@expeedo.de>> wrote:
Sorry, I didn't think about this being an issue elsewhere -- german data plans typically start at minimum 100 MB/month flat (that's my current plan at 3 € / month).
No need for a new release, it can be turned off OTA by issueing
config set module debug.tasks no
Regards, Michael
Am 19.09.19 um 09:08 schrieb Mark Webb-Johnson:
Yep:
758 bytes * (86400 / 300) * 30 = 6.5MB/month
That is going over data (not SD). Presumably cellular data for a large portion of the time.
I think we need to default this to OFF, and make a 3.2.004 to avoid this becoming an issue.
Regards, Mark.
> On 19 Sep 2019, at 2:04 PM, Stephen Casner <casner@acm.org <mailto:casner@acm.org>> wrote: > > That's 6.55MB/month, unless you have unusually short months! :-) > > In what space is that data stored? A log written to SD? That's not > likely to fill up the SD card too fast, but what happens if no SD card > is installed? > > -- Steve > > On Thu, 19 Sep 2019, Mark Webb-Johnson wrote: > >>> To enable CPU usage statistics, apply the changes to sdkconfig >>> included. >>> New history record: >>> - "*-OVM-DebugTasks" v1: <taskcnt,totaltime> + per task: >>> <tasknum,name,state,stack_now,stack_max,stack_total, >>> heap_total,heap_32bit,heap_spi,runtime> >>> Note: CPU core use percentage = runtime / totaltime >> >> I’ve just noticed that this is enabled by default now (my production build has the sdkconfig updated, as per defaults). >> >> I am seeing 758 bytes of history record, every 5 minutes. About 218KB/day, or 654KB/month. >> >> Should this be opt-in? >> >> Regards, Mark. >> >>> On 8 Sep 2019, at 5:43 PM, Michael Balzer <dexter@expeedo.de <mailto:dexter@expeedo.de>> wrote: >>> >>> I've pushed some modifications and improvements to (hopefully) fix the timer issue or at least be able to debug it. >>> >>> Some sdkconfig changes are necessary. >>> >>> The build including these updates is on my edge release as 3.2.002-258-g20ae554b. >>> >>> Btw: the network restart strategy seems to mitigate issue #241; I've seen a major drop on record repetitions on my server since the rollout. >>> >>> >>> commit 99e4e48bdd40b7004c0976f51aba9e3da4ecab53 >>> >>> Module: add per task CPU usage statistics, add task stats history records >>> >>> To enable CPU usage statistics, apply the changes to sdkconfig >>> included. The CPU usage shown by the commands is calculated against >>> the last task status retrieved (or system boot). >>> >>> Command changes: >>> - "module tasks" -- added CPU (core) usage in percent per task >>> >>> New command: >>> - "module tasks data" -- output task stats in history record form >>> >>> New config: >>> - [module] debug.tasks -- yes (default) = send task stats every 5 minutes >>> >>> New history record: >>> - "*-OVM-DebugTasks" v1: <taskcnt,totaltime> + per task: >>> <tasknum,name,state,stack_now,stack_max,stack_total, >>> heap_total,heap_32bit,heap_spi,runtime> >>> Note: CPU core use percentage = runtime / totaltime >>> >>> commit 950172c216a72beb4da0bc7a40a46995a6105955 >>> >>> Build config: default timer service task priority raised to 20 >>> >>> Background: the FreeRTOS timer service shall only be used for very >>> short and non-blocking jobs. We delegate event processing to our >>> events task, anything else in timers needs to run with high >>> priority. >>> >>> commit 31ac19d187480046c16356b80668de45cacbb83d >>> >>> DukTape: add build config for task priority, default lowered to 3 >>> >>> Background: the DukTape garbage collector shall run on lower >>> priority than tasks like SIMCOM & events >>> >>> commit e0a44791fbcfb5a4e4cad24c9d1163b76e637b4f >>> >>> Server V2: use esp_log_timestamp for timeout detection, >>> add timeout config, limit data records & size per second >>> >>> New config: >>> - [server.v2] timeout.rx -- timeout in seconds, default 960 >>> >>> commit 684a4ce9525175a910040f0d1ca82ac212fbf5de >>> >>> Notify: use esp_log_timestamp for creation time instead of monotonictime >>> to harden against timer service starvation / ticker event drops >>> >>> >>> Regards, >>> Michael >>> >>> >>> Am 07.09.19 um 10:55 schrieb Michael Balzer: >>>> I think the RTOS timer service task starves. It's running on core 0 with priority 1. >>>> >>>> Taks on core 0 sorted by priority: >>>> >>>> Number of Tasks = 20 Stack: Now Max Total Heap 32-bit SPIRAM C# PRI >>>> 3FFC84A8 6 Blk ipc0 388 500 1024 7788 0 0 0 24 >>>> 3FFC77F0 5 Blk OVMS CanRx 428 428 2048 3052 0 31844 0 23 >>>> 3FFAFBF4 1 Blk esp_timer 400 656 4096 35928 644 25804 0 22 >>>> 3FFD3240 19 Blk wifi 460 2716 3584 43720 0 20 0 22 >>>> 3FFC03C4 2 Blk eventTask 448 1984 4608 104 0 0 0 20 >>>> 3FFC8F14 17 Blk tiT 500 2308 3072 6552 0 0 * 18 >>>> 3FFE14F0 26 Blk OVMS COrx 456 456 4096 0 0 0 0 7 >>>> 3FFE19D4 27 Blk OVMS COwrk 476 476 3072 0 0 0 0 7 >>>> 3FFCBC34 12 Blk Tmr Svc 352 928 3072 88 0 0 0 1 >>>> 3FFE7708 23 Blk mdns 468 1396 4096 108 0 0 0 1 >>>> >>>> I don't think it's our CanRx, as that only fetches and queues CAN frames, the actual work is done by the listeners. The CO tasks only run for CANopen jobs, which are few for normal operation. >>>> >>>> That leaves the system tasks, with main suspect -once again- the wifi blob. >>>> >>>> We need to know how much CPU time the tasks actually use now. I think I saw some option for this in the FreeRTOS config. >>>> >>>> Regards, >>>> Michael >>>> >>>> >>>> Am 06.09.19 um 23:15 schrieb Michael Balzer: >>>>> The workaround is based on the monotonictime being updated per second, as do the history record offsets. >>>>> >>>>> Apparently, that mechanism doesn't work reliably. That may be an indicator for some bigger underlying issue. >>>>> >>>>> Example log excerpt: >>>>> >>>>> 2019-09-06 22:07:48.126919 +0200 info main: #173 C MITPROHB rx msg h 964,0,RT-BAT-C,5,86400,2,1,3830,3795,3830,-10,25,25,25,0 >>>>> 2019-09-06 22:09:03.089031 +0200 info main: #173 C MITPROHB rx msg h 964,-10,RT-BAT-C,5,86400,2,1,3830,3795,3830,-10,25,25,25,0 >>>>> 2019-09-06 22:09:05.041574 +0200 info main: #173 C MITPROHB rx msg h 964,-20,RT-BAT-C,5,86400,2,1,3830,3795,3830,-10,25,25,25,0 >>>>> 2019-09-06 22:09:05.052644 +0200 info main: #173 C MITPROHB rx msg h 964,-30,RT-BAT-C,5,86400,2,1,3830,3795,3830,-10,25,25,25,0 >>>>> 2019-09-06 22:09:05.063617 +0200 info main: #173 C MITPROHB rx msg h 964,-49,RT-BAT-C,5,86400,2,1,3830,3795,3830,-10,25,25,25,0 >>>>> 2019-09-06 22:09:05.077527 +0200 info main: #173 C MITPROHB rx msg h 964,-59,RT-BAT-C,5,86400,2,1,3830,3795,3830,-10,25,25,25,0 >>>>> 2019-09-06 22:09:05.193775 +0200 info main: #173 C MITPROHB rx msg h 964,-70,RT-BAT-C,5,86400,2,1,3830,3795,3830,-10,25,25,25,0 >>>>> 2019-09-06 22:09:13.190645 +0200 info main: #173 C MITPROHB rx msg h 964,-80,RT-BAT-C,5,86400,2,1,3830,3795,3830,-10,25,25,25,0 >>>>> 2019-09-06 22:09:22.077994 +0200 info main: #173 C MITPROHB rx msg h 964,-90,RT-BAT-C,5,86400,2,1,3830,3795,3830,-10,25,25,25,0 >>>>> 2019-09-06 22:09:54.590300 +0200 info main: #173 C MITPROHB rx msg h 964,-109,RT-BAT-C,5,86400,2,1,3830,3795,3830,-10,25,25,25,0 >>>>> 2019-09-06 22:11:10.127054 +0200 info main: #173 C MITPROHB rx msg h 964,-119,RT-BAT-C,5,86400,2,1,3830,3795,3830,-10,25,25,25,0 >>>>> 2019-09-06 22:11:16.794200 +0200 info main: #173 C MITPROHB rx msg h 964,-130,RT-BAT-C,5,86400,2,1,3830,3795,3830,-10,25,25,25,0 >>>>> 2019-09-06 22:11:22.455652 +0200 info main: #173 C MITPROHB rx msg h 964,-140,RT-BAT-C,5,86400,2,1,3830,3795,3830,-10,25,25,25,0 >>>>> 2019-09-06 22:12:49.423412 +0200 info main: #173 C MITPROHB rx msg h 964,-150,RT-BAT-C,5,86400,2,1,3830,3795,3830,-10,25,25,25,0 >>>>> 2019-09-06 22:12:49.442096 +0200 info main: #173 C MITPROHB rx msg h 964,-169,RT-BAT-C,5,86400,2,1,3830,3795,3830,-10,25,25,25,0 >>>>> 2019-09-06 22:12:49.461941 +0200 info main: #173 C MITPROHB rx msg h 964,-179,RT-BAT-C,5,86400,2,1,3830,3795,3830,-10,25,25,25,0 >>>>> 2019-09-06 22:14:39.828133 +0200 info main: #173 C MITPROHB rx msg h 964,-190,RT-BAT-C,5,86400,2,1,3830,3795,3830,-10,25,25,25,0 >>>>> 2019-09-06 22:14:39.858144 +0200 info main: #173 C MITPROHB rx msg h 964,-200,RT-BAT-C,5,86400,2,1,3830,3795,3830,-10,25,25,25,0 >>>>> 2019-09-06 22:14:52.020319 +0200 info main: #173 C MITPROHB rx msg h 964,-210,RT-BAT-C,5,86400,2,1,3830,3795,3830,-10,25,25,25,0 >>>>> 2019-09-06 22:14:54.452637 +0200 info main: #173 C MITPROHB rx msg h 964,-229,RT-BAT-C,5,86400,2,1,3830,3795,3830,-10,25,25,25,0 >>>>> 2019-09-06 22:15:12.613935 +0200 info main: #173 C MITPROHB rx msg h 964,-239,RT-BAT-C,5,86400,2,1,3830,3795,3830,-10,25,25,25,0 >>>>> 2019-09-06 22:15:35.223845 +0200 info main: #173 C MITPROHB rx msg h 964,-250,RT-BAT-C,5,86400,2,1,3830,3795,3830,-10,25,25,25,0 >>>>> 2019-09-06 22:16:09.255059 +0200 info main: #173 C MITPROHB rx msg h 964,-260,RT-BAT-C,5,86400,2,1,3830,3795,3830,-10,25,25,25,0 >>>>> 2019-09-06 22:17:31.919754 +0200 info main: #173 C MITPROHB rx msg h 964,-270,RT-BAT-C,5,86400,2,1,3830,3795,3830,-10,25,25,25,0 >>>>> 2019-09-06 22:19:23.366267 +0200 info main: #173 C MITPROHB rx msg h 964,-289,RT-BAT-C,5,86400,2,1,3830,3795,3830,-10,25,25,25,0 >>>>> 2019-09-06 22:21:57.344609 +0200 info main: #173 C MITPROHB rx msg h 964,-299,RT-BAT-C,5,86400,2,1,3830,3795,3830,-10,25,25,25,0 >>>>> 2019-09-06 22:23:40.082406 +0200 info main: #31 C MITPROHB rx msg h 964,-1027,RT-BAT-C,5,86400,2,1,3830,3795,3830,-10,25,25,25,0 >>>>> 2019-09-06 22:25:58.061883 +0200 info main: #31 C MITPROHB rx msg h 964,-1040,RT-BAT-C,5,86400,2,1,3830,3795,3830,-10,25,25,25,0 >>>>> >>>>> >>>>> This shows the ticker was only run 299 times from 22:07:48 to 22:21:57. >>>>> >>>>> After 22:21:57 the workaround was triggered and did a reconnect. Apparently during that network reinitialization of 103 seconds, the per second ticker was run 628 times. >>>>> >>>>> That can't be catching up on the event queue, as that queue has only 20 slots. So something strange is going on here. >>>>> >>>>> Any ideas? >>>>> >>>>> Regards, >>>>> Michael >>>>> >>>>> >>>>> Am 06.09.19 um 08:04 schrieb Michael Balzer: >>>>>> Mark & anyone else running a V2 server, >>>>>> >>>>>> as most cars don't send history records, this also needs the change to the server I just pushed, i.e. server version 2.4.2. >>>>>> >>>>>> https://github.com/openvehicles/Open-Vehicle-Monitoring-System/commits/maste... <https://github.com/openvehicles/Open-Vehicle-Monitoring-System/commits/master> <https://github.com/openvehicles/Open-Vehicle-Monitoring-System/commits/maste... <https://github.com/openvehicles/Open-Vehicle-Monitoring-System/commits/master>> >>>>>> >>>>>> Regards, >>>>>> Michael >>>>>> >>>>>> >>>>>> Am 05.09.19 um 19:55 schrieb Michael Balzer: >>>>>>> I've pushed the nasty workaround: the v2 server checks for no RX over 15 minutes, then restarts the network (wifi & modem) as configured for autostart. >>>>>>> >>>>>>> Rolled out on my server in edge as 3.2.002-237-ge075f655. >>>>>>> >>>>>>> Please test. >>>>>>> >>>>>>> Regards, >>>>>>> Michael >>>>>>> >>>>>>> >>>>>>> Am 05.09.19 um 01:58 schrieb Mark Webb-Johnson: >>>>>>>>> Mark, you can check your server logs for history messages with ridiculous time offsets: >>>>>>>>> [sddexter@ns27 server]$ cat log-20190903 | egrep "rx msg h [0-9]+,-[0-9]{4}" | wc -l >>>>>>>>> 455283 >>>>>>>> >>>>>>>> I checked my logs and see 12 vehicles showing this. But, 2 only show this for a debugcrash log (which is expected, I guess, if the time is not synced at report time). I’ve got 4 cars with the offset > 10,000. >>>>>>>> >>>>>>>> Regards, Mark. >>>>>>>> >>>>>>>>> On 4 Sep 2019, at 4:45 AM, Michael Balzer <dexter@expeedo.de <mailto:dexter@expeedo.de> <mailto:dexter@expeedo.de <mailto:dexter@expeedo.de>>> wrote: >>>>>>>>> >>>>>>>>> Everyone, >>>>>>>>> >>>>>>>>> I've pushed a change that needs some testing. >>>>>>>>> >>>>>>>>> I had the issue myself now parking at a certain distance from my garage wifi AP, i.e. on the edge of "in", after wifi had been disconnected for some hours, and with the module still connected via modem. The wifi blob had been trying to connect to the AP for about two hours. >>>>>>>>> >>>>>>>>> As seen before, the module saw no error, just the server responses and commands stopped coming in. I noticed the default interface was still "st1" despite wifi having been disconnected and modem connected. The DNS was also still configured for my wifi network, and the interface seemed to have an IP address -- but wasn't pingable from the wifi network. >>>>>>>>> >>>>>>>>> A power cycle of the modem solved the issue without reboot. So the cause may be in the modem/ppp subsystem, or it may be related (in some weird way) to the default interface / DNS setup. >>>>>>>>> >>>>>>>>> More tests showed the default interface again/still got set by the wifi blob itself at some point, overriding our modem prioritization. The events we didn't handle up to now were "sta.connected" and "sta.lostip", so I added these, and the bug didn't show up again since then. That doesn't mean anything, so we need to test this. >>>>>>>>> >>>>>>>>> The default interface really shouldn't affect inbound packet routing of an established connection, but there always may be strange bugs lurking in those libs. >>>>>>>>> >>>>>>>>> The change also reimplements the wifi signal strength reading, as the tests also showed that still wasn't working well using the CSI callback. It now seems to be much more reliable. >>>>>>>>> >>>>>>>>> Please test & report. The single module will be hard to test, as the bug isn't reproducable easily, but you can still try if wifi / modem transitions work well. >>>>>>>>> >>>>>>>>> Mark, you can check your server logs for history messages with ridiculous time offsets: >>>>>>>>> [sddexter@ns27 server]$ cat log-20190903 | egrep "rx msg h [0-9]+,-[0-9]{4}" | wc -l >>>>>>>>> 455283 >>>>>>>>> The bug now severely affects the V2 server performance, as the server is single threaded and doesn't scale very well to this kind of bulk data bursts, especially when coming from multiple modules in parallel. So we really need to solve this now. Slow reactions or connection drops from my server lately have been due to this bug. If this change doesn't solve it, we'll need to add some reboot trigger on "too many server v2 notification retransmissions" -- or maybe a modem power cycle will do, that wouldn't discard the data. >>>>>>>>> >>>>>>>>> Thanks, >>>>>>>>> Michael >>>>>>>>> >>>>>>>>> >>>>>>>>> Am 03.09.19 um 07:46 schrieb Mark Webb-Johnson: >>>>>>>>>> No problem. We can hold. I won’t commit anything for the next few days (and agree to hold-off on Markos’s pull). Let me know when you are ready. >>>>>>>>>> >>>>>>>>>> Regards, Mark. >>>>>>>>>> >>>>>>>>>>> On 3 Sep 2019, at 1:58 AM, Michael Balzer <dexter@expeedo.de <mailto:dexter@expeedo.de>> <mailto:dexter@expeedo.de <mailto:dexter@expeedo.de>> wrote: >>>>>>>>>>> >>>>>>>>>>> Mark, please wait. >>>>>>>>>>> >>>>>>>>>>> I may just have found the cause for issue #241, or at least something I need to investigate before releasing. >>>>>>>>>>> >>>>>>>>>>> I need to dig into my logs first, and try something. >>>>>>>>>>> >>>>>>>>>>> Regards, >>>>>>>>>>> Michael >>>>>>>>>>> >>>>>>>>>>> >>>>>>>>>>> Am 02.09.19 um 12:23 schrieb Michael Balzer: >>>>>>>>>>>> Nothing open from my side at the moment. >>>>>>>>>>>> >>>>>>>>>>>> I haven't had the time to look in to Markos pull request, but from a first check also think that's going too deep to be included in this release. >>>>>>>>>>>> >>>>>>>>>>>> Regards, >>>>>>>>>>>> Michael >>>>>>>>>>>> >>>>>>>>>>>> >>>>>>>>>>>> Am 02.09.19 um 04:15 schrieb Mark Webb-Johnson: >>>>>>>>>>>>> I think it is well past time for a 3.2.003 release. Things seems table in edge (although some things only partially implemented). >>>>>>>>>>>>> >>>>>>>>>>>>> Anything people want to include at the last minute, or can we go ahead and build? >>>>>>>>>>>>> >>>>>>>>>>>>> Regards, Mark. >>>>>>>>>>>>>
-- Michael Balzer * Helkenberger Weg 9 * D-58256 Ennepetal Fon 02333 / 833 5735 * Handy 0176 / 206 989 26 _______________________________________________ OvmsDev mailing list OvmsDev@lists.openvehicles.com <mailto:OvmsDev@lists.openvehicles.com> http://lists.openvehicles.com/mailman/listinfo/ovmsdev <http://lists.openvehicles.com/mailman/listinfo/ovmsdev>
_______________________________________________ OvmsDev mailing list OvmsDev@lists.openvehicles.com <mailto:OvmsDev@lists.openvehicles.com> http://lists.openvehicles.com/mailman/listinfo/ovmsdev <http://lists.openvehicles.com/mailman/listinfo/ovmsdev>
_______________________________________________ OvmsDev mailing list OvmsDev@lists.openvehicles.com http://lists.openvehicles.com/mailman/listinfo/ovmsdev
Mark, go ahead, I'll follow. I don't have any bad reports from edge or eap. Regards, Michael Am 25.09.19 um 03:47 schrieb Mark Webb-Johnson:
This is what I have (api.openvehicles.com <http://api.openvehicles.com>):
==> eap/ovms3.ver <== 3.2.005 Tue Sep 19 08:00:00 UTC 2019 OTA release
==> edge/ovms3.ver <== 3.2.005-1-g7f86e9c Thu Sep 19 16:01:18 UTC 2019 Automated build (markhk8)
==> main/ovms3.ver <== 3.2.002 Sun May 12 08:00:00 UTC 2019 OTA release
The 3.2.005 seems stable, so I think it can now go eap->main.
@Michael: Should we co-ordinate and do this later today, or have you already released 3.2.005 to main?
Regards, Mark.
On 25 Sep 2019, at 2:21 AM, Bernd Geistert <b_ghosti@gmx.de <mailto:b_ghosti@gmx.de>> wrote:
IMHO, currently: - in MAIN is 3.2.002 - in EAP is 3.2.003 - in EDGE is 3.2.005-1-g7f86e9c
Am 19.09.2019 um 10:22 schrieb Mark Webb-Johnson:
OK, I’ve built:
2019-09-19 MWJ 3.2.005 OTA release - Default module/debug.tasks to FALSE Users that volunteer to submit tasks debug historical data to the Open Vehicles project, should (with appreciation) set: config set module debug.tasks yes This will be transmit approximately 700MB of data a month (over cellular/wifi).
2019-09-19 MWJ 3.2.004 OTA release - Skipped for Chinese superstitous reasons
In EAP now, and I will announce.
Regards, Mark.
On 19 Sep 2019, at 3:34 PM, Michael Balzer <dexter@expeedo.de <mailto:dexter@expeedo.de>> wrote:
Correct.
Regards, Michael
Am 19.09.19 um 09:29 schrieb Mark Webb-Johnson:
I’m just worried about the users who don’t know about this new feature. When they deploy this version, they suddenly start sending 6MB of data a month up to us.
I think the ‘fix’ is just to change ovms_module.c:
MyConfig.GetParamValueBool("module", "debug.tasks", true)
to
MyConfig.GetParamValueBool("module", "debug.tasks", false)
That would then only submit these logs for those that explicitly turn it on?
Regards, Mark.
On 19 Sep 2019, at 3:23 PM, Michael Balzer <dexter@expeedo.de <mailto:dexter@expeedo.de>> wrote:
Sorry, I didn't think about this being an issue elsewhere -- german data plans typically start at minimum 100 MB/month flat (that's my current plan at 3 € / month).
No need for a new release, it can be turned off OTA by issueing
config set module debug.tasks no
Regards, Michael
Am 19.09.19 um 09:08 schrieb Mark Webb-Johnson: > Yep: > > 758 bytes * (86400 / 300) * 30 = 6.5MB/month > > > That is going over data (not SD). Presumably cellular data for a large portion of the time. > > I think we need to default this to OFF, and make a 3.2.004 to avoid this becoming an issue. > > Regards, Mark. > >> On 19 Sep 2019, at 2:04 PM, Stephen Casner <casner@acm.org <mailto:casner@acm.org>> wrote: >> >> That's 6.55MB/month, unless you have unusually short months! :-) >> >> In what space is that data stored? A log written to SD? That's not >> likely to fill up the SD card too fast, but what happens if no SD card >> is installed? >> >> -- Steve >> >> On Thu, 19 Sep 2019, Mark Webb-Johnson wrote: >> >>>> To enable CPU usage statistics, apply the changes to sdkconfig >>>> included. >>>> New history record: >>>> - "*-OVM-DebugTasks" v1: <taskcnt,totaltime> + per task: >>>> <tasknum,name,state,stack_now,stack_max,stack_total, >>>> heap_total,heap_32bit,heap_spi,runtime> >>>> Note: CPU core use percentage = runtime / totaltime >>> >>> I’ve just noticed that this is enabled by default now (my production build has the sdkconfig updated, as per defaults). >>> >>> I am seeing 758 bytes of history record, every 5 minutes. About 218KB/day, or 654KB/month. >>> >>> Should this be opt-in? >>> >>> Regards, Mark. >>> >>>> On 8 Sep 2019, at 5:43 PM, Michael Balzer <dexter@expeedo.de <mailto:dexter@expeedo.de>> wrote: >>>> >>>> I've pushed some modifications and improvements to (hopefully) fix the timer issue or at least be able to debug it. >>>> >>>> Some sdkconfig changes are necessary. >>>> >>>> The build including these updates is on my edge release as 3.2.002-258-g20ae554b. >>>> >>>> Btw: the network restart strategy seems to mitigate issue #241; I've seen a major drop on record repetitions on my server since the >>>> rollout. >>>> >>>> >>>> commit 99e4e48bdd40b7004c0976f51aba9e3da4ecab53 >>>> >>>> Module: add per task CPU usage statistics, add task stats history records >>>> >>>> To enable CPU usage statistics, apply the changes to sdkconfig >>>> included. The CPU usage shown by the commands is calculated against >>>> the last task status retrieved (or system boot). >>>> >>>> Command changes: >>>> - "module tasks" -- added CPU (core) usage in percent per task >>>> >>>> New command: >>>> - "module tasks data" -- output task stats in history record form >>>> >>>> New config: >>>> - [module] debug.tasks -- yes (default) = send task stats every 5 minutes >>>> >>>> New history record: >>>> - "*-OVM-DebugTasks" v1: <taskcnt,totaltime> + per task: >>>> <tasknum,name,state,stack_now,stack_max,stack_total, >>>> heap_total,heap_32bit,heap_spi,runtime> >>>> Note: CPU core use percentage = runtime / totaltime >>>> >>>> commit 950172c216a72beb4da0bc7a40a46995a6105955 >>>> >>>> Build config: default timer service task priority raised to 20 >>>> >>>> Background: the FreeRTOS timer service shall only be used for very >>>> short and non-blocking jobs. We delegate event processing to our >>>> events task, anything else in timers needs to run with high >>>> priority. >>>> >>>> commit 31ac19d187480046c16356b80668de45cacbb83d >>>> >>>> DukTape: add build config for task priority, default lowered to 3 >>>> >>>> Background: the DukTape garbage collector shall run on lower >>>> priority than tasks like SIMCOM & events >>>> >>>> commit e0a44791fbcfb5a4e4cad24c9d1163b76e637b4f >>>> >>>> Server V2: use esp_log_timestamp for timeout detection, >>>> add timeout config, limit data records & size per second >>>> >>>> New config: >>>> - [server.v2] timeout.rx -- timeout in seconds, default 960 >>>> >>>> commit 684a4ce9525175a910040f0d1ca82ac212fbf5de >>>> >>>> Notify: use esp_log_timestamp for creation time instead of monotonictime >>>> to harden against timer service starvation / ticker event drops >>>> >>>> >>>> Regards, >>>> Michael >>>> >>>> >>>> Am 07.09.19 um 10:55 schrieb Michael Balzer: >>>>> I think the RTOS timer service task starves. It's running on core 0 with priority 1. >>>>> >>>>> Taks on core 0 sorted by priority: >>>>> >>>>> Number of Tasks = 20 Stack: Now Max Total Heap 32-bit SPIRAM C# PRI >>>>> 3FFC84A8 6 Blk ipc0 388 500 1024 7788 0 0 0 24 >>>>> 3FFC77F0 5 Blk OVMS CanRx 428 428 2048 3052 0 31844 0 23 >>>>> 3FFAFBF4 1 Blk esp_timer 400 656 4096 35928 644 25804 0 22 >>>>> 3FFD3240 19 Blk wifi 460 2716 3584 43720 0 20 0 22 >>>>> 3FFC03C4 2 Blk eventTask 448 1984 4608 104 0 0 0 20 >>>>> 3FFC8F14 17 Blk tiT 500 2308 3072 6552 0 0 * 18 >>>>> 3FFE14F0 26 Blk OVMS COrx 456 456 4096 0 0 0 0 7 >>>>> 3FFE19D4 27 Blk OVMS COwrk 476 476 3072 0 0 0 0 7 >>>>> 3FFCBC34 12 Blk Tmr Svc 352 928 3072 88 0 0 0 1 >>>>> 3FFE7708 23 Blk mdns 468 1396 4096 108 0 0 0 1 >>>>> >>>>> I don't think it's our CanRx, as that only fetches and queues CAN frames, the actual work is done by the listeners. The CO tasks >>>>> only run for CANopen jobs, which are few for normal operation. >>>>> >>>>> That leaves the system tasks, with main suspect -once again- the wifi blob. >>>>> >>>>> We need to know how much CPU time the tasks actually use now. I think I saw some option for this in the FreeRTOS config. >>>>> >>>>> Regards, >>>>> Michael >>>>> >>>>> >>>>> Am 06.09.19 um 23:15 schrieb Michael Balzer: >>>>>> The workaround is based on the monotonictime being updated per second, as do the history record offsets. >>>>>> >>>>>> Apparently, that mechanism doesn't work reliably. That may be an indicator for some bigger underlying issue. >>>>>> >>>>>> Example log excerpt: >>>>>> >>>>>> 2019-09-06 22:07:48.126919 +0200 info main: #173 C MITPROHB rx msg h 964,0,RT-BAT-C,5,86400,2,1,3830,3795,3830,-10,25,25,25,0 >>>>>> 2019-09-06 22:09:03.089031 +0200 info main: #173 C MITPROHB rx msg h 964,-10,RT-BAT-C,5,86400,2,1,3830,3795,3830,-10,25,25,25,0 >>>>>> 2019-09-06 22:09:05.041574 +0200 info main: #173 C MITPROHB rx msg h 964,-20,RT-BAT-C,5,86400,2,1,3830,3795,3830,-10,25,25,25,0 >>>>>> 2019-09-06 22:09:05.052644 +0200 info main: #173 C MITPROHB rx msg h 964,-30,RT-BAT-C,5,86400,2,1,3830,3795,3830,-10,25,25,25,0 >>>>>> 2019-09-06 22:09:05.063617 +0200 info main: #173 C MITPROHB rx msg h 964,-49,RT-BAT-C,5,86400,2,1,3830,3795,3830,-10,25,25,25,0 >>>>>> 2019-09-06 22:09:05.077527 +0200 info main: #173 C MITPROHB rx msg h 964,-59,RT-BAT-C,5,86400,2,1,3830,3795,3830,-10,25,25,25,0 >>>>>> 2019-09-06 22:09:05.193775 +0200 info main: #173 C MITPROHB rx msg h 964,-70,RT-BAT-C,5,86400,2,1,3830,3795,3830,-10,25,25,25,0 >>>>>> 2019-09-06 22:09:13.190645 +0200 info main: #173 C MITPROHB rx msg h 964,-80,RT-BAT-C,5,86400,2,1,3830,3795,3830,-10,25,25,25,0 >>>>>> 2019-09-06 22:09:22.077994 +0200 info main: #173 C MITPROHB rx msg h 964,-90,RT-BAT-C,5,86400,2,1,3830,3795,3830,-10,25,25,25,0 >>>>>> 2019-09-06 22:09:54.590300 +0200 info main: #173 C MITPROHB rx msg h 964,-109,RT-BAT-C,5,86400,2,1,3830,3795,3830,-10,25,25,25,0 >>>>>> 2019-09-06 22:11:10.127054 +0200 info main: #173 C MITPROHB rx msg h 964,-119,RT-BAT-C,5,86400,2,1,3830,3795,3830,-10,25,25,25,0 >>>>>> 2019-09-06 22:11:16.794200 +0200 info main: #173 C MITPROHB rx msg h 964,-130,RT-BAT-C,5,86400,2,1,3830,3795,3830,-10,25,25,25,0 >>>>>> 2019-09-06 22:11:22.455652 +0200 info main: #173 C MITPROHB rx msg h 964,-140,RT-BAT-C,5,86400,2,1,3830,3795,3830,-10,25,25,25,0 >>>>>> 2019-09-06 22:12:49.423412 +0200 info main: #173 C MITPROHB rx msg h 964,-150,RT-BAT-C,5,86400,2,1,3830,3795,3830,-10,25,25,25,0 >>>>>> 2019-09-06 22:12:49.442096 +0200 info main: #173 C MITPROHB rx msg h 964,-169,RT-BAT-C,5,86400,2,1,3830,3795,3830,-10,25,25,25,0 >>>>>> 2019-09-06 22:12:49.461941 +0200 info main: #173 C MITPROHB rx msg h 964,-179,RT-BAT-C,5,86400,2,1,3830,3795,3830,-10,25,25,25,0 >>>>>> 2019-09-06 22:14:39.828133 +0200 info main: #173 C MITPROHB rx msg h 964,-190,RT-BAT-C,5,86400,2,1,3830,3795,3830,-10,25,25,25,0 >>>>>> 2019-09-06 22:14:39.858144 +0200 info main: #173 C MITPROHB rx msg h 964,-200,RT-BAT-C,5,86400,2,1,3830,3795,3830,-10,25,25,25,0 >>>>>> 2019-09-06 22:14:52.020319 +0200 info main: #173 C MITPROHB rx msg h 964,-210,RT-BAT-C,5,86400,2,1,3830,3795,3830,-10,25,25,25,0 >>>>>> 2019-09-06 22:14:54.452637 +0200 info main: #173 C MITPROHB rx msg h 964,-229,RT-BAT-C,5,86400,2,1,3830,3795,3830,-10,25,25,25,0 >>>>>> 2019-09-06 22:15:12.613935 +0200 info main: #173 C MITPROHB rx msg h 964,-239,RT-BAT-C,5,86400,2,1,3830,3795,3830,-10,25,25,25,0 >>>>>> 2019-09-06 22:15:35.223845 +0200 info main: #173 C MITPROHB rx msg h 964,-250,RT-BAT-C,5,86400,2,1,3830,3795,3830,-10,25,25,25,0 >>>>>> 2019-09-06 22:16:09.255059 +0200 info main: #173 C MITPROHB rx msg h 964,-260,RT-BAT-C,5,86400,2,1,3830,3795,3830,-10,25,25,25,0 >>>>>> 2019-09-06 22:17:31.919754 +0200 info main: #173 C MITPROHB rx msg h 964,-270,RT-BAT-C,5,86400,2,1,3830,3795,3830,-10,25,25,25,0 >>>>>> 2019-09-06 22:19:23.366267 +0200 info main: #173 C MITPROHB rx msg h 964,-289,RT-BAT-C,5,86400,2,1,3830,3795,3830,-10,25,25,25,0 >>>>>> 2019-09-06 22:21:57.344609 +0200 info main: #173 C MITPROHB rx msg h 964,-299,RT-BAT-C,5,86400,2,1,3830,3795,3830,-10,25,25,25,0 >>>>>> 2019-09-06 22:23:40.082406 +0200 info main: #31 C MITPROHB rx msg h 964,-1027,RT-BAT-C,5,86400,2,1,3830,3795,3830,-10,25,25,25,0 >>>>>> 2019-09-06 22:25:58.061883 +0200 info main: #31 C MITPROHB rx msg h 964,-1040,RT-BAT-C,5,86400,2,1,3830,3795,3830,-10,25,25,25,0 >>>>>> >>>>>> >>>>>> This shows the ticker was only run 299 times from 22:07:48 to 22:21:57. >>>>>> >>>>>> After 22:21:57 the workaround was triggered and did a reconnect. Apparently during that network reinitialization of 103 seconds, >>>>>> the per second ticker was run 628 times. >>>>>> >>>>>> That can't be catching up on the event queue, as that queue has only 20 slots. So something strange is going on here. >>>>>> >>>>>> Any ideas? >>>>>> >>>>>> Regards, >>>>>> Michael >>>>>> >>>>>> >>>>>> Am 06.09.19 um 08:04 schrieb Michael Balzer: >>>>>>> Mark & anyone else running a V2 server, >>>>>>> >>>>>>> as most cars don't send history records, this also needs the change to the server I just pushed, i.e. server version 2.4.2. >>>>>>> >>>>>>> https://github.com/openvehicles/Open-Vehicle-Monitoring-System/commits/maste... >>>>>>> <https://github.com/openvehicles/Open-Vehicle-Monitoring-System/commits/master> >>>>>>> >>>>>>> Regards, >>>>>>> Michael >>>>>>> >>>>>>> >>>>>>> Am 05.09.19 um 19:55 schrieb Michael Balzer: >>>>>>>> I've pushed the nasty workaround: the v2 server checks for no RX over 15 minutes, then restarts the network (wifi & modem) as >>>>>>>> configured for autostart. >>>>>>>> >>>>>>>> Rolled out on my server in edge as 3.2.002-237-ge075f655. >>>>>>>> >>>>>>>> Please test. >>>>>>>> >>>>>>>> Regards, >>>>>>>> Michael >>>>>>>> >>>>>>>> >>>>>>>> Am 05.09.19 um 01:58 schrieb Mark Webb-Johnson: >>>>>>>>>> Mark, you can check your server logs for history messages with ridiculous time offsets: >>>>>>>>>> [sddexter@ns27 server]$ cat log-20190903 | egrep "rx msg h [0-9]+,-[0-9]{4}" | wc -l >>>>>>>>>> 455283 >>>>>>>>> >>>>>>>>> I checked my logs and see 12 vehicles showing this. But, 2 only show this for a debugcrash log (which is expected, I guess, if >>>>>>>>> the time is not synced at report time). I’ve got 4 cars with the offset > 10,000. >>>>>>>>> >>>>>>>>> Regards, Mark. >>>>>>>>> >>>>>>>>>> On 4 Sep 2019, at 4:45 AM, Michael Balzer <dexter@expeedo.de <mailto:dexter@expeedo.de> <mailto:dexter@expeedo.de>> wrote: >>>>>>>>>> >>>>>>>>>> Everyone, >>>>>>>>>> >>>>>>>>>> I've pushed a change that needs some testing. >>>>>>>>>> >>>>>>>>>> I had the issue myself now parking at a certain distance from my garage wifi AP, i.e. on the edge of "in", after wifi had been >>>>>>>>>> disconnected for some hours, and with the module still connected via modem. The wifi blob had been trying to connect to the AP >>>>>>>>>> for about two hours. >>>>>>>>>> >>>>>>>>>> As seen before, the module saw no error, just the server responses and commands stopped coming in. I noticed the default >>>>>>>>>> interface was still "st1" despite wifi having been disconnected and modem connected. The DNS was also still configured for my >>>>>>>>>> wifi network, and the interface seemed to have an IP address -- but wasn't pingable from the wifi network. >>>>>>>>>> >>>>>>>>>> A power cycle of the modem solved the issue without reboot. So the cause may be in the modem/ppp subsystem, or it may be >>>>>>>>>> related (in some weird way) to the default interface / DNS setup. >>>>>>>>>> >>>>>>>>>> More tests showed the default interface again/still got set by the wifi blob itself at some point, overriding our modem >>>>>>>>>> prioritization. The events we didn't handle up to now were "sta.connected" and "sta.lostip", so I added these, and the bug >>>>>>>>>> didn't show up again since then. That doesn't mean anything, so we need to test this. >>>>>>>>>> >>>>>>>>>> The default interface really shouldn't affect inbound packet routing of an established connection, but there always may be >>>>>>>>>> strange bugs lurking in those libs. >>>>>>>>>> >>>>>>>>>> The change also reimplements the wifi signal strength reading, as the tests also showed that still wasn't working well using >>>>>>>>>> the CSI callback. It now seems to be much more reliable. >>>>>>>>>> >>>>>>>>>> Please test & report. The single module will be hard to test, as the bug isn't reproducable easily, but you can still try if >>>>>>>>>> wifi / modem transitions work well. >>>>>>>>>> >>>>>>>>>> Mark, you can check your server logs for history messages with ridiculous time offsets: >>>>>>>>>> [sddexter@ns27 server]$ cat log-20190903 | egrep "rx msg h [0-9]+,-[0-9]{4}" | wc -l >>>>>>>>>> 455283 >>>>>>>>>> The bug now severely affects the V2 server performance, as the server is single threaded and doesn't scale very well to this >>>>>>>>>> kind of bulk data bursts, especially when coming from multiple modules in parallel. So we really need to solve this now. Slow >>>>>>>>>> reactions or connection drops from my server lately have been due to this bug. If this change doesn't solve it, we'll need to >>>>>>>>>> add some reboot trigger on "too many server v2 notification retransmissions" -- or maybe a modem power cycle will do, that >>>>>>>>>> wouldn't discard the data. >>>>>>>>>> >>>>>>>>>> Thanks, >>>>>>>>>> Michael >>>>>>>>>> >>>>>>>>>> >>>>>>>>>> Am 03.09.19 um 07:46 schrieb Mark Webb-Johnson: >>>>>>>>>>> No problem. We can hold. I won’t commit anything for the next few days (and agree to hold-off on Markos’s pull). Let me know >>>>>>>>>>> when you are ready. >>>>>>>>>>> >>>>>>>>>>> Regards, Mark. >>>>>>>>>>> >>>>>>>>>>>> On 3 Sep 2019, at 1:58 AM, Michael Balzer <dexter@expeedo.de <mailto:dexter@expeedo.de>> <mailto:dexter@expeedo.de> wrote: >>>>>>>>>>>> >>>>>>>>>>>> Mark, please wait. >>>>>>>>>>>> >>>>>>>>>>>> I may just have found the cause for issue #241, or at least something I need to investigate before releasing. >>>>>>>>>>>> >>>>>>>>>>>> I need to dig into my logs first, and try something. >>>>>>>>>>>> >>>>>>>>>>>> Regards, >>>>>>>>>>>> Michael >>>>>>>>>>>> >>>>>>>>>>>> >>>>>>>>>>>> Am 02.09.19 um 12:23 schrieb Michael Balzer: >>>>>>>>>>>>> Nothing open from my side at the moment. >>>>>>>>>>>>> >>>>>>>>>>>>> I haven't had the time to look in to Markos pull request, but from a first check also think that's going too deep to be >>>>>>>>>>>>> included in this release. >>>>>>>>>>>>> >>>>>>>>>>>>> Regards, >>>>>>>>>>>>> Michael >>>>>>>>>>>>> >>>>>>>>>>>>> >>>>>>>>>>>>> Am 02.09.19 um 04:15 schrieb Mark Webb-Johnson: >>>>>>>>>>>>>> I think it is well past time for a 3.2.003 release. Things seems table in edge (although some things only partially >>>>>>>>>>>>>> implemented). >>>>>>>>>>>>>> >>>>>>>>>>>>>> Anything people want to include at the last minute, or can we go ahead and build? >>>>>>>>>>>>>> >>>>>>>>>>>>>> Regards, Mark. >>>>>>>>>>>>>>
-- Michael Balzer * Helkenberger Weg 9 * D-58256 Ennepetal Fon 02333 / 833 5735 * Handy 0176 / 206 989 26
OK. I released v3.2.005 to general release. Both EAP and MAIN now have that version. Regards, Mark
On 25 Sep 2019, at 3:31 PM, Michael Balzer <dexter@expeedo.de> wrote:
Mark,
go ahead, I'll follow. I don't have any bad reports from edge or eap.
Regards, Michael
Am 25.09.19 um 03:47 schrieb Mark Webb-Johnson:
This is what I have (api.openvehicles.com <http://api.openvehicles.com/>):
==> eap/ovms3.ver <== 3.2.005 Tue Sep 19 08:00:00 UTC 2019 OTA release
==> edge/ovms3.ver <== 3.2.005-1-g7f86e9c Thu Sep 19 16:01:18 UTC 2019 Automated build (markhk8)
==> main/ovms3.ver <== 3.2.002 Sun May 12 08:00:00 UTC 2019 OTA release
The 3.2.005 seems stable, so I think it can now go eap->main.
@Michael: Should we co-ordinate and do this later today, or have you already released 3.2.005 to main?
Regards, Mark.
On 25 Sep 2019, at 2:21 AM, Bernd Geistert <b_ghosti@gmx.de <mailto:b_ghosti@gmx.de>> wrote:
IMHO, currently: - in MAIN is 3.2.002 - in EAP is 3.2.003 - in EDGE is 3.2.005-1-g7f86e9c
Am 19.09.2019 um 10:22 schrieb Mark Webb-Johnson:
OK, I’ve built:
2019-09-19 MWJ 3.2.005 OTA release - Default module/debug.tasks to FALSE Users that volunteer to submit tasks debug historical data to the Open Vehicles project, should (with appreciation) set: config set module debug.tasks yes This will be transmit approximately 700MB of data a month (over cellular/wifi).
2019-09-19 MWJ 3.2.004 OTA release - Skipped for Chinese superstitous reasons
In EAP now, and I will announce.
Regards, Mark.
On 19 Sep 2019, at 3:34 PM, Michael Balzer <dexter@expeedo.de <mailto:dexter@expeedo.de>> wrote:
Correct.
Regards, Michael
Am 19.09.19 um 09:29 schrieb Mark Webb-Johnson:
I’m just worried about the users who don’t know about this new feature. When they deploy this version, they suddenly start sending 6MB of data a month up to us.
I think the ‘fix’ is just to change ovms_module.c:
MyConfig.GetParamValueBool("module", "debug.tasks", true)
to
MyConfig.GetParamValueBool("module", "debug.tasks", false)
That would then only submit these logs for those that explicitly turn it on?
Regards, Mark.
> On 19 Sep 2019, at 3:23 PM, Michael Balzer <dexter@expeedo.de <mailto:dexter@expeedo.de>> wrote: > > Sorry, I didn't think about this being an issue elsewhere -- german data plans typically start at minimum 100 MB/month flat (that's my current plan at 3 € / month). > > No need for a new release, it can be turned off OTA by issueing > > config set module debug.tasks no > > Regards, > Michael > > > Am 19.09.19 um 09:08 schrieb Mark Webb-Johnson: >> Yep: >> >> 758 bytes * (86400 / 300) * 30 = 6.5MB/month >> >> That is going over data (not SD). Presumably cellular data for a large portion of the time. >> >> I think we need to default this to OFF, and make a 3.2.004 to avoid this becoming an issue. >> >> Regards, Mark. >> >>> On 19 Sep 2019, at 2:04 PM, Stephen Casner <casner@acm.org <mailto:casner@acm.org>> wrote: >>> >>> That's 6.55MB/month, unless you have unusually short months! :-) >>> >>> In what space is that data stored? A log written to SD? That's not >>> likely to fill up the SD card too fast, but what happens if no SD card >>> is installed? >>> >>> -- Steve >>> >>> On Thu, 19 Sep 2019, Mark Webb-Johnson wrote: >>> >>>>> To enable CPU usage statistics, apply the changes to sdkconfig >>>>> included. >>>>> New history record: >>>>> - "*-OVM-DebugTasks" v1: <taskcnt,totaltime> + per task: >>>>> <tasknum,name,state,stack_now,stack_max,stack_total, >>>>> heap_total,heap_32bit,heap_spi,runtime> >>>>> Note: CPU core use percentage = runtime / totaltime >>>> >>>> I’ve just noticed that this is enabled by default now (my production build has the sdkconfig updated, as per defaults). >>>> >>>> I am seeing 758 bytes of history record, every 5 minutes. About 218KB/day, or 654KB/month. >>>> >>>> Should this be opt-in? >>>> >>>> Regards, Mark. >>>> >>>>> On 8 Sep 2019, at 5:43 PM, Michael Balzer <dexter@expeedo.de <mailto:dexter@expeedo.de>> wrote: >>>>> >>>>> I've pushed some modifications and improvements to (hopefully) fix the timer issue or at least be able to debug it. >>>>> >>>>> Some sdkconfig changes are necessary. >>>>> >>>>> The build including these updates is on my edge release as 3.2.002-258-g20ae554b. >>>>> >>>>> Btw: the network restart strategy seems to mitigate issue #241; I've seen a major drop on record repetitions on my server since the rollout. >>>>> >>>>> >>>>> commit 99e4e48bdd40b7004c0976f51aba9e3da4ecab53 >>>>> >>>>> Module: add per task CPU usage statistics, add task stats history records >>>>> >>>>> To enable CPU usage statistics, apply the changes to sdkconfig >>>>> included. The CPU usage shown by the commands is calculated against >>>>> the last task status retrieved (or system boot). >>>>> >>>>> Command changes: >>>>> - "module tasks" -- added CPU (core) usage in percent per task >>>>> >>>>> New command: >>>>> - "module tasks data" -- output task stats in history record form >>>>> >>>>> New config: >>>>> - [module] debug.tasks -- yes (default) = send task stats every 5 minutes >>>>> >>>>> New history record: >>>>> - "*-OVM-DebugTasks" v1: <taskcnt,totaltime> + per task: >>>>> <tasknum,name,state,stack_now,stack_max,stack_total, >>>>> heap_total,heap_32bit,heap_spi,runtime> >>>>> Note: CPU core use percentage = runtime / totaltime >>>>> >>>>> commit 950172c216a72beb4da0bc7a40a46995a6105955 >>>>> >>>>> Build config: default timer service task priority raised to 20 >>>>> >>>>> Background: the FreeRTOS timer service shall only be used for very >>>>> short and non-blocking jobs. We delegate event processing to our >>>>> events task, anything else in timers needs to run with high >>>>> priority. >>>>> >>>>> commit 31ac19d187480046c16356b80668de45cacbb83d >>>>> >>>>> DukTape: add build config for task priority, default lowered to 3 >>>>> >>>>> Background: the DukTape garbage collector shall run on lower >>>>> priority than tasks like SIMCOM & events >>>>> >>>>> commit e0a44791fbcfb5a4e4cad24c9d1163b76e637b4f >>>>> >>>>> Server V2: use esp_log_timestamp for timeout detection, >>>>> add timeout config, limit data records & size per second >>>>> >>>>> New config: >>>>> - [server.v2] timeout.rx -- timeout in seconds, default 960 >>>>> >>>>> commit 684a4ce9525175a910040f0d1ca82ac212fbf5de >>>>> >>>>> Notify: use esp_log_timestamp for creation time instead of monotonictime >>>>> to harden against timer service starvation / ticker event drops >>>>> >>>>> >>>>> Regards, >>>>> Michael >>>>> >>>>> >>>>> Am 07.09.19 um 10:55 schrieb Michael Balzer: >>>>>> I think the RTOS timer service task starves. It's running on core 0 with priority 1. >>>>>> >>>>>> Taks on core 0 sorted by priority: >>>>>> >>>>>> Number of Tasks = 20 Stack: Now Max Total Heap 32-bit SPIRAM C# PRI >>>>>> 3FFC84A8 6 Blk ipc0 388 500 1024 7788 0 0 0 24 >>>>>> 3FFC77F0 5 Blk OVMS CanRx 428 428 2048 3052 0 31844 0 23 >>>>>> 3FFAFBF4 1 Blk esp_timer 400 656 4096 35928 644 25804 0 22 >>>>>> 3FFD3240 19 Blk wifi 460 2716 3584 43720 0 20 0 22 >>>>>> 3FFC03C4 2 Blk eventTask 448 1984 4608 104 0 0 0 20 >>>>>> 3FFC8F14 17 Blk tiT 500 2308 3072 6552 0 0 * 18 >>>>>> 3FFE14F0 26 Blk OVMS COrx 456 456 4096 0 0 0 0 7 >>>>>> 3FFE19D4 27 Blk OVMS COwrk 476 476 3072 0 0 0 0 7 >>>>>> 3FFCBC34 12 Blk Tmr Svc 352 928 3072 88 0 0 0 1 >>>>>> 3FFE7708 23 Blk mdns 468 1396 4096 108 0 0 0 1 >>>>>> >>>>>> I don't think it's our CanRx, as that only fetches and queues CAN frames, the actual work is done by the listeners. The CO tasks only run for CANopen jobs, which are few for normal operation. >>>>>> >>>>>> That leaves the system tasks, with main suspect -once again- the wifi blob. >>>>>> >>>>>> We need to know how much CPU time the tasks actually use now. I think I saw some option for this in the FreeRTOS config. >>>>>> >>>>>> Regards, >>>>>> Michael >>>>>> >>>>>> >>>>>> Am 06.09.19 um 23:15 schrieb Michael Balzer: >>>>>>> The workaround is based on the monotonictime being updated per second, as do the history record offsets. >>>>>>> >>>>>>> Apparently, that mechanism doesn't work reliably. That may be an indicator for some bigger underlying issue. >>>>>>> >>>>>>> Example log excerpt: >>>>>>> >>>>>>> 2019-09-06 22:07:48.126919 +0200 info main: #173 C MITPROHB rx msg h 964,0,RT-BAT-C,5,86400,2,1,3830,3795,3830,-10,25,25,25,0 >>>>>>> 2019-09-06 22:09:03.089031 +0200 info main: #173 C MITPROHB rx msg h 964,-10,RT-BAT-C,5,86400,2,1,3830,3795,3830,-10,25,25,25,0 >>>>>>> 2019-09-06 22:09:05.041574 +0200 info main: #173 C MITPROHB rx msg h 964,-20,RT-BAT-C,5,86400,2,1,3830,3795,3830,-10,25,25,25,0 >>>>>>> 2019-09-06 22:09:05.052644 +0200 info main: #173 C MITPROHB rx msg h 964,-30,RT-BAT-C,5,86400,2,1,3830,3795,3830,-10,25,25,25,0 >>>>>>> 2019-09-06 22:09:05.063617 +0200 info main: #173 C MITPROHB rx msg h 964,-49,RT-BAT-C,5,86400,2,1,3830,3795,3830,-10,25,25,25,0 >>>>>>> 2019-09-06 22:09:05.077527 +0200 info main: #173 C MITPROHB rx msg h 964,-59,RT-BAT-C,5,86400,2,1,3830,3795,3830,-10,25,25,25,0 >>>>>>> 2019-09-06 22:09:05.193775 +0200 info main: #173 C MITPROHB rx msg h 964,-70,RT-BAT-C,5,86400,2,1,3830,3795,3830,-10,25,25,25,0 >>>>>>> 2019-09-06 22:09:13.190645 +0200 info main: #173 C MITPROHB rx msg h 964,-80,RT-BAT-C,5,86400,2,1,3830,3795,3830,-10,25,25,25,0 >>>>>>> 2019-09-06 22:09:22.077994 +0200 info main: #173 C MITPROHB rx msg h 964,-90,RT-BAT-C,5,86400,2,1,3830,3795,3830,-10,25,25,25,0 >>>>>>> 2019-09-06 22:09:54.590300 +0200 info main: #173 C MITPROHB rx msg h 964,-109,RT-BAT-C,5,86400,2,1,3830,3795,3830,-10,25,25,25,0 >>>>>>> 2019-09-06 22:11:10.127054 +0200 info main: #173 C MITPROHB rx msg h 964,-119,RT-BAT-C,5,86400,2,1,3830,3795,3830,-10,25,25,25,0 >>>>>>> 2019-09-06 22:11:16.794200 +0200 info main: #173 C MITPROHB rx msg h 964,-130,RT-BAT-C,5,86400,2,1,3830,3795,3830,-10,25,25,25,0 >>>>>>> 2019-09-06 22:11:22.455652 +0200 info main: #173 C MITPROHB rx msg h 964,-140,RT-BAT-C,5,86400,2,1,3830,3795,3830,-10,25,25,25,0 >>>>>>> 2019-09-06 22:12:49.423412 +0200 info main: #173 C MITPROHB rx msg h 964,-150,RT-BAT-C,5,86400,2,1,3830,3795,3830,-10,25,25,25,0 >>>>>>> 2019-09-06 22:12:49.442096 +0200 info main: #173 C MITPROHB rx msg h 964,-169,RT-BAT-C,5,86400,2,1,3830,3795,3830,-10,25,25,25,0 >>>>>>> 2019-09-06 22:12:49.461941 +0200 info main: #173 C MITPROHB rx msg h 964,-179,RT-BAT-C,5,86400,2,1,3830,3795,3830,-10,25,25,25,0 >>>>>>> 2019-09-06 22:14:39.828133 +0200 info main: #173 C MITPROHB rx msg h 964,-190,RT-BAT-C,5,86400,2,1,3830,3795,3830,-10,25,25,25,0 >>>>>>> 2019-09-06 22:14:39.858144 +0200 info main: #173 C MITPROHB rx msg h 964,-200,RT-BAT-C,5,86400,2,1,3830,3795,3830,-10,25,25,25,0 >>>>>>> 2019-09-06 22:14:52.020319 +0200 info main: #173 C MITPROHB rx msg h 964,-210,RT-BAT-C,5,86400,2,1,3830,3795,3830,-10,25,25,25,0 >>>>>>> 2019-09-06 22:14:54.452637 +0200 info main: #173 C MITPROHB rx msg h 964,-229,RT-BAT-C,5,86400,2,1,3830,3795,3830,-10,25,25,25,0 >>>>>>> 2019-09-06 22:15:12.613935 +0200 info main: #173 C MITPROHB rx msg h 964,-239,RT-BAT-C,5,86400,2,1,3830,3795,3830,-10,25,25,25,0 >>>>>>> 2019-09-06 22:15:35.223845 +0200 info main: #173 C MITPROHB rx msg h 964,-250,RT-BAT-C,5,86400,2,1,3830,3795,3830,-10,25,25,25,0 >>>>>>> 2019-09-06 22:16:09.255059 +0200 info main: #173 C MITPROHB rx msg h 964,-260,RT-BAT-C,5,86400,2,1,3830,3795,3830,-10,25,25,25,0 >>>>>>> 2019-09-06 22:17:31.919754 +0200 info main: #173 C MITPROHB rx msg h 964,-270,RT-BAT-C,5,86400,2,1,3830,3795,3830,-10,25,25,25,0 >>>>>>> 2019-09-06 22:19:23.366267 +0200 info main: #173 C MITPROHB rx msg h 964,-289,RT-BAT-C,5,86400,2,1,3830,3795,3830,-10,25,25,25,0 >>>>>>> 2019-09-06 22:21:57.344609 +0200 info main: #173 C MITPROHB rx msg h 964,-299,RT-BAT-C,5,86400,2,1,3830,3795,3830,-10,25,25,25,0 >>>>>>> 2019-09-06 22:23:40.082406 +0200 info main: #31 C MITPROHB rx msg h 964,-1027,RT-BAT-C,5,86400,2,1,3830,3795,3830,-10,25,25,25,0 >>>>>>> 2019-09-06 22:25:58.061883 +0200 info main: #31 C MITPROHB rx msg h 964,-1040,RT-BAT-C,5,86400,2,1,3830,3795,3830,-10,25,25,25,0 >>>>>>> >>>>>>> >>>>>>> This shows the ticker was only run 299 times from 22:07:48 to 22:21:57. >>>>>>> >>>>>>> After 22:21:57 the workaround was triggered and did a reconnect. Apparently during that network reinitialization of 103 seconds, the per second ticker was run 628 times. >>>>>>> >>>>>>> That can't be catching up on the event queue, as that queue has only 20 slots. So something strange is going on here. >>>>>>> >>>>>>> Any ideas? >>>>>>> >>>>>>> Regards, >>>>>>> Michael >>>>>>> >>>>>>> >>>>>>> Am 06.09.19 um 08:04 schrieb Michael Balzer: >>>>>>>> Mark & anyone else running a V2 server, >>>>>>>> >>>>>>>> as most cars don't send history records, this also needs the change to the server I just pushed, i.e. server version 2.4.2. >>>>>>>> >>>>>>>> https://github.com/openvehicles/Open-Vehicle-Monitoring-System/commits/maste... <https://github.com/openvehicles/Open-Vehicle-Monitoring-System/commits/master> <https://github.com/openvehicles/Open-Vehicle-Monitoring-System/commits/maste... <https://github.com/openvehicles/Open-Vehicle-Monitoring-System/commits/master>> >>>>>>>> >>>>>>>> Regards, >>>>>>>> Michael >>>>>>>> >>>>>>>> >>>>>>>> Am 05.09.19 um 19:55 schrieb Michael Balzer: >>>>>>>>> I've pushed the nasty workaround: the v2 server checks for no RX over 15 minutes, then restarts the network (wifi & modem) as configured for autostart. >>>>>>>>> >>>>>>>>> Rolled out on my server in edge as 3.2.002-237-ge075f655. >>>>>>>>> >>>>>>>>> Please test. >>>>>>>>> >>>>>>>>> Regards, >>>>>>>>> Michael >>>>>>>>> >>>>>>>>> >>>>>>>>> Am 05.09.19 um 01:58 schrieb Mark Webb-Johnson: >>>>>>>>>>> Mark, you can check your server logs for history messages with ridiculous time offsets: >>>>>>>>>>> [sddexter@ns27 server]$ cat log-20190903 | egrep "rx msg h [0-9]+,-[0-9]{4}" | wc -l >>>>>>>>>>> 455283 >>>>>>>>>> >>>>>>>>>> I checked my logs and see 12 vehicles showing this. But, 2 only show this for a debugcrash log (which is expected, I guess, if the time is not synced at report time). I’ve got 4 cars with the offset > 10,000. >>>>>>>>>> >>>>>>>>>> Regards, Mark. >>>>>>>>>> >>>>>>>>>>> On 4 Sep 2019, at 4:45 AM, Michael Balzer <dexter@expeedo.de <mailto:dexter@expeedo.de> <mailto:dexter@expeedo.de <mailto:dexter@expeedo.de>>> wrote: >>>>>>>>>>> >>>>>>>>>>> Everyone, >>>>>>>>>>> >>>>>>>>>>> I've pushed a change that needs some testing. >>>>>>>>>>> >>>>>>>>>>> I had the issue myself now parking at a certain distance from my garage wifi AP, i.e. on the edge of "in", after wifi had been disconnected for some hours, and with the module still connected via modem. The wifi blob had been trying to connect to the AP for about two hours. >>>>>>>>>>> >>>>>>>>>>> As seen before, the module saw no error, just the server responses and commands stopped coming in. I noticed the default interface was still "st1" despite wifi having been disconnected and modem connected. The DNS was also still configured for my wifi network, and the interface seemed to have an IP address -- but wasn't pingable from the wifi network. >>>>>>>>>>> >>>>>>>>>>> A power cycle of the modem solved the issue without reboot. So the cause may be in the modem/ppp subsystem, or it may be related (in some weird way) to the default interface / DNS setup. >>>>>>>>>>> >>>>>>>>>>> More tests showed the default interface again/still got set by the wifi blob itself at some point, overriding our modem prioritization. The events we didn't handle up to now were "sta.connected" and "sta.lostip", so I added these, and the bug didn't show up again since then. That doesn't mean anything, so we need to test this. >>>>>>>>>>> >>>>>>>>>>> The default interface really shouldn't affect inbound packet routing of an established connection, but there always may be strange bugs lurking in those libs. >>>>>>>>>>> >>>>>>>>>>> The change also reimplements the wifi signal strength reading, as the tests also showed that still wasn't working well using the CSI callback. It now seems to be much more reliable. >>>>>>>>>>> >>>>>>>>>>> Please test & report. The single module will be hard to test, as the bug isn't reproducable easily, but you can still try if wifi / modem transitions work well. >>>>>>>>>>> >>>>>>>>>>> Mark, you can check your server logs for history messages with ridiculous time offsets: >>>>>>>>>>> [sddexter@ns27 server]$ cat log-20190903 | egrep "rx msg h [0-9]+,-[0-9]{4}" | wc -l >>>>>>>>>>> 455283 >>>>>>>>>>> The bug now severely affects the V2 server performance, as the server is single threaded and doesn't scale very well to this kind of bulk data bursts, especially when coming from multiple modules in parallel. So we really need to solve this now. Slow reactions or connection drops from my server lately have been due to this bug. If this change doesn't solve it, we'll need to add some reboot trigger on "too many server v2 notification retransmissions" -- or maybe a modem power cycle will do, that wouldn't discard the data. >>>>>>>>>>> >>>>>>>>>>> Thanks, >>>>>>>>>>> Michael >>>>>>>>>>> >>>>>>>>>>> >>>>>>>>>>> Am 03.09.19 um 07:46 schrieb Mark Webb-Johnson: >>>>>>>>>>>> No problem. We can hold. I won’t commit anything for the next few days (and agree to hold-off on Markos’s pull). Let me know when you are ready. >>>>>>>>>>>> >>>>>>>>>>>> Regards, Mark. >>>>>>>>>>>> >>>>>>>>>>>>> On 3 Sep 2019, at 1:58 AM, Michael Balzer <dexter@expeedo.de <mailto:dexter@expeedo.de>> <mailto:dexter@expeedo.de <mailto:dexter@expeedo.de>> wrote: >>>>>>>>>>>>> >>>>>>>>>>>>> Mark, please wait. >>>>>>>>>>>>> >>>>>>>>>>>>> I may just have found the cause for issue #241, or at least something I need to investigate before releasing. >>>>>>>>>>>>> >>>>>>>>>>>>> I need to dig into my logs first, and try something. >>>>>>>>>>>>> >>>>>>>>>>>>> Regards, >>>>>>>>>>>>> Michael >>>>>>>>>>>>> >>>>>>>>>>>>> >>>>>>>>>>>>> Am 02.09.19 um 12:23 schrieb Michael Balzer: >>>>>>>>>>>>>> Nothing open from my side at the moment. >>>>>>>>>>>>>> >>>>>>>>>>>>>> I haven't had the time to look in to Markos pull request, but from a first check also think that's going too deep to be included in this release. >>>>>>>>>>>>>> >>>>>>>>>>>>>> Regards, >>>>>>>>>>>>>> Michael >>>>>>>>>>>>>> >>>>>>>>>>>>>> >>>>>>>>>>>>>> Am 02.09.19 um 04:15 schrieb Mark Webb-Johnson: >>>>>>>>>>>>>>> I think it is well past time for a 3.2.003 release. Things seems table in edge (although some things only partially implemented). >>>>>>>>>>>>>>> >>>>>>>>>>>>>>> Anything people want to include at the last minute, or can we go ahead and build? >>>>>>>>>>>>>>> >>>>>>>>>>>>>>> Regards, Mark. >>>>>>>>>>>>>>> >
-- Michael Balzer * Helkenberger Weg 9 * D-58256 Ennepetal Fon 02333 / 833 5735 * Handy 0176 / 206 989 26 _______________________________________________ OvmsDev mailing list OvmsDev@lists.openvehicles.com http://lists.openvehicles.com/mailman/listinfo/ovmsdev
Same on my server. Current version in all three branches is 3.2.005-42-g0e8f7306. Commit offset 42 because my builds are from spiram-fix-test. Regards, Michael Am 25.09.19 um 14:14 schrieb Mark Webb-Johnson:
OK. I released v3.2.005 to general release. Both EAP and MAIN now have that version.
Regards, Mark
On 25 Sep 2019, at 3:31 PM, Michael Balzer <dexter@expeedo.de <mailto:dexter@expeedo.de>> wrote:
Mark,
go ahead, I'll follow. I don't have any bad reports from edge or eap.
Regards, Michael
Am 25.09.19 um 03:47 schrieb Mark Webb-Johnson:
This is what I have (api.openvehicles.com <http://api.openvehicles.com/>):
==> eap/ovms3.ver <== 3.2.005 Tue Sep 19 08:00:00 UTC 2019 OTA release
==> edge/ovms3.ver <== 3.2.005-1-g7f86e9c Thu Sep 19 16:01:18 UTC 2019 Automated build (markhk8)
==> main/ovms3.ver <== 3.2.002 Sun May 12 08:00:00 UTC 2019 OTA release
The 3.2.005 seems stable, so I think it can now go eap->main.
@Michael: Should we co-ordinate and do this later today, or have you already released 3.2.005 to main?
Regards, Mark.
On 25 Sep 2019, at 2:21 AM, Bernd Geistert <b_ghosti@gmx.de <mailto:b_ghosti@gmx.de>> wrote:
IMHO, currently: - in MAIN is 3.2.002 - in EAP is 3.2.003 - in EDGE is 3.2.005-1-g7f86e9c
Am 19.09.2019 um 10:22 schrieb Mark Webb-Johnson:
OK, I’ve built:
2019-09-19 MWJ 3.2.005 OTA release - Default module/debug.tasks to FALSE Users that volunteer to submit tasks debug historical data to the Open Vehicles project, should (with appreciation) set: config set module debug.tasks yes This will be transmit approximately 700MB of data a month (over cellular/wifi).
2019-09-19 MWJ 3.2.004 OTA release - Skipped for Chinese superstitous reasons
In EAP now, and I will announce.
Regards, Mark.
On 19 Sep 2019, at 3:34 PM, Michael Balzer <dexter@expeedo.de <mailto:dexter@expeedo.de>> wrote:
Correct.
Regards, Michael
Am 19.09.19 um 09:29 schrieb Mark Webb-Johnson: > I’m just worried about the users who don’t know about this new feature. When they deploy this version, they suddenly start sending 6MB of data a month > up to us. > > I think the ‘fix’ is just to change ovms_module.c: > > MyConfig.GetParamValueBool("module", "debug.tasks", true) > > to > > MyConfig.GetParamValueBool("module", "debug.tasks", false) > > > That would then only submit these logs for those that explicitly turn it on? > > Regards, Mark. > >> On 19 Sep 2019, at 3:23 PM, Michael Balzer <dexter@expeedo.de <mailto:dexter@expeedo.de>> wrote: >> >> Sorry, I didn't think about this being an issue elsewhere -- german data plans typically start at minimum 100 MB/month flat (that's my current plan at >> 3 € / month). >> >> No need for a new release, it can be turned off OTA by issueing >> >> config set module debug.tasks no >> >> Regards, >> Michael >> >> >> Am 19.09.19 um 09:08 schrieb Mark Webb-Johnson: >>> Yep: >>> >>> 758 bytes * (86400 / 300) * 30 = 6.5MB/month >>> >>> >>> That is going over data (not SD). Presumably cellular data for a large portion of the time. >>> >>> I think we need to default this to OFF, and make a 3.2.004 to avoid this becoming an issue. >>> >>> Regards, Mark. >>> >>>> On 19 Sep 2019, at 2:04 PM, Stephen Casner <casner@acm.org <mailto:casner@acm.org>> wrote: >>>> >>>> That's 6.55MB/month, unless you have unusually short months! :-) >>>> >>>> In what space is that data stored? A log written to SD? That's not >>>> likely to fill up the SD card too fast, but what happens if no SD card >>>> is installed? >>>> >>>> -- Steve >>>> >>>> On Thu, 19 Sep 2019, Mark Webb-Johnson wrote: >>>> >>>>>> To enable CPU usage statistics, apply the changes to sdkconfig >>>>>> included. >>>>>> New history record: >>>>>> - "*-OVM-DebugTasks" v1: <taskcnt,totaltime> + per task: >>>>>> <tasknum,name,state,stack_now,stack_max,stack_total, >>>>>> heap_total,heap_32bit,heap_spi,runtime> >>>>>> Note: CPU core use percentage = runtime / totaltime >>>>> >>>>> I’ve just noticed that this is enabled by default now (my production build has the sdkconfig updated, as per defaults). >>>>> >>>>> I am seeing 758 bytes of history record, every 5 minutes. About 218KB/day, or 654KB/month. >>>>> >>>>> Should this be opt-in? >>>>> >>>>> Regards, Mark. >>>>> >>>>>> On 8 Sep 2019, at 5:43 PM, Michael Balzer <dexter@expeedo.de <mailto:dexter@expeedo.de>> wrote: >>>>>> >>>>>> I've pushed some modifications and improvements to (hopefully) fix the timer issue or at least be able to debug it. >>>>>> >>>>>> Some sdkconfig changes are necessary. >>>>>> >>>>>> The build including these updates is on my edge release as 3.2.002-258-g20ae554b. >>>>>> >>>>>> Btw: the network restart strategy seems to mitigate issue #241; I've seen a major drop on record repetitions on my server since the rollout. >>>>>> >>>>>> >>>>>> commit 99e4e48bdd40b7004c0976f51aba9e3da4ecab53 >>>>>> >>>>>> Module: add per task CPU usage statistics, add task stats history records >>>>>> >>>>>> To enable CPU usage statistics, apply the changes to sdkconfig >>>>>> included. The CPU usage shown by the commands is calculated against >>>>>> the last task status retrieved (or system boot). >>>>>> >>>>>> Command changes: >>>>>> - "module tasks" -- added CPU (core) usage in percent per task >>>>>> >>>>>> New command: >>>>>> - "module tasks data" -- output task stats in history record form >>>>>> >>>>>> New config: >>>>>> - [module] debug.tasks -- yes (default) = send task stats every 5 minutes >>>>>> >>>>>> New history record: >>>>>> - "*-OVM-DebugTasks" v1: <taskcnt,totaltime> + per task: >>>>>> <tasknum,name,state,stack_now,stack_max,stack_total, >>>>>> heap_total,heap_32bit,heap_spi,runtime> >>>>>> Note: CPU core use percentage = runtime / totaltime >>>>>> >>>>>> commit 950172c216a72beb4da0bc7a40a46995a6105955 >>>>>> >>>>>> Build config: default timer service task priority raised to 20 >>>>>> >>>>>> Background: the FreeRTOS timer service shall only be used for very >>>>>> short and non-blocking jobs. We delegate event processing to our >>>>>> events task, anything else in timers needs to run with high >>>>>> priority. >>>>>> >>>>>> commit 31ac19d187480046c16356b80668de45cacbb83d >>>>>> >>>>>> DukTape: add build config for task priority, default lowered to 3 >>>>>> >>>>>> Background: the DukTape garbage collector shall run on lower >>>>>> priority than tasks like SIMCOM & events >>>>>> >>>>>> commit e0a44791fbcfb5a4e4cad24c9d1163b76e637b4f >>>>>> >>>>>> Server V2: use esp_log_timestamp for timeout detection, >>>>>> add timeout config, limit data records & size per second >>>>>> >>>>>> New config: >>>>>> - [server.v2] timeout.rx -- timeout in seconds, default 960 >>>>>> >>>>>> commit 684a4ce9525175a910040f0d1ca82ac212fbf5de >>>>>> >>>>>> Notify: use esp_log_timestamp for creation time instead of monotonictime >>>>>> to harden against timer service starvation / ticker event drops >>>>>> >>>>>> >>>>>> Regards, >>>>>> Michael >>>>>> >>>>>> >>>>>> Am 07.09.19 um 10:55 schrieb Michael Balzer: >>>>>>> I think the RTOS timer service task starves. It's running on core 0 with priority 1. >>>>>>> >>>>>>> Taks on core 0 sorted by priority: >>>>>>> >>>>>>> Number of Tasks = 20 Stack: Now Max Total Heap 32-bit SPIRAM C# PRI >>>>>>> 3FFC84A8 6 Blk ipc0 388 500 1024 7788 0 0 0 24 >>>>>>> 3FFC77F0 5 Blk OVMS CanRx 428 428 2048 3052 0 31844 0 23 >>>>>>> 3FFAFBF4 1 Blk esp_timer 400 656 4096 35928 644 25804 0 22 >>>>>>> 3FFD3240 19 Blk wifi 460 2716 3584 43720 0 20 0 22 >>>>>>> 3FFC03C4 2 Blk eventTask 448 1984 4608 104 0 0 0 20 >>>>>>> 3FFC8F14 17 Blk tiT 500 2308 3072 6552 0 0 * 18 >>>>>>> 3FFE14F0 26 Blk OVMS COrx 456 456 4096 0 0 0 0 7 >>>>>>> 3FFE19D4 27 Blk OVMS COwrk 476 476 3072 0 0 0 0 7 >>>>>>> 3FFCBC34 12 Blk Tmr Svc 352 928 3072 88 0 0 0 1 >>>>>>> 3FFE7708 23 Blk mdns 468 1396 4096 108 0 0 0 1 >>>>>>> >>>>>>> I don't think it's our CanRx, as that only fetches and queues CAN frames, the actual work is done by the listeners. The CO tasks only run for >>>>>>> CANopen jobs, which are few for normal operation. >>>>>>> >>>>>>> That leaves the system tasks, with main suspect -once again- the wifi blob. >>>>>>> >>>>>>> We need to know how much CPU time the tasks actually use now. I think I saw some option for this in the FreeRTOS config. >>>>>>> >>>>>>> Regards, >>>>>>> Michael >>>>>>> >>>>>>> >>>>>>> Am 06.09.19 um 23:15 schrieb Michael Balzer: >>>>>>>> The workaround is based on the monotonictime being updated per second, as do the history record offsets. >>>>>>>> >>>>>>>> Apparently, that mechanism doesn't work reliably. That may be an indicator for some bigger underlying issue. >>>>>>>> >>>>>>>> Example log excerpt: >>>>>>>> >>>>>>>> 2019-09-06 22:07:48.126919 +0200 info main: #173 C MITPROHB rx msg h 964,0,RT-BAT-C,5,86400,2,1,3830,3795,3830,-10,25,25,25,0 >>>>>>>> 2019-09-06 22:09:03.089031 +0200 info main: #173 C MITPROHB rx msg h 964,-10,RT-BAT-C,5,86400,2,1,3830,3795,3830,-10,25,25,25,0 >>>>>>>> 2019-09-06 22:09:05.041574 +0200 info main: #173 C MITPROHB rx msg h 964,-20,RT-BAT-C,5,86400,2,1,3830,3795,3830,-10,25,25,25,0 >>>>>>>> 2019-09-06 22:09:05.052644 +0200 info main: #173 C MITPROHB rx msg h 964,-30,RT-BAT-C,5,86400,2,1,3830,3795,3830,-10,25,25,25,0 >>>>>>>> 2019-09-06 22:09:05.063617 +0200 info main: #173 C MITPROHB rx msg h 964,-49,RT-BAT-C,5,86400,2,1,3830,3795,3830,-10,25,25,25,0 >>>>>>>> 2019-09-06 22:09:05.077527 +0200 info main: #173 C MITPROHB rx msg h 964,-59,RT-BAT-C,5,86400,2,1,3830,3795,3830,-10,25,25,25,0 >>>>>>>> 2019-09-06 22:09:05.193775 +0200 info main: #173 C MITPROHB rx msg h 964,-70,RT-BAT-C,5,86400,2,1,3830,3795,3830,-10,25,25,25,0 >>>>>>>> 2019-09-06 22:09:13.190645 +0200 info main: #173 C MITPROHB rx msg h 964,-80,RT-BAT-C,5,86400,2,1,3830,3795,3830,-10,25,25,25,0 >>>>>>>> 2019-09-06 22:09:22.077994 +0200 info main: #173 C MITPROHB rx msg h 964,-90,RT-BAT-C,5,86400,2,1,3830,3795,3830,-10,25,25,25,0 >>>>>>>> 2019-09-06 22:09:54.590300 +0200 info main: #173 C MITPROHB rx msg h 964,-109,RT-BAT-C,5,86400,2,1,3830,3795,3830,-10,25,25,25,0 >>>>>>>> 2019-09-06 22:11:10.127054 +0200 info main: #173 C MITPROHB rx msg h 964,-119,RT-BAT-C,5,86400,2,1,3830,3795,3830,-10,25,25,25,0 >>>>>>>> 2019-09-06 22:11:16.794200 +0200 info main: #173 C MITPROHB rx msg h 964,-130,RT-BAT-C,5,86400,2,1,3830,3795,3830,-10,25,25,25,0 >>>>>>>> 2019-09-06 22:11:22.455652 +0200 info main: #173 C MITPROHB rx msg h 964,-140,RT-BAT-C,5,86400,2,1,3830,3795,3830,-10,25,25,25,0 >>>>>>>> 2019-09-06 22:12:49.423412 +0200 info main: #173 C MITPROHB rx msg h 964,-150,RT-BAT-C,5,86400,2,1,3830,3795,3830,-10,25,25,25,0 >>>>>>>> 2019-09-06 22:12:49.442096 +0200 info main: #173 C MITPROHB rx msg h 964,-169,RT-BAT-C,5,86400,2,1,3830,3795,3830,-10,25,25,25,0 >>>>>>>> 2019-09-06 22:12:49.461941 +0200 info main: #173 C MITPROHB rx msg h 964,-179,RT-BAT-C,5,86400,2,1,3830,3795,3830,-10,25,25,25,0 >>>>>>>> 2019-09-06 22:14:39.828133 +0200 info main: #173 C MITPROHB rx msg h 964,-190,RT-BAT-C,5,86400,2,1,3830,3795,3830,-10,25,25,25,0 >>>>>>>> 2019-09-06 22:14:39.858144 +0200 info main: #173 C MITPROHB rx msg h 964,-200,RT-BAT-C,5,86400,2,1,3830,3795,3830,-10,25,25,25,0 >>>>>>>> 2019-09-06 22:14:52.020319 +0200 info main: #173 C MITPROHB rx msg h 964,-210,RT-BAT-C,5,86400,2,1,3830,3795,3830,-10,25,25,25,0 >>>>>>>> 2019-09-06 22:14:54.452637 +0200 info main: #173 C MITPROHB rx msg h 964,-229,RT-BAT-C,5,86400,2,1,3830,3795,3830,-10,25,25,25,0 >>>>>>>> 2019-09-06 22:15:12.613935 +0200 info main: #173 C MITPROHB rx msg h 964,-239,RT-BAT-C,5,86400,2,1,3830,3795,3830,-10,25,25,25,0 >>>>>>>> 2019-09-06 22:15:35.223845 +0200 info main: #173 C MITPROHB rx msg h 964,-250,RT-BAT-C,5,86400,2,1,3830,3795,3830,-10,25,25,25,0 >>>>>>>> 2019-09-06 22:16:09.255059 +0200 info main: #173 C MITPROHB rx msg h 964,-260,RT-BAT-C,5,86400,2,1,3830,3795,3830,-10,25,25,25,0 >>>>>>>> 2019-09-06 22:17:31.919754 +0200 info main: #173 C MITPROHB rx msg h 964,-270,RT-BAT-C,5,86400,2,1,3830,3795,3830,-10,25,25,25,0 >>>>>>>> 2019-09-06 22:19:23.366267 +0200 info main: #173 C MITPROHB rx msg h 964,-289,RT-BAT-C,5,86400,2,1,3830,3795,3830,-10,25,25,25,0 >>>>>>>> 2019-09-06 22:21:57.344609 +0200 info main: #173 C MITPROHB rx msg h 964,-299,RT-BAT-C,5,86400,2,1,3830,3795,3830,-10,25,25,25,0 >>>>>>>> 2019-09-06 22:23:40.082406 +0200 info main: #31 C MITPROHB rx msg h 964,-1027,RT-BAT-C,5,86400,2,1,3830,3795,3830,-10,25,25,25,0 >>>>>>>> 2019-09-06 22:25:58.061883 +0200 info main: #31 C MITPROHB rx msg h 964,-1040,RT-BAT-C,5,86400,2,1,3830,3795,3830,-10,25,25,25,0 >>>>>>>> >>>>>>>> >>>>>>>> This shows the ticker was only run 299 times from 22:07:48 to 22:21:57. >>>>>>>> >>>>>>>> After 22:21:57 the workaround was triggered and did a reconnect. Apparently during that network reinitialization of 103 seconds, the per second >>>>>>>> ticker was run 628 times. >>>>>>>> >>>>>>>> That can't be catching up on the event queue, as that queue has only 20 slots. So something strange is going on here. >>>>>>>> >>>>>>>> Any ideas? >>>>>>>> >>>>>>>> Regards, >>>>>>>> Michael >>>>>>>> >>>>>>>> >>>>>>>> Am 06.09.19 um 08:04 schrieb Michael Balzer: >>>>>>>>> Mark & anyone else running a V2 server, >>>>>>>>> >>>>>>>>> as most cars don't send history records, this also needs the change to the server I just pushed, i.e. server version 2.4.2. >>>>>>>>> >>>>>>>>> https://github.com/openvehicles/Open-Vehicle-Monitoring-System/commits/maste... >>>>>>>>> <https://github.com/openvehicles/Open-Vehicle-Monitoring-System/commits/master> >>>>>>>>> >>>>>>>>> Regards, >>>>>>>>> Michael >>>>>>>>> >>>>>>>>> >>>>>>>>> Am 05.09.19 um 19:55 schrieb Michael Balzer: >>>>>>>>>> I've pushed the nasty workaround: the v2 server checks for no RX over 15 minutes, then restarts the network (wifi & modem) as configured for >>>>>>>>>> autostart. >>>>>>>>>> >>>>>>>>>> Rolled out on my server in edge as 3.2.002-237-ge075f655. >>>>>>>>>> >>>>>>>>>> Please test. >>>>>>>>>> >>>>>>>>>> Regards, >>>>>>>>>> Michael >>>>>>>>>> >>>>>>>>>> >>>>>>>>>> Am 05.09.19 um 01:58 schrieb Mark Webb-Johnson: >>>>>>>>>>>> Mark, you can check your server logs for history messages with ridiculous time offsets: >>>>>>>>>>>> [sddexter@ns27 server]$ cat log-20190903 | egrep "rx msg h [0-9]+,-[0-9]{4}" | wc -l >>>>>>>>>>>> 455283 >>>>>>>>>>> >>>>>>>>>>> I checked my logs and see 12 vehicles showing this. But, 2 only show this for a debugcrash log (which is expected, I guess, if the time is not >>>>>>>>>>> synced at report time). I’ve got 4 cars with the offset > 10,000. >>>>>>>>>>> >>>>>>>>>>> Regards, Mark. >>>>>>>>>>> >>>>>>>>>>>> On 4 Sep 2019, at 4:45 AM, Michael Balzer <dexter@expeedo.de <mailto:dexter@expeedo.de> <mailto:dexter@expeedo.de>> wrote: >>>>>>>>>>>> >>>>>>>>>>>> Everyone, >>>>>>>>>>>> >>>>>>>>>>>> I've pushed a change that needs some testing. >>>>>>>>>>>> >>>>>>>>>>>> I had the issue myself now parking at a certain distance from my garage wifi AP, i.e. on the edge of "in", after wifi had been disconnected >>>>>>>>>>>> for some hours, and with the module still connected via modem. The wifi blob had been trying to connect to the AP for about two hours. >>>>>>>>>>>> >>>>>>>>>>>> As seen before, the module saw no error, just the server responses and commands stopped coming in. I noticed the default interface was still >>>>>>>>>>>> "st1" despite wifi having been disconnected and modem connected. The DNS was also still configured for my wifi network, and the interface >>>>>>>>>>>> seemed to have an IP address -- but wasn't pingable from the wifi network. >>>>>>>>>>>> >>>>>>>>>>>> A power cycle of the modem solved the issue without reboot. So the cause may be in the modem/ppp subsystem, or it may be related (in some >>>>>>>>>>>> weird way) to the default interface / DNS setup. >>>>>>>>>>>> >>>>>>>>>>>> More tests showed the default interface again/still got set by the wifi blob itself at some point, overriding our modem prioritization. The >>>>>>>>>>>> events we didn't handle up to now were "sta.connected" and "sta.lostip", so I added these, and the bug didn't show up again since then. That >>>>>>>>>>>> doesn't mean anything, so we need to test this. >>>>>>>>>>>> >>>>>>>>>>>> The default interface really shouldn't affect inbound packet routing of an established connection, but there always may be strange bugs >>>>>>>>>>>> lurking in those libs. >>>>>>>>>>>> >>>>>>>>>>>> The change also reimplements the wifi signal strength reading, as the tests also showed that still wasn't working well using the CSI >>>>>>>>>>>> callback. It now seems to be much more reliable. >>>>>>>>>>>> >>>>>>>>>>>> Please test & report. The single module will be hard to test, as the bug isn't reproducable easily, but you can still try if wifi / modem >>>>>>>>>>>> transitions work well. >>>>>>>>>>>> >>>>>>>>>>>> Mark, you can check your server logs for history messages with ridiculous time offsets: >>>>>>>>>>>> [sddexter@ns27 server]$ cat log-20190903 | egrep "rx msg h [0-9]+,-[0-9]{4}" | wc -l >>>>>>>>>>>> 455283 >>>>>>>>>>>> The bug now severely affects the V2 server performance, as the server is single threaded and doesn't scale very well to this kind of bulk >>>>>>>>>>>> data bursts, especially when coming from multiple modules in parallel. So we really need to solve this now. Slow reactions or connection >>>>>>>>>>>> drops from my server lately have been due to this bug. If this change doesn't solve it, we'll need to add some reboot trigger on "too many >>>>>>>>>>>> server v2 notification retransmissions" -- or maybe a modem power cycle will do, that wouldn't discard the data. >>>>>>>>>>>> >>>>>>>>>>>> Thanks, >>>>>>>>>>>> Michael >>>>>>>>>>>> >>>>>>>>>>>> >>>>>>>>>>>> Am 03.09.19 um 07:46 schrieb Mark Webb-Johnson: >>>>>>>>>>>>> No problem. We can hold. I won’t commit anything for the next few days (and agree to hold-off on Markos’s pull). Let me know when you are ready. >>>>>>>>>>>>> >>>>>>>>>>>>> Regards, Mark. >>>>>>>>>>>>> >>>>>>>>>>>>>> On 3 Sep 2019, at 1:58 AM, Michael Balzer <dexter@expeedo.de <mailto:dexter@expeedo.de>> <mailto:dexter@expeedo.de> wrote: >>>>>>>>>>>>>> >>>>>>>>>>>>>> Mark, please wait. >>>>>>>>>>>>>> >>>>>>>>>>>>>> I may just have found the cause for issue #241, or at least something I need to investigate before releasing. >>>>>>>>>>>>>> >>>>>>>>>>>>>> I need to dig into my logs first, and try something. >>>>>>>>>>>>>> >>>>>>>>>>>>>> Regards, >>>>>>>>>>>>>> Michael >>>>>>>>>>>>>> >>>>>>>>>>>>>> >>>>>>>>>>>>>> Am 02.09.19 um 12:23 schrieb Michael Balzer: >>>>>>>>>>>>>>> Nothing open from my side at the moment. >>>>>>>>>>>>>>> >>>>>>>>>>>>>>> I haven't had the time to look in to Markos pull request, but from a first check also think that's going too deep to be included in this >>>>>>>>>>>>>>> release. >>>>>>>>>>>>>>> >>>>>>>>>>>>>>> Regards, >>>>>>>>>>>>>>> Michael >>>>>>>>>>>>>>> >>>>>>>>>>>>>>> >>>>>>>>>>>>>>> Am 02.09.19 um 04:15 schrieb Mark Webb-Johnson: >>>>>>>>>>>>>>>> I think it is well past time for a 3.2.003 release. Things seems table in edge (although some things only partially implemented). >>>>>>>>>>>>>>>> >>>>>>>>>>>>>>>> Anything people want to include at the last minute, or can we go ahead and build? >>>>>>>>>>>>>>>> >>>>>>>>>>>>>>>> Regards, Mark. >>>>>>>>>>>>>>>> >>
-- Michael Balzer * Helkenberger Weg 9 * D-58256 Ennepetal Fon 02333 / 833 5735 * Handy 0176 / 206 989 26 _______________________________________________ OvmsDev mailing list OvmsDev@lists.openvehicles.com <mailto:OvmsDev@lists.openvehicles.com> http://lists.openvehicles.com/mailman/listinfo/ovmsdev
_______________________________________________ OvmsDev mailing list OvmsDev@lists.openvehicles.com http://lists.openvehicles.com/mailman/listinfo/ovmsdev
-- Michael Balzer * Helkenberger Weg 9 * D-58256 Ennepetal Fon 02333 / 833 5735 * Handy 0176 / 206 989 26
Are you sure this is for the api.openvehicles.com <http://api.openvehicles.com/> server? I just double-checked, and find the EAP was 3.2.005 since 19th September: $ stat eap/ovms3.ver eap/ovms3.bin File: ‘eap/ovms3.ver’ Size: 1550 Blocks: 8 IO Block: 4096 regular file Device: fd02h/64770d Inode: 272479475 Links: 1 Access: (0644/-rw-r--r--) Uid: ( 0/ root) Gid: ( 0/ root) Access: 2019-09-25 08:05:29.399778250 +0800 Modify: 2019-09-19 17:02:13.943683462 +0800 Change: 2019-09-19 17:02:13.944683462 +0800 Birth: - File: ‘eap/ovms3.bin’ -> ‘3.2.005.ovms3.bin’ Size: 17 Blocks: 0 IO Block: 4096 symbolic link Device: fd02h/64770d Inode: 270620457 Links: 1 Access: (0777/lrwxrwxrwx) Uid: ( 0/ root) Gid: ( 0/ root) Access: 2019-09-24 23:07:03.538520576 +0800 Modify: 2019-09-19 16:13:08.779577711 +0800 Change: 2019-09-19 16:13:08.779577711 +0800 Birth: - That is when I released it to EAP. Regards, Mark.
On 25 Sep 2019, at 5:37 PM, Bernd Geistert <b_ghosti@gmx.de> wrote:
currently, yes, but not when I checked it on 25 Sep 2019, at 2:21 AM
Gesendet: Mittwoch, 25. September 2019 um 03:47 Uhr Von: "Mark Webb-Johnson" <mark@webb-johnson.net> An: "OVMS Developers" <ovmsdev@lists.openvehicles.com> Betreff: Re: [Ovmsdev] Time for 3.2.003? / Issue #241 This is what I have (api.openvehicles.com <http://api.openvehicles.com/>):
==> eap/ovms3.ver <== 3.2.005 Tue Sep 19 08:00:00 UTC 2019 OTA release
==> edge/ovms3.ver <== 3.2.005-1-g7f86e9c Thu Sep 19 16:01:18 UTC 2019 Automated build (markhk8)
==> main/ovms3.ver <== 3.2.002 Sun May 12 08:00:00 UTC 2019 OTA release
The 3.2.005 seems stable, so I think it can now go eap->main.
@Michael: Should we co-ordinate and do this later today, or have you already released 3.2.005 to main?
Regards, Mark.
On 25 Sep 2019, at 2:21 AM, Bernd Geistert <b_ghosti@gmx.de <mailto:b_ghosti@gmx.de>> wrote:
IMHO, currently: - in MAIN is 3.2.002 - in EAP is 3.2.003 - in EDGE is 3.2.005-1-g7f86e9c
Am 19.09.2019 um 10:22 schrieb Mark Webb-Johnson: OK, I’ve built:
2019-09-19 MWJ 3.2.005 OTA release - Default module/debug.tasks to FALSE Users that volunteer to submit tasks debug historical data to the Open Vehicles project, should (with appreciation) set: config set module debug.tasks yes This will be transmit approximately 700MB of data a month (over cellular/wifi).
2019-09-19 MWJ 3.2.004 OTA release - Skipped for Chinese superstitous reasons
In EAP now, and I will announce.
Regards, Mark.
On 19 Sep 2019, at 3:34 PM, Michael Balzer <dexter@expeedo.de <mailto:dexter@expeedo.de>> wrote:
Correct.
Regards, Michael
Am 19.09.19 um 09:29 schrieb Mark Webb-Johnson: I’m just worried about the users who don’t know about this new feature. When they deploy this version, they suddenly start sending 6MB of data a month up to us.
I think the ‘fix’ is just to change ovms_module.c:
MyConfig.GetParamValueBool("module", "debug.tasks", true)
to
MyConfig.GetParamValueBool("module", "debug.tasks", false)
That would then only submit these logs for those that explicitly turn it on?
Regards, Mark.
On 19 Sep 2019, at 3:23 PM, Michael Balzer <dexter@expeedo.de <mailto:dexter@expeedo.de>> wrote:
Sorry, I didn't think about this being an issue elsewhere -- german data plans typically start at minimum 100 MB/month flat (that's my current plan at 3 € / month).
No need for a new release, it can be turned off OTA by issueing
config set module debug.tasks no
Regards, Michael
Am 19.09.19 um 09:08 schrieb Mark Webb-Johnson: Yep:
758 bytes * (86400 / 300) * 30 = 6.5MB/month
That is going over data (not SD). Presumably cellular data for a large portion of the time.
I think we need to default this to OFF, and make a 3.2.004 to avoid this becoming an issue.
Regards, Mark.
On 19 Sep 2019, at 2:04 PM, Stephen Casner <casner@acm.org <mailto:casner@acm.org>> wrote:
That's 6.55MB/month, unless you have unusually short months! :-)
In what space is that data stored? A log written to SD? That's not likely to fill up the SD card too fast, but what happens if no SD card is installed?
-- Steve
On Thu, 19 Sep 2019, Mark Webb-Johnson wrote:
To enable CPU usage statistics, apply the changes to sdkconfig included. New history record: - "*-OVM-DebugTasks" v1: <taskcnt,totaltime> + per task: <tasknum,name,state,stack_now,stack_max,stack_total, heap_total,heap_32bit,heap_spi,runtime> Note: CPU core use percentage = runtime / totaltime
I’ve just noticed that this is enabled by default now (my production build has the sdkconfig updated, as per defaults).
I am seeing 758 bytes of history record, every 5 minutes. About 218KB/day, or 654KB/month.
Should this be opt-in?
Regards, Mark.
On 8 Sep 2019, at 5:43 PM, Michael Balzer <dexter@expeedo.de <mailto:dexter@expeedo.de>> wrote:
I've pushed some modifications and improvements to (hopefully) fix the timer issue or at least be able to debug it.
Some sdkconfig changes are necessary.
The build including these updates is on my edge release as 3.2.002-258-g20ae554b.
Btw: the network restart strategy seems to mitigate issue #241; I've seen a major drop on record repetitions on my server since the rollout.
commit 99e4e48bdd40b7004c0976f51aba9e3da4ecab53
Module: add per task CPU usage statistics, add task stats history records
To enable CPU usage statistics, apply the changes to sdkconfig included. The CPU usage shown by the commands is calculated against the last task status retrieved (or system boot).
Command changes: - "module tasks" -- added CPU (core) usage in percent per task
New command: - "module tasks data" -- output task stats in history record form
New config: - [module] debug.tasks -- yes (default) = send task stats every 5 minutes
New history record: - "*-OVM-DebugTasks" v1: <taskcnt,totaltime> + per task: <tasknum,name,state,stack_now,stack_max,stack_total, heap_total,heap_32bit,heap_spi,runtime> Note: CPU core use percentage = runtime / totaltime
commit 950172c216a72beb4da0bc7a40a46995a6105955
Build config: default timer service task priority raised to 20
Background: the FreeRTOS timer service shall only be used for very short and non-blocking jobs. We delegate event processing to our events task, anything else in timers needs to run with high priority.
commit 31ac19d187480046c16356b80668de45cacbb83d
DukTape: add build config for task priority, default lowered to 3
Background: the DukTape garbage collector shall run on lower priority than tasks like SIMCOM & events
commit e0a44791fbcfb5a4e4cad24c9d1163b76e637b4f
Server V2: use esp_log_timestamp for timeout detection, add timeout config, limit data records & size per second
New config: - [server.v2] timeout.rx -- timeout in seconds, default 960
commit 684a4ce9525175a910040f0d1ca82ac212fbf5de
Notify: use esp_log_timestamp for creation time instead of monotonictime to harden against timer service starvation / ticker event drops
Regards, Michael
Am 07.09.19 um 10:55 schrieb Michael Balzer: I think the RTOS timer service task starves. It's running on core 0 with priority 1.
Taks on core 0 sorted by priority:
Number of Tasks = 20 Stack: Now Max Total Heap 32-bit SPIRAM C# PRI 3FFC84A8 6 Blk ipc0 388 500 1024 7788 0 0 0 24 3FFC77F0 5 Blk OVMS CanRx 428 428 2048 3052 0 31844 0 23 3FFAFBF4 1 Blk esp_timer 400 656 4096 35928 644 25804 0 22 3FFD3240 19 Blk wifi 460 2716 3584 43720 0 20 0 22 3FFC03C4 2 Blk eventTask 448 1984 4608 104 0 0 0 20 3FFC8F14 17 Blk tiT 500 2308 3072 6552 0 0 * 18 3FFE14F0 26 Blk OVMS COrx 456 456 4096 0 0 0 0 7 3FFE19D4 27 Blk OVMS COwrk 476 476 3072 0 0 0 0 7 3FFCBC34 12 Blk Tmr Svc 352 928 3072 88 0 0 0 1 3FFE7708 23 Blk mdns 468 1396 4096 108 0 0 0 1
I don't think it's our CanRx, as that only fetches and queues CAN frames, the actual work is done by the listeners. The CO tasks only run for CANopen jobs, which are few for normal operation.
That leaves the system tasks, with main suspect -once again- the wifi blob.
We need to know how much CPU time the tasks actually use now. I think I saw some option for this in the FreeRTOS config.
Regards, Michael
Am 06.09.19 um 23:15 schrieb Michael Balzer: The workaround is based on the monotonictime being updated per second, as do the history record offsets.
Apparently, that mechanism doesn't work reliably. That may be an indicator for some bigger underlying issue.
Example log excerpt:
2019-09-06 22:07:48.126919 +0200 info main: #173 C MITPROHB rx msg h 964,0,RT-BAT-C,5,86400,2,1,3830,3795,3830,-10,25,25,25,0 2019-09-06 22:09:03.089031 +0200 info main: #173 C MITPROHB rx msg h 964,-10,RT-BAT-C,5,86400,2,1,3830,3795,3830,-10,25,25,25,0 2019-09-06 22:09:05.041574 +0200 info main: #173 C MITPROHB rx msg h 964,-20,RT-BAT-C,5,86400,2,1,3830,3795,3830,-10,25,25,25,0 2019-09-06 22:09:05.052644 +0200 info main: #173 C MITPROHB rx msg h 964,-30,RT-BAT-C,5,86400,2,1,3830,3795,3830,-10,25,25,25,0 2019-09-06 22:09:05.063617 +0200 info main: #173 C MITPROHB rx msg h 964,-49,RT-BAT-C,5,86400,2,1,3830,3795,3830,-10,25,25,25,0 2019-09-06 22:09:05.077527 +0200 info main: #173 C MITPROHB rx msg h 964,-59,RT-BAT-C,5,86400,2,1,3830,3795,3830,-10,25,25,25,0 2019-09-06 22:09:05.193775 +0200 info main: #173 C MITPROHB rx msg h 964,-70,RT-BAT-C,5,86400,2,1,3830,3795,3830,-10,25,25,25,0 2019-09-06 22:09:13.190645 +0200 info main: #173 C MITPROHB rx msg h 964,-80,RT-BAT-C,5,86400,2,1,3830,3795,3830,-10,25,25,25,0 2019-09-06 22:09:22.077994 +0200 info main: #173 C MITPROHB rx msg h 964,-90,RT-BAT-C,5,86400,2,1,3830,3795,3830,-10,25,25,25,0 2019-09-06 22:09:54.590300 +0200 info main: #173 C MITPROHB rx msg h 964,-109,RT-BAT-C,5,86400,2,1,3830,3795,3830,-10,25,25,25,0 2019-09-06 22:11:10.127054 +0200 info main: #173 C MITPROHB rx msg h 964,-119,RT-BAT-C,5,86400,2,1,3830,3795,3830,-10,25,25,25,0 2019-09-06 22:11:16.794200 +0200 info main: #173 C MITPROHB rx msg h 964,-130,RT-BAT-C,5,86400,2,1,3830,3795,3830,-10,25,25,25,0 2019-09-06 22:11:22.455652 +0200 info main: #173 C MITPROHB rx msg h 964,-140,RT-BAT-C,5,86400,2,1,3830,3795,3830,-10,25,25,25,0 2019-09-06 22:12:49.423412 +0200 info main: #173 C MITPROHB rx msg h 964,-150,RT-BAT-C,5,86400,2,1,3830,3795,3830,-10,25,25,25,0 2019-09-06 22:12:49.442096 +0200 info main: #173 C MITPROHB rx msg h 964,-169,RT-BAT-C,5,86400,2,1,3830,3795,3830,-10,25,25,25,0 2019-09-06 22:12:49.461941 +0200 info main: #173 C MITPROHB rx msg h 964,-179,RT-BAT-C,5,86400,2,1,3830,3795,3830,-10,25,25,25,0 2019-09-06 22:14:39.828133 +0200 info main: #173 C MITPROHB rx msg h 964,-190,RT-BAT-C,5,86400,2,1,3830,3795,3830,-10,25,25,25,0 2019-09-06 22:14:39.858144 +0200 info main: #173 C MITPROHB rx msg h 964,-200,RT-BAT-C,5,86400,2,1,3830,3795,3830,-10,25,25,25,0 2019-09-06 22:14:52.020319 +0200 info main: #173 C MITPROHB rx msg h 964,-210,RT-BAT-C,5,86400,2,1,3830,3795,3830,-10,25,25,25,0 2019-09-06 22:14:54.452637 +0200 info main: #173 C MITPROHB rx msg h 964,-229,RT-BAT-C,5,86400,2,1,3830,3795,3830,-10,25,25,25,0 2019-09-06 22:15:12.613935 +0200 info main: #173 C MITPROHB rx msg h 964,-239,RT-BAT-C,5,86400,2,1,3830,3795,3830,-10,25,25,25,0 2019-09-06 22:15:35.223845 +0200 info main: #173 C MITPROHB rx msg h 964,-250,RT-BAT-C,5,86400,2,1,3830,3795,3830,-10,25,25,25,0 2019-09-06 22:16:09.255059 +0200 info main: #173 C MITPROHB rx msg h 964,-260,RT-BAT-C,5,86400,2,1,3830,3795,3830,-10,25,25,25,0 2019-09-06 22:17:31.919754 +0200 info main: #173 C MITPROHB rx msg h 964,-270,RT-BAT-C,5,86400,2,1,3830,3795,3830,-10,25,25,25,0 2019-09-06 22:19:23.366267 +0200 info main: #173 C MITPROHB rx msg h 964,-289,RT-BAT-C,5,86400,2,1,3830,3795,3830,-10,25,25,25,0 2019-09-06 22:21:57.344609 +0200 info main: #173 C MITPROHB rx msg h 964,-299,RT-BAT-C,5,86400,2,1,3830,3795,3830,-10,25,25,25,0 2019-09-06 22:23:40.082406 +0200 info main: #31 C MITPROHB rx msg h 964,-1027,RT-BAT-C,5,86400,2,1,3830,3795,3830,-10,25,25,25,0 2019-09-06 22:25:58.061883 +0200 info main: #31 C MITPROHB rx msg h 964,-1040,RT-BAT-C,5,86400,2,1,3830,3795,3830,-10,25,25,25,0
This shows the ticker was only run 299 times from 22:07:48 to 22:21:57.
After 22:21:57 the workaround was triggered and did a reconnect. Apparently during that network reinitialization of 103 seconds, the per second ticker was run 628 times.
That can't be catching up on the event queue, as that queue has only 20 slots. So something strange is going on here.
Any ideas?
Regards, Michael
Am 06.09.19 um 08:04 schrieb Michael Balzer: Mark & anyone else running a V2 server,
as most cars don't send history records, this also needs the change to the server I just pushed, i.e. server version 2.4.2.
https://github.com/openvehicles/Open-Vehicle-Monitoring-System/commits/maste... <https://github.com/openvehicles/Open-Vehicle-Monitoring-System/commits/master> <https://github.com/openvehicles/Open-Vehicle-Monitoring-System/commits/maste... <https://github.com/openvehicles/Open-Vehicle-Monitoring-System/commits/master>>
Regards, Michael
Am 05.09.19 um 19:55 schrieb Michael Balzer: I've pushed the nasty workaround: the v2 server checks for no RX over 15 minutes, then restarts the network (wifi & modem) as configured for autostart.
Rolled out on my server in edge as 3.2.002-237-ge075f655.
Please test.
Regards, Michael
Am 05.09.19 um 01:58 schrieb Mark Webb-Johnson: Mark, you can check your server logs for history messages with ridiculous time offsets: [sddexter@ns27 server]$ cat log-20190903 | egrep "rx msg h [0-9]+,-[0-9]{4}" | wc -l 455283
I checked my logs and see 12 vehicles showing this. But, 2 only show this for a debugcrash log (which is expected, I guess, if the time is not synced at report time). I’ve got 4 cars with the offset > 10,000.
Regards, Mark.
On 4 Sep 2019, at 4:45 AM, Michael Balzer <dexter@expeedo.de <mailto:dexter@expeedo.de><mailto:dexter@expeedo.de <mailto:dexter@expeedo.de>>> wrote:
Everyone,
I've pushed a change that needs some testing.
I had the issue myself now parking at a certain distance from my garage wifi AP, i.e. on the edge of "in", after wifi had been disconnected for some hours, and with the module still connected via modem. The wifi blob had been trying to connect to the AP for about two hours.
As seen before, the module saw no error, just the server responses and commands stopped coming in. I noticed the default interface was still "st1" despite wifi having been disconnected and modem connected. The DNS was also still configured for my wifi network, and the interface seemed to have an IP address -- but wasn't pingable from the wifi network.
A power cycle of the modem solved the issue without reboot. So the cause may be in the modem/ppp subsystem, or it may be related (in some weird way) to the default interface / DNS setup.
More tests showed the default interface again/still got set by the wifi blob itself at some point, overriding our modem prioritization. The events we didn't handle up to now were "sta.connected" and "sta.lostip", so I added these, and the bug didn't show up again since then. That doesn't mean anything, so we need to test this.
The default interface really shouldn't affect inbound packet routing of an established connection, but there always may be strange bugs lurking in those libs.
The change also reimplements the wifi signal strength reading, as the tests also showed that still wasn't working well using the CSI callback. It now seems to be much more reliable.
Please test & report. The single module will be hard to test, as the bug isn't reproducable easily, but you can still try if wifi / modem transitions work well.
Mark, you can check your server logs for history messages with ridiculous time offsets: [sddexter@ns27 server]$ cat log-20190903 | egrep "rx msg h [0-9]+,-[0-9]{4}" | wc -l 455283 The bug now severely affects the V2 server performance, as the server is single threaded and doesn't scale very well to this kind of bulk data bursts, especially when coming from multiple modules in parallel. So we really need to solve this now. Slow reactions or connection drops from my server lately have been due to this bug. If this change doesn't solve it, we'll need to add some reboot trigger on "too many server v2 notification retransmissions" -- or maybe a modem power cycle will do, that wouldn't discard the data.
Thanks, Michael
Am 03.09.19 um 07:46 schrieb Mark Webb-Johnson: No problem. We can hold. I won’t commit anything for the next few days (and agree to hold-off on Markos’s pull). Let me know when you are ready.
Regards, Mark.
On 3 Sep 2019, at 1:58 AM, Michael Balzer <dexter@expeedo.de <mailto:dexter@expeedo.de>> <mailto:dexter@expeedo.de <mailto:dexter@expeedo.de>> wrote:
Mark, please wait.
I may just have found the cause for issue #241, or at least something I need to investigate before releasing.
I need to dig into my logs first, and try something.
Regards, Michael
Am 02.09.19 um 12:23 schrieb Michael Balzer: Nothing open from my side at the moment.
I haven't had the time to look in to Markos pull request, but from a first check also think that's going too deep to be included in this release.
Regards, Michael
Am 02.09.19 um 04:15 schrieb Mark Webb-Johnson: I think it is well past time for a 3.2.003 release. Things seems table in edge (although some things only partially implemented).
Anything people want to include at the last minute, or can we go ahead and build?
Regards, Mark.
-- Michael Balzer * Helkenberger Weg 9 * D-58256 Ennepetal Fon 02333 / 833 5735 * Handy 0176 / 206 989 26 _______________________________________________ OvmsDev mailing list OvmsDev@lists.openvehicles.com <mailto:OvmsDev@lists.openvehicles.com> http://lists.openvehicles.com/mailman/listinfo/ovmsdev <http://lists.openvehicles.com/mailman/listinfo/ovmsdev> _______________________________________________ OvmsDev mailing list OvmsDev@lists.openvehicles.com <mailto:OvmsDev@lists.openvehicles.com> http://lists.openvehicles.com/mailman/listinfo/ovmsdev <http://lists.openvehicles.com/mailman/listinfo/ovmsdev>
-- Michael Balzer * Helkenberger Weg 9 * D-58256 Ennepetal Fon 02333 / 833 5735 * Handy 0176 / 206 989 26 _______________________________________________ OvmsDev mailing list OvmsDev@lists.openvehicles.com <mailto:OvmsDev@lists.openvehicles.com> http://lists.openvehicles.com/mailman/listinfo/ovmsdev <http://lists.openvehicles.com/mailman/listinfo/ovmsdev> _______________________________________________ OvmsDev mailing list OvmsDev@lists.openvehicles.com <mailto:OvmsDev@lists.openvehicles.com> http://lists.openvehicles.com/mailman/listinfo/ovmsdev <http://lists.openvehicles.com/mailman/listinfo/ovmsdev>
_______________________________________________ OvmsDev mailing list OvmsDev@lists.openvehicles.com <mailto:OvmsDev@lists.openvehicles.com> http://lists.openvehicles.com/mailman/listinfo/ovmsdev <http://lists.openvehicles.com/mailman/listinfo/ovmsdev>_______________________________________________ OvmsDev mailing list OvmsDev@lists.openvehicles.com http://lists.openvehicles.com/mailman/listinfo/ovmsdev <http://lists.openvehicles.com/mailman/listinfo/ovmsdev>_______________________________________________ OvmsDev mailing list OvmsDev@lists.openvehicles.com http://lists.openvehicles.com/mailman/listinfo/ovmsdev
Btw, regarding releases, I also will change that on my server to include the commit offset in "edge" and "main". That way I can merge and roll out important changes (e.g. security updates) to these branches as well without the need for a new major version. In the firmware distribution directory, "edge" and "main" then are simply links to the release directory. Regards, Michael Am 19.09.19 um 09:23 schrieb Michael Balzer:
Sorry, I didn't think about this being an issue elsewhere -- german data plans typically start at minimum 100 MB/month flat (that's my current plan at 3 € / month).
No need for a new release, it can be turned off OTA by issueing
config set module debug.tasks no
Regards, Michael
Am 19.09.19 um 09:08 schrieb Mark Webb-Johnson:
Yep:
758 bytes * (86400 / 300) * 30 = 6.5MB/month
That is going over data (not SD). Presumably cellular data for a large portion of the time.
I think we need to default this to OFF, and make a 3.2.004 to avoid this becoming an issue.
Regards, Mark.
On 19 Sep 2019, at 2:04 PM, Stephen Casner <casner@acm.org <mailto:casner@acm.org>> wrote:
That's 6.55MB/month, unless you have unusually short months! :-)
In what space is that data stored? A log written to SD? That's not likely to fill up the SD card too fast, but what happens if no SD card is installed?
-- Steve
On Thu, 19 Sep 2019, Mark Webb-Johnson wrote:
To enable CPU usage statistics, apply the changes to sdkconfig included. New history record: - "*-OVM-DebugTasks" v1: <taskcnt,totaltime> + per task: <tasknum,name,state,stack_now,stack_max,stack_total, heap_total,heap_32bit,heap_spi,runtime> Note: CPU core use percentage = runtime / totaltime
I’ve just noticed that this is enabled by default now (my production build has the sdkconfig updated, as per defaults).
I am seeing 758 bytes of history record, every 5 minutes. About 218KB/day, or 654KB/month.
Should this be opt-in?
Regards, Mark.
On 8 Sep 2019, at 5:43 PM, Michael Balzer <dexter@expeedo.de <mailto:dexter@expeedo.de>> wrote:
I've pushed some modifications and improvements to (hopefully) fix the timer issue or at least be able to debug it.
Some sdkconfig changes are necessary.
The build including these updates is on my edge release as 3.2.002-258-g20ae554b.
Btw: the network restart strategy seems to mitigate issue #241; I've seen a major drop on record repetitions on my server since the rollout.
commit 99e4e48bdd40b7004c0976f51aba9e3da4ecab53
Module: add per task CPU usage statistics, add task stats history records
To enable CPU usage statistics, apply the changes to sdkconfig included. The CPU usage shown by the commands is calculated against the last task status retrieved (or system boot).
Command changes: - "module tasks" -- added CPU (core) usage in percent per task
New command: - "module tasks data" -- output task stats in history record form
New config: - [module] debug.tasks -- yes (default) = send task stats every 5 minutes
New history record: - "*-OVM-DebugTasks" v1: <taskcnt,totaltime> + per task: <tasknum,name,state,stack_now,stack_max,stack_total, heap_total,heap_32bit,heap_spi,runtime> Note: CPU core use percentage = runtime / totaltime
commit 950172c216a72beb4da0bc7a40a46995a6105955
Build config: default timer service task priority raised to 20
Background: the FreeRTOS timer service shall only be used for very short and non-blocking jobs. We delegate event processing to our events task, anything else in timers needs to run with high priority.
commit 31ac19d187480046c16356b80668de45cacbb83d
DukTape: add build config for task priority, default lowered to 3
Background: the DukTape garbage collector shall run on lower priority than tasks like SIMCOM & events
commit e0a44791fbcfb5a4e4cad24c9d1163b76e637b4f
Server V2: use esp_log_timestamp for timeout detection, add timeout config, limit data records & size per second
New config: - [server.v2] timeout.rx -- timeout in seconds, default 960
commit 684a4ce9525175a910040f0d1ca82ac212fbf5de
Notify: use esp_log_timestamp for creation time instead of monotonictime to harden against timer service starvation / ticker event drops
Regards, Michael
Am 07.09.19 um 10:55 schrieb Michael Balzer:
I think the RTOS timer service task starves. It's running on core 0 with priority 1.
Taks on core 0 sorted by priority:
Number of Tasks = 20 Stack: Now Max Total Heap 32-bit SPIRAM C# PRI 3FFC84A8 6 Blk ipc0 388 500 1024 7788 0 0 0 24 3FFC77F0 5 Blk OVMS CanRx 428 428 2048 3052 0 31844 0 23 3FFAFBF4 1 Blk esp_timer 400 656 4096 35928 644 25804 0 22 3FFD3240 19 Blk wifi 460 2716 3584 43720 0 20 0 22 3FFC03C4 2 Blk eventTask 448 1984 4608 104 0 0 0 20 3FFC8F14 17 Blk tiT 500 2308 3072 6552 0 0 * 18 3FFE14F0 26 Blk OVMS COrx 456 456 4096 0 0 0 0 7 3FFE19D4 27 Blk OVMS COwrk 476 476 3072 0 0 0 0 7 3FFCBC34 12 Blk Tmr Svc 352 928 3072 88 0 0 0 1 3FFE7708 23 Blk mdns 468 1396 4096 108 0 0 0 1
I don't think it's our CanRx, as that only fetches and queues CAN frames, the actual work is done by the listeners. The CO tasks only run for CANopen jobs, which are few for normal operation.
That leaves the system tasks, with main suspect -once again- the wifi blob.
We need to know how much CPU time the tasks actually use now. I think I saw some option for this in the FreeRTOS config.
Regards, Michael
Am 06.09.19 um 23:15 schrieb Michael Balzer: > The workaround is based on the monotonictime being updated per second, as do the history record offsets. > > Apparently, that mechanism doesn't work reliably. That may be an indicator for some bigger underlying issue. > > Example log excerpt: > > 2019-09-06 22:07:48.126919 +0200 info main: #173 C MITPROHB rx msg h 964,0,RT-BAT-C,5,86400,2,1,3830,3795,3830,-10,25,25,25,0 > 2019-09-06 22:09:03.089031 +0200 info main: #173 C MITPROHB rx msg h 964,-10,RT-BAT-C,5,86400,2,1,3830,3795,3830,-10,25,25,25,0 > 2019-09-06 22:09:05.041574 +0200 info main: #173 C MITPROHB rx msg h 964,-20,RT-BAT-C,5,86400,2,1,3830,3795,3830,-10,25,25,25,0 > 2019-09-06 22:09:05.052644 +0200 info main: #173 C MITPROHB rx msg h 964,-30,RT-BAT-C,5,86400,2,1,3830,3795,3830,-10,25,25,25,0 > 2019-09-06 22:09:05.063617 +0200 info main: #173 C MITPROHB rx msg h 964,-49,RT-BAT-C,5,86400,2,1,3830,3795,3830,-10,25,25,25,0 > 2019-09-06 22:09:05.077527 +0200 info main: #173 C MITPROHB rx msg h 964,-59,RT-BAT-C,5,86400,2,1,3830,3795,3830,-10,25,25,25,0 > 2019-09-06 22:09:05.193775 +0200 info main: #173 C MITPROHB rx msg h 964,-70,RT-BAT-C,5,86400,2,1,3830,3795,3830,-10,25,25,25,0 > 2019-09-06 22:09:13.190645 +0200 info main: #173 C MITPROHB rx msg h 964,-80,RT-BAT-C,5,86400,2,1,3830,3795,3830,-10,25,25,25,0 > 2019-09-06 22:09:22.077994 +0200 info main: #173 C MITPROHB rx msg h 964,-90,RT-BAT-C,5,86400,2,1,3830,3795,3830,-10,25,25,25,0 > 2019-09-06 22:09:54.590300 +0200 info main: #173 C MITPROHB rx msg h 964,-109,RT-BAT-C,5,86400,2,1,3830,3795,3830,-10,25,25,25,0 > 2019-09-06 22:11:10.127054 +0200 info main: #173 C MITPROHB rx msg h 964,-119,RT-BAT-C,5,86400,2,1,3830,3795,3830,-10,25,25,25,0 > 2019-09-06 22:11:16.794200 +0200 info main: #173 C MITPROHB rx msg h 964,-130,RT-BAT-C,5,86400,2,1,3830,3795,3830,-10,25,25,25,0 > 2019-09-06 22:11:22.455652 +0200 info main: #173 C MITPROHB rx msg h 964,-140,RT-BAT-C,5,86400,2,1,3830,3795,3830,-10,25,25,25,0 > 2019-09-06 22:12:49.423412 +0200 info main: #173 C MITPROHB rx msg h 964,-150,RT-BAT-C,5,86400,2,1,3830,3795,3830,-10,25,25,25,0 > 2019-09-06 22:12:49.442096 +0200 info main: #173 C MITPROHB rx msg h 964,-169,RT-BAT-C,5,86400,2,1,3830,3795,3830,-10,25,25,25,0 > 2019-09-06 22:12:49.461941 +0200 info main: #173 C MITPROHB rx msg h 964,-179,RT-BAT-C,5,86400,2,1,3830,3795,3830,-10,25,25,25,0 > 2019-09-06 22:14:39.828133 +0200 info main: #173 C MITPROHB rx msg h 964,-190,RT-BAT-C,5,86400,2,1,3830,3795,3830,-10,25,25,25,0 > 2019-09-06 22:14:39.858144 +0200 info main: #173 C MITPROHB rx msg h 964,-200,RT-BAT-C,5,86400,2,1,3830,3795,3830,-10,25,25,25,0 > 2019-09-06 22:14:52.020319 +0200 info main: #173 C MITPROHB rx msg h 964,-210,RT-BAT-C,5,86400,2,1,3830,3795,3830,-10,25,25,25,0 > 2019-09-06 22:14:54.452637 +0200 info main: #173 C MITPROHB rx msg h 964,-229,RT-BAT-C,5,86400,2,1,3830,3795,3830,-10,25,25,25,0 > 2019-09-06 22:15:12.613935 +0200 info main: #173 C MITPROHB rx msg h 964,-239,RT-BAT-C,5,86400,2,1,3830,3795,3830,-10,25,25,25,0 > 2019-09-06 22:15:35.223845 +0200 info main: #173 C MITPROHB rx msg h 964,-250,RT-BAT-C,5,86400,2,1,3830,3795,3830,-10,25,25,25,0 > 2019-09-06 22:16:09.255059 +0200 info main: #173 C MITPROHB rx msg h 964,-260,RT-BAT-C,5,86400,2,1,3830,3795,3830,-10,25,25,25,0 > 2019-09-06 22:17:31.919754 +0200 info main: #173 C MITPROHB rx msg h 964,-270,RT-BAT-C,5,86400,2,1,3830,3795,3830,-10,25,25,25,0 > 2019-09-06 22:19:23.366267 +0200 info main: #173 C MITPROHB rx msg h 964,-289,RT-BAT-C,5,86400,2,1,3830,3795,3830,-10,25,25,25,0 > 2019-09-06 22:21:57.344609 +0200 info main: #173 C MITPROHB rx msg h 964,-299,RT-BAT-C,5,86400,2,1,3830,3795,3830,-10,25,25,25,0 > 2019-09-06 22:23:40.082406 +0200 info main: #31 C MITPROHB rx msg h 964,-1027,RT-BAT-C,5,86400,2,1,3830,3795,3830,-10,25,25,25,0 > 2019-09-06 22:25:58.061883 +0200 info main: #31 C MITPROHB rx msg h 964,-1040,RT-BAT-C,5,86400,2,1,3830,3795,3830,-10,25,25,25,0 > > > This shows the ticker was only run 299 times from 22:07:48 to 22:21:57. > > After 22:21:57 the workaround was triggered and did a reconnect. Apparently during that network reinitialization of 103 seconds, the per > second ticker was run 628 times. > > That can't be catching up on the event queue, as that queue has only 20 slots. So something strange is going on here. > > Any ideas? > > Regards, > Michael > > > Am 06.09.19 um 08:04 schrieb Michael Balzer: >> Mark & anyone else running a V2 server, >> >> as most cars don't send history records, this also needs the change to the server I just pushed, i.e. server version 2.4.2. >> >> https://github.com/openvehicles/Open-Vehicle-Monitoring-System/commits/maste... >> <https://github.com/openvehicles/Open-Vehicle-Monitoring-System/commits/master> >> >> Regards, >> Michael >> >> >> Am 05.09.19 um 19:55 schrieb Michael Balzer: >>> I've pushed the nasty workaround: the v2 server checks for no RX over 15 minutes, then restarts the network (wifi & modem) as >>> configured for autostart. >>> >>> Rolled out on my server in edge as 3.2.002-237-ge075f655. >>> >>> Please test. >>> >>> Regards, >>> Michael >>> >>> >>> Am 05.09.19 um 01:58 schrieb Mark Webb-Johnson: >>>>> Mark, you can check your server logs for history messages with ridiculous time offsets: >>>>> [sddexter@ns27 server]$ cat log-20190903 | egrep "rx msg h [0-9]+,-[0-9]{4}" | wc -l >>>>> 455283 >>>> >>>> I checked my logs and see 12 vehicles showing this. But, 2 only show this for a debugcrash log (which is expected, I guess, if the >>>> time is not synced at report time). I’ve got 4 cars with the offset > 10,000. >>>> >>>> Regards, Mark. >>>> >>>>> On 4 Sep 2019, at 4:45 AM, Michael Balzer <dexter@expeedo.de <mailto:dexter@expeedo.de> <mailto:dexter@expeedo.de>> wrote: >>>>> >>>>> Everyone, >>>>> >>>>> I've pushed a change that needs some testing. >>>>> >>>>> I had the issue myself now parking at a certain distance from my garage wifi AP, i.e. on the edge of "in", after wifi had been >>>>> disconnected for some hours, and with the module still connected via modem. The wifi blob had been trying to connect to the AP for >>>>> about two hours. >>>>> >>>>> As seen before, the module saw no error, just the server responses and commands stopped coming in. I noticed the default interface >>>>> was still "st1" despite wifi having been disconnected and modem connected. The DNS was also still configured for my wifi network, >>>>> and the interface seemed to have an IP address -- but wasn't pingable from the wifi network. >>>>> >>>>> A power cycle of the modem solved the issue without reboot. So the cause may be in the modem/ppp subsystem, or it may be related (in >>>>> some weird way) to the default interface / DNS setup. >>>>> >>>>> More tests showed the default interface again/still got set by the wifi blob itself at some point, overriding our modem >>>>> prioritization. The events we didn't handle up to now were "sta.connected" and "sta.lostip", so I added these, and the bug didn't >>>>> show up again since then. That doesn't mean anything, so we need to test this. >>>>> >>>>> The default interface really shouldn't affect inbound packet routing of an established connection, but there always may be strange >>>>> bugs lurking in those libs. >>>>> >>>>> The change also reimplements the wifi signal strength reading, as the tests also showed that still wasn't working well using the CSI >>>>> callback. It now seems to be much more reliable. >>>>> >>>>> Please test & report. The single module will be hard to test, as the bug isn't reproducable easily, but you can still try if wifi / >>>>> modem transitions work well. >>>>> >>>>> Mark, you can check your server logs for history messages with ridiculous time offsets: >>>>> [sddexter@ns27 server]$ cat log-20190903 | egrep "rx msg h [0-9]+,-[0-9]{4}" | wc -l >>>>> 455283 >>>>> The bug now severely affects the V2 server performance, as the server is single threaded and doesn't scale very well to this kind of >>>>> bulk data bursts, especially when coming from multiple modules in parallel. So we really need to solve this now. Slow reactions or >>>>> connection drops from my server lately have been due to this bug. If this change doesn't solve it, we'll need to add some reboot >>>>> trigger on "too many server v2 notification retransmissions" -- or maybe a modem power cycle will do, that wouldn't discard the data. >>>>> >>>>> Thanks, >>>>> Michael >>>>> >>>>> >>>>> Am 03.09.19 um 07:46 schrieb Mark Webb-Johnson: >>>>>> No problem. We can hold. I won’t commit anything for the next few days (and agree to hold-off on Markos’s pull). Let me know when >>>>>> you are ready. >>>>>> >>>>>> Regards, Mark. >>>>>> >>>>>>> On 3 Sep 2019, at 1:58 AM, Michael Balzer <dexter@expeedo.de <mailto:dexter@expeedo.de>> <mailto:dexter@expeedo.de> wrote: >>>>>>> >>>>>>> Mark, please wait. >>>>>>> >>>>>>> I may just have found the cause for issue #241, or at least something I need to investigate before releasing. >>>>>>> >>>>>>> I need to dig into my logs first, and try something. >>>>>>> >>>>>>> Regards, >>>>>>> Michael >>>>>>> >>>>>>> >>>>>>> Am 02.09.19 um 12:23 schrieb Michael Balzer: >>>>>>>> Nothing open from my side at the moment. >>>>>>>> >>>>>>>> I haven't had the time to look in to Markos pull request, but from a first check also think that's going too deep to be included >>>>>>>> in this release. >>>>>>>> >>>>>>>> Regards, >>>>>>>> Michael >>>>>>>> >>>>>>>> >>>>>>>> Am 02.09.19 um 04:15 schrieb Mark Webb-Johnson: >>>>>>>>> I think it is well past time for a 3.2.003 release. Things seems table in edge (although some things only partially implemented). >>>>>>>>> >>>>>>>>> Anything people want to include at the last minute, or can we go ahead and build? >>>>>>>>> >>>>>>>>> Regards, Mark. >>>>>>>>>
-- Michael Balzer * Helkenberger Weg 9 * D-58256 Ennepetal Fon 02333 / 833 5735 * Handy 0176 / 206 989 26
_______________________________________________ OvmsDev mailing list OvmsDev@lists.openvehicles.com http://lists.openvehicles.com/mailman/listinfo/ovmsdev
-- Michael Balzer * Helkenberger Weg 9 * D-58256 Ennepetal Fon 02333 / 833 5735 * Handy 0176 / 206 989 26
s/edge/eap/g Am 19.09.19 um 09:33 schrieb Michael Balzer:
Btw, regarding releases, I also will change that on my server to include the commit offset in "edge" and "main".
That way I can merge and roll out important changes (e.g. security updates) to these branches as well without the need for a new major version.
In the firmware distribution directory, "edge" and "main" then are simply links to the release directory.
Regards, Michael
Am 19.09.19 um 09:23 schrieb Michael Balzer:
Sorry, I didn't think about this being an issue elsewhere -- german data plans typically start at minimum 100 MB/month flat (that's my current plan at 3 € / month).
No need for a new release, it can be turned off OTA by issueing
config set module debug.tasks no
Regards, Michael
Am 19.09.19 um 09:08 schrieb Mark Webb-Johnson:
Yep:
758 bytes * (86400 / 300) * 30 = 6.5MB/month
That is going over data (not SD). Presumably cellular data for a large portion of the time.
I think we need to default this to OFF, and make a 3.2.004 to avoid this becoming an issue.
Regards, Mark.
On 19 Sep 2019, at 2:04 PM, Stephen Casner <casner@acm.org <mailto:casner@acm.org>> wrote:
That's 6.55MB/month, unless you have unusually short months! :-)
In what space is that data stored? A log written to SD? That's not likely to fill up the SD card too fast, but what happens if no SD card is installed?
-- Steve
On Thu, 19 Sep 2019, Mark Webb-Johnson wrote:
To enable CPU usage statistics, apply the changes to sdkconfig included. New history record: - "*-OVM-DebugTasks" v1: <taskcnt,totaltime> + per task: <tasknum,name,state,stack_now,stack_max,stack_total, heap_total,heap_32bit,heap_spi,runtime> Note: CPU core use percentage = runtime / totaltime
I’ve just noticed that this is enabled by default now (my production build has the sdkconfig updated, as per defaults).
I am seeing 758 bytes of history record, every 5 minutes. About 218KB/day, or 654KB/month.
Should this be opt-in?
Regards, Mark.
On 8 Sep 2019, at 5:43 PM, Michael Balzer <dexter@expeedo.de <mailto:dexter@expeedo.de>> wrote:
I've pushed some modifications and improvements to (hopefully) fix the timer issue or at least be able to debug it.
Some sdkconfig changes are necessary.
The build including these updates is on my edge release as 3.2.002-258-g20ae554b.
Btw: the network restart strategy seems to mitigate issue #241; I've seen a major drop on record repetitions on my server since the rollout.
commit 99e4e48bdd40b7004c0976f51aba9e3da4ecab53
Module: add per task CPU usage statistics, add task stats history records
To enable CPU usage statistics, apply the changes to sdkconfig included. The CPU usage shown by the commands is calculated against the last task status retrieved (or system boot).
Command changes: - "module tasks" -- added CPU (core) usage in percent per task
New command: - "module tasks data" -- output task stats in history record form
New config: - [module] debug.tasks -- yes (default) = send task stats every 5 minutes
New history record: - "*-OVM-DebugTasks" v1: <taskcnt,totaltime> + per task: <tasknum,name,state,stack_now,stack_max,stack_total, heap_total,heap_32bit,heap_spi,runtime> Note: CPU core use percentage = runtime / totaltime
commit 950172c216a72beb4da0bc7a40a46995a6105955
Build config: default timer service task priority raised to 20
Background: the FreeRTOS timer service shall only be used for very short and non-blocking jobs. We delegate event processing to our events task, anything else in timers needs to run with high priority.
commit 31ac19d187480046c16356b80668de45cacbb83d
DukTape: add build config for task priority, default lowered to 3
Background: the DukTape garbage collector shall run on lower priority than tasks like SIMCOM & events
commit e0a44791fbcfb5a4e4cad24c9d1163b76e637b4f
Server V2: use esp_log_timestamp for timeout detection, add timeout config, limit data records & size per second
New config: - [server.v2] timeout.rx -- timeout in seconds, default 960
commit 684a4ce9525175a910040f0d1ca82ac212fbf5de
Notify: use esp_log_timestamp for creation time instead of monotonictime to harden against timer service starvation / ticker event drops
Regards, Michael
Am 07.09.19 um 10:55 schrieb Michael Balzer: > I think the RTOS timer service task starves. It's running on core 0 with priority 1. > > Taks on core 0 sorted by priority: > > Number of Tasks = 20 Stack: Now Max Total Heap 32-bit SPIRAM C# PRI > 3FFC84A8 6 Blk ipc0 388 500 1024 7788 0 0 0 24 > 3FFC77F0 5 Blk OVMS CanRx 428 428 2048 3052 0 31844 0 23 > 3FFAFBF4 1 Blk esp_timer 400 656 4096 35928 644 25804 0 22 > 3FFD3240 19 Blk wifi 460 2716 3584 43720 0 20 0 22 > 3FFC03C4 2 Blk eventTask 448 1984 4608 104 0 0 0 20 > 3FFC8F14 17 Blk tiT 500 2308 3072 6552 0 0 * 18 > 3FFE14F0 26 Blk OVMS COrx 456 456 4096 0 0 0 0 7 > 3FFE19D4 27 Blk OVMS COwrk 476 476 3072 0 0 0 0 7 > 3FFCBC34 12 Blk Tmr Svc 352 928 3072 88 0 0 0 1 > 3FFE7708 23 Blk mdns 468 1396 4096 108 0 0 0 1 > > I don't think it's our CanRx, as that only fetches and queues CAN frames, the actual work is done by the listeners. The CO tasks only > run for CANopen jobs, which are few for normal operation. > > That leaves the system tasks, with main suspect -once again- the wifi blob. > > We need to know how much CPU time the tasks actually use now. I think I saw some option for this in the FreeRTOS config. > > Regards, > Michael > > > Am 06.09.19 um 23:15 schrieb Michael Balzer: >> The workaround is based on the monotonictime being updated per second, as do the history record offsets. >> >> Apparently, that mechanism doesn't work reliably. That may be an indicator for some bigger underlying issue. >> >> Example log excerpt: >> >> 2019-09-06 22:07:48.126919 +0200 info main: #173 C MITPROHB rx msg h 964,0,RT-BAT-C,5,86400,2,1,3830,3795,3830,-10,25,25,25,0 >> 2019-09-06 22:09:03.089031 +0200 info main: #173 C MITPROHB rx msg h 964,-10,RT-BAT-C,5,86400,2,1,3830,3795,3830,-10,25,25,25,0 >> 2019-09-06 22:09:05.041574 +0200 info main: #173 C MITPROHB rx msg h 964,-20,RT-BAT-C,5,86400,2,1,3830,3795,3830,-10,25,25,25,0 >> 2019-09-06 22:09:05.052644 +0200 info main: #173 C MITPROHB rx msg h 964,-30,RT-BAT-C,5,86400,2,1,3830,3795,3830,-10,25,25,25,0 >> 2019-09-06 22:09:05.063617 +0200 info main: #173 C MITPROHB rx msg h 964,-49,RT-BAT-C,5,86400,2,1,3830,3795,3830,-10,25,25,25,0 >> 2019-09-06 22:09:05.077527 +0200 info main: #173 C MITPROHB rx msg h 964,-59,RT-BAT-C,5,86400,2,1,3830,3795,3830,-10,25,25,25,0 >> 2019-09-06 22:09:05.193775 +0200 info main: #173 C MITPROHB rx msg h 964,-70,RT-BAT-C,5,86400,2,1,3830,3795,3830,-10,25,25,25,0 >> 2019-09-06 22:09:13.190645 +0200 info main: #173 C MITPROHB rx msg h 964,-80,RT-BAT-C,5,86400,2,1,3830,3795,3830,-10,25,25,25,0 >> 2019-09-06 22:09:22.077994 +0200 info main: #173 C MITPROHB rx msg h 964,-90,RT-BAT-C,5,86400,2,1,3830,3795,3830,-10,25,25,25,0 >> 2019-09-06 22:09:54.590300 +0200 info main: #173 C MITPROHB rx msg h 964,-109,RT-BAT-C,5,86400,2,1,3830,3795,3830,-10,25,25,25,0 >> 2019-09-06 22:11:10.127054 +0200 info main: #173 C MITPROHB rx msg h 964,-119,RT-BAT-C,5,86400,2,1,3830,3795,3830,-10,25,25,25,0 >> 2019-09-06 22:11:16.794200 +0200 info main: #173 C MITPROHB rx msg h 964,-130,RT-BAT-C,5,86400,2,1,3830,3795,3830,-10,25,25,25,0 >> 2019-09-06 22:11:22.455652 +0200 info main: #173 C MITPROHB rx msg h 964,-140,RT-BAT-C,5,86400,2,1,3830,3795,3830,-10,25,25,25,0 >> 2019-09-06 22:12:49.423412 +0200 info main: #173 C MITPROHB rx msg h 964,-150,RT-BAT-C,5,86400,2,1,3830,3795,3830,-10,25,25,25,0 >> 2019-09-06 22:12:49.442096 +0200 info main: #173 C MITPROHB rx msg h 964,-169,RT-BAT-C,5,86400,2,1,3830,3795,3830,-10,25,25,25,0 >> 2019-09-06 22:12:49.461941 +0200 info main: #173 C MITPROHB rx msg h 964,-179,RT-BAT-C,5,86400,2,1,3830,3795,3830,-10,25,25,25,0 >> 2019-09-06 22:14:39.828133 +0200 info main: #173 C MITPROHB rx msg h 964,-190,RT-BAT-C,5,86400,2,1,3830,3795,3830,-10,25,25,25,0 >> 2019-09-06 22:14:39.858144 +0200 info main: #173 C MITPROHB rx msg h 964,-200,RT-BAT-C,5,86400,2,1,3830,3795,3830,-10,25,25,25,0 >> 2019-09-06 22:14:52.020319 +0200 info main: #173 C MITPROHB rx msg h 964,-210,RT-BAT-C,5,86400,2,1,3830,3795,3830,-10,25,25,25,0 >> 2019-09-06 22:14:54.452637 +0200 info main: #173 C MITPROHB rx msg h 964,-229,RT-BAT-C,5,86400,2,1,3830,3795,3830,-10,25,25,25,0 >> 2019-09-06 22:15:12.613935 +0200 info main: #173 C MITPROHB rx msg h 964,-239,RT-BAT-C,5,86400,2,1,3830,3795,3830,-10,25,25,25,0 >> 2019-09-06 22:15:35.223845 +0200 info main: #173 C MITPROHB rx msg h 964,-250,RT-BAT-C,5,86400,2,1,3830,3795,3830,-10,25,25,25,0 >> 2019-09-06 22:16:09.255059 +0200 info main: #173 C MITPROHB rx msg h 964,-260,RT-BAT-C,5,86400,2,1,3830,3795,3830,-10,25,25,25,0 >> 2019-09-06 22:17:31.919754 +0200 info main: #173 C MITPROHB rx msg h 964,-270,RT-BAT-C,5,86400,2,1,3830,3795,3830,-10,25,25,25,0 >> 2019-09-06 22:19:23.366267 +0200 info main: #173 C MITPROHB rx msg h 964,-289,RT-BAT-C,5,86400,2,1,3830,3795,3830,-10,25,25,25,0 >> 2019-09-06 22:21:57.344609 +0200 info main: #173 C MITPROHB rx msg h 964,-299,RT-BAT-C,5,86400,2,1,3830,3795,3830,-10,25,25,25,0 >> 2019-09-06 22:23:40.082406 +0200 info main: #31 C MITPROHB rx msg h 964,-1027,RT-BAT-C,5,86400,2,1,3830,3795,3830,-10,25,25,25,0 >> 2019-09-06 22:25:58.061883 +0200 info main: #31 C MITPROHB rx msg h 964,-1040,RT-BAT-C,5,86400,2,1,3830,3795,3830,-10,25,25,25,0 >> >> >> This shows the ticker was only run 299 times from 22:07:48 to 22:21:57. >> >> After 22:21:57 the workaround was triggered and did a reconnect. Apparently during that network reinitialization of 103 seconds, the >> per second ticker was run 628 times. >> >> That can't be catching up on the event queue, as that queue has only 20 slots. So something strange is going on here. >> >> Any ideas? >> >> Regards, >> Michael >> >> >> Am 06.09.19 um 08:04 schrieb Michael Balzer: >>> Mark & anyone else running a V2 server, >>> >>> as most cars don't send history records, this also needs the change to the server I just pushed, i.e. server version 2.4.2. >>> >>> https://github.com/openvehicles/Open-Vehicle-Monitoring-System/commits/maste... >>> <https://github.com/openvehicles/Open-Vehicle-Monitoring-System/commits/master> >>> >>> Regards, >>> Michael >>> >>> >>> Am 05.09.19 um 19:55 schrieb Michael Balzer: >>>> I've pushed the nasty workaround: the v2 server checks for no RX over 15 minutes, then restarts the network (wifi & modem) as >>>> configured for autostart. >>>> >>>> Rolled out on my server in edge as 3.2.002-237-ge075f655. >>>> >>>> Please test. >>>> >>>> Regards, >>>> Michael >>>> >>>> >>>> Am 05.09.19 um 01:58 schrieb Mark Webb-Johnson: >>>>>> Mark, you can check your server logs for history messages with ridiculous time offsets: >>>>>> [sddexter@ns27 server]$ cat log-20190903 | egrep "rx msg h [0-9]+,-[0-9]{4}" | wc -l >>>>>> 455283 >>>>> >>>>> I checked my logs and see 12 vehicles showing this. But, 2 only show this for a debugcrash log (which is expected, I guess, if the >>>>> time is not synced at report time). I’ve got 4 cars with the offset > 10,000. >>>>> >>>>> Regards, Mark. >>>>> >>>>>> On 4 Sep 2019, at 4:45 AM, Michael Balzer <dexter@expeedo.de <mailto:dexter@expeedo.de> <mailto:dexter@expeedo.de>> wrote: >>>>>> >>>>>> Everyone, >>>>>> >>>>>> I've pushed a change that needs some testing. >>>>>> >>>>>> I had the issue myself now parking at a certain distance from my garage wifi AP, i.e. on the edge of "in", after wifi had been >>>>>> disconnected for some hours, and with the module still connected via modem. The wifi blob had been trying to connect to the AP for >>>>>> about two hours. >>>>>> >>>>>> As seen before, the module saw no error, just the server responses and commands stopped coming in. I noticed the default interface >>>>>> was still "st1" despite wifi having been disconnected and modem connected. The DNS was also still configured for my wifi network, >>>>>> and the interface seemed to have an IP address -- but wasn't pingable from the wifi network. >>>>>> >>>>>> A power cycle of the modem solved the issue without reboot. So the cause may be in the modem/ppp subsystem, or it may be related >>>>>> (in some weird way) to the default interface / DNS setup. >>>>>> >>>>>> More tests showed the default interface again/still got set by the wifi blob itself at some point, overriding our modem >>>>>> prioritization. The events we didn't handle up to now were "sta.connected" and "sta.lostip", so I added these, and the bug didn't >>>>>> show up again since then. That doesn't mean anything, so we need to test this. >>>>>> >>>>>> The default interface really shouldn't affect inbound packet routing of an established connection, but there always may be strange >>>>>> bugs lurking in those libs. >>>>>> >>>>>> The change also reimplements the wifi signal strength reading, as the tests also showed that still wasn't working well using the >>>>>> CSI callback. It now seems to be much more reliable. >>>>>> >>>>>> Please test & report. The single module will be hard to test, as the bug isn't reproducable easily, but you can still try if wifi / >>>>>> modem transitions work well. >>>>>> >>>>>> Mark, you can check your server logs for history messages with ridiculous time offsets: >>>>>> [sddexter@ns27 server]$ cat log-20190903 | egrep "rx msg h [0-9]+,-[0-9]{4}" | wc -l >>>>>> 455283 >>>>>> The bug now severely affects the V2 server performance, as the server is single threaded and doesn't scale very well to this kind >>>>>> of bulk data bursts, especially when coming from multiple modules in parallel. So we really need to solve this now. Slow reactions >>>>>> or connection drops from my server lately have been due to this bug. If this change doesn't solve it, we'll need to add some reboot >>>>>> trigger on "too many server v2 notification retransmissions" -- or maybe a modem power cycle will do, that wouldn't discard the data. >>>>>> >>>>>> Thanks, >>>>>> Michael >>>>>> >>>>>> >>>>>> Am 03.09.19 um 07:46 schrieb Mark Webb-Johnson: >>>>>>> No problem. We can hold. I won’t commit anything for the next few days (and agree to hold-off on Markos’s pull). Let me know when >>>>>>> you are ready. >>>>>>> >>>>>>> Regards, Mark. >>>>>>> >>>>>>>> On 3 Sep 2019, at 1:58 AM, Michael Balzer <dexter@expeedo.de <mailto:dexter@expeedo.de>> <mailto:dexter@expeedo.de> wrote: >>>>>>>> >>>>>>>> Mark, please wait. >>>>>>>> >>>>>>>> I may just have found the cause for issue #241, or at least something I need to investigate before releasing. >>>>>>>> >>>>>>>> I need to dig into my logs first, and try something. >>>>>>>> >>>>>>>> Regards, >>>>>>>> Michael >>>>>>>> >>>>>>>> >>>>>>>> Am 02.09.19 um 12:23 schrieb Michael Balzer: >>>>>>>>> Nothing open from my side at the moment. >>>>>>>>> >>>>>>>>> I haven't had the time to look in to Markos pull request, but from a first check also think that's going too deep to be included >>>>>>>>> in this release. >>>>>>>>> >>>>>>>>> Regards, >>>>>>>>> Michael >>>>>>>>> >>>>>>>>> >>>>>>>>> Am 02.09.19 um 04:15 schrieb Mark Webb-Johnson: >>>>>>>>>> I think it is well past time for a 3.2.003 release. Things seems table in edge (although some things only partially implemented). >>>>>>>>>> >>>>>>>>>> Anything people want to include at the last minute, or can we go ahead and build? >>>>>>>>>> >>>>>>>>>> Regards, Mark. >>>>>>>>>>
-- Michael Balzer * Helkenberger Weg 9 * D-58256 Ennepetal Fon 02333 / 833 5735 * Handy 0176 / 206 989 26
_______________________________________________ OvmsDev mailing list OvmsDev@lists.openvehicles.com http://lists.openvehicles.com/mailman/listinfo/ovmsdev
-- Michael Balzer * Helkenberger Weg 9 * D-58256 Ennepetal Fon 02333 / 833 5735 * Handy 0176 / 206 989 26
_______________________________________________ OvmsDev mailing list OvmsDev@lists.openvehicles.com http://lists.openvehicles.com/mailman/listinfo/ovmsdev
-- Michael Balzer * Helkenberger Weg 9 * D-58256 Ennepetal Fon 02333 / 833 5735 * Handy 0176 / 206 989 26
Strange. Connected to my car, and from ovms_shell asked for ‘module tasks’: ovms> module tasks ... Vehicle Response: Number of Tasks = 17 Stack: Now Max Total Heap 32-bit SPIRAM C# PRI CPU% 3FFAFBF4 1 Blk esp_timer 400 656 4096 35944 6442122956 0 22 2% 3FFBDBBC 2 Blk eventTask 440 1928 4608 140 0 0 0 20 0% 3FFBFF00 3 Blk OVMS Events 444 3404 8192 70816 0 21092 1 5 9% 3FFC3300 4 Blk OVMS DukTape 460 9548 12288 188 0 31020 1 3 12% 3FFC4FF4 5 Blk OVMS CanRx 432 832 2048 3144 0 32072 0 23 120% 3FFC5D3C 6 Blk ipc0 392 504 1024 7804 0 0 0 24 2% 3FFC6340 7 Blk ipc1 396 444 1024 12 0 0 1 24 0% 3FFC8194 10 Rdy IDLE0 416 512 1024 0 0 0 0 0 362% 3FFC872C 11 Rdy IDLE1 408 504 1024 0 0 0 1 0 387% 3FFC94C4 12 Blk Tmr Svc 352 912 3072 88 0 0 0 20 1% 3FFC6794 17 Blk tiT 504 2536 3072 7668 0 0 * 18 6% 3FFCF3E0 18 Blk OVMS SIMCOM 460 2412 4096 40 0 3892 1 5 1% 3FFD0C10 19 Blk wifi 460 2716 3584 36356 0 2912 0 22 23% 3FFDBD70 20 Blk OVMS Vehicle 460 1308 6144 0 0 2336 1 10 95% 3FFDF0FC 21 Rdy OVMS Console 488 1736 6144 0 0 20 1 5 0% 3FFDF64C 22 Blk mdns 472 1576 4096 108 0 0 0 1 1% 3FFE38F0 35 Rdy OVMS NetMan 1384 2984 8192 144 25180 5004 1 5 3% ovms> module tasks ... Vehicle Response: Number of Tasks = 17 Stack: Now Max Total Heap 32-bit SPIRAM C# PRI CPU% 3FFAFBF4 1 Blk esp_timer 400 656 4096 35944 6442122956 0 22 0% 3FFBDBBC 2 Blk eventTask 440 1928 4608 140 0 0 0 20 0% 3FFBFF00 3 Blk OVMS Events 444 3404 8192 70816 0 21092 1 5 0% 3FFC3300 4 Blk OVMS DukTape 460 9548 12288 188 0 23712 1 3 1% 3FFC4FF4 5 Blk OVMS CanRx 432 832 2048 3144 0 32072 0 23 4% 3FFC5D3C 6 Blk ipc0 392 504 1024 7804 0 0 0 24 0% 3FFC6340 7 Blk ipc1 396 444 1024 12 0 0 1 24 0% 3FFC8194 10 Rdy IDLE0 416 512 1024 0 0 0 0 0 96% 3FFC872C 11 Rdy IDLE1 408 504 1024 0 0 0 1 0 95% 3FFC94C4 12 Blk Tmr Svc 352 912 3072 88 0 0 0 20 0% 3FFC6794 17 Blk tiT 504 2536 3072 7668 0 0 * 18 0% 3FFCF3E0 18 Blk OVMS SIMCOM 668 2412 4096 40 0 3892 1 5 0% 3FFD0C10 19 Blk wifi 460 2716 3584 36356 0 2912 0 22 0% 3FFDBD70 20 Blk OVMS Vehicle 460 1308 6144 0 0 2336 1 10 3% 3FFDF0FC 21 Blk OVMS Console 552 1736 6144 0 0 20 1 5 0% 3FFDF64C 22 Blk mdns 472 1576 4096 108 0 0 0 1 0% 3FFE38F0 35 Rdy OVMS NetMan 1896 3240 8192 400 25180 5392 1 5 0% The second one is what I normally see, but the first is bizarre. Any idea what the time frame for the CPU% is? Regards, Mark
On 8 Sep 2019, at 5:43 PM, Michael Balzer <dexter@expeedo.de <mailto:dexter@expeedo.de>> wrote:
I've pushed some modifications and improvements to (hopefully) fix the timer issue or at least be able to debug it.
Some sdkconfig changes are necessary.
The build including these updates is on my edge release as 3.2.002-258-g20ae554b.
Btw: the network restart strategy seems to mitigate issue #241; I've seen a major drop on record repetitions on my server since the rollout.
commit 99e4e48bdd40b7004c0976f51aba9e3da4ecab53
Module: add per task CPU usage statistics, add task stats history records
To enable CPU usage statistics, apply the changes to sdkconfig included. The CPU usage shown by the commands is calculated against the last task status retrieved (or system boot).
Command changes: - "module tasks" -- added CPU (core) usage in percent per task
New command: - "module tasks data" -- output task stats in history record form
New config: - [module] debug.tasks -- yes (default) = send task stats every 5 minutes
New history record: - "*-OVM-DebugTasks" v1: <taskcnt,totaltime> + per task: <tasknum,name,state,stack_now,stack_max,stack_total, heap_total,heap_32bit,heap_spi,runtime> Note: CPU core use percentage = runtime / totaltime
commit 950172c216a72beb4da0bc7a40a46995a6105955
Build config: default timer service task priority raised to 20
Background: the FreeRTOS timer service shall only be used for very short and non-blocking jobs. We delegate event processing to our events task, anything else in timers needs to run with high priority.
commit 31ac19d187480046c16356b80668de45cacbb83d
DukTape: add build config for task priority, default lowered to 3
Background: the DukTape garbage collector shall run on lower priority than tasks like SIMCOM & events
commit e0a44791fbcfb5a4e4cad24c9d1163b76e637b4f
Server V2: use esp_log_timestamp for timeout detection, add timeout config, limit data records & size per second
New config: - [server.v2] timeout.rx -- timeout in seconds, default 960
commit 684a4ce9525175a910040f0d1ca82ac212fbf5de
Notify: use esp_log_timestamp for creation time instead of monotonictime to harden against timer service starvation / ticker event drops
Regards, Michael
Am 07.09.19 um 10:55 schrieb Michael Balzer:
I think the RTOS timer service task starves. It's running on core 0 with priority 1.
Taks on core 0 sorted by priority:
Number of Tasks = 20 Stack: Now Max Total Heap 32-bit SPIRAM C# PRI 3FFC84A8 6 Blk ipc0 388 500 1024 7788 0 0 0 24 3FFC77F0 5 Blk OVMS CanRx 428 428 2048 3052 0 31844 0 23 3FFAFBF4 1 Blk esp_timer 400 656 4096 35928 644 25804 0 22 3FFD3240 19 Blk wifi 460 2716 3584 43720 0 20 0 22 3FFC03C4 2 Blk eventTask 448 1984 4608 104 0 0 0 20 3FFC8F14 17 Blk tiT 500 2308 3072 6552 0 0 * 18 3FFE14F0 26 Blk OVMS COrx 456 456 4096 0 0 0 0 7 3FFE19D4 27 Blk OVMS COwrk 476 476 3072 0 0 0 0 7 3FFCBC34 12 Blk Tmr Svc 352 928 3072 88 0 0 0 1 3FFE7708 23 Blk mdns 468 1396 4096 108 0 0 0 1
I don't think it's our CanRx, as that only fetches and queues CAN frames, the actual work is done by the listeners. The CO tasks only run for CANopen jobs, which are few for normal operation.
That leaves the system tasks, with main suspect -once again- the wifi blob.
We need to know how much CPU time the tasks actually use now. I think I saw some option for this in the FreeRTOS config.
Regards, Michael
Am 06.09.19 um 23:15 schrieb Michael Balzer: > The workaround is based on the monotonictime being updated per second, as do the history record offsets. > > Apparently, that mechanism doesn't work reliably. That may be an indicator for some bigger underlying issue. > > Example log excerpt: > > 2019-09-06 22:07:48.126919 +0200 info main: #173 C MITPROHB rx msg h 964,0,RT-BAT-C,5,86400,2,1,3830,3795,3830,-10,25,25,25,0 > 2019-09-06 22:09:03.089031 +0200 info main: #173 C MITPROHB rx msg h 964,-10,RT-BAT-C,5,86400,2,1,3830,3795,3830,-10,25,25,25,0 > 2019-09-06 22:09:05.041574 +0200 info main: #173 C MITPROHB rx msg h 964,-20,RT-BAT-C,5,86400,2,1,3830,3795,3830,-10,25,25,25,0 > 2019-09-06 22:09:05.052644 +0200 info main: #173 C MITPROHB rx msg h 964,-30,RT-BAT-C,5,86400,2,1,3830,3795,3830,-10,25,25,25,0 > 2019-09-06 22:09:05.063617 +0200 info main: #173 C MITPROHB rx msg h 964,-49,RT-BAT-C,5,86400,2,1,3830,3795,3830,-10,25,25,25,0 > 2019-09-06 22:09:05.077527 +0200 info main: #173 C MITPROHB rx msg h 964,-59,RT-BAT-C,5,86400,2,1,3830,3795,3830,-10,25,25,25,0 > 2019-09-06 22:09:05.193775 +0200 info main: #173 C MITPROHB rx msg h 964,-70,RT-BAT-C,5,86400,2,1,3830,3795,3830,-10,25,25,25,0 > 2019-09-06 22:09:13.190645 +0200 info main: #173 C MITPROHB rx msg h 964,-80,RT-BAT-C,5,86400,2,1,3830,3795,3830,-10,25,25,25,0 > 2019-09-06 22:09:22.077994 +0200 info main: #173 C MITPROHB rx msg h 964,-90,RT-BAT-C,5,86400,2,1,3830,3795,3830,-10,25,25,25,0 > 2019-09-06 22:09:54.590300 +0200 info main: #173 C MITPROHB rx msg h 964,-109,RT-BAT-C,5,86400,2,1,3830,3795,3830,-10,25,25,25,0 > 2019-09-06 22:11:10.127054 +0200 info main: #173 C MITPROHB rx msg h 964,-119,RT-BAT-C,5,86400,2,1,3830,3795,3830,-10,25,25,25,0 > 2019-09-06 22:11:16.794200 +0200 info main: #173 C MITPROHB rx msg h 964,-130,RT-BAT-C,5,86400,2,1,3830,3795,3830,-10,25,25,25,0 > 2019-09-06 22:11:22.455652 +0200 info main: #173 C MITPROHB rx msg h 964,-140,RT-BAT-C,5,86400,2,1,3830,3795,3830,-10,25,25,25,0 > 2019-09-06 22:12:49.423412 +0200 info main: #173 C MITPROHB rx msg h 964,-150,RT-BAT-C,5,86400,2,1,3830,3795,3830,-10,25,25,25,0 > 2019-09-06 22:12:49.442096 +0200 info main: #173 C MITPROHB rx msg h 964,-169,RT-BAT-C,5,86400,2,1,3830,3795,3830,-10,25,25,25,0 > 2019-09-06 22:12:49.461941 +0200 info main: #173 C MITPROHB rx msg h 964,-179,RT-BAT-C,5,86400,2,1,3830,3795,3830,-10,25,25,25,0 > 2019-09-06 22:14:39.828133 +0200 info main: #173 C MITPROHB rx msg h 964,-190,RT-BAT-C,5,86400,2,1,3830,3795,3830,-10,25,25,25,0 > 2019-09-06 22:14:39.858144 +0200 info main: #173 C MITPROHB rx msg h 964,-200,RT-BAT-C,5,86400,2,1,3830,3795,3830,-10,25,25,25,0 > 2019-09-06 22:14:52.020319 +0200 info main: #173 C MITPROHB rx msg h 964,-210,RT-BAT-C,5,86400,2,1,3830,3795,3830,-10,25,25,25,0 > 2019-09-06 22:14:54.452637 +0200 info main: #173 C MITPROHB rx msg h 964,-229,RT-BAT-C,5,86400,2,1,3830,3795,3830,-10,25,25,25,0 > 2019-09-06 22:15:12.613935 +0200 info main: #173 C MITPROHB rx msg h 964,-239,RT-BAT-C,5,86400,2,1,3830,3795,3830,-10,25,25,25,0 > 2019-09-06 22:15:35.223845 +0200 info main: #173 C MITPROHB rx msg h 964,-250,RT-BAT-C,5,86400,2,1,3830,3795,3830,-10,25,25,25,0 > 2019-09-06 22:16:09.255059 +0200 info main: #173 C MITPROHB rx msg h 964,-260,RT-BAT-C,5,86400,2,1,3830,3795,3830,-10,25,25,25,0 > 2019-09-06 22:17:31.919754 +0200 info main: #173 C MITPROHB rx msg h 964,-270,RT-BAT-C,5,86400,2,1,3830,3795,3830,-10,25,25,25,0 > 2019-09-06 22:19:23.366267 +0200 info main: #173 C MITPROHB rx msg h 964,-289,RT-BAT-C,5,86400,2,1,3830,3795,3830,-10,25,25,25,0 > 2019-09-06 22:21:57.344609 +0200 info main: #173 C MITPROHB rx msg h 964,-299,RT-BAT-C,5,86400,2,1,3830,3795,3830,-10,25,25,25,0 > 2019-09-06 22:23:40.082406 +0200 info main: #31 C MITPROHB rx msg h 964,-1027,RT-BAT-C,5,86400,2,1,3830,3795,3830,-10,25,25,25,0 > 2019-09-06 22:25:58.061883 +0200 info main: #31 C MITPROHB rx msg h 964,-1040,RT-BAT-C,5,86400,2,1,3830,3795,3830,-10,25,25,25,0 > > > This shows the ticker was only run 299 times from 22:07:48 to 22:21:57. > > After 22:21:57 the workaround was triggered and did a reconnect. Apparently during that network reinitialization of 103 seconds, the per second ticker was run 628 times. > > That can't be catching up on the event queue, as that queue has only 20 slots. So something strange is going on here. > > Any ideas? > > Regards, > Michael > > > Am 06.09.19 um 08:04 schrieb Michael Balzer: >> Mark & anyone else running a V2 server, >> >> as most cars don't send history records, this also needs the change to the server I just pushed, i.e. server version 2.4.2. >> >> https://github.com/openvehicles/Open-Vehicle-Monitoring-System/commits/maste... <https://github.com/openvehicles/Open-Vehicle-Monitoring-System/commits/master> <https://github.com/openvehicles/Open-Vehicle-Monitoring-System/commits/maste... <https://github.com/openvehicles/Open-Vehicle-Monitoring-System/commits/master>> >> >> Regards, >> Michael >> >> >> Am 05.09.19 um 19:55 schrieb Michael Balzer: >>> I've pushed the nasty workaround: the v2 server checks for no RX over 15 minutes, then restarts the network (wifi & modem) as configured for autostart. >>> >>> Rolled out on my server in edge as 3.2.002-237-ge075f655. >>> >>> Please test. >>> >>> Regards, >>> Michael >>> >>> >>> Am 05.09.19 um 01:58 schrieb Mark Webb-Johnson: >>>>> Mark, you can check your server logs for history messages with ridiculous time offsets: >>>>> [sddexter@ns27 server]$ cat log-20190903 | egrep "rx msg h [0-9]+,-[0-9]{4}" | wc -l >>>>> 455283 >>>> >>>> I checked my logs and see 12 vehicles showing this. But, 2 only show this for a debugcrash log (which is expected, I guess, if the time is not synced at report time). I’ve got 4 cars with the offset > 10,000. >>>> >>>> Regards, Mark. >>>> >>>>> On 4 Sep 2019, at 4:45 AM, Michael Balzer <dexter@expeedo.de <mailto:dexter@expeedo.de> <mailto:dexter@expeedo.de <mailto:dexter@expeedo.de>>> wrote: >>>>> >>>>> Everyone, >>>>> >>>>> I've pushed a change that needs some testing. >>>>> >>>>> I had the issue myself now parking at a certain distance from my garage wifi AP, i.e. on the edge of "in", after wifi had been disconnected for some hours, and with the module still connected via modem. The wifi blob had been trying to connect to the AP for about two hours. >>>>> >>>>> As seen before, the module saw no error, just the server responses and commands stopped coming in. I noticed the default interface was still "st1" despite wifi having been disconnected and modem connected. The DNS was also still configured for my wifi network, and the interface seemed to have an IP address -- but wasn't pingable from the wifi network. >>>>> >>>>> A power cycle of the modem solved the issue without reboot. So the cause may be in the modem/ppp subsystem, or it may be related (in some weird way) to the default interface / DNS setup. >>>>> >>>>> More tests showed the default interface again/still got set by the wifi blob itself at some point, overriding our modem prioritization. The events we didn't handle up to now were "sta.connected" and "sta.lostip", so I added these, and the bug didn't show up again since then. That doesn't mean anything, so we need to test this. >>>>> >>>>> The default interface really shouldn't affect inbound packet routing of an established connection, but there always may be strange bugs lurking in those libs. >>>>> >>>>> The change also reimplements the wifi signal strength reading, as the tests also showed that still wasn't working well using the CSI callback. It now seems to be much more reliable. >>>>> >>>>> Please test & report. The single module will be hard to test, as the bug isn't reproducable easily, but you can still try if wifi / modem transitions work well. >>>>> >>>>> Mark, you can check your server logs for history messages with ridiculous time offsets: >>>>> [sddexter@ns27 server]$ cat log-20190903 | egrep "rx msg h [0-9]+,-[0-9]{4}" | wc -l >>>>> 455283 >>>>> The bug now severely affects the V2 server performance, as the server is single threaded and doesn't scale very well to this kind of bulk data bursts, especially when coming from multiple modules in parallel. So we really need to solve this now. Slow reactions or connection drops from my server lately have been due to this bug. If this change doesn't solve it, we'll need to add some reboot trigger on "too many server v2 notification retransmissions" -- or maybe a modem power cycle will do, that wouldn't discard the data. >>>>> >>>>> Thanks, >>>>> Michael >>>>> >>>>> >>>>> Am 03.09.19 um 07:46 schrieb Mark Webb-Johnson: >>>>>> No problem. We can hold. I won’t commit anything for the next few days (and agree to hold-off on Markos’s pull). Let me know when you are ready. >>>>>> >>>>>> Regards, Mark. >>>>>> >>>>>>> On 3 Sep 2019, at 1:58 AM, Michael Balzer <dexter@expeedo.de <mailto:dexter@expeedo.de>> <mailto:dexter@expeedo.de <mailto:dexter@expeedo.de>> wrote: >>>>>>> >>>>>>> Mark, please wait. >>>>>>> >>>>>>> I may just have found the cause for issue #241, or at least something I need to investigate before releasing. >>>>>>> >>>>>>> I need to dig into my logs first, and try something. >>>>>>> >>>>>>> Regards, >>>>>>> Michael >>>>>>> >>>>>>> >>>>>>> Am 02.09.19 um 12:23 schrieb Michael Balzer: >>>>>>>> Nothing open from my side at the moment. >>>>>>>> >>>>>>>> I haven't had the time to look in to Markos pull request, but from a first check also think that's going too deep to be included in this release. >>>>>>>> >>>>>>>> Regards, >>>>>>>> Michael >>>>>>>> >>>>>>>> >>>>>>>> Am 02.09.19 um 04:15 schrieb Mark Webb-Johnson: >>>>>>>>> I think it is well past time for a 3.2.003 release. Things seems table in edge (although some things only partially implemented). >>>>>>>>> >>>>>>>>> Anything people want to include at the last minute, or can we go ahead and build? >>>>>>>>> >>>>>>>>> Regards, Mark. >>>>>>>>>
-- Michael Balzer * Helkenberger Weg 9 * D-58256 Ennepetal Fon 02333 / 833 5735 * Handy 0176 / 206 989 26
The percentages are calculated from the time slice counter differences between two command invocations (or boot), but their 32 bit limit shouldn't have an effect that soon. Also strange: your esp_timer SPIRAM allocation… Is that a build with toolkit -98? Regards, Michael Am 20.09.19 um 03:29 schrieb Mark Webb-Johnson:
Strange. Connected to my car, and from ovms_shell asked for ‘module tasks’:
ovms> module tasks ... Vehicle Response: Number of Tasks = 17 Stack: Now Max Total Heap 32-bit SPIRAM C# PRI CPU% 3FFAFBF4 1 Blk esp_timer 400 656 4096 35944 6442122956 0 22 2% 3FFBDBBC 2 Blk eventTask 440 1928 4608 140 0 0 0 20 0% 3FFBFF00 3 Blk OVMS Events 444 3404 8192 70816 0 21092 1 5 9% 3FFC3300 4 Blk OVMS DukTape 460 9548 12288 188 0 31020 1 3 12% 3FFC4FF4 5 Blk OVMS CanRx 432 832 2048 3144 0 32072 0 23 120% 3FFC5D3C 6 Blk ipc0 392 504 1024 7804 0 0 0 24 2% 3FFC6340 7 Blk ipc1 396 444 1024 12 0 0 1 24 0% 3FFC8194 10 Rdy IDLE0 416 512 1024 0 0 0 0 0 362% 3FFC872C 11 Rdy IDLE1 408 504 1024 0 0 0 1 0 387% 3FFC94C4 12 Blk Tmr Svc 352 912 3072 88 0 0 0 20 1% 3FFC6794 17 Blk tiT 504 2536 3072 7668 0 0 * 18 6% 3FFCF3E0 18 Blk OVMS SIMCOM 460 2412 4096 40 0 3892 1 5 1% 3FFD0C10 19 Blk wifi 460 2716 3584 36356 0 2912 0 22 23% 3FFDBD70 20 Blk OVMS Vehicle 460 1308 6144 0 0 2336 1 10 95% 3FFDF0FC 21 Rdy OVMS Console 488 1736 6144 0 0 20 1 5 0% 3FFDF64C 22 Blk mdns 472 1576 4096 108 0 0 0 1 1% 3FFE38F0 35 Rdy OVMS NetMan 1384 2984 8192 144 25180 5004 1 5 3%
ovms> module tasks ... Vehicle Response: Number of Tasks = 17 Stack: Now Max Total Heap 32-bit SPIRAM C# PRI CPU% 3FFAFBF4 1 Blk esp_timer 400 656 4096 35944 6442122956 0 22 0% 3FFBDBBC 2 Blk eventTask 440 1928 4608 140 0 0 0 20 0% 3FFBFF00 3 Blk OVMS Events 444 3404 8192 70816 0 21092 1 5 0% 3FFC3300 4 Blk OVMS DukTape 460 9548 12288 188 0 23712 1 3 1% 3FFC4FF4 5 Blk OVMS CanRx 432 832 2048 3144 0 32072 0 23 4% 3FFC5D3C 6 Blk ipc0 392 504 1024 7804 0 0 0 24 0% 3FFC6340 7 Blk ipc1 396 444 1024 12 0 0 1 24 0% 3FFC8194 10 Rdy IDLE0 416 512 1024 0 0 0 0 0 96% 3FFC872C 11 Rdy IDLE1 408 504 1024 0 0 0 1 0 95% 3FFC94C4 12 Blk Tmr Svc 352 912 3072 88 0 0 0 20 0% 3FFC6794 17 Blk tiT 504 2536 3072 7668 0 0 * 18 0% 3FFCF3E0 18 Blk OVMS SIMCOM 668 2412 4096 40 0 3892 1 5 0% 3FFD0C10 19 Blk wifi 460 2716 3584 36356 0 2912 0 22 0% 3FFDBD70 20 Blk OVMS Vehicle 460 1308 6144 0 0 2336 1 10 3% 3FFDF0FC 21 Blk OVMS Console 552 1736 6144 0 0 20 1 5 0% 3FFDF64C 22 Blk mdns 472 1576 4096 108 0 0 0 1 0% 3FFE38F0 35 Rdy OVMS NetMan 1896 3240 8192 400 25180 5392 1 5 0%
The second one is what I normally see, but the first is bizarre. Any idea what the time frame for the CPU% is?
Regards, Mark
On 8 Sep 2019, at 5:43 PM, Michael Balzer <dexter@expeedo.de <mailto:dexter@expeedo.de>> wrote:
I've pushed some modifications and improvements to (hopefully) fix the timer issue or at least be able to debug it.
Some sdkconfig changes are necessary.
The build including these updates is on my edge release as 3.2.002-258-g20ae554b.
Btw: the network restart strategy seems to mitigate issue #241; I've seen a major drop on record repetitions on my server since the rollout.
commit 99e4e48bdd40b7004c0976f51aba9e3da4ecab53
Module: add per task CPU usage statistics, add task stats history records
To enable CPU usage statistics, apply the changes to sdkconfig included. The CPU usage shown by the commands is calculated against the last task status retrieved (or system boot).
Command changes: - "module tasks" -- added CPU (core) usage in percent per task
New command: - "module tasks data" -- output task stats in history record form
New config: - [module] debug.tasks -- yes (default) = send task stats every 5 minutes
New history record: - "*-OVM-DebugTasks" v1: <taskcnt,totaltime> + per task: <tasknum,name,state,stack_now,stack_max,stack_total, heap_total,heap_32bit,heap_spi,runtime> Note: CPU core use percentage = runtime / totaltime
commit 950172c216a72beb4da0bc7a40a46995a6105955
Build config: default timer service task priority raised to 20
Background: the FreeRTOS timer service shall only be used for very short and non-blocking jobs. We delegate event processing to our events task, anything else in timers needs to run with high priority.
commit 31ac19d187480046c16356b80668de45cacbb83d
DukTape: add build config for task priority, default lowered to 3
Background: the DukTape garbage collector shall run on lower priority than tasks like SIMCOM & events
commit e0a44791fbcfb5a4e4cad24c9d1163b76e637b4f
Server V2: use esp_log_timestamp for timeout detection, add timeout config, limit data records & size per second
New config: - [server.v2] timeout.rx -- timeout in seconds, default 960
commit 684a4ce9525175a910040f0d1ca82ac212fbf5de
Notify: use esp_log_timestamp for creation time instead of monotonictime to harden against timer service starvation / ticker event drops
Regards, Michael
Am 07.09.19 um 10:55 schrieb Michael Balzer: > I think the RTOS timer service task starves. It's running on core 0 with priority 1. > > Taks on core 0 sorted by priority: > > Number of Tasks = 20 Stack: Now Max Total Heap 32-bit SPIRAM C# PRI > 3FFC84A8 6 Blk ipc0 388 500 1024 7788 0 0 0 24 > 3FFC77F0 5 Blk OVMS CanRx 428 428 2048 3052 0 31844 0 23 > 3FFAFBF4 1 Blk esp_timer 400 656 4096 35928 644 25804 0 22 > 3FFD3240 19 Blk wifi 460 2716 3584 43720 0 20 0 22 > 3FFC03C4 2 Blk eventTask 448 1984 4608 104 0 0 0 20 > 3FFC8F14 17 Blk tiT 500 2308 3072 6552 0 0 * 18 > 3FFE14F0 26 Blk OVMS COrx 456 456 4096 0 0 0 0 7 > 3FFE19D4 27 Blk OVMS COwrk 476 476 3072 0 0 0 0 7 > 3FFCBC34 12 Blk Tmr Svc 352 928 3072 88 0 0 0 1 > 3FFE7708 23 Blk mdns 468 1396 4096 108 0 0 0 1 > > I don't think it's our CanRx, as that only fetches and queues CAN frames, the actual work is done by the listeners. The CO tasks only run for CANopen > jobs, which are few for normal operation. > > That leaves the system tasks, with main suspect -once again- the wifi blob. > > We need to know how much CPU time the tasks actually use now. I think I saw some option for this in the FreeRTOS config. > > Regards, > Michael > > > Am 06.09.19 um 23:15 schrieb Michael Balzer: >> The workaround is based on the monotonictime being updated per second, as do the history record offsets. >> >> Apparently, that mechanism doesn't work reliably. That may be an indicator for some bigger underlying issue. >> >> Example log excerpt: >> >> 2019-09-06 22:07:48.126919 +0200 info main: #173 C MITPROHB rx msg h 964,0,RT-BAT-C,5,86400,2,1,3830,3795,3830,-10,25,25,25,0 >> 2019-09-06 22:09:03.089031 +0200 info main: #173 C MITPROHB rx msg h 964,-10,RT-BAT-C,5,86400,2,1,3830,3795,3830,-10,25,25,25,0 >> 2019-09-06 22:09:05.041574 +0200 info main: #173 C MITPROHB rx msg h 964,-20,RT-BAT-C,5,86400,2,1,3830,3795,3830,-10,25,25,25,0 >> 2019-09-06 22:09:05.052644 +0200 info main: #173 C MITPROHB rx msg h 964,-30,RT-BAT-C,5,86400,2,1,3830,3795,3830,-10,25,25,25,0 >> 2019-09-06 22:09:05.063617 +0200 info main: #173 C MITPROHB rx msg h 964,-49,RT-BAT-C,5,86400,2,1,3830,3795,3830,-10,25,25,25,0 >> 2019-09-06 22:09:05.077527 +0200 info main: #173 C MITPROHB rx msg h 964,-59,RT-BAT-C,5,86400,2,1,3830,3795,3830,-10,25,25,25,0 >> 2019-09-06 22:09:05.193775 +0200 info main: #173 C MITPROHB rx msg h 964,-70,RT-BAT-C,5,86400,2,1,3830,3795,3830,-10,25,25,25,0 >> 2019-09-06 22:09:13.190645 +0200 info main: #173 C MITPROHB rx msg h 964,-80,RT-BAT-C,5,86400,2,1,3830,3795,3830,-10,25,25,25,0 >> 2019-09-06 22:09:22.077994 +0200 info main: #173 C MITPROHB rx msg h 964,-90,RT-BAT-C,5,86400,2,1,3830,3795,3830,-10,25,25,25,0 >> 2019-09-06 22:09:54.590300 +0200 info main: #173 C MITPROHB rx msg h 964,-109,RT-BAT-C,5,86400,2,1,3830,3795,3830,-10,25,25,25,0 >> 2019-09-06 22:11:10.127054 +0200 info main: #173 C MITPROHB rx msg h 964,-119,RT-BAT-C,5,86400,2,1,3830,3795,3830,-10,25,25,25,0 >> 2019-09-06 22:11:16.794200 +0200 info main: #173 C MITPROHB rx msg h 964,-130,RT-BAT-C,5,86400,2,1,3830,3795,3830,-10,25,25,25,0 >> 2019-09-06 22:11:22.455652 +0200 info main: #173 C MITPROHB rx msg h 964,-140,RT-BAT-C,5,86400,2,1,3830,3795,3830,-10,25,25,25,0 >> 2019-09-06 22:12:49.423412 +0200 info main: #173 C MITPROHB rx msg h 964,-150,RT-BAT-C,5,86400,2,1,3830,3795,3830,-10,25,25,25,0 >> 2019-09-06 22:12:49.442096 +0200 info main: #173 C MITPROHB rx msg h 964,-169,RT-BAT-C,5,86400,2,1,3830,3795,3830,-10,25,25,25,0 >> 2019-09-06 22:12:49.461941 +0200 info main: #173 C MITPROHB rx msg h 964,-179,RT-BAT-C,5,86400,2,1,3830,3795,3830,-10,25,25,25,0 >> 2019-09-06 22:14:39.828133 +0200 info main: #173 C MITPROHB rx msg h 964,-190,RT-BAT-C,5,86400,2,1,3830,3795,3830,-10,25,25,25,0 >> 2019-09-06 22:14:39.858144 +0200 info main: #173 C MITPROHB rx msg h 964,-200,RT-BAT-C,5,86400,2,1,3830,3795,3830,-10,25,25,25,0 >> 2019-09-06 22:14:52.020319 +0200 info main: #173 C MITPROHB rx msg h 964,-210,RT-BAT-C,5,86400,2,1,3830,3795,3830,-10,25,25,25,0 >> 2019-09-06 22:14:54.452637 +0200 info main: #173 C MITPROHB rx msg h 964,-229,RT-BAT-C,5,86400,2,1,3830,3795,3830,-10,25,25,25,0 >> 2019-09-06 22:15:12.613935 +0200 info main: #173 C MITPROHB rx msg h 964,-239,RT-BAT-C,5,86400,2,1,3830,3795,3830,-10,25,25,25,0 >> 2019-09-06 22:15:35.223845 +0200 info main: #173 C MITPROHB rx msg h 964,-250,RT-BAT-C,5,86400,2,1,3830,3795,3830,-10,25,25,25,0 >> 2019-09-06 22:16:09.255059 +0200 info main: #173 C MITPROHB rx msg h 964,-260,RT-BAT-C,5,86400,2,1,3830,3795,3830,-10,25,25,25,0 >> 2019-09-06 22:17:31.919754 +0200 info main: #173 C MITPROHB rx msg h 964,-270,RT-BAT-C,5,86400,2,1,3830,3795,3830,-10,25,25,25,0 >> 2019-09-06 22:19:23.366267 +0200 info main: #173 C MITPROHB rx msg h 964,-289,RT-BAT-C,5,86400,2,1,3830,3795,3830,-10,25,25,25,0 >> 2019-09-06 22:21:57.344609 +0200 info main: #173 C MITPROHB rx msg h 964,-299,RT-BAT-C,5,86400,2,1,3830,3795,3830,-10,25,25,25,0 >> 2019-09-06 22:23:40.082406 +0200 info main: #31 C MITPROHB rx msg h 964,-1027,RT-BAT-C,5,86400,2,1,3830,3795,3830,-10,25,25,25,0 >> 2019-09-06 22:25:58.061883 +0200 info main: #31 C MITPROHB rx msg h 964,-1040,RT-BAT-C,5,86400,2,1,3830,3795,3830,-10,25,25,25,0 >> >> >> This shows the ticker was only run 299 times from 22:07:48 to 22:21:57. >> >> After 22:21:57 the workaround was triggered and did a reconnect. Apparently during that network reinitialization of 103 seconds, the per second ticker >> was run 628 times. >> >> That can't be catching up on the event queue, as that queue has only 20 slots. So something strange is going on here. >> >> Any ideas? >> >> Regards, >> Michael >> >> >> Am 06.09.19 um 08:04 schrieb Michael Balzer: >>> Mark & anyone else running a V2 server, >>> >>> as most cars don't send history records, this also needs the change to the server I just pushed, i.e. server version 2.4.2. >>> >>> https://github.com/openvehicles/Open-Vehicle-Monitoring-System/commits/maste... >>> <https://github.com/openvehicles/Open-Vehicle-Monitoring-System/commits/master> >>> >>> Regards, >>> Michael >>> >>> >>> Am 05.09.19 um 19:55 schrieb Michael Balzer: >>>> I've pushed the nasty workaround: the v2 server checks for no RX over 15 minutes, then restarts the network (wifi & modem) as configured for autostart. >>>> >>>> Rolled out on my server in edge as 3.2.002-237-ge075f655. >>>> >>>> Please test. >>>> >>>> Regards, >>>> Michael >>>> >>>> >>>> Am 05.09.19 um 01:58 schrieb Mark Webb-Johnson: >>>>>> Mark, you can check your server logs for history messages with ridiculous time offsets: >>>>>> [sddexter@ns27 server]$ cat log-20190903 | egrep "rx msg h [0-9]+,-[0-9]{4}" | wc -l >>>>>> 455283 >>>>> >>>>> I checked my logs and see 12 vehicles showing this. But, 2 only show this for a debugcrash log (which is expected, I guess, if the time is not >>>>> synced at report time). I’ve got 4 cars with the offset > 10,000. >>>>> >>>>> Regards, Mark. >>>>> >>>>>> On 4 Sep 2019, at 4:45 AM, Michael Balzer <dexter@expeedo.de <mailto:dexter@expeedo.de> <mailto:dexter@expeedo.de>> wrote: >>>>>> >>>>>> Everyone, >>>>>> >>>>>> I've pushed a change that needs some testing. >>>>>> >>>>>> I had the issue myself now parking at a certain distance from my garage wifi AP, i.e. on the edge of "in", after wifi had been disconnected for >>>>>> some hours, and with the module still connected via modem. The wifi blob had been trying to connect to the AP for about two hours. >>>>>> >>>>>> As seen before, the module saw no error, just the server responses and commands stopped coming in. I noticed the default interface was still "st1" >>>>>> despite wifi having been disconnected and modem connected. The DNS was also still configured for my wifi network, and the interface seemed to have >>>>>> an IP address -- but wasn't pingable from the wifi network. >>>>>> >>>>>> A power cycle of the modem solved the issue without reboot. So the cause may be in the modem/ppp subsystem, or it may be related (in some weird >>>>>> way) to the default interface / DNS setup. >>>>>> >>>>>> More tests showed the default interface again/still got set by the wifi blob itself at some point, overriding our modem prioritization. The events >>>>>> we didn't handle up to now were "sta.connected" and "sta.lostip", so I added these, and the bug didn't show up again since then. That doesn't mean >>>>>> anything, so we need to test this. >>>>>> >>>>>> The default interface really shouldn't affect inbound packet routing of an established connection, but there always may be strange bugs lurking in >>>>>> those libs. >>>>>> >>>>>> The change also reimplements the wifi signal strength reading, as the tests also showed that still wasn't working well using the CSI callback. It >>>>>> now seems to be much more reliable. >>>>>> >>>>>> Please test & report. The single module will be hard to test, as the bug isn't reproducable easily, but you can still try if wifi / modem >>>>>> transitions work well. >>>>>> >>>>>> Mark, you can check your server logs for history messages with ridiculous time offsets: >>>>>> [sddexter@ns27 server]$ cat log-20190903 | egrep "rx msg h [0-9]+,-[0-9]{4}" | wc -l >>>>>> 455283 >>>>>> The bug now severely affects the V2 server performance, as the server is single threaded and doesn't scale very well to this kind of bulk data >>>>>> bursts, especially when coming from multiple modules in parallel. So we really need to solve this now. Slow reactions or connection drops from my >>>>>> server lately have been due to this bug. If this change doesn't solve it, we'll need to add some reboot trigger on "too many server v2 notification >>>>>> retransmissions" -- or maybe a modem power cycle will do, that wouldn't discard the data. >>>>>> >>>>>> Thanks, >>>>>> Michael >>>>>> >>>>>> >>>>>> Am 03.09.19 um 07:46 schrieb Mark Webb-Johnson: >>>>>>> No problem. We can hold. I won’t commit anything for the next few days (and agree to hold-off on Markos’s pull). Let me know when you are ready. >>>>>>> >>>>>>> Regards, Mark. >>>>>>> >>>>>>>> On 3 Sep 2019, at 1:58 AM, Michael Balzer <dexter@expeedo.de <mailto:dexter@expeedo.de>> <mailto:dexter@expeedo.de> wrote: >>>>>>>> >>>>>>>> Mark, please wait. >>>>>>>> >>>>>>>> I may just have found the cause for issue #241, or at least something I need to investigate before releasing. >>>>>>>> >>>>>>>> I need to dig into my logs first, and try something. >>>>>>>> >>>>>>>> Regards, >>>>>>>> Michael >>>>>>>> >>>>>>>> >>>>>>>> Am 02.09.19 um 12:23 schrieb Michael Balzer: >>>>>>>>> Nothing open from my side at the moment. >>>>>>>>> >>>>>>>>> I haven't had the time to look in to Markos pull request, but from a first check also think that's going too deep to be included in this release. >>>>>>>>> >>>>>>>>> Regards, >>>>>>>>> Michael >>>>>>>>> >>>>>>>>> >>>>>>>>> Am 02.09.19 um 04:15 schrieb Mark Webb-Johnson: >>>>>>>>>> I think it is well past time for a 3.2.003 release. Things seems table in edge (although some things only partially implemented). >>>>>>>>>> >>>>>>>>>> Anything people want to include at the last minute, or can we go ahead and build? >>>>>>>>>> >>>>>>>>>> Regards, Mark. >>>>>>>>>>
-- Michael Balzer * Helkenberger Weg 9 * D-58256 Ennepetal Fon 02333 / 833 5735 * Handy 0176 / 206 989 26
_______________________________________________ OvmsDev mailing list OvmsDev@lists.openvehicles.com http://lists.openvehicles.com/mailman/listinfo/ovmsdev
-- Michael Balzer * Helkenberger Weg 9 * D-58256 Ennepetal Fon 02333 / 833 5735 * Handy 0176 / 206 989 26
No, the 32 bit limit indeed has an effect pretty soon. I had assumed they are "ticks", but they really are at the timer resolution (see DebugTasks records). Timer resolution is currently 1 MHz, so the counters will cycle over every 71.6 minutes. So if you don't enable the debug.tasks report, the fist manual report is likely to look strange. We can get a checkpoint every five minutes regardless of the report activation. Or we can add a measurement delay to the command. Regards, Michael Am 20.09.19 um 16:16 schrieb Michael Balzer:
The percentages are calculated from the time slice counter differences between two command invocations (or boot), but their 32 bit limit shouldn't have an effect that soon.
Also strange: your esp_timer SPIRAM allocation…
Is that a build with toolkit -98?
Regards, Michael
Am 20.09.19 um 03:29 schrieb Mark Webb-Johnson:
Strange. Connected to my car, and from ovms_shell asked for ‘module tasks’:
ovms> module tasks ... Vehicle Response: Number of Tasks = 17 Stack: Now Max Total Heap 32-bit SPIRAM C# PRI CPU% 3FFAFBF4 1 Blk esp_timer 400 656 4096 35944 6442122956 0 22 2% 3FFBDBBC 2 Blk eventTask 440 1928 4608 140 0 0 0 20 0% 3FFBFF00 3 Blk OVMS Events 444 3404 8192 70816 0 21092 1 5 9% 3FFC3300 4 Blk OVMS DukTape 460 9548 12288 188 0 31020 1 3 12% 3FFC4FF4 5 Blk OVMS CanRx 432 832 2048 3144 0 32072 0 23 120% 3FFC5D3C 6 Blk ipc0 392 504 1024 7804 0 0 0 24 2% 3FFC6340 7 Blk ipc1 396 444 1024 12 0 0 1 24 0% 3FFC8194 10 Rdy IDLE0 416 512 1024 0 0 0 0 0 362% 3FFC872C 11 Rdy IDLE1 408 504 1024 0 0 0 1 0 387% 3FFC94C4 12 Blk Tmr Svc 352 912 3072 88 0 0 0 20 1% 3FFC6794 17 Blk tiT 504 2536 3072 7668 0 0 * 18 6% 3FFCF3E0 18 Blk OVMS SIMCOM 460 2412 4096 40 0 3892 1 5 1% 3FFD0C10 19 Blk wifi 460 2716 3584 36356 0 2912 0 22 23% 3FFDBD70 20 Blk OVMS Vehicle 460 1308 6144 0 0 2336 1 10 95% 3FFDF0FC 21 Rdy OVMS Console 488 1736 6144 0 0 20 1 5 0% 3FFDF64C 22 Blk mdns 472 1576 4096 108 0 0 0 1 1% 3FFE38F0 35 Rdy OVMS NetMan 1384 2984 8192 144 25180 5004 1 5 3%
ovms> module tasks ... Vehicle Response: Number of Tasks = 17 Stack: Now Max Total Heap 32-bit SPIRAM C# PRI CPU% 3FFAFBF4 1 Blk esp_timer 400 656 4096 35944 6442122956 0 22 0% 3FFBDBBC 2 Blk eventTask 440 1928 4608 140 0 0 0 20 0% 3FFBFF00 3 Blk OVMS Events 444 3404 8192 70816 0 21092 1 5 0% 3FFC3300 4 Blk OVMS DukTape 460 9548 12288 188 0 23712 1 3 1% 3FFC4FF4 5 Blk OVMS CanRx 432 832 2048 3144 0 32072 0 23 4% 3FFC5D3C 6 Blk ipc0 392 504 1024 7804 0 0 0 24 0% 3FFC6340 7 Blk ipc1 396 444 1024 12 0 0 1 24 0% 3FFC8194 10 Rdy IDLE0 416 512 1024 0 0 0 0 0 96% 3FFC872C 11 Rdy IDLE1 408 504 1024 0 0 0 1 0 95% 3FFC94C4 12 Blk Tmr Svc 352 912 3072 88 0 0 0 20 0% 3FFC6794 17 Blk tiT 504 2536 3072 7668 0 0 * 18 0% 3FFCF3E0 18 Blk OVMS SIMCOM 668 2412 4096 40 0 3892 1 5 0% 3FFD0C10 19 Blk wifi 460 2716 3584 36356 0 2912 0 22 0% 3FFDBD70 20 Blk OVMS Vehicle 460 1308 6144 0 0 2336 1 10 3% 3FFDF0FC 21 Blk OVMS Console 552 1736 6144 0 0 20 1 5 0% 3FFDF64C 22 Blk mdns 472 1576 4096 108 0 0 0 1 0% 3FFE38F0 35 Rdy OVMS NetMan 1896 3240 8192 400 25180 5392 1 5 0%
The second one is what I normally see, but the first is bizarre. Any idea what the time frame for the CPU% is?
Regards, Mark
> On 8 Sep 2019, at 5:43 PM, Michael Balzer <dexter@expeedo.de <mailto:dexter@expeedo.de>> wrote: > > I've pushed some modifications and improvements to (hopefully) fix the timer issue or at least be able to debug it. > > Some sdkconfig changes are necessary. > > The build including these updates is on my edge release as 3.2.002-258-g20ae554b. > > Btw: the network restart strategy seems to mitigate issue #241; I've seen a major drop on record repetitions on my server since the rollout. > > > commit 99e4e48bdd40b7004c0976f51aba9e3da4ecab53 > > Module: add per task CPU usage statistics, add task stats history records > > To enable CPU usage statistics, apply the changes to sdkconfig > included. The CPU usage shown by the commands is calculated against > the last task status retrieved (or system boot). > > Command changes: > - "module tasks" -- added CPU (core) usage in percent per task > > New command: > - "module tasks data" -- output task stats in history record form > > New config: > - [module] debug.tasks -- yes (default) = send task stats every 5 minutes > > New history record: > - "*-OVM-DebugTasks" v1: <taskcnt,totaltime> + per task: > <tasknum,name,state,stack_now,stack_max,stack_total, > heap_total,heap_32bit,heap_spi,runtime> > Note: CPU core use percentage = runtime / totaltime > > commit 950172c216a72beb4da0bc7a40a46995a6105955 > > Build config: default timer service task priority raised to 20 > > Background: the FreeRTOS timer service shall only be used for very > short and non-blocking jobs. We delegate event processing to our > events task, anything else in timers needs to run with high > priority. > > commit 31ac19d187480046c16356b80668de45cacbb83d > > DukTape: add build config for task priority, default lowered to 3 > > Background: the DukTape garbage collector shall run on lower > priority than tasks like SIMCOM & events > > commit e0a44791fbcfb5a4e4cad24c9d1163b76e637b4f > > Server V2: use esp_log_timestamp for timeout detection, > add timeout config, limit data records & size per second > > New config: > - [server.v2] timeout.rx -- timeout in seconds, default 960 > > commit 684a4ce9525175a910040f0d1ca82ac212fbf5de > > Notify: use esp_log_timestamp for creation time instead of monotonictime > to harden against timer service starvation / ticker event drops > > > Regards, > Michael > > > Am 07.09.19 um 10:55 schrieb Michael Balzer: >> I think the RTOS timer service task starves. It's running on core 0 with priority 1. >> >> Taks on core 0 sorted by priority: >> >> Number of Tasks = 20 Stack: Now Max Total Heap 32-bit SPIRAM C# PRI >> 3FFC84A8 6 Blk ipc0 388 500 1024 7788 0 0 0 24 >> 3FFC77F0 5 Blk OVMS CanRx 428 428 2048 3052 0 31844 0 23 >> 3FFAFBF4 1 Blk esp_timer 400 656 4096 35928 644 25804 0 22 >> 3FFD3240 19 Blk wifi 460 2716 3584 43720 0 20 0 22 >> 3FFC03C4 2 Blk eventTask 448 1984 4608 104 0 0 0 20 >> 3FFC8F14 17 Blk tiT 500 2308 3072 6552 0 0 * 18 >> 3FFE14F0 26 Blk OVMS COrx 456 456 4096 0 0 0 0 7 >> 3FFE19D4 27 Blk OVMS COwrk 476 476 3072 0 0 0 0 7 >> 3FFCBC34 12 Blk Tmr Svc 352 928 3072 88 0 0 0 1 >> 3FFE7708 23 Blk mdns 468 1396 4096 108 0 0 0 1 >> >> I don't think it's our CanRx, as that only fetches and queues CAN frames, the actual work is done by the listeners. The CO tasks only run for CANopen >> jobs, which are few for normal operation. >> >> That leaves the system tasks, with main suspect -once again- the wifi blob. >> >> We need to know how much CPU time the tasks actually use now. I think I saw some option for this in the FreeRTOS config. >> >> Regards, >> Michael >> >> >> Am 06.09.19 um 23:15 schrieb Michael Balzer: >>> The workaround is based on the monotonictime being updated per second, as do the history record offsets. >>> >>> Apparently, that mechanism doesn't work reliably. That may be an indicator for some bigger underlying issue. >>> >>> Example log excerpt: >>> >>> 2019-09-06 22:07:48.126919 +0200 info main: #173 C MITPROHB rx msg h 964,0,RT-BAT-C,5,86400,2,1,3830,3795,3830,-10,25,25,25,0 >>> 2019-09-06 22:09:03.089031 +0200 info main: #173 C MITPROHB rx msg h 964,-10,RT-BAT-C,5,86400,2,1,3830,3795,3830,-10,25,25,25,0 >>> 2019-09-06 22:09:05.041574 +0200 info main: #173 C MITPROHB rx msg h 964,-20,RT-BAT-C,5,86400,2,1,3830,3795,3830,-10,25,25,25,0 >>> 2019-09-06 22:09:05.052644 +0200 info main: #173 C MITPROHB rx msg h 964,-30,RT-BAT-C,5,86400,2,1,3830,3795,3830,-10,25,25,25,0 >>> 2019-09-06 22:09:05.063617 +0200 info main: #173 C MITPROHB rx msg h 964,-49,RT-BAT-C,5,86400,2,1,3830,3795,3830,-10,25,25,25,0 >>> 2019-09-06 22:09:05.077527 +0200 info main: #173 C MITPROHB rx msg h 964,-59,RT-BAT-C,5,86400,2,1,3830,3795,3830,-10,25,25,25,0 >>> 2019-09-06 22:09:05.193775 +0200 info main: #173 C MITPROHB rx msg h 964,-70,RT-BAT-C,5,86400,2,1,3830,3795,3830,-10,25,25,25,0 >>> 2019-09-06 22:09:13.190645 +0200 info main: #173 C MITPROHB rx msg h 964,-80,RT-BAT-C,5,86400,2,1,3830,3795,3830,-10,25,25,25,0 >>> 2019-09-06 22:09:22.077994 +0200 info main: #173 C MITPROHB rx msg h 964,-90,RT-BAT-C,5,86400,2,1,3830,3795,3830,-10,25,25,25,0 >>> 2019-09-06 22:09:54.590300 +0200 info main: #173 C MITPROHB rx msg h 964,-109,RT-BAT-C,5,86400,2,1,3830,3795,3830,-10,25,25,25,0 >>> 2019-09-06 22:11:10.127054 +0200 info main: #173 C MITPROHB rx msg h 964,-119,RT-BAT-C,5,86400,2,1,3830,3795,3830,-10,25,25,25,0 >>> 2019-09-06 22:11:16.794200 +0200 info main: #173 C MITPROHB rx msg h 964,-130,RT-BAT-C,5,86400,2,1,3830,3795,3830,-10,25,25,25,0 >>> 2019-09-06 22:11:22.455652 +0200 info main: #173 C MITPROHB rx msg h 964,-140,RT-BAT-C,5,86400,2,1,3830,3795,3830,-10,25,25,25,0 >>> 2019-09-06 22:12:49.423412 +0200 info main: #173 C MITPROHB rx msg h 964,-150,RT-BAT-C,5,86400,2,1,3830,3795,3830,-10,25,25,25,0 >>> 2019-09-06 22:12:49.442096 +0200 info main: #173 C MITPROHB rx msg h 964,-169,RT-BAT-C,5,86400,2,1,3830,3795,3830,-10,25,25,25,0 >>> 2019-09-06 22:12:49.461941 +0200 info main: #173 C MITPROHB rx msg h 964,-179,RT-BAT-C,5,86400,2,1,3830,3795,3830,-10,25,25,25,0 >>> 2019-09-06 22:14:39.828133 +0200 info main: #173 C MITPROHB rx msg h 964,-190,RT-BAT-C,5,86400,2,1,3830,3795,3830,-10,25,25,25,0 >>> 2019-09-06 22:14:39.858144 +0200 info main: #173 C MITPROHB rx msg h 964,-200,RT-BAT-C,5,86400,2,1,3830,3795,3830,-10,25,25,25,0 >>> 2019-09-06 22:14:52.020319 +0200 info main: #173 C MITPROHB rx msg h 964,-210,RT-BAT-C,5,86400,2,1,3830,3795,3830,-10,25,25,25,0 >>> 2019-09-06 22:14:54.452637 +0200 info main: #173 C MITPROHB rx msg h 964,-229,RT-BAT-C,5,86400,2,1,3830,3795,3830,-10,25,25,25,0 >>> 2019-09-06 22:15:12.613935 +0200 info main: #173 C MITPROHB rx msg h 964,-239,RT-BAT-C,5,86400,2,1,3830,3795,3830,-10,25,25,25,0 >>> 2019-09-06 22:15:35.223845 +0200 info main: #173 C MITPROHB rx msg h 964,-250,RT-BAT-C,5,86400,2,1,3830,3795,3830,-10,25,25,25,0 >>> 2019-09-06 22:16:09.255059 +0200 info main: #173 C MITPROHB rx msg h 964,-260,RT-BAT-C,5,86400,2,1,3830,3795,3830,-10,25,25,25,0 >>> 2019-09-06 22:17:31.919754 +0200 info main: #173 C MITPROHB rx msg h 964,-270,RT-BAT-C,5,86400,2,1,3830,3795,3830,-10,25,25,25,0 >>> 2019-09-06 22:19:23.366267 +0200 info main: #173 C MITPROHB rx msg h 964,-289,RT-BAT-C,5,86400,2,1,3830,3795,3830,-10,25,25,25,0 >>> 2019-09-06 22:21:57.344609 +0200 info main: #173 C MITPROHB rx msg h 964,-299,RT-BAT-C,5,86400,2,1,3830,3795,3830,-10,25,25,25,0 >>> 2019-09-06 22:23:40.082406 +0200 info main: #31 C MITPROHB rx msg h 964,-1027,RT-BAT-C,5,86400,2,1,3830,3795,3830,-10,25,25,25,0 >>> 2019-09-06 22:25:58.061883 +0200 info main: #31 C MITPROHB rx msg h 964,-1040,RT-BAT-C,5,86400,2,1,3830,3795,3830,-10,25,25,25,0 >>> >>> >>> This shows the ticker was only run 299 times from 22:07:48 to 22:21:57. >>> >>> After 22:21:57 the workaround was triggered and did a reconnect. Apparently during that network reinitialization of 103 seconds, the per second ticker >>> was run 628 times. >>> >>> That can't be catching up on the event queue, as that queue has only 20 slots. So something strange is going on here. >>> >>> Any ideas? >>> >>> Regards, >>> Michael >>> >>> >>> Am 06.09.19 um 08:04 schrieb Michael Balzer: >>>> Mark & anyone else running a V2 server, >>>> >>>> as most cars don't send history records, this also needs the change to the server I just pushed, i.e. server version 2.4.2. >>>> >>>> https://github.com/openvehicles/Open-Vehicle-Monitoring-System/commits/maste... >>>> <https://github.com/openvehicles/Open-Vehicle-Monitoring-System/commits/master> >>>> >>>> Regards, >>>> Michael >>>> >>>> >>>> Am 05.09.19 um 19:55 schrieb Michael Balzer: >>>>> I've pushed the nasty workaround: the v2 server checks for no RX over 15 minutes, then restarts the network (wifi & modem) as configured for autostart. >>>>> >>>>> Rolled out on my server in edge as 3.2.002-237-ge075f655. >>>>> >>>>> Please test. >>>>> >>>>> Regards, >>>>> Michael >>>>> >>>>> >>>>> Am 05.09.19 um 01:58 schrieb Mark Webb-Johnson: >>>>>>> Mark, you can check your server logs for history messages with ridiculous time offsets: >>>>>>> [sddexter@ns27 server]$ cat log-20190903 | egrep "rx msg h [0-9]+,-[0-9]{4}" | wc -l >>>>>>> 455283 >>>>>> >>>>>> I checked my logs and see 12 vehicles showing this. But, 2 only show this for a debugcrash log (which is expected, I guess, if the time is not >>>>>> synced at report time). I’ve got 4 cars with the offset > 10,000. >>>>>> >>>>>> Regards, Mark. >>>>>> >>>>>>> On 4 Sep 2019, at 4:45 AM, Michael Balzer <dexter@expeedo.de <mailto:dexter@expeedo.de> <mailto:dexter@expeedo.de>> wrote: >>>>>>> >>>>>>> Everyone, >>>>>>> >>>>>>> I've pushed a change that needs some testing. >>>>>>> >>>>>>> I had the issue myself now parking at a certain distance from my garage wifi AP, i.e. on the edge of "in", after wifi had been disconnected for >>>>>>> some hours, and with the module still connected via modem. The wifi blob had been trying to connect to the AP for about two hours. >>>>>>> >>>>>>> As seen before, the module saw no error, just the server responses and commands stopped coming in. I noticed the default interface was still "st1" >>>>>>> despite wifi having been disconnected and modem connected. The DNS was also still configured for my wifi network, and the interface seemed to have >>>>>>> an IP address -- but wasn't pingable from the wifi network. >>>>>>> >>>>>>> A power cycle of the modem solved the issue without reboot. So the cause may be in the modem/ppp subsystem, or it may be related (in some weird >>>>>>> way) to the default interface / DNS setup. >>>>>>> >>>>>>> More tests showed the default interface again/still got set by the wifi blob itself at some point, overriding our modem prioritization. The events >>>>>>> we didn't handle up to now were "sta.connected" and "sta.lostip", so I added these, and the bug didn't show up again since then. That doesn't mean >>>>>>> anything, so we need to test this. >>>>>>> >>>>>>> The default interface really shouldn't affect inbound packet routing of an established connection, but there always may be strange bugs lurking in >>>>>>> those libs. >>>>>>> >>>>>>> The change also reimplements the wifi signal strength reading, as the tests also showed that still wasn't working well using the CSI callback. It >>>>>>> now seems to be much more reliable. >>>>>>> >>>>>>> Please test & report. The single module will be hard to test, as the bug isn't reproducable easily, but you can still try if wifi / modem >>>>>>> transitions work well. >>>>>>> >>>>>>> Mark, you can check your server logs for history messages with ridiculous time offsets: >>>>>>> [sddexter@ns27 server]$ cat log-20190903 | egrep "rx msg h [0-9]+,-[0-9]{4}" | wc -l >>>>>>> 455283 >>>>>>> The bug now severely affects the V2 server performance, as the server is single threaded and doesn't scale very well to this kind of bulk data >>>>>>> bursts, especially when coming from multiple modules in parallel. So we really need to solve this now. Slow reactions or connection drops from my >>>>>>> server lately have been due to this bug. If this change doesn't solve it, we'll need to add some reboot trigger on "too many server v2 >>>>>>> notification retransmissions" -- or maybe a modem power cycle will do, that wouldn't discard the data. >>>>>>> >>>>>>> Thanks, >>>>>>> Michael >>>>>>> >>>>>>> >>>>>>> Am 03.09.19 um 07:46 schrieb Mark Webb-Johnson: >>>>>>>> No problem. We can hold. I won’t commit anything for the next few days (and agree to hold-off on Markos’s pull). Let me know when you are ready. >>>>>>>> >>>>>>>> Regards, Mark. >>>>>>>> >>>>>>>>> On 3 Sep 2019, at 1:58 AM, Michael Balzer <dexter@expeedo.de <mailto:dexter@expeedo.de>> <mailto:dexter@expeedo.de> wrote: >>>>>>>>> >>>>>>>>> Mark, please wait. >>>>>>>>> >>>>>>>>> I may just have found the cause for issue #241, or at least something I need to investigate before releasing. >>>>>>>>> >>>>>>>>> I need to dig into my logs first, and try something. >>>>>>>>> >>>>>>>>> Regards, >>>>>>>>> Michael >>>>>>>>> >>>>>>>>> >>>>>>>>> Am 02.09.19 um 12:23 schrieb Michael Balzer: >>>>>>>>>> Nothing open from my side at the moment. >>>>>>>>>> >>>>>>>>>> I haven't had the time to look in to Markos pull request, but from a first check also think that's going too deep to be included in this release. >>>>>>>>>> >>>>>>>>>> Regards, >>>>>>>>>> Michael >>>>>>>>>> >>>>>>>>>> >>>>>>>>>> Am 02.09.19 um 04:15 schrieb Mark Webb-Johnson: >>>>>>>>>>> I think it is well past time for a 3.2.003 release. Things seems table in edge (although some things only partially implemented). >>>>>>>>>>> >>>>>>>>>>> Anything people want to include at the last minute, or can we go ahead and build? >>>>>>>>>>> >>>>>>>>>>> Regards, Mark. >>>>>>>>>>>
-- Michael Balzer * Helkenberger Weg 9 * D-58256 Ennepetal Fon 02333 / 833 5735 * Handy 0176 / 206 989 26
_______________________________________________ OvmsDev mailing list OvmsDev@lists.openvehicles.com http://lists.openvehicles.com/mailman/listinfo/ovmsdev
-- Michael Balzer * Helkenberger Weg 9 * D-58256 Ennepetal Fon 02333 / 833 5735 * Handy 0176 / 206 989 26
_______________________________________________ OvmsDev mailing list OvmsDev@lists.openvehicles.com http://lists.openvehicles.com/mailman/listinfo/ovmsdev
-- Michael Balzer * Helkenberger Weg 9 * D-58256 Ennepetal Fon 02333 / 833 5735 * Handy 0176 / 206 989 26
tldr; Perhaps we should be using esp_timer and esp_timer_get_time() to update monotonic time then dispatch the ticker.* events? Long story: Trying to see how monotonic time could not be updating... I never really worked out how this operates in ESP32 IDF freertos. We have three tasks involved in timers: esp_timer Tmr Svc eventTask From my understanding, Tmr Svc provides high level timer support for freertos (xTimerCreate, etc). And esp_timer provides esp32 specific timer support (https://docs.espressif.com/projects/esp-idf/en/latest/api-reference/system/e... <https://docs.espressif.com/projects/esp-idf/en/latest/api-reference/system/esp_timer.html>). We use Tmr Svc, and note the warnings provided in the espressif documentation: Maximum resolution is equal to RTOS tick period Timer callbacks are dispatched from a low-priority task Currently, our housekeeping uses xTimerCreate to create a 1 second timer (calling HousekeepingTicker1). So, in which task is HousekeepingTicker1() called (esp_timer or Tmr Svc) - I always suspected the latter (but never checked). Then HousekeepingTicker1() raises a signal (using ovms events) that pushes it onto a queue (if the queue is full, it discards). The eventTask will then read that queue, and dispatch it to our ticker.1 listeners. HousekeepingTicker1 is responsible for updating monotonictime, and given it’s simple calling of MyEvents.SignalEvent (which just queues it and discards on overflow), I don’t think that can block for any substantial time. I did a search for xTimerCreate in our code base, and find these used: components/ovms_webserver/src/ovms_webserver.cpp m_update_ticker = xTimerCreate("Web client update ticker", 250 / portTICK_PERIOD_MS, pdTRUE, NULL, UpdateTicker); This seems to do quite a bit. In particular queue handling and semaphores. All seem to be non-blocking, but the flow is non-trivial. components/vehicle_nissanleaf/src/vehicle_nissanleaf.cpp m_remoteCommandTimer = xTimerCreate("Nissan Leaf Remote Command", 100 / portTICK_PERIOD_MS, pdTRUE, this, remoteCommandTimer); m_ccDisableTimer = xTimerCreate("Nissan Leaf CC Disable", 1000 / portTICK_PERIOD_MS, pdFALSE, this, ccDisableTimer); Seem ok, and non-blocking. components/vehicle_renaulttwizy/src/rt_sevcon.cpp m_kickdown_timer = xTimerCreate("RT kickdown", pdMS_TO_TICKS(100), pdTRUE, NULL, KickdownTimer); Seems ok. components/vehicle_smarted/src/vehicle_smarted.cpp m_locking_timer = xTimerCreate("Smart ED Locking Timer", 500 / portTICK_PERIOD_MS, pdTRUE, this, SmartEDLockingTimer); This code looks a bit dodgy because CommandLock and CommandUnlock both create this timer, and start it - but neither check if it is already created. That said, after it fires the timer is deleted by the handler. components/vehicle_teslaroadster/src/vehicle_teslaroadster.cpp m_speedo_timer = xTimerCreate("TR ticker", m_homelink_timer = xTimerCreate("Tesla Roadster Homelink Timer", durationms / portTICK_PERIOD_MS, pdTRUE, this, TeslaRoadsterHomelinkTimer); Similar lack of checking for duplicate timers. But I don’t see any blocking. So, I don’t really think _we_ are starving the TmrSvc. Most likely something in the core framework. Regards, Mark.
On 7 Sep 2019, at 4:55 PM, Michael Balzer <dexter@expeedo.de> wrote:
I think the RTOS timer service task starves. It's running on core 0 with priority 1.
Taks on core 0 sorted by priority:
Number of Tasks = 20 Stack: Now Max Total Heap 32-bit SPIRAM C# PRI 3FFC84A8 6 Blk ipc0 388 500 1024 7788 0 0 0 24 3FFC77F0 5 Blk OVMS CanRx 428 428 2048 3052 0 31844 0 23 3FFAFBF4 1 Blk esp_timer 400 656 4096 35928 644 25804 0 22 3FFD3240 19 Blk wifi 460 2716 3584 43720 0 20 0 22 3FFC03C4 2 Blk eventTask 448 1984 4608 104 0 0 0 20 3FFC8F14 17 Blk tiT 500 2308 3072 6552 0 0 * 18 3FFE14F0 26 Blk OVMS COrx 456 456 4096 0 0 0 0 7 3FFE19D4 27 Blk OVMS COwrk 476 476 3072 0 0 0 0 7 3FFCBC34 12 Blk Tmr Svc 352 928 3072 88 0 0 0 1 3FFE7708 23 Blk mdns 468 1396 4096 108 0 0 0 1
I don't think it's our CanRx, as that only fetches and queues CAN frames, the actual work is done by the listeners. The CO tasks only run for CANopen jobs, which are few for normal operation.
That leaves the system tasks, with main suspect -once again- the wifi blob.
We need to know how much CPU time the tasks actually use now. I think I saw some option for this in the FreeRTOS config.
Regards, Michael
Am 06.09.19 um 23:15 schrieb Michael Balzer:
The workaround is based on the monotonictime being updated per second, as do the history record offsets.
Apparently, that mechanism doesn't work reliably. That may be an indicator for some bigger underlying issue.
Example log excerpt:
2019-09-06 22:07:48.126919 +0200 info main: #173 C MITPROHB rx msg h 964,0,RT-BAT-C,5,86400,2,1,3830,3795,3830,-10,25,25,25,0 2019-09-06 22:09:03.089031 +0200 info main: #173 C MITPROHB rx msg h 964,-10,RT-BAT-C,5,86400,2,1,3830,3795,3830,-10,25,25,25,0 2019-09-06 22:09:05.041574 +0200 info main: #173 C MITPROHB rx msg h 964,-20,RT-BAT-C,5,86400,2,1,3830,3795,3830,-10,25,25,25,0 2019-09-06 22:09:05.052644 +0200 info main: #173 C MITPROHB rx msg h 964,-30,RT-BAT-C,5,86400,2,1,3830,3795,3830,-10,25,25,25,0 2019-09-06 22:09:05.063617 +0200 info main: #173 C MITPROHB rx msg h 964,-49,RT-BAT-C,5,86400,2,1,3830,3795,3830,-10,25,25,25,0 2019-09-06 22:09:05.077527 +0200 info main: #173 C MITPROHB rx msg h 964,-59,RT-BAT-C,5,86400,2,1,3830,3795,3830,-10,25,25,25,0 2019-09-06 22:09:05.193775 +0200 info main: #173 C MITPROHB rx msg h 964,-70,RT-BAT-C,5,86400,2,1,3830,3795,3830,-10,25,25,25,0 2019-09-06 22:09:13.190645 +0200 info main: #173 C MITPROHB rx msg h 964,-80,RT-BAT-C,5,86400,2,1,3830,3795,3830,-10,25,25,25,0 2019-09-06 22:09:22.077994 +0200 info main: #173 C MITPROHB rx msg h 964,-90,RT-BAT-C,5,86400,2,1,3830,3795,3830,-10,25,25,25,0 2019-09-06 22:09:54.590300 +0200 info main: #173 C MITPROHB rx msg h 964,-109,RT-BAT-C,5,86400,2,1,3830,3795,3830,-10,25,25,25,0 2019-09-06 22:11:10.127054 +0200 info main: #173 C MITPROHB rx msg h 964,-119,RT-BAT-C,5,86400,2,1,3830,3795,3830,-10,25,25,25,0 2019-09-06 22:11:16.794200 +0200 info main: #173 C MITPROHB rx msg h 964,-130,RT-BAT-C,5,86400,2,1,3830,3795,3830,-10,25,25,25,0 2019-09-06 22:11:22.455652 +0200 info main: #173 C MITPROHB rx msg h 964,-140,RT-BAT-C,5,86400,2,1,3830,3795,3830,-10,25,25,25,0 2019-09-06 22:12:49.423412 +0200 info main: #173 C MITPROHB rx msg h 964,-150,RT-BAT-C,5,86400,2,1,3830,3795,3830,-10,25,25,25,0 2019-09-06 22:12:49.442096 +0200 info main: #173 C MITPROHB rx msg h 964,-169,RT-BAT-C,5,86400,2,1,3830,3795,3830,-10,25,25,25,0 2019-09-06 22:12:49.461941 +0200 info main: #173 C MITPROHB rx msg h 964,-179,RT-BAT-C,5,86400,2,1,3830,3795,3830,-10,25,25,25,0 2019-09-06 22:14:39.828133 +0200 info main: #173 C MITPROHB rx msg h 964,-190,RT-BAT-C,5,86400,2,1,3830,3795,3830,-10,25,25,25,0 2019-09-06 22:14:39.858144 +0200 info main: #173 C MITPROHB rx msg h 964,-200,RT-BAT-C,5,86400,2,1,3830,3795,3830,-10,25,25,25,0 2019-09-06 22:14:52.020319 +0200 info main: #173 C MITPROHB rx msg h 964,-210,RT-BAT-C,5,86400,2,1,3830,3795,3830,-10,25,25,25,0 2019-09-06 22:14:54.452637 +0200 info main: #173 C MITPROHB rx msg h 964,-229,RT-BAT-C,5,86400,2,1,3830,3795,3830,-10,25,25,25,0 2019-09-06 22:15:12.613935 +0200 info main: #173 C MITPROHB rx msg h 964,-239,RT-BAT-C,5,86400,2,1,3830,3795,3830,-10,25,25,25,0 2019-09-06 22:15:35.223845 +0200 info main: #173 C MITPROHB rx msg h 964,-250,RT-BAT-C,5,86400,2,1,3830,3795,3830,-10,25,25,25,0 2019-09-06 22:16:09.255059 +0200 info main: #173 C MITPROHB rx msg h 964,-260,RT-BAT-C,5,86400,2,1,3830,3795,3830,-10,25,25,25,0 2019-09-06 22:17:31.919754 +0200 info main: #173 C MITPROHB rx msg h 964,-270,RT-BAT-C,5,86400,2,1,3830,3795,3830,-10,25,25,25,0 2019-09-06 22:19:23.366267 +0200 info main: #173 C MITPROHB rx msg h 964,-289,RT-BAT-C,5,86400,2,1,3830,3795,3830,-10,25,25,25,0 2019-09-06 22:21:57.344609 +0200 info main: #173 C MITPROHB rx msg h 964,-299,RT-BAT-C,5,86400,2,1,3830,3795,3830,-10,25,25,25,0 2019-09-06 22:23:40.082406 +0200 info main: #31 C MITPROHB rx msg h 964,-1027,RT-BAT-C,5,86400,2,1,3830,3795,3830,-10,25,25,25,0 2019-09-06 22:25:58.061883 +0200 info main: #31 C MITPROHB rx msg h 964,-1040,RT-BAT-C,5,86400,2,1,3830,3795,3830,-10,25,25,25,0
This shows the ticker was only run 299 times from 22:07:48 to 22:21:57.
After 22:21:57 the workaround was triggered and did a reconnect. Apparently during that network reinitialization of 103 seconds, the per second ticker was run 628 times.
That can't be catching up on the event queue, as that queue has only 20 slots. So something strange is going on here.
Any ideas?
Regards, Michael
Am 06.09.19 um 08:04 schrieb Michael Balzer:
Mark & anyone else running a V2 server,
as most cars don't send history records, this also needs the change to the server I just pushed, i.e. server version 2.4.2.
https://github.com/openvehicles/Open-Vehicle-Monitoring-System/commits/maste... <https://github.com/openvehicles/Open-Vehicle-Monitoring-System/commits/master>
Regards, Michael
Am 05.09.19 um 19:55 schrieb Michael Balzer:
I've pushed the nasty workaround: the v2 server checks for no RX over 15 minutes, then restarts the network (wifi & modem) as configured for autostart.
Rolled out on my server in edge as 3.2.002-237-ge075f655.
Please test.
Regards, Michael
Am 05.09.19 um 01:58 schrieb Mark Webb-Johnson:
Mark, you can check your server logs for history messages with ridiculous time offsets: [sddexter@ns27 server]$ cat log-20190903 | egrep "rx msg h [0-9]+,-[0-9]{4}" | wc -l 455283
I checked my logs and see 12 vehicles showing this. But, 2 only show this for a debugcrash log (which is expected, I guess, if the time is not synced at report time). I’ve got 4 cars with the offset > 10,000.
Regards, Mark.
On 4 Sep 2019, at 4:45 AM, Michael Balzer <dexter@expeedo.de <mailto:dexter@expeedo.de>> wrote:
Everyone,
I've pushed a change that needs some testing.
I had the issue myself now parking at a certain distance from my garage wifi AP, i.e. on the edge of "in", after wifi had been disconnected for some hours, and with the module still connected via modem. The wifi blob had been trying to connect to the AP for about two hours.
As seen before, the module saw no error, just the server responses and commands stopped coming in. I noticed the default interface was still "st1" despite wifi having been disconnected and modem connected. The DNS was also still configured for my wifi network, and the interface seemed to have an IP address -- but wasn't pingable from the wifi network.
A power cycle of the modem solved the issue without reboot. So the cause may be in the modem/ppp subsystem, or it may be related (in some weird way) to the default interface / DNS setup.
More tests showed the default interface again/still got set by the wifi blob itself at some point, overriding our modem prioritization. The events we didn't handle up to now were "sta.connected" and "sta.lostip", so I added these, and the bug didn't show up again since then. That doesn't mean anything, so we need to test this.
The default interface really shouldn't affect inbound packet routing of an established connection, but there always may be strange bugs lurking in those libs.
The change also reimplements the wifi signal strength reading, as the tests also showed that still wasn't working well using the CSI callback. It now seems to be much more reliable.
Please test & report. The single module will be hard to test, as the bug isn't reproducable easily, but you can still try if wifi / modem transitions work well.
Mark, you can check your server logs for history messages with ridiculous time offsets: [sddexter@ns27 server]$ cat log-20190903 | egrep "rx msg h [0-9]+,-[0-9]{4}" | wc -l 455283 The bug now severely affects the V2 server performance, as the server is single threaded and doesn't scale very well to this kind of bulk data bursts, especially when coming from multiple modules in parallel. So we really need to solve this now. Slow reactions or connection drops from my server lately have been due to this bug. If this change doesn't solve it, we'll need to add some reboot trigger on "too many server v2 notification retransmissions" -- or maybe a modem power cycle will do, that wouldn't discard the data.
Thanks, Michael
Am 03.09.19 um 07:46 schrieb Mark Webb-Johnson: > No problem. We can hold. I won’t commit anything for the next few days (and agree to hold-off on Markos’s pull). Let me know when you are ready. > > Regards, Mark. > >> On 3 Sep 2019, at 1:58 AM, Michael Balzer <dexter@expeedo.de> <mailto:dexter@expeedo.de> wrote: >> >> Mark, please wait. >> >> I may just have found the cause for issue #241, or at least something I need to investigate before releasing. >> >> I need to dig into my logs first, and try something. >> >> Regards, >> Michael >> >> >> Am 02.09.19 um 12:23 schrieb Michael Balzer: >>> Nothing open from my side at the moment. >>> >>> I haven't had the time to look in to Markos pull request, but from a first check also think that's going too deep to be included in this release. >>> >>> Regards, >>> Michael >>> >>> >>> Am 02.09.19 um 04:15 schrieb Mark Webb-Johnson: >>>> I think it is well past time for a 3.2.003 release. Things seems table in edge (although some things only partially implemented). >>>> >>>> Anything people want to include at the last minute, or can we go ahead and build? >>>> >>>> Regards, Mark. >>>> >>>> _______________________________________________ >>>> OvmsDev mailing list >>>> OvmsDev@lists.openvehicles.com <mailto:OvmsDev@lists.openvehicles.com> >>>> http://lists.openvehicles.com/mailman/listinfo/ovmsdev <http://lists.openvehicles.com/mailman/listinfo/ovmsdev> >> -- >> Michael Balzer * Helkenberger Weg 9 * D-58256 Ennepetal >> Fon 02333 / 833 5735 * Handy 0176 / 206 989 26 >> >> _______________________________________________ >> OvmsDev mailing list >> OvmsDev@lists.openvehicles.com <mailto:OvmsDev@lists.openvehicles.com> >> http://lists.openvehicles.com/mailman/listinfo/ovmsdev <http://lists.openvehicles.com/mailman/listinfo/ovmsdev> > _______________________________________________ > OvmsDev mailing list > OvmsDev@lists.openvehicles.com <mailto:OvmsDev@lists.openvehicles.com> > http://lists.openvehicles.com/mailman/listinfo/ovmsdev <http://lists.openvehicles.com/mailman/listinfo/ovmsdev>
-- Michael Balzer * Helkenberger Weg 9 * D-58256 Ennepetal Fon 02333 / 833 5735 * Handy 0176 / 206 989 26 _______________________________________________ OvmsDev mailing list OvmsDev@lists.openvehicles.com <mailto:OvmsDev@lists.openvehicles.com> http://lists.openvehicles.com/mailman/listinfo/ovmsdev <http://lists.openvehicles.com/mailman/listinfo/ovmsdev>
_______________________________________________ OvmsDev mailing list OvmsDev@lists.openvehicles.com <mailto:OvmsDev@lists.openvehicles.com> http://lists.openvehicles.com/mailman/listinfo/ovmsdev <http://lists.openvehicles.com/mailman/listinfo/ovmsdev>
-- Michael Balzer * Helkenberger Weg 9 * D-58256 Ennepetal Fon 02333 / 833 5735 * Handy 0176 / 206 989 26
_______________________________________________ OvmsDev mailing list OvmsDev@lists.openvehicles.com <mailto:OvmsDev@lists.openvehicles.com> http://lists.openvehicles.com/mailman/listinfo/ovmsdev <http://lists.openvehicles.com/mailman/listinfo/ovmsdev>
-- Michael Balzer * Helkenberger Weg 9 * D-58256 Ennepetal Fon 02333 / 833 5735 * Handy 0176 / 206 989 26 _______________________________________________ OvmsDev mailing list OvmsDev@lists.openvehicles.com http://lists.openvehicles.com/mailman/listinfo/ovmsdev
Mark, I did the same checks as you and came to the same conclusion. For the webserver timer, that looks non-trivial but really only pushes requests into the job queue and takes care to never block. A bit of a potential issue there is it does some logging in case of trouble (job queue full), and that may be bad if logging to an SD file is enabled. We still need to rework the file logging to use a separate task as well (issue #107). From my task data today, here are some first impressions on our normal CPU load: a) Idle tasks: b) Active tasks: 10:00 - 10:30 was a drive from home (wifi) to office (no wifi), then another drive 13:00 - 13:30 and back home 14:00 - 14:15. Driving load on the NetMan is caused by the web dashboard. The half hour peaks are from the 12V topping from the main battery the Twizy does when parked. So that's nowhere near "too much" in terms of CPU load -- normally. I'm waiting to catch the issue situation with this instrumentation. Regards, Michael Am 09.09.19 um 05:43 schrieb Mark Webb-Johnson:
tldr; Perhaps we should be using esp_timer and esp_timer_get_time() to update monotonic time then dispatch the ticker.* events?
Long story: Trying to see how monotonic time could not be updating...
I never really worked out how this operates in ESP32 IDF freertos. We have three tasks involved in timers:
* esp_timer * Tmr Svc * eventTask
From my understanding, Tmr Svc provides high level timer support for freertos (xTimerCreate, etc). And esp_timer provides esp32 specific timer support (https://docs.espressif.com/projects/esp-idf/en/latest/api-reference/system/e...). We use Tmr Svc, and note the warnings provided in the espressif documentation:
* Maximum resolution is equal to RTOS tick period * Timer callbacks are dispatched from a low-priority task
Currently, our housekeeping uses xTimerCreate to create a 1 second timer (calling HousekeepingTicker1). So, in which task is HousekeepingTicker1() called (esp_timer or Tmr Svc) - I always suspected the latter (but never checked). Then HousekeepingTicker1() raises a signal (using ovms events) that pushes it onto a queue (if the queue is full, it discards). The eventTask will then read that queue, and dispatch it to our ticker.1 listeners.
HousekeepingTicker1 is responsible for updating monotonictime, and given it’s simple calling of MyEvents.SignalEvent (which just queues it and discards on overflow), I don’t think that can block for any substantial time.
I did a search for xTimerCreate in our code base, and find these used:
* components/ovms_webserver/src/ovms_webserver.cpp m_update_ticker = xTimerCreate("Web client update ticker", 250 / portTICK_PERIOD_MS, pdTRUE, NULL, UpdateTicker);
This seems to do quite a bit. In particular queue handling and semaphores. All seem to be non-blocking, but the flow is non-trivial.
* components/vehicle_nissanleaf/src/vehicle_nissanleaf.cpp m_remoteCommandTimer = xTimerCreate("Nissan Leaf Remote Command", 100 / portTICK_PERIOD_MS, pdTRUE, this, remoteCommandTimer); m_ccDisableTimer = xTimerCreate("Nissan Leaf CC Disable", 1000 / portTICK_PERIOD_MS, pdFALSE, this, ccDisableTimer);
Seem ok, and non-blocking.
* components/vehicle_renaulttwizy/src/rt_sevcon.cpp m_kickdown_timer = xTimerCreate("RT kickdown", pdMS_TO_TICKS(100), pdTRUE, NULL, KickdownTimer);
Seems ok.
* components/vehicle_smarted/src/vehicle_smarted.cpp m_locking_timer = xTimerCreate("Smart ED Locking Timer", 500 / portTICK_PERIOD_MS, pdTRUE, this, SmartEDLockingTimer);
This code looks a bit dodgy because CommandLock and CommandUnlock both create this timer, and start it - but neither check if it is already created. That said, after it fires the timer is deleted by the handler.
* components/vehicle_teslaroadster/src/vehicle_teslaroadster.cpp m_speedo_timer = xTimerCreate("TR ticker", m_homelink_timer = xTimerCreate("Tesla Roadster Homelink Timer", durationms / portTICK_PERIOD_MS, pdTRUE, this, TeslaRoadsterHomelinkTimer);
Similar lack of checking for duplicate timers. But I don’t see any blocking.
So, I don’t really think _we_ are starving the TmrSvc. Most likely something in the core framework.
Regards, Mark.
On 7 Sep 2019, at 4:55 PM, Michael Balzer <dexter@expeedo.de <mailto:dexter@expeedo.de>> wrote:
I think the RTOS timer service task starves. It's running on core 0 with priority 1.
Taks on core 0 sorted by priority:
Number of Tasks = 20 Stack: Now Max Total Heap 32-bit SPIRAM C# PRI 3FFC84A8 6 Blk ipc0 388 500 1024 7788 0 0 0 24 3FFC77F0 5 Blk OVMS CanRx 428 428 2048 3052 0 31844 0 23 3FFAFBF4 1 Blk esp_timer 400 656 4096 35928 644 25804 0 22 3FFD3240 19 Blk wifi 460 2716 3584 43720 0 20 0 22 3FFC03C4 2 Blk eventTask 448 1984 4608 104 0 0 0 20 3FFC8F14 17 Blk tiT 500 2308 3072 6552 0 0 * 18 3FFE14F0 26 Blk OVMS COrx 456 456 4096 0 0 0 0 7 3FFE19D4 27 Blk OVMS COwrk 476 476 3072 0 0 0 0 7 3FFCBC34 12 Blk Tmr Svc 352 928 3072 88 0 0 0 1 3FFE7708 23 Blk mdns 468 1396 4096 108 0 0 0 1
I don't think it's our CanRx, as that only fetches and queues CAN frames, the actual work is done by the listeners. The CO tasks only run for CANopen jobs, which are few for normal operation.
That leaves the system tasks, with main suspect -once again- the wifi blob.
We need to know how much CPU time the tasks actually use now. I think I saw some option for this in the FreeRTOS config.
Regards, Michael
Am 06.09.19 um 23:15 schrieb Michael Balzer:
The workaround is based on the monotonictime being updated per second, as do the history record offsets.
Apparently, that mechanism doesn't work reliably. That may be an indicator for some bigger underlying issue.
Example log excerpt:
2019-09-06 22:07:48.126919 +0200 info main: #173 C MITPROHB rx msg h 964,0,RT-BAT-C,5,86400,2,1,3830,3795,3830,-10,25,25,25,0 2019-09-06 22:09:03.089031 +0200 info main: #173 C MITPROHB rx msg h 964,-10,RT-BAT-C,5,86400,2,1,3830,3795,3830,-10,25,25,25,0 2019-09-06 22:09:05.041574 +0200 info main: #173 C MITPROHB rx msg h 964,-20,RT-BAT-C,5,86400,2,1,3830,3795,3830,-10,25,25,25,0 2019-09-06 22:09:05.052644 +0200 info main: #173 C MITPROHB rx msg h 964,-30,RT-BAT-C,5,86400,2,1,3830,3795,3830,-10,25,25,25,0 2019-09-06 22:09:05.063617 +0200 info main: #173 C MITPROHB rx msg h 964,-49,RT-BAT-C,5,86400,2,1,3830,3795,3830,-10,25,25,25,0 2019-09-06 22:09:05.077527 +0200 info main: #173 C MITPROHB rx msg h 964,-59,RT-BAT-C,5,86400,2,1,3830,3795,3830,-10,25,25,25,0 2019-09-06 22:09:05.193775 +0200 info main: #173 C MITPROHB rx msg h 964,-70,RT-BAT-C,5,86400,2,1,3830,3795,3830,-10,25,25,25,0 2019-09-06 22:09:13.190645 +0200 info main: #173 C MITPROHB rx msg h 964,-80,RT-BAT-C,5,86400,2,1,3830,3795,3830,-10,25,25,25,0 2019-09-06 22:09:22.077994 +0200 info main: #173 C MITPROHB rx msg h 964,-90,RT-BAT-C,5,86400,2,1,3830,3795,3830,-10,25,25,25,0 2019-09-06 22:09:54.590300 +0200 info main: #173 C MITPROHB rx msg h 964,-109,RT-BAT-C,5,86400,2,1,3830,3795,3830,-10,25,25,25,0 2019-09-06 22:11:10.127054 +0200 info main: #173 C MITPROHB rx msg h 964,-119,RT-BAT-C,5,86400,2,1,3830,3795,3830,-10,25,25,25,0 2019-09-06 22:11:16.794200 +0200 info main: #173 C MITPROHB rx msg h 964,-130,RT-BAT-C,5,86400,2,1,3830,3795,3830,-10,25,25,25,0 2019-09-06 22:11:22.455652 +0200 info main: #173 C MITPROHB rx msg h 964,-140,RT-BAT-C,5,86400,2,1,3830,3795,3830,-10,25,25,25,0 2019-09-06 22:12:49.423412 +0200 info main: #173 C MITPROHB rx msg h 964,-150,RT-BAT-C,5,86400,2,1,3830,3795,3830,-10,25,25,25,0 2019-09-06 22:12:49.442096 +0200 info main: #173 C MITPROHB rx msg h 964,-169,RT-BAT-C,5,86400,2,1,3830,3795,3830,-10,25,25,25,0 2019-09-06 22:12:49.461941 +0200 info main: #173 C MITPROHB rx msg h 964,-179,RT-BAT-C,5,86400,2,1,3830,3795,3830,-10,25,25,25,0 2019-09-06 22:14:39.828133 +0200 info main: #173 C MITPROHB rx msg h 964,-190,RT-BAT-C,5,86400,2,1,3830,3795,3830,-10,25,25,25,0 2019-09-06 22:14:39.858144 +0200 info main: #173 C MITPROHB rx msg h 964,-200,RT-BAT-C,5,86400,2,1,3830,3795,3830,-10,25,25,25,0 2019-09-06 22:14:52.020319 +0200 info main: #173 C MITPROHB rx msg h 964,-210,RT-BAT-C,5,86400,2,1,3830,3795,3830,-10,25,25,25,0 2019-09-06 22:14:54.452637 +0200 info main: #173 C MITPROHB rx msg h 964,-229,RT-BAT-C,5,86400,2,1,3830,3795,3830,-10,25,25,25,0 2019-09-06 22:15:12.613935 +0200 info main: #173 C MITPROHB rx msg h 964,-239,RT-BAT-C,5,86400,2,1,3830,3795,3830,-10,25,25,25,0 2019-09-06 22:15:35.223845 +0200 info main: #173 C MITPROHB rx msg h 964,-250,RT-BAT-C,5,86400,2,1,3830,3795,3830,-10,25,25,25,0 2019-09-06 22:16:09.255059 +0200 info main: #173 C MITPROHB rx msg h 964,-260,RT-BAT-C,5,86400,2,1,3830,3795,3830,-10,25,25,25,0 2019-09-06 22:17:31.919754 +0200 info main: #173 C MITPROHB rx msg h 964,-270,RT-BAT-C,5,86400,2,1,3830,3795,3830,-10,25,25,25,0 2019-09-06 22:19:23.366267 +0200 info main: #173 C MITPROHB rx msg h 964,-289,RT-BAT-C,5,86400,2,1,3830,3795,3830,-10,25,25,25,0 2019-09-06 22:21:57.344609 +0200 info main: #173 C MITPROHB rx msg h 964,-299,RT-BAT-C,5,86400,2,1,3830,3795,3830,-10,25,25,25,0 2019-09-06 22:23:40.082406 +0200 info main: #31 C MITPROHB rx msg h 964,-1027,RT-BAT-C,5,86400,2,1,3830,3795,3830,-10,25,25,25,0 2019-09-06 22:25:58.061883 +0200 info main: #31 C MITPROHB rx msg h 964,-1040,RT-BAT-C,5,86400,2,1,3830,3795,3830,-10,25,25,25,0
This shows the ticker was only run 299 times from 22:07:48 to 22:21:57.
After 22:21:57 the workaround was triggered and did a reconnect. Apparently during that network reinitialization of 103 seconds, the per second ticker was run 628 times.
That can't be catching up on the event queue, as that queue has only 20 slots. So something strange is going on here.
Any ideas?
Regards, Michael
Am 06.09.19 um 08:04 schrieb Michael Balzer:
Mark & anyone else running a V2 server,
as most cars don't send history records, this also needs the change to the server I just pushed, i.e. server version 2.4.2.
https://github.com/openvehicles/Open-Vehicle-Monitoring-System/commits/maste...
Regards, Michael
Am 05.09.19 um 19:55 schrieb Michael Balzer:
I've pushed the nasty workaround: the v2 server checks for no RX over 15 minutes, then restarts the network (wifi & modem) as configured for autostart.
Rolled out on my server in edge as 3.2.002-237-ge075f655.
Please test.
Regards, Michael
Am 05.09.19 um 01:58 schrieb Mark Webb-Johnson:
> Mark, you can check your server logs for history messages with ridiculous time offsets: > > [sddexter@ns27 server]$ cat log-20190903 | egrep "rx msg h [0-9]+,-[0-9]{4}" | wc -l > 455283 >
I checked my logs and see 12 vehicles showing this. But, 2 only show this for a debugcrash log (which is expected, I guess, if the time is not synced at report time). I’ve got 4 cars with the offset > 10,000.
Regards, Mark.
> On 4 Sep 2019, at 4:45 AM, Michael Balzer <dexter@expeedo.de <mailto:dexter@expeedo.de>> wrote: > > Everyone, > > I've pushed a change that needs some testing. > > I had the issue myself now parking at a certain distance from my garage wifi AP, i.e. on the edge of "in", after wifi had been disconnected for some > hours, and with the module still connected via modem. The wifi blob had been trying to connect to the AP for about two hours. > > As seen before, the module saw no error, just the server responses and commands stopped coming in. I noticed the default interface was still "st1" > despite wifi having been disconnected and modem connected. The DNS was also still configured for my wifi network, and the interface seemed to have an IP > address -- but wasn't pingable from the wifi network. > > A power cycle of the modem solved the issue without reboot. So the cause may be in the modem/ppp subsystem, or it may be related (in some weird way) to > the default interface / DNS setup. > > More tests showed the default interface again/still got set by the wifi blob itself at some point, overriding our modem prioritization. The events we > didn't handle up to now were "sta.connected" and "sta.lostip", so I added these, and the bug didn't show up again since then. That doesn't mean > anything, so we need to test this. > > The default interface really shouldn't affect inbound packet routing of an established connection, but there always may be strange bugs lurking in those > libs. > > The change also reimplements the wifi signal strength reading, as the tests also showed that still wasn't working well using the CSI callback. It now > seems to be much more reliable. > > Please test & report. The single module will be hard to test, as the bug isn't reproducable easily, but you can still try if wifi / modem transitions > work well. > > Mark, you can check your server logs for history messages with ridiculous time offsets: > > [sddexter@ns27 server]$ cat log-20190903 | egrep "rx msg h [0-9]+,-[0-9]{4}" | wc -l > 455283 > > The bug now severely affects the V2 server performance, as the server is single threaded and doesn't scale very well to this kind of bulk data bursts, > especially when coming from multiple modules in parallel. So we really need to solve this now. Slow reactions or connection drops from my server lately > have been due to this bug. If this change doesn't solve it, we'll need to add some reboot trigger on "too many server v2 notification retransmissions" > -- or maybe a modem power cycle will do, that wouldn't discard the data. > > Thanks, > Michael > > > Am 03.09.19 um 07:46 schrieb Mark Webb-Johnson: >> No problem. We can hold. I won’t commit anything for the next few days (and agree to hold-off on Markos’s pull). Let me know when you are ready. >> >> Regards, Mark. >> >>> On 3 Sep 2019, at 1:58 AM, Michael Balzer <dexter@expeedo.de> wrote: >>> >>> Mark, please wait. >>> >>> I may just have found the cause for issue #241, or at least something I need to investigate before releasing. >>> >>> I need to dig into my logs first, and try something. >>> >>> Regards, >>> Michael >>> >>> >>> Am 02.09.19 um 12:23 schrieb Michael Balzer: >>>> Nothing open from my side at the moment. >>>> >>>> I haven't had the time to look in to Markos pull request, but from a first check also think that's going too deep to be included in this release. >>>> >>>> Regards, >>>> Michael >>>> >>>> >>>> Am 02.09.19 um 04:15 schrieb Mark Webb-Johnson: >>>>> I think it is well past time for a 3.2.003 release. Things seems table in edge (although some things only partially implemented). >>>>> >>>>> Anything people want to include at the last minute, or can we go ahead and build? >>>>> >>>>> Regards, Mark. >>>>> >>>>> _______________________________________________ >>>>> OvmsDev mailing list >>>>> OvmsDev@lists.openvehicles.com >>>>> http://lists.openvehicles.com/mailman/listinfo/ovmsdev >>> -- >>> Michael Balzer * Helkenberger Weg 9 * D-58256 Ennepetal >>> Fon 02333 / 833 5735 * Handy 0176 / 206 989 26 >>> >>> _______________________________________________ >>> OvmsDev mailing list >>> OvmsDev@lists.openvehicles.com >>> http://lists.openvehicles.com/mailman/listinfo/ovmsdev >> _______________________________________________ >> OvmsDev mailing list >> OvmsDev@lists.openvehicles.com >> http://lists.openvehicles.com/mailman/listinfo/ovmsdev > > -- > Michael Balzer * Helkenberger Weg 9 * D-58256 Ennepetal > Fon 02333 / 833 5735 * Handy 0176 / 206 989 26 > _______________________________________________ > OvmsDev mailing list > OvmsDev@lists.openvehicles.com <mailto:OvmsDev@lists.openvehicles.com> > http://lists.openvehicles.com/mailman/listinfo/ovmsdev
_______________________________________________ OvmsDev mailing list OvmsDev@lists.openvehicles.com http://lists.openvehicles.com/mailman/listinfo/ovmsdev
-- Michael Balzer * Helkenberger Weg 9 * D-58256 Ennepetal Fon 02333 / 833 5735 * Handy 0176 / 206 989 26
_______________________________________________ OvmsDev mailing list OvmsDev@lists.openvehicles.com http://lists.openvehicles.com/mailman/listinfo/ovmsdev
-- Michael Balzer * Helkenberger Weg 9 * D-58256 Ennepetal Fon 02333 / 833 5735 * Handy 0176 / 206 989 26
_______________________________________________ OvmsDev mailing list OvmsDev@lists.openvehicles.com http://lists.openvehicles.com/mailman/listinfo/ovmsdev
-- Michael Balzer * Helkenberger Weg 9 * D-58256 Ennepetal Fon 02333 / 833 5735 * Handy 0176 / 206 989 26
_______________________________________________ OvmsDev mailing list OvmsDev@lists.openvehicles.com http://lists.openvehicles.com/mailman/listinfo/ovmsdev
-- Michael Balzer * Helkenberger Weg 9 * D-58256 Ennepetal Fon 02333 / 833 5735 * Handy 0176 / 206 989 26 _______________________________________________ OvmsDev mailing list OvmsDev@lists.openvehicles.com <mailto:OvmsDev@lists.openvehicles.com> http://lists.openvehicles.com/mailman/listinfo/ovmsdev
_______________________________________________ OvmsDev mailing list OvmsDev@lists.openvehicles.com http://lists.openvehicles.com/mailman/listinfo/ovmsdev
-- Michael Balzer * Helkenberger Weg 9 * D-58256 Ennepetal Fon 02333 / 833 5735 * Handy 0176 / 206 989 26
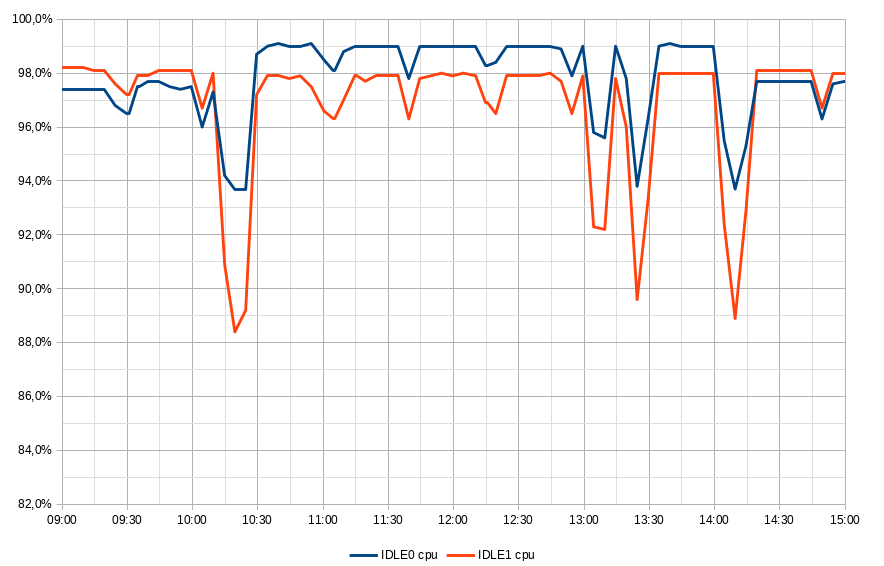
I'd say we should release this version now. No new issues so far, the #241 workaround works as designed, and crash ratio is low. Regards, Michael Am 09.09.19 um 17:18 schrieb Michael Balzer:
Mark,
I did the same checks as you and came to the same conclusion.
For the webserver timer, that looks non-trivial but really only pushes requests into the job queue and takes care to never block. A bit of a potential issue there is it does some logging in case of trouble (job queue full), and that may be bad if logging to an SD file is enabled. We still need to rework the file logging to use a separate task as well (issue #107).
From my task data today, here are some first impressions on our normal CPU load:
a) Idle tasks:
b) Active tasks:
10:00 - 10:30 was a drive from home (wifi) to office (no wifi), then another drive 13:00 - 13:30 and back home 14:00 - 14:15.
Driving load on the NetMan is caused by the web dashboard. The half hour peaks are from the 12V topping from the main battery the Twizy does when parked.
So that's nowhere near "too much" in terms of CPU load -- normally. I'm waiting to catch the issue situation with this instrumentation.
Regards, Michael
Am 09.09.19 um 05:43 schrieb Mark Webb-Johnson:
tldr; Perhaps we should be using esp_timer and esp_timer_get_time() to update monotonic time then dispatch the ticker.* events?
Long story: Trying to see how monotonic time could not be updating...
I never really worked out how this operates in ESP32 IDF freertos. We have three tasks involved in timers:
* esp_timer * Tmr Svc * eventTask
From my understanding, Tmr Svc provides high level timer support for freertos (xTimerCreate, etc). And esp_timer provides esp32 specific timer support (https://docs.espressif.com/projects/esp-idf/en/latest/api-reference/system/e...). We use Tmr Svc, and note the warnings provided in the espressif documentation:
* Maximum resolution is equal to RTOS tick period * Timer callbacks are dispatched from a low-priority task
Currently, our housekeeping uses xTimerCreate to create a 1 second timer (calling HousekeepingTicker1). So, in which task is HousekeepingTicker1() called (esp_timer or Tmr Svc) - I always suspected the latter (but never checked). Then HousekeepingTicker1() raises a signal (using ovms events) that pushes it onto a queue (if the queue is full, it discards). The eventTask will then read that queue, and dispatch it to our ticker.1 listeners.
HousekeepingTicker1 is responsible for updating monotonictime, and given it’s simple calling of MyEvents.SignalEvent (which just queues it and discards on overflow), I don’t think that can block for any substantial time.
I did a search for xTimerCreate in our code base, and find these used:
* components/ovms_webserver/src/ovms_webserver.cpp m_update_ticker = xTimerCreate("Web client update ticker", 250 / portTICK_PERIOD_MS, pdTRUE, NULL, UpdateTicker);
This seems to do quite a bit. In particular queue handling and semaphores. All seem to be non-blocking, but the flow is non-trivial.
* components/vehicle_nissanleaf/src/vehicle_nissanleaf.cpp m_remoteCommandTimer = xTimerCreate("Nissan Leaf Remote Command", 100 / portTICK_PERIOD_MS, pdTRUE, this, remoteCommandTimer); m_ccDisableTimer = xTimerCreate("Nissan Leaf CC Disable", 1000 / portTICK_PERIOD_MS, pdFALSE, this, ccDisableTimer);
Seem ok, and non-blocking.
* components/vehicle_renaulttwizy/src/rt_sevcon.cpp m_kickdown_timer = xTimerCreate("RT kickdown", pdMS_TO_TICKS(100), pdTRUE, NULL, KickdownTimer);
Seems ok.
* components/vehicle_smarted/src/vehicle_smarted.cpp m_locking_timer = xTimerCreate("Smart ED Locking Timer", 500 / portTICK_PERIOD_MS, pdTRUE, this, SmartEDLockingTimer);
This code looks a bit dodgy because CommandLock and CommandUnlock both create this timer, and start it - but neither check if it is already created. That said, after it fires the timer is deleted by the handler.
* components/vehicle_teslaroadster/src/vehicle_teslaroadster.cpp m_speedo_timer = xTimerCreate("TR ticker", m_homelink_timer = xTimerCreate("Tesla Roadster Homelink Timer", durationms / portTICK_PERIOD_MS, pdTRUE, this, TeslaRoadsterHomelinkTimer);
Similar lack of checking for duplicate timers. But I don’t see any blocking.
So, I don’t really think _we_ are starving the TmrSvc. Most likely something in the core framework.
Regards, Mark.
On 7 Sep 2019, at 4:55 PM, Michael Balzer <dexter@expeedo.de <mailto:dexter@expeedo.de>> wrote:
I think the RTOS timer service task starves. It's running on core 0 with priority 1.
Taks on core 0 sorted by priority:
Number of Tasks = 20 Stack: Now Max Total Heap 32-bit SPIRAM C# PRI 3FFC84A8 6 Blk ipc0 388 500 1024 7788 0 0 0 24 3FFC77F0 5 Blk OVMS CanRx 428 428 2048 3052 0 31844 0 23 3FFAFBF4 1 Blk esp_timer 400 656 4096 35928 644 25804 0 22 3FFD3240 19 Blk wifi 460 2716 3584 43720 0 20 0 22 3FFC03C4 2 Blk eventTask 448 1984 4608 104 0 0 0 20 3FFC8F14 17 Blk tiT 500 2308 3072 6552 0 0 * 18 3FFE14F0 26 Blk OVMS COrx 456 456 4096 0 0 0 0 7 3FFE19D4 27 Blk OVMS COwrk 476 476 3072 0 0 0 0 7 3FFCBC34 12 Blk Tmr Svc 352 928 3072 88 0 0 0 1 3FFE7708 23 Blk mdns 468 1396 4096 108 0 0 0 1
I don't think it's our CanRx, as that only fetches and queues CAN frames, the actual work is done by the listeners. The CO tasks only run for CANopen jobs, which are few for normal operation.
That leaves the system tasks, with main suspect -once again- the wifi blob.
We need to know how much CPU time the tasks actually use now. I think I saw some option for this in the FreeRTOS config.
Regards, Michael
Am 06.09.19 um 23:15 schrieb Michael Balzer:
The workaround is based on the monotonictime being updated per second, as do the history record offsets.
Apparently, that mechanism doesn't work reliably. That may be an indicator for some bigger underlying issue.
Example log excerpt:
2019-09-06 22:07:48.126919 +0200 info main: #173 C MITPROHB rx msg h 964,0,RT-BAT-C,5,86400,2,1,3830,3795,3830,-10,25,25,25,0 2019-09-06 22:09:03.089031 +0200 info main: #173 C MITPROHB rx msg h 964,-10,RT-BAT-C,5,86400,2,1,3830,3795,3830,-10,25,25,25,0 2019-09-06 22:09:05.041574 +0200 info main: #173 C MITPROHB rx msg h 964,-20,RT-BAT-C,5,86400,2,1,3830,3795,3830,-10,25,25,25,0 2019-09-06 22:09:05.052644 +0200 info main: #173 C MITPROHB rx msg h 964,-30,RT-BAT-C,5,86400,2,1,3830,3795,3830,-10,25,25,25,0 2019-09-06 22:09:05.063617 +0200 info main: #173 C MITPROHB rx msg h 964,-49,RT-BAT-C,5,86400,2,1,3830,3795,3830,-10,25,25,25,0 2019-09-06 22:09:05.077527 +0200 info main: #173 C MITPROHB rx msg h 964,-59,RT-BAT-C,5,86400,2,1,3830,3795,3830,-10,25,25,25,0 2019-09-06 22:09:05.193775 +0200 info main: #173 C MITPROHB rx msg h 964,-70,RT-BAT-C,5,86400,2,1,3830,3795,3830,-10,25,25,25,0 2019-09-06 22:09:13.190645 +0200 info main: #173 C MITPROHB rx msg h 964,-80,RT-BAT-C,5,86400,2,1,3830,3795,3830,-10,25,25,25,0 2019-09-06 22:09:22.077994 +0200 info main: #173 C MITPROHB rx msg h 964,-90,RT-BAT-C,5,86400,2,1,3830,3795,3830,-10,25,25,25,0 2019-09-06 22:09:54.590300 +0200 info main: #173 C MITPROHB rx msg h 964,-109,RT-BAT-C,5,86400,2,1,3830,3795,3830,-10,25,25,25,0 2019-09-06 22:11:10.127054 +0200 info main: #173 C MITPROHB rx msg h 964,-119,RT-BAT-C,5,86400,2,1,3830,3795,3830,-10,25,25,25,0 2019-09-06 22:11:16.794200 +0200 info main: #173 C MITPROHB rx msg h 964,-130,RT-BAT-C,5,86400,2,1,3830,3795,3830,-10,25,25,25,0 2019-09-06 22:11:22.455652 +0200 info main: #173 C MITPROHB rx msg h 964,-140,RT-BAT-C,5,86400,2,1,3830,3795,3830,-10,25,25,25,0 2019-09-06 22:12:49.423412 +0200 info main: #173 C MITPROHB rx msg h 964,-150,RT-BAT-C,5,86400,2,1,3830,3795,3830,-10,25,25,25,0 2019-09-06 22:12:49.442096 +0200 info main: #173 C MITPROHB rx msg h 964,-169,RT-BAT-C,5,86400,2,1,3830,3795,3830,-10,25,25,25,0 2019-09-06 22:12:49.461941 +0200 info main: #173 C MITPROHB rx msg h 964,-179,RT-BAT-C,5,86400,2,1,3830,3795,3830,-10,25,25,25,0 2019-09-06 22:14:39.828133 +0200 info main: #173 C MITPROHB rx msg h 964,-190,RT-BAT-C,5,86400,2,1,3830,3795,3830,-10,25,25,25,0 2019-09-06 22:14:39.858144 +0200 info main: #173 C MITPROHB rx msg h 964,-200,RT-BAT-C,5,86400,2,1,3830,3795,3830,-10,25,25,25,0 2019-09-06 22:14:52.020319 +0200 info main: #173 C MITPROHB rx msg h 964,-210,RT-BAT-C,5,86400,2,1,3830,3795,3830,-10,25,25,25,0 2019-09-06 22:14:54.452637 +0200 info main: #173 C MITPROHB rx msg h 964,-229,RT-BAT-C,5,86400,2,1,3830,3795,3830,-10,25,25,25,0 2019-09-06 22:15:12.613935 +0200 info main: #173 C MITPROHB rx msg h 964,-239,RT-BAT-C,5,86400,2,1,3830,3795,3830,-10,25,25,25,0 2019-09-06 22:15:35.223845 +0200 info main: #173 C MITPROHB rx msg h 964,-250,RT-BAT-C,5,86400,2,1,3830,3795,3830,-10,25,25,25,0 2019-09-06 22:16:09.255059 +0200 info main: #173 C MITPROHB rx msg h 964,-260,RT-BAT-C,5,86400,2,1,3830,3795,3830,-10,25,25,25,0 2019-09-06 22:17:31.919754 +0200 info main: #173 C MITPROHB rx msg h 964,-270,RT-BAT-C,5,86400,2,1,3830,3795,3830,-10,25,25,25,0 2019-09-06 22:19:23.366267 +0200 info main: #173 C MITPROHB rx msg h 964,-289,RT-BAT-C,5,86400,2,1,3830,3795,3830,-10,25,25,25,0 2019-09-06 22:21:57.344609 +0200 info main: #173 C MITPROHB rx msg h 964,-299,RT-BAT-C,5,86400,2,1,3830,3795,3830,-10,25,25,25,0 2019-09-06 22:23:40.082406 +0200 info main: #31 C MITPROHB rx msg h 964,-1027,RT-BAT-C,5,86400,2,1,3830,3795,3830,-10,25,25,25,0 2019-09-06 22:25:58.061883 +0200 info main: #31 C MITPROHB rx msg h 964,-1040,RT-BAT-C,5,86400,2,1,3830,3795,3830,-10,25,25,25,0
This shows the ticker was only run 299 times from 22:07:48 to 22:21:57.
After 22:21:57 the workaround was triggered and did a reconnect. Apparently during that network reinitialization of 103 seconds, the per second ticker was run 628 times.
That can't be catching up on the event queue, as that queue has only 20 slots. So something strange is going on here.
Any ideas?
Regards, Michael
Am 06.09.19 um 08:04 schrieb Michael Balzer:
Mark & anyone else running a V2 server,
as most cars don't send history records, this also needs the change to the server I just pushed, i.e. server version 2.4.2.
https://github.com/openvehicles/Open-Vehicle-Monitoring-System/commits/maste...
Regards, Michael
Am 05.09.19 um 19:55 schrieb Michael Balzer:
I've pushed the nasty workaround: the v2 server checks for no RX over 15 minutes, then restarts the network (wifi & modem) as configured for autostart.
Rolled out on my server in edge as 3.2.002-237-ge075f655.
Please test.
Regards, Michael
Am 05.09.19 um 01:58 schrieb Mark Webb-Johnson: >> Mark, you can check your server logs for history messages with ridiculous time offsets: >> >> [sddexter@ns27 server]$ cat log-20190903 | egrep "rx msg h [0-9]+,-[0-9]{4}" | wc -l >> 455283 >> > > I checked my logs and see 12 vehicles showing this. But, 2 only show this for a debugcrash log (which is expected, I guess, if the time is not synced at > report time). I’ve got 4 cars with the offset > 10,000. > > Regards, Mark. > >> On 4 Sep 2019, at 4:45 AM, Michael Balzer <dexter@expeedo.de <mailto:dexter@expeedo.de>> wrote: >> >> Everyone, >> >> I've pushed a change that needs some testing. >> >> I had the issue myself now parking at a certain distance from my garage wifi AP, i.e. on the edge of "in", after wifi had been disconnected for some >> hours, and with the module still connected via modem. The wifi blob had been trying to connect to the AP for about two hours. >> >> As seen before, the module saw no error, just the server responses and commands stopped coming in. I noticed the default interface was still "st1" >> despite wifi having been disconnected and modem connected. The DNS was also still configured for my wifi network, and the interface seemed to have an >> IP address -- but wasn't pingable from the wifi network. >> >> A power cycle of the modem solved the issue without reboot. So the cause may be in the modem/ppp subsystem, or it may be related (in some weird way) to >> the default interface / DNS setup. >> >> More tests showed the default interface again/still got set by the wifi blob itself at some point, overriding our modem prioritization. The events we >> didn't handle up to now were "sta.connected" and "sta.lostip", so I added these, and the bug didn't show up again since then. That doesn't mean >> anything, so we need to test this. >> >> The default interface really shouldn't affect inbound packet routing of an established connection, but there always may be strange bugs lurking in >> those libs. >> >> The change also reimplements the wifi signal strength reading, as the tests also showed that still wasn't working well using the CSI callback. It now >> seems to be much more reliable. >> >> Please test & report. The single module will be hard to test, as the bug isn't reproducable easily, but you can still try if wifi / modem transitions >> work well. >> >> Mark, you can check your server logs for history messages with ridiculous time offsets: >> >> [sddexter@ns27 server]$ cat log-20190903 | egrep "rx msg h [0-9]+,-[0-9]{4}" | wc -l >> 455283 >> >> The bug now severely affects the V2 server performance, as the server is single threaded and doesn't scale very well to this kind of bulk data bursts, >> especially when coming from multiple modules in parallel. So we really need to solve this now. Slow reactions or connection drops from my server lately >> have been due to this bug. If this change doesn't solve it, we'll need to add some reboot trigger on "too many server v2 notification retransmissions" >> -- or maybe a modem power cycle will do, that wouldn't discard the data. >> >> Thanks, >> Michael >> >> >> Am 03.09.19 um 07:46 schrieb Mark Webb-Johnson: >>> No problem. We can hold. I won’t commit anything for the next few days (and agree to hold-off on Markos’s pull). Let me know when you are ready. >>> >>> Regards, Mark. >>> >>>> On 3 Sep 2019, at 1:58 AM, Michael Balzer <dexter@expeedo.de> wrote: >>>> >>>> Mark, please wait. >>>> >>>> I may just have found the cause for issue #241, or at least something I need to investigate before releasing. >>>> >>>> I need to dig into my logs first, and try something. >>>> >>>> Regards, >>>> Michael >>>> >>>> >>>> Am 02.09.19 um 12:23 schrieb Michael Balzer: >>>>> Nothing open from my side at the moment. >>>>> >>>>> I haven't had the time to look in to Markos pull request, but from a first check also think that's going too deep to be included in this release. >>>>> >>>>> Regards, >>>>> Michael >>>>> >>>>> >>>>> Am 02.09.19 um 04:15 schrieb Mark Webb-Johnson: >>>>>> I think it is well past time for a 3.2.003 release. Things seems table in edge (although some things only partially implemented). >>>>>> >>>>>> Anything people want to include at the last minute, or can we go ahead and build? >>>>>> >>>>>> Regards, Mark. >>>>>> >>>>>> _______________________________________________ >>>>>> OvmsDev mailing list >>>>>> OvmsDev@lists.openvehicles.com >>>>>> http://lists.openvehicles.com/mailman/listinfo/ovmsdev >>>> -- >>>> Michael Balzer * Helkenberger Weg 9 * D-58256 Ennepetal >>>> Fon 02333 / 833 5735 * Handy 0176 / 206 989 26 >>>> >>>> _______________________________________________ >>>> OvmsDev mailing list >>>> OvmsDev@lists.openvehicles.com >>>> http://lists.openvehicles.com/mailman/listinfo/ovmsdev >>> _______________________________________________ >>> OvmsDev mailing list >>> OvmsDev@lists.openvehicles.com >>> http://lists.openvehicles.com/mailman/listinfo/ovmsdev >> >> -- >> Michael Balzer * Helkenberger Weg 9 * D-58256 Ennepetal >> Fon 02333 / 833 5735 * Handy 0176 / 206 989 26 >> _______________________________________________ >> OvmsDev mailing list >> OvmsDev@lists.openvehicles.com <mailto:OvmsDev@lists.openvehicles.com> >> http://lists.openvehicles.com/mailman/listinfo/ovmsdev > > > _______________________________________________ > OvmsDev mailing list > OvmsDev@lists.openvehicles.com > http://lists.openvehicles.com/mailman/listinfo/ovmsdev
-- Michael Balzer * Helkenberger Weg 9 * D-58256 Ennepetal Fon 02333 / 833 5735 * Handy 0176 / 206 989 26
_______________________________________________ OvmsDev mailing list OvmsDev@lists.openvehicles.com http://lists.openvehicles.com/mailman/listinfo/ovmsdev
-- Michael Balzer * Helkenberger Weg 9 * D-58256 Ennepetal Fon 02333 / 833 5735 * Handy 0176 / 206 989 26
_______________________________________________ OvmsDev mailing list OvmsDev@lists.openvehicles.com http://lists.openvehicles.com/mailman/listinfo/ovmsdev
-- Michael Balzer * Helkenberger Weg 9 * D-58256 Ennepetal Fon 02333 / 833 5735 * Handy 0176 / 206 989 26
_______________________________________________ OvmsDev mailing list OvmsDev@lists.openvehicles.com http://lists.openvehicles.com/mailman/listinfo/ovmsdev
-- Michael Balzer * Helkenberger Weg 9 * D-58256 Ennepetal Fon 02333 / 833 5735 * Handy 0176 / 206 989 26 _______________________________________________ OvmsDev mailing list OvmsDev@lists.openvehicles.com <mailto:OvmsDev@lists.openvehicles.com> http://lists.openvehicles.com/mailman/listinfo/ovmsdev
_______________________________________________ OvmsDev mailing list OvmsDev@lists.openvehicles.com http://lists.openvehicles.com/mailman/listinfo/ovmsdev
-- Michael Balzer * Helkenberger Weg 9 * D-58256 Ennepetal Fon 02333 / 833 5735 * Handy 0176 / 206 989 26
_______________________________________________ OvmsDev mailing list OvmsDev@lists.openvehicles.com http://lists.openvehicles.com/mailman/listinfo/ovmsdev
-- Michael Balzer * Helkenberger Weg 9 * D-58256 Ennepetal Fon 02333 / 833 5735 * Handy 0176 / 206 989 26
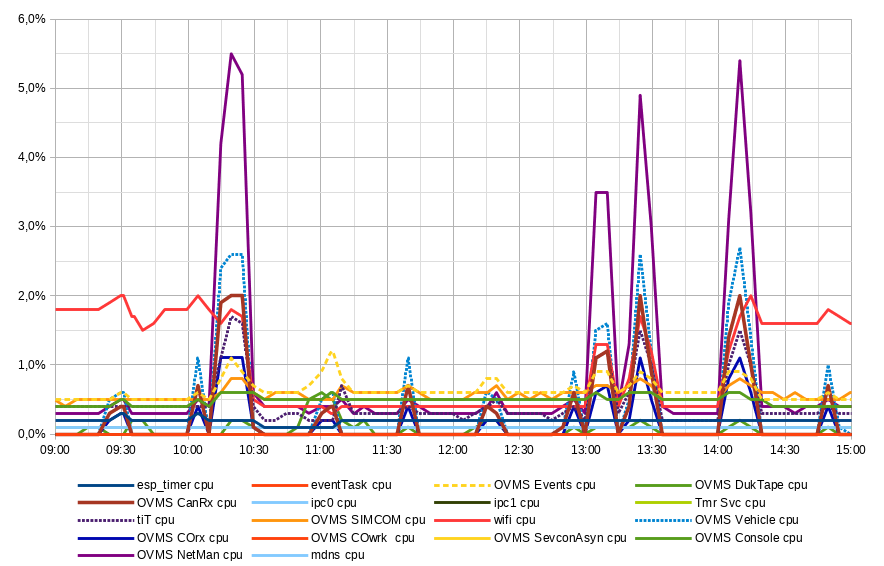
OK. I’ve released to EAP. Also included the basic Zoe code. Regards, Mark.
On 13 Sep 2019, at 9:03 PM, Michael Balzer <dexter@expeedo.de> wrote:
I'd say we should release this version now.
No new issues so far, the #241 workaround works as designed, and crash ratio is low.
Regards, Michael
Am 09.09.19 um 17:18 schrieb Michael Balzer:
Mark,
I did the same checks as you and came to the same conclusion.
For the webserver timer, that looks non-trivial but really only pushes requests into the job queue and takes care to never block. A bit of a potential issue there is it does some logging in case of trouble (job queue full), and that may be bad if logging to an SD file is enabled. We still need to rework the file logging to use a separate task as well (issue #107).
From my task data today, here are some first impressions on our normal CPU load:
a) Idle tasks:
<ndclolldladjlbpf.png>
b) Active tasks:
<chgkakeodpaocemg.png>
10:00 - 10:30 was a drive from home (wifi) to office (no wifi), then another drive 13:00 - 13:30 and back home 14:00 - 14:15.
Driving load on the NetMan is caused by the web dashboard. The half hour peaks are from the 12V topping from the main battery the Twizy does when parked.
So that's nowhere near "too much" in terms of CPU load -- normally. I'm waiting to catch the issue situation with this instrumentation.
Regards, Michael
Am 09.09.19 um 05:43 schrieb Mark Webb-Johnson:
tldr; Perhaps we should be using esp_timer and esp_timer_get_time() to update monotonic time then dispatch the ticker.* events?
Long story: Trying to see how monotonic time could not be updating...
I never really worked out how this operates in ESP32 IDF freertos. We have three tasks involved in timers:
esp_timer Tmr Svc eventTask
From my understanding, Tmr Svc provides high level timer support for freertos (xTimerCreate, etc). And esp_timer provides esp32 specific timer support (https://docs.espressif.com/projects/esp-idf/en/latest/api-reference/system/e... <https://docs.espressif.com/projects/esp-idf/en/latest/api-reference/system/esp_timer.html>). We use Tmr Svc, and note the warnings provided in the espressif documentation:
Maximum resolution is equal to RTOS tick period Timer callbacks are dispatched from a low-priority task
Currently, our housekeeping uses xTimerCreate to create a 1 second timer (calling HousekeepingTicker1). So, in which task is HousekeepingTicker1() called (esp_timer or Tmr Svc) - I always suspected the latter (but never checked). Then HousekeepingTicker1() raises a signal (using ovms events) that pushes it onto a queue (if the queue is full, it discards). The eventTask will then read that queue, and dispatch it to our ticker.1 listeners.
HousekeepingTicker1 is responsible for updating monotonictime, and given it’s simple calling of MyEvents.SignalEvent (which just queues it and discards on overflow), I don’t think that can block for any substantial time.
I did a search for xTimerCreate in our code base, and find these used:
components/ovms_webserver/src/ovms_webserver.cpp m_update_ticker = xTimerCreate("Web client update ticker", 250 / portTICK_PERIOD_MS, pdTRUE, NULL, UpdateTicker);
This seems to do quite a bit. In particular queue handling and semaphores. All seem to be non-blocking, but the flow is non-trivial.
components/vehicle_nissanleaf/src/vehicle_nissanleaf.cpp m_remoteCommandTimer = xTimerCreate("Nissan Leaf Remote Command", 100 / portTICK_PERIOD_MS, pdTRUE, this, remoteCommandTimer); m_ccDisableTimer = xTimerCreate("Nissan Leaf CC Disable", 1000 / portTICK_PERIOD_MS, pdFALSE, this, ccDisableTimer);
Seem ok, and non-blocking.
components/vehicle_renaulttwizy/src/rt_sevcon.cpp m_kickdown_timer = xTimerCreate("RT kickdown", pdMS_TO_TICKS(100), pdTRUE, NULL, KickdownTimer);
Seems ok.
components/vehicle_smarted/src/vehicle_smarted.cpp m_locking_timer = xTimerCreate("Smart ED Locking Timer", 500 / portTICK_PERIOD_MS, pdTRUE, this, SmartEDLockingTimer);
This code looks a bit dodgy because CommandLock and CommandUnlock both create this timer, and start it - but neither check if it is already created. That said, after it fires the timer is deleted by the handler.
components/vehicle_teslaroadster/src/vehicle_teslaroadster.cpp m_speedo_timer = xTimerCreate("TR ticker", m_homelink_timer = xTimerCreate("Tesla Roadster Homelink Timer", durationms / portTICK_PERIOD_MS, pdTRUE, this, TeslaRoadsterHomelinkTimer);
Similar lack of checking for duplicate timers. But I don’t see any blocking.
So, I don’t really think _we_ are starving the TmrSvc. Most likely something in the core framework.
Regards, Mark.
On 7 Sep 2019, at 4:55 PM, Michael Balzer <dexter@expeedo.de <mailto:dexter@expeedo.de>> wrote:
I think the RTOS timer service task starves. It's running on core 0 with priority 1.
Taks on core 0 sorted by priority:
Number of Tasks = 20 Stack: Now Max Total Heap 32-bit SPIRAM C# PRI 3FFC84A8 6 Blk ipc0 388 500 1024 7788 0 0 0 24 3FFC77F0 5 Blk OVMS CanRx 428 428 2048 3052 0 31844 0 23 3FFAFBF4 1 Blk esp_timer 400 656 4096 35928 644 25804 0 22 3FFD3240 19 Blk wifi 460 2716 3584 43720 0 20 0 22 3FFC03C4 2 Blk eventTask 448 1984 4608 104 0 0 0 20 3FFC8F14 17 Blk tiT 500 2308 3072 6552 0 0 * 18 3FFE14F0 26 Blk OVMS COrx 456 456 4096 0 0 0 0 7 3FFE19D4 27 Blk OVMS COwrk 476 476 3072 0 0 0 0 7 3FFCBC34 12 Blk Tmr Svc 352 928 3072 88 0 0 0 1 3FFE7708 23 Blk mdns 468 1396 4096 108 0 0 0 1
I don't think it's our CanRx, as that only fetches and queues CAN frames, the actual work is done by the listeners. The CO tasks only run for CANopen jobs, which are few for normal operation.
That leaves the system tasks, with main suspect -once again- the wifi blob.
We need to know how much CPU time the tasks actually use now. I think I saw some option for this in the FreeRTOS config.
Regards, Michael
Am 06.09.19 um 23:15 schrieb Michael Balzer:
The workaround is based on the monotonictime being updated per second, as do the history record offsets.
Apparently, that mechanism doesn't work reliably. That may be an indicator for some bigger underlying issue.
Example log excerpt:
2019-09-06 22:07:48.126919 +0200 info main: #173 C MITPROHB rx msg h 964,0,RT-BAT-C,5,86400,2,1,3830,3795,3830,-10,25,25,25,0 2019-09-06 22:09:03.089031 +0200 info main: #173 C MITPROHB rx msg h 964,-10,RT-BAT-C,5,86400,2,1,3830,3795,3830,-10,25,25,25,0 2019-09-06 22:09:05.041574 +0200 info main: #173 C MITPROHB rx msg h 964,-20,RT-BAT-C,5,86400,2,1,3830,3795,3830,-10,25,25,25,0 2019-09-06 22:09:05.052644 +0200 info main: #173 C MITPROHB rx msg h 964,-30,RT-BAT-C,5,86400,2,1,3830,3795,3830,-10,25,25,25,0 2019-09-06 22:09:05.063617 +0200 info main: #173 C MITPROHB rx msg h 964,-49,RT-BAT-C,5,86400,2,1,3830,3795,3830,-10,25,25,25,0 2019-09-06 22:09:05.077527 +0200 info main: #173 C MITPROHB rx msg h 964,-59,RT-BAT-C,5,86400,2,1,3830,3795,3830,-10,25,25,25,0 2019-09-06 22:09:05.193775 +0200 info main: #173 C MITPROHB rx msg h 964,-70,RT-BAT-C,5,86400,2,1,3830,3795,3830,-10,25,25,25,0 2019-09-06 22:09:13.190645 +0200 info main: #173 C MITPROHB rx msg h 964,-80,RT-BAT-C,5,86400,2,1,3830,3795,3830,-10,25,25,25,0 2019-09-06 22:09:22.077994 +0200 info main: #173 C MITPROHB rx msg h 964,-90,RT-BAT-C,5,86400,2,1,3830,3795,3830,-10,25,25,25,0 2019-09-06 22:09:54.590300 +0200 info main: #173 C MITPROHB rx msg h 964,-109,RT-BAT-C,5,86400,2,1,3830,3795,3830,-10,25,25,25,0 2019-09-06 22:11:10.127054 +0200 info main: #173 C MITPROHB rx msg h 964,-119,RT-BAT-C,5,86400,2,1,3830,3795,3830,-10,25,25,25,0 2019-09-06 22:11:16.794200 +0200 info main: #173 C MITPROHB rx msg h 964,-130,RT-BAT-C,5,86400,2,1,3830,3795,3830,-10,25,25,25,0 2019-09-06 22:11:22.455652 +0200 info main: #173 C MITPROHB rx msg h 964,-140,RT-BAT-C,5,86400,2,1,3830,3795,3830,-10,25,25,25,0 2019-09-06 22:12:49.423412 +0200 info main: #173 C MITPROHB rx msg h 964,-150,RT-BAT-C,5,86400,2,1,3830,3795,3830,-10,25,25,25,0 2019-09-06 22:12:49.442096 +0200 info main: #173 C MITPROHB rx msg h 964,-169,RT-BAT-C,5,86400,2,1,3830,3795,3830,-10,25,25,25,0 2019-09-06 22:12:49.461941 +0200 info main: #173 C MITPROHB rx msg h 964,-179,RT-BAT-C,5,86400,2,1,3830,3795,3830,-10,25,25,25,0 2019-09-06 22:14:39.828133 +0200 info main: #173 C MITPROHB rx msg h 964,-190,RT-BAT-C,5,86400,2,1,3830,3795,3830,-10,25,25,25,0 2019-09-06 22:14:39.858144 +0200 info main: #173 C MITPROHB rx msg h 964,-200,RT-BAT-C,5,86400,2,1,3830,3795,3830,-10,25,25,25,0 2019-09-06 22:14:52.020319 +0200 info main: #173 C MITPROHB rx msg h 964,-210,RT-BAT-C,5,86400,2,1,3830,3795,3830,-10,25,25,25,0 2019-09-06 22:14:54.452637 +0200 info main: #173 C MITPROHB rx msg h 964,-229,RT-BAT-C,5,86400,2,1,3830,3795,3830,-10,25,25,25,0 2019-09-06 22:15:12.613935 +0200 info main: #173 C MITPROHB rx msg h 964,-239,RT-BAT-C,5,86400,2,1,3830,3795,3830,-10,25,25,25,0 2019-09-06 22:15:35.223845 +0200 info main: #173 C MITPROHB rx msg h 964,-250,RT-BAT-C,5,86400,2,1,3830,3795,3830,-10,25,25,25,0 2019-09-06 22:16:09.255059 +0200 info main: #173 C MITPROHB rx msg h 964,-260,RT-BAT-C,5,86400,2,1,3830,3795,3830,-10,25,25,25,0 2019-09-06 22:17:31.919754 +0200 info main: #173 C MITPROHB rx msg h 964,-270,RT-BAT-C,5,86400,2,1,3830,3795,3830,-10,25,25,25,0 2019-09-06 22:19:23.366267 +0200 info main: #173 C MITPROHB rx msg h 964,-289,RT-BAT-C,5,86400,2,1,3830,3795,3830,-10,25,25,25,0 2019-09-06 22:21:57.344609 +0200 info main: #173 C MITPROHB rx msg h 964,-299,RT-BAT-C,5,86400,2,1,3830,3795,3830,-10,25,25,25,0 2019-09-06 22:23:40.082406 +0200 info main: #31 C MITPROHB rx msg h 964,-1027,RT-BAT-C,5,86400,2,1,3830,3795,3830,-10,25,25,25,0 2019-09-06 22:25:58.061883 +0200 info main: #31 C MITPROHB rx msg h 964,-1040,RT-BAT-C,5,86400,2,1,3830,3795,3830,-10,25,25,25,0
This shows the ticker was only run 299 times from 22:07:48 to 22:21:57.
After 22:21:57 the workaround was triggered and did a reconnect. Apparently during that network reinitialization of 103 seconds, the per second ticker was run 628 times.
That can't be catching up on the event queue, as that queue has only 20 slots. So something strange is going on here.
Any ideas?
Regards, Michael
Am 06.09.19 um 08:04 schrieb Michael Balzer:
Mark & anyone else running a V2 server,
as most cars don't send history records, this also needs the change to the server I just pushed, i.e. server version 2.4.2.
https://github.com/openvehicles/Open-Vehicle-Monitoring-System/commits/maste... <https://github.com/openvehicles/Open-Vehicle-Monitoring-System/commits/master>
Regards, Michael
Am 05.09.19 um 19:55 schrieb Michael Balzer: > I've pushed the nasty workaround: the v2 server checks for no RX over 15 minutes, then restarts the network (wifi & modem) as configured for autostart. > > Rolled out on my server in edge as 3.2.002-237-ge075f655. > > Please test. > > Regards, > Michael > > > Am 05.09.19 um 01:58 schrieb Mark Webb-Johnson: >>> Mark, you can check your server logs for history messages with ridiculous time offsets: >>> [sddexter@ns27 server]$ cat log-20190903 | egrep "rx msg h [0-9]+,-[0-9]{4}" | wc -l >>> 455283 >> >> I checked my logs and see 12 vehicles showing this. But, 2 only show this for a debugcrash log (which is expected, I guess, if the time is not synced at report time). I’ve got 4 cars with the offset > 10,000. >> >> Regards, Mark. >> >>> On 4 Sep 2019, at 4:45 AM, Michael Balzer <dexter@expeedo.de <mailto:dexter@expeedo.de>> wrote: >>> >>> Everyone, >>> >>> I've pushed a change that needs some testing. >>> >>> I had the issue myself now parking at a certain distance from my garage wifi AP, i.e. on the edge of "in", after wifi had been disconnected for some hours, and with the module still connected via modem. The wifi blob had been trying to connect to the AP for about two hours. >>> >>> As seen before, the module saw no error, just the server responses and commands stopped coming in. I noticed the default interface was still "st1" despite wifi having been disconnected and modem connected. The DNS was also still configured for my wifi network, and the interface seemed to have an IP address -- but wasn't pingable from the wifi network. >>> >>> A power cycle of the modem solved the issue without reboot. So the cause may be in the modem/ppp subsystem, or it may be related (in some weird way) to the default interface / DNS setup. >>> >>> More tests showed the default interface again/still got set by the wifi blob itself at some point, overriding our modem prioritization. The events we didn't handle up to now were "sta.connected" and "sta.lostip", so I added these, and the bug didn't show up again since then. That doesn't mean anything, so we need to test this. >>> >>> The default interface really shouldn't affect inbound packet routing of an established connection, but there always may be strange bugs lurking in those libs. >>> >>> The change also reimplements the wifi signal strength reading, as the tests also showed that still wasn't working well using the CSI callback. It now seems to be much more reliable. >>> >>> Please test & report. The single module will be hard to test, as the bug isn't reproducable easily, but you can still try if wifi / modem transitions work well. >>> >>> Mark, you can check your server logs for history messages with ridiculous time offsets: >>> [sddexter@ns27 server]$ cat log-20190903 | egrep "rx msg h [0-9]+,-[0-9]{4}" | wc -l >>> 455283 >>> The bug now severely affects the V2 server performance, as the server is single threaded and doesn't scale very well to this kind of bulk data bursts, especially when coming from multiple modules in parallel. So we really need to solve this now. Slow reactions or connection drops from my server lately have been due to this bug. If this change doesn't solve it, we'll need to add some reboot trigger on "too many server v2 notification retransmissions" -- or maybe a modem power cycle will do, that wouldn't discard the data. >>> >>> Thanks, >>> Michael >>> >>> >>> Am 03.09.19 um 07:46 schrieb Mark Webb-Johnson: >>>> No problem. We can hold. I won’t commit anything for the next few days (and agree to hold-off on Markos’s pull). Let me know when you are ready. >>>> >>>> Regards, Mark. >>>> >>>>> On 3 Sep 2019, at 1:58 AM, Michael Balzer <dexter@expeedo.de> <mailto:dexter@expeedo.de> wrote: >>>>> >>>>> Mark, please wait. >>>>> >>>>> I may just have found the cause for issue #241, or at least something I need to investigate before releasing. >>>>> >>>>> I need to dig into my logs first, and try something. >>>>> >>>>> Regards, >>>>> Michael >>>>> >>>>> >>>>> Am 02.09.19 um 12:23 schrieb Michael Balzer: >>>>>> Nothing open from my side at the moment. >>>>>> >>>>>> I haven't had the time to look in to Markos pull request, but from a first check also think that's going too deep to be included in this release. >>>>>> >>>>>> Regards, >>>>>> Michael >>>>>> >>>>>> >>>>>> Am 02.09.19 um 04:15 schrieb Mark Webb-Johnson: >>>>>>> I think it is well past time for a 3.2.003 release. Things seems table in edge (although some things only partially implemented). >>>>>>> >>>>>>> Anything people want to include at the last minute, or can we go ahead and build? >>>>>>> >>>>>>> Regards, Mark. >>>>>>> >>>>>>> _______________________________________________ >>>>>>> OvmsDev mailing list >>>>>>> OvmsDev@lists.openvehicles.com <mailto:OvmsDev@lists.openvehicles.com> >>>>>>> http://lists.openvehicles.com/mailman/listinfo/ovmsdev <http://lists.openvehicles.com/mailman/listinfo/ovmsdev> >>>>> -- >>>>> Michael Balzer * Helkenberger Weg 9 * D-58256 Ennepetal >>>>> Fon 02333 / 833 5735 * Handy 0176 / 206 989 26 >>>>> >>>>> _______________________________________________ >>>>> OvmsDev mailing list >>>>> OvmsDev@lists.openvehicles.com <mailto:OvmsDev@lists.openvehicles.com> >>>>> http://lists.openvehicles.com/mailman/listinfo/ovmsdev <http://lists.openvehicles.com/mailman/listinfo/ovmsdev> >>>> _______________________________________________ >>>> OvmsDev mailing list >>>> OvmsDev@lists.openvehicles.com <mailto:OvmsDev@lists.openvehicles.com> >>>> http://lists.openvehicles.com/mailman/listinfo/ovmsdev <http://lists.openvehicles.com/mailman/listinfo/ovmsdev> >>> >>> -- >>> Michael Balzer * Helkenberger Weg 9 * D-58256 Ennepetal >>> Fon 02333 / 833 5735 * Handy 0176 / 206 989 26 >>> _______________________________________________ >>> OvmsDev mailing list >>> OvmsDev@lists.openvehicles.com <mailto:OvmsDev@lists.openvehicles.com> >>> http://lists.openvehicles.com/mailman/listinfo/ovmsdev <http://lists.openvehicles.com/mailman/listinfo/ovmsdev> >> >> >> >> _______________________________________________ >> OvmsDev mailing list >> OvmsDev@lists.openvehicles.com <mailto:OvmsDev@lists.openvehicles.com> >> http://lists.openvehicles.com/mailman/listinfo/ovmsdev <http://lists.openvehicles.com/mailman/listinfo/ovmsdev> > > -- > Michael Balzer * Helkenberger Weg 9 * D-58256 Ennepetal > Fon 02333 / 833 5735 * Handy 0176 / 206 989 26 > > > _______________________________________________ > OvmsDev mailing list > OvmsDev@lists.openvehicles.com <mailto:OvmsDev@lists.openvehicles.com> > http://lists.openvehicles.com/mailman/listinfo/ovmsdev <http://lists.openvehicles.com/mailman/listinfo/ovmsdev>
-- Michael Balzer * Helkenberger Weg 9 * D-58256 Ennepetal Fon 02333 / 833 5735 * Handy 0176 / 206 989 26
_______________________________________________ OvmsDev mailing list OvmsDev@lists.openvehicles.com <mailto:OvmsDev@lists.openvehicles.com> http://lists.openvehicles.com/mailman/listinfo/ovmsdev <http://lists.openvehicles.com/mailman/listinfo/ovmsdev>
-- Michael Balzer * Helkenberger Weg 9 * D-58256 Ennepetal Fon 02333 / 833 5735 * Handy 0176 / 206 989 26
_______________________________________________ OvmsDev mailing list OvmsDev@lists.openvehicles.com <mailto:OvmsDev@lists.openvehicles.com> http://lists.openvehicles.com/mailman/listinfo/ovmsdev <http://lists.openvehicles.com/mailman/listinfo/ovmsdev>
-- Michael Balzer * Helkenberger Weg 9 * D-58256 Ennepetal Fon 02333 / 833 5735 * Handy 0176 / 206 989 26 _______________________________________________ OvmsDev mailing list OvmsDev@lists.openvehicles.com <mailto:OvmsDev@lists.openvehicles.com> http://lists.openvehicles.com/mailman/listinfo/ovmsdev <http://lists.openvehicles.com/mailman/listinfo/ovmsdev>
_______________________________________________ OvmsDev mailing list OvmsDev@lists.openvehicles.com <mailto:OvmsDev@lists.openvehicles.com> http://lists.openvehicles.com/mailman/listinfo/ovmsdev <http://lists.openvehicles.com/mailman/listinfo/ovmsdev>
-- Michael Balzer * Helkenberger Weg 9 * D-58256 Ennepetal Fon 02333 / 833 5735 * Handy 0176 / 206 989 26
_______________________________________________ OvmsDev mailing list OvmsDev@lists.openvehicles.com <mailto:OvmsDev@lists.openvehicles.com> http://lists.openvehicles.com/mailman/listinfo/ovmsdev <http://lists.openvehicles.com/mailman/listinfo/ovmsdev>
-- Michael Balzer * Helkenberger Weg 9 * D-58256 Ennepetal Fon 02333 / 833 5735 * Handy 0176 / 206 989 26 _______________________________________________ OvmsDev mailing list OvmsDev@lists.openvehicles.com http://lists.openvehicles.com/mailman/listinfo/ovmsdev
Followed you on my server. Btw: branch COUNT(*) eap 14 edge 42 main 183 Edge has more users than eap, but most of the edge users don't enable auto update. Also: version cars crashes crashratio new 18 16 0.8889 old 223 1315 5.8969 That's comparing crashes of my edge release (built with toolchain -98) to all previous releases still in use (which also covers some 3.1.x releases) within the last 10 days, so crash ratio is very good with this release and toolchain -98. I also haven't seen the issue #241 situation again with this release. Regards, Michael Am 17.09.19 um 08:21 schrieb Mark Webb-Johnson:
OK. I’ve released to EAP. Also included the basic Zoe code.
Regards, Mark.
On 13 Sep 2019, at 9:03 PM, Michael Balzer <dexter@expeedo.de <mailto:dexter@expeedo.de>> wrote:
I'd say we should release this version now.
No new issues so far, the #241 workaround works as designed, and crash ratio is low.
Regards, Michael
Am 09.09.19 um 17:18 schrieb Michael Balzer:
Mark,
I did the same checks as you and came to the same conclusion.
For the webserver timer, that looks non-trivial but really only pushes requests into the job queue and takes care to never block. A bit of a potential issue there is it does some logging in case of trouble (job queue full), and that may be bad if logging to an SD file is enabled. We still need to rework the file logging to use a separate task as well (issue #107).
From my task data today, here are some first impressions on our normal CPU load:
a) Idle tasks:
<ndclolldladjlbpf.png>
b) Active tasks:
<chgkakeodpaocemg.png>
10:00 - 10:30 was a drive from home (wifi) to office (no wifi), then another drive 13:00 - 13:30 and back home 14:00 - 14:15.
Driving load on the NetMan is caused by the web dashboard. The half hour peaks are from the 12V topping from the main battery the Twizy does when parked.
So that's nowhere near "too much" in terms of CPU load -- normally. I'm waiting to catch the issue situation with this instrumentation.
Regards, Michael
Am 09.09.19 um 05:43 schrieb Mark Webb-Johnson:
tldr; Perhaps we should be using esp_timer and esp_timer_get_time() to update monotonic time then dispatch the ticker.* events?
Long story: Trying to see how monotonic time could not be updating...
I never really worked out how this operates in ESP32 IDF freertos. We have three tasks involved in timers:
* esp_timer * Tmr Svc * eventTask
From my understanding, Tmr Svc provides high level timer support for freertos (xTimerCreate, etc). And esp_timer provides esp32 specific timer support (https://docs.espressif.com/projects/esp-idf/en/latest/api-reference/system/e...). We use Tmr Svc, and note the warnings provided in the espressif documentation:
* Maximum resolution is equal to RTOS tick period * Timer callbacks are dispatched from a low-priority task
Currently, our housekeeping uses xTimerCreate to create a 1 second timer (calling HousekeepingTicker1). So, in which task is HousekeepingTicker1() called (esp_timer or Tmr Svc) - I always suspected the latter (but never checked). Then HousekeepingTicker1() raises a signal (using ovms events) that pushes it onto a queue (if the queue is full, it discards). The eventTask will then read that queue, and dispatch it to our ticker.1 listeners.
HousekeepingTicker1 is responsible for updating monotonictime, and given it’s simple calling of MyEvents.SignalEvent (which just queues it and discards on overflow), I don’t think that can block for any substantial time.
I did a search for xTimerCreate in our code base, and find these used:
* components/ovms_webserver/src/ovms_webserver.cpp m_update_ticker = xTimerCreate("Web client update ticker", 250 / portTICK_PERIOD_MS, pdTRUE, NULL, UpdateTicker);
This seems to do quite a bit. In particular queue handling and semaphores. All seem to be non-blocking, but the flow is non-trivial.
* components/vehicle_nissanleaf/src/vehicle_nissanleaf.cpp m_remoteCommandTimer = xTimerCreate("Nissan Leaf Remote Command", 100 / portTICK_PERIOD_MS, pdTRUE, this, remoteCommandTimer); m_ccDisableTimer = xTimerCreate("Nissan Leaf CC Disable", 1000 / portTICK_PERIOD_MS, pdFALSE, this, ccDisableTimer);
Seem ok, and non-blocking.
* components/vehicle_renaulttwizy/src/rt_sevcon.cpp m_kickdown_timer = xTimerCreate("RT kickdown", pdMS_TO_TICKS(100), pdTRUE, NULL, KickdownTimer);
Seems ok.
* components/vehicle_smarted/src/vehicle_smarted.cpp m_locking_timer = xTimerCreate("Smart ED Locking Timer", 500 / portTICK_PERIOD_MS, pdTRUE, this, SmartEDLockingTimer);
This code looks a bit dodgy because CommandLock and CommandUnlock both create this timer, and start it - but neither check if it is already created. That said, after it fires the timer is deleted by the handler.
* components/vehicle_teslaroadster/src/vehicle_teslaroadster.cpp m_speedo_timer = xTimerCreate("TR ticker", m_homelink_timer = xTimerCreate("Tesla Roadster Homelink Timer", durationms / portTICK_PERIOD_MS, pdTRUE, this, TeslaRoadsterHomelinkTimer);
Similar lack of checking for duplicate timers. But I don’t see any blocking.
So, I don’t really think _we_ are starving the TmrSvc. Most likely something in the core framework.
Regards, Mark.
On 7 Sep 2019, at 4:55 PM, Michael Balzer <dexter@expeedo.de <mailto:dexter@expeedo.de>> wrote:
I think the RTOS timer service task starves. It's running on core 0 with priority 1.
Taks on core 0 sorted by priority:
Number of Tasks = 20 Stack: Now Max Total Heap 32-bit SPIRAM C# PRI 3FFC84A8 6 Blk ipc0 388 500 1024 7788 0 0 0 24 3FFC77F0 5 Blk OVMS CanRx 428 428 2048 3052 0 31844 0 23 3FFAFBF4 1 Blk esp_timer 400 656 4096 35928 644 25804 0 22 3FFD3240 19 Blk wifi 460 2716 3584 43720 0 20 0 22 3FFC03C4 2 Blk eventTask 448 1984 4608 104 0 0 0 20 3FFC8F14 17 Blk tiT 500 2308 3072 6552 0 0 * 18 3FFE14F0 26 Blk OVMS COrx 456 456 4096 0 0 0 0 7 3FFE19D4 27 Blk OVMS COwrk 476 476 3072 0 0 0 0 7 3FFCBC34 12 Blk Tmr Svc 352 928 3072 88 0 0 0 1 3FFE7708 23 Blk mdns 468 1396 4096 108 0 0 0 1
I don't think it's our CanRx, as that only fetches and queues CAN frames, the actual work is done by the listeners. The CO tasks only run for CANopen jobs, which are few for normal operation.
That leaves the system tasks, with main suspect -once again- the wifi blob.
We need to know how much CPU time the tasks actually use now. I think I saw some option for this in the FreeRTOS config.
Regards, Michael
Am 06.09.19 um 23:15 schrieb Michael Balzer:
The workaround is based on the monotonictime being updated per second, as do the history record offsets.
Apparently, that mechanism doesn't work reliably. That may be an indicator for some bigger underlying issue.
Example log excerpt:
2019-09-06 22:07:48.126919 +0200 info main: #173 C MITPROHB rx msg h 964,0,RT-BAT-C,5,86400,2,1,3830,3795,3830,-10,25,25,25,0 2019-09-06 22:09:03.089031 +0200 info main: #173 C MITPROHB rx msg h 964,-10,RT-BAT-C,5,86400,2,1,3830,3795,3830,-10,25,25,25,0 2019-09-06 22:09:05.041574 +0200 info main: #173 C MITPROHB rx msg h 964,-20,RT-BAT-C,5,86400,2,1,3830,3795,3830,-10,25,25,25,0 2019-09-06 22:09:05.052644 +0200 info main: #173 C MITPROHB rx msg h 964,-30,RT-BAT-C,5,86400,2,1,3830,3795,3830,-10,25,25,25,0 2019-09-06 22:09:05.063617 +0200 info main: #173 C MITPROHB rx msg h 964,-49,RT-BAT-C,5,86400,2,1,3830,3795,3830,-10,25,25,25,0 2019-09-06 22:09:05.077527 +0200 info main: #173 C MITPROHB rx msg h 964,-59,RT-BAT-C,5,86400,2,1,3830,3795,3830,-10,25,25,25,0 2019-09-06 22:09:05.193775 +0200 info main: #173 C MITPROHB rx msg h 964,-70,RT-BAT-C,5,86400,2,1,3830,3795,3830,-10,25,25,25,0 2019-09-06 22:09:13.190645 +0200 info main: #173 C MITPROHB rx msg h 964,-80,RT-BAT-C,5,86400,2,1,3830,3795,3830,-10,25,25,25,0 2019-09-06 22:09:22.077994 +0200 info main: #173 C MITPROHB rx msg h 964,-90,RT-BAT-C,5,86400,2,1,3830,3795,3830,-10,25,25,25,0 2019-09-06 22:09:54.590300 +0200 info main: #173 C MITPROHB rx msg h 964,-109,RT-BAT-C,5,86400,2,1,3830,3795,3830,-10,25,25,25,0 2019-09-06 22:11:10.127054 +0200 info main: #173 C MITPROHB rx msg h 964,-119,RT-BAT-C,5,86400,2,1,3830,3795,3830,-10,25,25,25,0 2019-09-06 22:11:16.794200 +0200 info main: #173 C MITPROHB rx msg h 964,-130,RT-BAT-C,5,86400,2,1,3830,3795,3830,-10,25,25,25,0 2019-09-06 22:11:22.455652 +0200 info main: #173 C MITPROHB rx msg h 964,-140,RT-BAT-C,5,86400,2,1,3830,3795,3830,-10,25,25,25,0 2019-09-06 22:12:49.423412 +0200 info main: #173 C MITPROHB rx msg h 964,-150,RT-BAT-C,5,86400,2,1,3830,3795,3830,-10,25,25,25,0 2019-09-06 22:12:49.442096 +0200 info main: #173 C MITPROHB rx msg h 964,-169,RT-BAT-C,5,86400,2,1,3830,3795,3830,-10,25,25,25,0 2019-09-06 22:12:49.461941 +0200 info main: #173 C MITPROHB rx msg h 964,-179,RT-BAT-C,5,86400,2,1,3830,3795,3830,-10,25,25,25,0 2019-09-06 22:14:39.828133 +0200 info main: #173 C MITPROHB rx msg h 964,-190,RT-BAT-C,5,86400,2,1,3830,3795,3830,-10,25,25,25,0 2019-09-06 22:14:39.858144 +0200 info main: #173 C MITPROHB rx msg h 964,-200,RT-BAT-C,5,86400,2,1,3830,3795,3830,-10,25,25,25,0 2019-09-06 22:14:52.020319 +0200 info main: #173 C MITPROHB rx msg h 964,-210,RT-BAT-C,5,86400,2,1,3830,3795,3830,-10,25,25,25,0 2019-09-06 22:14:54.452637 +0200 info main: #173 C MITPROHB rx msg h 964,-229,RT-BAT-C,5,86400,2,1,3830,3795,3830,-10,25,25,25,0 2019-09-06 22:15:12.613935 +0200 info main: #173 C MITPROHB rx msg h 964,-239,RT-BAT-C,5,86400,2,1,3830,3795,3830,-10,25,25,25,0 2019-09-06 22:15:35.223845 +0200 info main: #173 C MITPROHB rx msg h 964,-250,RT-BAT-C,5,86400,2,1,3830,3795,3830,-10,25,25,25,0 2019-09-06 22:16:09.255059 +0200 info main: #173 C MITPROHB rx msg h 964,-260,RT-BAT-C,5,86400,2,1,3830,3795,3830,-10,25,25,25,0 2019-09-06 22:17:31.919754 +0200 info main: #173 C MITPROHB rx msg h 964,-270,RT-BAT-C,5,86400,2,1,3830,3795,3830,-10,25,25,25,0 2019-09-06 22:19:23.366267 +0200 info main: #173 C MITPROHB rx msg h 964,-289,RT-BAT-C,5,86400,2,1,3830,3795,3830,-10,25,25,25,0 2019-09-06 22:21:57.344609 +0200 info main: #173 C MITPROHB rx msg h 964,-299,RT-BAT-C,5,86400,2,1,3830,3795,3830,-10,25,25,25,0 2019-09-06 22:23:40.082406 +0200 info main: #31 C MITPROHB rx msg h 964,-1027,RT-BAT-C,5,86400,2,1,3830,3795,3830,-10,25,25,25,0 2019-09-06 22:25:58.061883 +0200 info main: #31 C MITPROHB rx msg h 964,-1040,RT-BAT-C,5,86400,2,1,3830,3795,3830,-10,25,25,25,0
This shows the ticker was only run 299 times from 22:07:48 to 22:21:57.
After 22:21:57 the workaround was triggered and did a reconnect. Apparently during that network reinitialization of 103 seconds, the per second ticker was run 628 times.
That can't be catching up on the event queue, as that queue has only 20 slots. So something strange is going on here.
Any ideas?
Regards, Michael
Am 06.09.19 um 08:04 schrieb Michael Balzer: > Mark & anyone else running a V2 server, > > as most cars don't send history records, this also needs the change to the server I just pushed, i.e. server version 2.4.2. > > https://github.com/openvehicles/Open-Vehicle-Monitoring-System/commits/maste... > > Regards, > Michael > > > Am 05.09.19 um 19:55 schrieb Michael Balzer: >> I've pushed the nasty workaround: the v2 server checks for no RX over 15 minutes, then restarts the network (wifi & modem) as configured for autostart. >> >> Rolled out on my server in edge as 3.2.002-237-ge075f655. >> >> Please test. >> >> Regards, >> Michael >> >> >> Am 05.09.19 um 01:58 schrieb Mark Webb-Johnson: >>>> Mark, you can check your server logs for history messages with ridiculous time offsets: >>>> >>>> [sddexter@ns27 server]$ cat log-20190903 | egrep "rx msg h [0-9]+,-[0-9]{4}" | wc -l >>>> 455283 >>>> >>> >>> I checked my logs and see 12 vehicles showing this. But, 2 only show this for a debugcrash log (which is expected, I guess, if the time is not synced >>> at report time). I’ve got 4 cars with the offset > 10,000. >>> >>> Regards, Mark. >>> >>>> On 4 Sep 2019, at 4:45 AM, Michael Balzer <dexter@expeedo.de <mailto:dexter@expeedo.de>> wrote: >>>> >>>> Everyone, >>>> >>>> I've pushed a change that needs some testing. >>>> >>>> I had the issue myself now parking at a certain distance from my garage wifi AP, i.e. on the edge of "in", after wifi had been disconnected for some >>>> hours, and with the module still connected via modem. The wifi blob had been trying to connect to the AP for about two hours. >>>> >>>> As seen before, the module saw no error, just the server responses and commands stopped coming in. I noticed the default interface was still "st1" >>>> despite wifi having been disconnected and modem connected. The DNS was also still configured for my wifi network, and the interface seemed to have an >>>> IP address -- but wasn't pingable from the wifi network. >>>> >>>> A power cycle of the modem solved the issue without reboot. So the cause may be in the modem/ppp subsystem, or it may be related (in some weird way) >>>> to the default interface / DNS setup. >>>> >>>> More tests showed the default interface again/still got set by the wifi blob itself at some point, overriding our modem prioritization. The events we >>>> didn't handle up to now were "sta.connected" and "sta.lostip", so I added these, and the bug didn't show up again since then. That doesn't mean >>>> anything, so we need to test this. >>>> >>>> The default interface really shouldn't affect inbound packet routing of an established connection, but there always may be strange bugs lurking in >>>> those libs. >>>> >>>> The change also reimplements the wifi signal strength reading, as the tests also showed that still wasn't working well using the CSI callback. It now >>>> seems to be much more reliable. >>>> >>>> Please test & report. The single module will be hard to test, as the bug isn't reproducable easily, but you can still try if wifi / modem transitions >>>> work well. >>>> >>>> Mark, you can check your server logs for history messages with ridiculous time offsets: >>>> >>>> [sddexter@ns27 server]$ cat log-20190903 | egrep "rx msg h [0-9]+,-[0-9]{4}" | wc -l >>>> 455283 >>>> >>>> The bug now severely affects the V2 server performance, as the server is single threaded and doesn't scale very well to this kind of bulk data >>>> bursts, especially when coming from multiple modules in parallel. So we really need to solve this now. Slow reactions or connection drops from my >>>> server lately have been due to this bug. If this change doesn't solve it, we'll need to add some reboot trigger on "too many server v2 notification >>>> retransmissions" -- or maybe a modem power cycle will do, that wouldn't discard the data. >>>> >>>> Thanks, >>>> Michael >>>> >>>> >>>> Am 03.09.19 um 07:46 schrieb Mark Webb-Johnson: >>>>> No problem. We can hold. I won’t commit anything for the next few days (and agree to hold-off on Markos’s pull). Let me know when you are ready. >>>>> >>>>> Regards, Mark. >>>>> >>>>>> On 3 Sep 2019, at 1:58 AM, Michael Balzer <dexter@expeedo.de> wrote: >>>>>> >>>>>> Mark, please wait. >>>>>> >>>>>> I may just have found the cause for issue #241, or at least something I need to investigate before releasing. >>>>>> >>>>>> I need to dig into my logs first, and try something. >>>>>> >>>>>> Regards, >>>>>> Michael >>>>>> >>>>>> >>>>>> Am 02.09.19 um 12:23 schrieb Michael Balzer: >>>>>>> Nothing open from my side at the moment. >>>>>>> >>>>>>> I haven't had the time to look in to Markos pull request, but from a first check also think that's going too deep to be included in this release. >>>>>>> >>>>>>> Regards, >>>>>>> Michael >>>>>>> >>>>>>> >>>>>>> Am 02.09.19 um 04:15 schrieb Mark Webb-Johnson: >>>>>>>> I think it is well past time for a 3.2.003 release. Things seems table in edge (although some things only partially implemented). >>>>>>>> >>>>>>>> Anything people want to include at the last minute, or can we go ahead and build? >>>>>>>> >>>>>>>> Regards, Mark. >>>>>>>> >>>>>>>> _______________________________________________ >>>>>>>> OvmsDev mailing list >>>>>>>> OvmsDev@lists.openvehicles.com >>>>>>>> http://lists.openvehicles.com/mailman/listinfo/ovmsdev >>>>>> -- >>>>>> Michael Balzer * Helkenberger Weg 9 * D-58256 Ennepetal >>>>>> Fon 02333 / 833 5735 * Handy 0176 / 206 989 26 >>>>>> >>>>>> _______________________________________________ >>>>>> OvmsDev mailing list >>>>>> OvmsDev@lists.openvehicles.com >>>>>> http://lists.openvehicles.com/mailman/listinfo/ovmsdev >>>>> _______________________________________________ >>>>> OvmsDev mailing list >>>>> OvmsDev@lists.openvehicles.com >>>>> http://lists.openvehicles.com/mailman/listinfo/ovmsdev >>>> >>>> -- >>>> Michael Balzer * Helkenberger Weg 9 * D-58256 Ennepetal >>>> Fon 02333 / 833 5735 * Handy 0176 / 206 989 26 >>>> _______________________________________________ >>>> OvmsDev mailing list >>>> OvmsDev@lists.openvehicles.com <mailto:OvmsDev@lists.openvehicles.com> >>>> http://lists.openvehicles.com/mailman/listinfo/ovmsdev >>> >>> >>> _______________________________________________ >>> OvmsDev mailing list >>> OvmsDev@lists.openvehicles.com >>> http://lists.openvehicles.com/mailman/listinfo/ovmsdev >> >> -- >> Michael Balzer * Helkenberger Weg 9 * D-58256 Ennepetal >> Fon 02333 / 833 5735 * Handy 0176 / 206 989 26 >> >> _______________________________________________ >> OvmsDev mailing list >> OvmsDev@lists.openvehicles.com >> http://lists.openvehicles.com/mailman/listinfo/ovmsdev > > -- > Michael Balzer * Helkenberger Weg 9 * D-58256 Ennepetal > Fon 02333 / 833 5735 * Handy 0176 / 206 989 26 > > _______________________________________________ > OvmsDev mailing list > OvmsDev@lists.openvehicles.com > http://lists.openvehicles.com/mailman/listinfo/ovmsdev
-- Michael Balzer * Helkenberger Weg 9 * D-58256 Ennepetal Fon 02333 / 833 5735 * Handy 0176 / 206 989 26
_______________________________________________ OvmsDev mailing list OvmsDev@lists.openvehicles.com http://lists.openvehicles.com/mailman/listinfo/ovmsdev
-- Michael Balzer * Helkenberger Weg 9 * D-58256 Ennepetal Fon 02333 / 833 5735 * Handy 0176 / 206 989 26 _______________________________________________ OvmsDev mailing list OvmsDev@lists.openvehicles.com <mailto:OvmsDev@lists.openvehicles.com> http://lists.openvehicles.com/mailman/listinfo/ovmsdev
_______________________________________________ OvmsDev mailing list OvmsDev@lists.openvehicles.com http://lists.openvehicles.com/mailman/listinfo/ovmsdev
-- Michael Balzer * Helkenberger Weg 9 * D-58256 Ennepetal Fon 02333 / 833 5735 * Handy 0176 / 206 989 26
_______________________________________________ OvmsDev mailing list OvmsDev@lists.openvehicles.com http://lists.openvehicles.com/mailman/listinfo/ovmsdev
-- Michael Balzer * Helkenberger Weg 9 * D-58256 Ennepetal Fon 02333 / 833 5735 * Handy 0176 / 206 989 26 _______________________________________________ OvmsDev mailing list OvmsDev@lists.openvehicles.com <mailto:OvmsDev@lists.openvehicles.com> http://lists.openvehicles.com/mailman/listinfo/ovmsdev
_______________________________________________ OvmsDev mailing list OvmsDev@lists.openvehicles.com http://lists.openvehicles.com/mailman/listinfo/ovmsdev
-- Michael Balzer * Helkenberger Weg 9 * D-58256 Ennepetal Fon 02333 / 833 5735 * Handy 0176 / 206 989 26
participants (7)
-
 Bernd Geistert
 -
 Greg D.
 -
 Mark Webb-Johnson
 -
 Marko Juhanne
 -
 Michael Balzer
 -
 Nicholas Prefontaine
 -
 Stephen Casner