
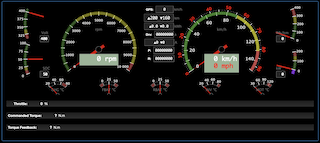
(I'm reposting because I had the impression that my message didn't get through. If it appears as a duplicate, please forgive me - and delete the double post if necessary. Still learning how to handle this delay between post and list visibility (moderation ?)) Hello List, I'm facing some reboots which looks like they are load-related (watchdog not triggered). I'll try to troubleshoot / diagnose it further but I thought it would be interesting to have your feedback on this. I'm currently tweaking a dashboard ; the idea is to have an in-vehicle display (WiFi-connected) showing a few important metrics to the driver (RPM / Speed / Voltage / SOC / multiple temperatures / range / controller status / BMS and cell status / ...) Don't know if images are OK in the list, here is a sample of the dashboard - you'll recognize the obvious lineage from the official OVMS dashboard: The metrics are coming from DBC analysis of the CAN bus traffic. For the tests I'm not in a vehicle, but am replaying CAN bus traffic and feeding it to OVMS (Not via the CAN play famework, as I still not had to time to look at https://github.com/openvehicles/Open-Vehicle-Monitoring-System-3/issues/747 in details, but via a local CAN bus). There are (approximately) : * 1 message repeating each 3ms (333Hz) * 10 messages that are occurring each 10ms (100Hz) * 5 messages that are spaced by 100ms (10Hz) * 3 messages each 500ms (2Hz) CAN bus speed is 250.000. Metrics are properly generated (from DBC), and properly displayed on the dashboard. However, the combination of the "intense" bus traffic, + number of generated metrics seems to be, in some way, overflowing the capacity of the WebSocketHandler, which results in a reboot from time to time:
W (5111095) websocket: WebSocketHandler[0x3f8d1654]: job queue overflow resolved, 14 drops W (5111095) websocket: WebSocketHandler[0x3f8d1654]: job queue overflow detected I (5111105) metrics: Modified metric v.g.current: 0A I (5111105) metrics: Modified metric v.m.rpm: 763 I (5111115) metrics: Modified metric v.i.temp: 34.1°C W (5111115) websocket: WebSocketHandler[0x3f8d1654]: job queue overflow detected W (5111125) websocket: WebSocketHandler[0x3f8d1654]: job queue overflow detected I (5111125) metrics: Modified metric v.m.rpm: 765 W (5111135) websocket: WebSocketHandler[0x3f8d1654]: job queue overflow detected I (5111145) metrics: Modified metric v.m.rpm: 758 W (5111145) websocket: WebSocketHandler[0x3f8d1654]: job queue overflow detected I (5111155) metrics: Modified metric v.m.rpm: 756 W (5111155) websocket: WebSocketHandler[0x3f8d1654]: job queue overflow resolved, 7 drops I (5111165) metrics: Modified metric v.m.rpm: 760 W (5111175) websocket: WebSocketHandler[0x3f8d1654]: job queue overflow resolved, 1 drops W (5111185) websocket: WebSocketHandler[0x3f8d1654]: job queue overflow E (5111845) task_wdt: Task watchdog got triggered. The following tasks did not reset the watchdog in time: E (5111845) task_wdt: - IDLE1 (CPU 1) E (5111845) task_wdt: Tasks currently running: E (5111845) task_wdt: CPU 0: wifi E (5111845) task_wdt: CPU 1: OVMS Console E (5111845) task_wdt: Aborting. abort() was called at PC 0x400e9920 on core 0
ELF file SHA256: 51b422e8c864d36f
Backtrace: 0x4008ddca:0x3ffb0690 0x4008e065:0x3ffb06b0 0x400e9920:0x3ffb06d0 0x40084176:0x3ffb06f0
Rebooting... ets Jul 29 2019 12:21:46
rst:0xc (SW_CPU_RESET),boot:0x1f (SPI_FAST_FLASH_BOOT) configsip: 0, SPIWP:0xee clk_drv:0x00,q_drv:0x00,d_drv:0x00,cs0_drv:0x00,hd_drv:0x00,wp_drv:0x00 mode:DIO, clock div:2 load:0x3fff0018,len:4 load:0x3fff001c,len:4796 load:0x40078000,len:0 load:0x40078000,len:14896 entry 0x40078d74 I (1068) psram: This chip is ESP32-D0WD I (1068) spiram: Found 64MBit SPI RAM device
Please note that the Lab setup has: * OVMS connected to the Lab network * The computer (displaying the dashboard) also connected to the Lab network (While, in the car, the computer / tablet would be directly connected to OVMS' wifi) That's it for the context, now a few questions: * As I don't know about the capabilities of the OVMS for CAN bus traffic analysis, does it looks like the number / frequency of messages I'm injecting is unreasonable ? * It seems like there is a buffering / consolidation of the metrics before sending them to the web socket ; is this tweakable in some way ? * Does the DBC processor add a significant processing time (compared to a dedicated vehicle module) when processing CAN data ? * What would be the best way to diagnose / confirm the health of the processes involved here ? * any similar use case / feedback from you ? Thanks for any feedback. Regards, Ludovic.